 | SIDLEY AUSTIN LLP 787 SEVENTH AVENUE (212) 839 5300 (212) 839 5599 FAX | BEIJING BOSTON BRUSSELS CHICAGO DALLAS FRANKFURT GENEVA | HONG KONG HOUSTON LONDON LOS ANGELES NEW YORK PALO ALTO SAN FRANCISCO | SHANGHAI SINGAPORE SYDNEY TOKYO WASHINGTON, D.C. | ||||||
| jcummins@sidley.com (212) 839-5374 | FOUNDED 1866 | |||||||||
July 16, 2013
Securities and Exchange Commission
Division of Corporation Finance
100 F Street, N.E.
Washington, DC 20549
Attn: Jay Ingram
Alfred Pavot
Tracey Smith
Asia Timmons-Pierce
| Re: | The New Home Company LLC | |
| Amendment No. 4 to the Registration Statement on Form S-1 | ||
| CIK No. 0001574596 |
Ladies and Gentlemen:
The New Home Company LLC (to be converted into a Delaware corporation prior to the completion of the offering to which the Registration Statement referred to below relates) (the “Company”) has today electronically transmitted, pursuant to Regulation S-T, Amendment No. 4 (“Amendment No. 4”) to the Registration Statement on Form S-1 (including exhibits thereto) of the Company (the “Registration Statement”) for filing under the Securities Act of 1933, as amended (the “Securities Act”). On behalf of the Company, we hereby respond to the comments of the staff (the “Staff”) of the Division of Corporation Finance of the Securities and Exchange Commission (the “Commission”) in a letter dated July 15, 2013 from Mr. Jay Ingram, Legal Branch Chief. For your convenience, the Staff’s comments are included in this letter and are followed by the applicable responses. We will also provide courtesy copies of Amendment No. 4 to the Registration Statement, as filed and marked to indicate the changes made from the filing of Amendment No. 3 to the Registration Statement with the Commission on July 11, 2013.
S-1/A#4 Draft
Management’s Discussion and Analysis of Financial Conditions and Results of Operation, page 61
Securities and Exchange Commission
Division of Corporation Finance
July 16, 2013
Page 2
| 1. | We note that you expect to recognize $2.7 million of stock compensation expense for the issuance of stock-based compensation in connection with your initial public offering, which is 59.6% of pro forma loss from operations for fiscal year 2012. Please expand your overview section to notify investors that you will be issuing stock-based compensation in connection with your initial public offering and subsequently in connection with your 2013 Long-Term Incentive Plan. Please also disclose the amount of compensation expense you expect to recognize for each year in which the stock-based compensation vests. |
Response: The requested changes have been made to pages 61 and 62.
Unaudited Pro Forma Consolidated Financial Statements, page F-2
Pro Forma Consolidated Balance Sheet, page F-3
| 2. | We note from your disclosures on pages 51 and 54 that you may increase or decrease the number of shares you will offer in your initial public offering. As such, please provide the disclosures required by Article 11-02(b)(8) of Regulation S-X for the different results that may occur. |
Response: The disclosures on pages 51, 53 and 54 indicating that the Company may increase or decrease the number of shares it will offer in the initial public offering have been deleted, and, as a result, the Company respectfully submits that disclosures pursuant to Article 11-02(b)(8) of Regulation S-X are not relevant.
| 3. | We note that the executive management team’s ownership interest will increase from 25% to 40.3% subsequent to the conversion of the registrant from an LLC to a Delaware corporation. We further note that you have not recognized an expense within retained earnings and did not disclose that this expense has been excluded from pro forma net loss before nonrecurring items. Please tell us what consideration you have given to recognizing the increase in ownership interest as compensation expense for the executive management team as a result of the conversion to a corporation. Please refer to Article 11-02(b)(5) of Regulation S-X for guidance regarding nonrecurring items. Further, we note your disclosure that the allocation of the aggregate 9,690,387 shares of common stock your current members will receive in connection with the conversion from an LLC to a Delaware corporation is variable depending on the initial public offering price. Please include a sensitivity analysis of the impact of a change in the initial public offering price in accordance with Article 11-02(b)(8) of Regulation S-X. |
Securities and Exchange Commission
Division of Corporation Finance
July 16, 2013
Page 3
We respectfully submit to the Staff that the increase in percentage ownership held by the executive management team subsequent to the conversion of the Company from a limited liability company to a corporation is directly attributable to the equity interest held by the executive management team in the Company through TNHC Partners LLC (“TNHCP”). This increase in percentage ownership is not attributable to their respective employment with the Company. Accordingly, the change in percentage ownership held by the executive management team does not have an impact on the pro forma results reported. This conclusion is supported by the Company’s analysis, which analysis is set forth in the memorandum attached as Exhibit A to this response letter. Based upon such analysis, the Company believes that the following key terms support its conclusion that the interests held by members of the executive management team in TNHCP is equity and should not be treated as compensation:
| • | The legal form of the equity interest issued to TNHCP is identical to the equity interest issued to the other members of the Company. |
| • | TNHCP has representation on the board of the Company equal to its economic interest. |
| • | The total amount of capital contributed by TNHCP was proportionate to its capital interest. |
| • | The economic allocation to TNHCP equity interests is not subordinated to the economic interests of other equity members nor is it tied to performance of a subset of the Company’s assets. |
| • | There is no vesting requirement for the TNHCP equity interests nor is it tied to the employment agreements of the respective executive officers. |
| • | Termination of employment by the Company, or by a respective executive officer, has no impact on the respective equity interests of the executive officers. For example, the CEO of the Company can choose to end his employment with the Company, or the Company may terminate its employment with the CEO, and the CEO would still retain his equity interest in TNHCP. |
As a result of the foregoing, a sensitivity analysis has not been included, as such an analysis would be predicated on the treatment of the foregoing as compensation. However, separately, we note that a sensitivity analysis has been included on page 185 of the Registration Statement. The correspondence submitted to the Staff in our letter dated July 11, 2013 illustrates that the number of shares to be received by our executive management team and the institutional investors, respectively, does not change from the low to the high end of the price range set forth on the cover page of the prospectus.
Pro Forma Consolidated Statements of Operations, page F-4
| 4. | We note that you have included the number of shares to be issued in this offering within pro forma shares outstanding for purposes of calculating pro forma loss per share. We further note that you will be using the proceeds from this offering for general corporate purposes (e.g., development of lots, home construction and other related purposes). In accordance with Article 11-02(b)(7) of Regulation S-X, please remove the shares offered in connection with your initial public offering from the earnings (loss) per share presentation. |
Response: The requested change has been made, and disclosure has been added in the new footnote 7, in accordance with the Staff’s comment.
Securities and Exchange Commission
Division of Corporation Finance
July 16, 2013
Page 4
Notes to Pro Forma Financial Statements, page F-6
| 5. | Please expand footnote (4) to provide investors with the specific calculations of the adjustment for the 92,220 restricted stock units by the corresponding vesting period of one to five years and the options for 541,111 shares of your common stock by the corresponding vesting period of one to five years. Please refer to Article 11-02(b)(6) of Regulation S-X for guidance. Please disclose the amount of unrecognized compensation expense that will be recognized over the remaining vesting periods. |
Response: The requested changes have been made on page F-6.
15. Unaudited Pro Forma Income (Loss) per Share, page F-31
| 6. | Please provide us with your calculations of the weighted-average shares for the conversion of members’ equity into shares of common stock of 9,690,387 for each period presented. |
Response: The calculations of the weighted-average shares for the conversion of members’ equity into shares of common stock are set forth on Exhibit B hereto. Please note that the Company has presented the calculations for the predecessor separately.
| 7. | Please expand your calculation to include the periods August 18, 2010 through December 31, 2010, and January 1, 2010 through August 17, 2010, as reference in your footnote disclosure. |
Response: The requested changes have been made on pages F-9 and F-32.
16. Subsequent Events, page F-32
| 8. | Please provide the disclosure required by ASC 855-10-50-1 for both your annual and interim periods presented. |
Response: The requested changes have been made on pages F-32 and F-43.
* * * * *
Securities and Exchange Commission
Division of Corporation Finance
July 16, 2013
Page 5
In addition to the foregoing, we are providing, as Exhibit C hereto, an updated version of the JBREC report submitted supplementally to the Staff with our letter dated June 14, 2013 in response to Comment No. 7 of the Staff’s letter dated May 15, 2013. In addition, we are also providing, as Exhibit D hereto, Amendment No. 1 to the Supplement to the Amended and Restated Limited Liability Company Agreement previously provided supplementally to the Staff with our letter dated June 26, 2013.
Thank you for your responsiveness in providing the comments in your letter dated July 15, 2013. We believe that the proposed modifications to the Registration Statement are responsive to such comments. The Company seeks to commence printing preliminary prospectuses and the marketing roadshow of its offering as soon as practicable. Please direct any further communications relating to this filing to the undersigned at (212) 839-5374.
| Very truly yours, |
| /s/ J. Gerard Cummins |
| J. Gerard Cummins |
| cc: | H. Lawrence Webb |
Edward F. Petrosky
Casey T. Fleck
Julian Kleindorfer
Exhibit A
[See attached]

Date: | July 16, 2013 | |
To: | Wayne Stelmar and The New Home Company LLC files | |
| cc: Peter Zofrea, EY Coordinating Partner | ||
From: | Mike Cunningham | |
Compensation Expense
Background
The New Home Company LLC (the “Company”), a Delaware limited liability company, and its subsidiaries are primarily engaged in all aspects of residential real estate development, including acquiring land and designing, constructing and selling homes located in California. The Company was formed with an effective date of August 26, 2009. The Company was capitalized through cash contributions by its sole member and holding company, TNHC Partners LLC (“TNHCP”) with the following structure:
| Pre – Transaction | ||||||||||||
Investor | Capital % | Economic % | Voting % | |||||||||
TNHCP | 100.0 | % | 100.0 | % | 100.0 | % | ||||||
TOTAL | 100.0 | % | 100.0 | % | 100.0 | % | ||||||
TNHCP is comprised of four individual equity holders, each of who are also executive officers of the Company.
Page 1 of 5
Effective August 18, 2010, the Company amended and restated its operating agreement (the “Agreement”) and concurrently admitted Watt/TNHC LLC (“Watt”) and IHP Capital Partners VI, LLC (“IHP”) as members. Watt and IHP each contributed cash of $6,000,000 in exchange for 33.33%, or 66.67% in total, of the outstanding capital interest, and 25% each, or 50% in total, of the outstanding economic/voting interest. The following was the structure of the Company:
| Pre – Transaction | Post – Transaction with Watt and IHP | |||||||||||||||||||||||
Investor | Capital % | Economic % | Voting % | Capital % | Economic % | Voting % | ||||||||||||||||||
TNHCP | 100.0 | % | 100.0 | % | 100.0 | % | 33.33 | % | 50.00 | % | 50.0 | % | ||||||||||||
IHP | — | — | — | 33.33 | % | 25.00 | % | 25.0 | % | |||||||||||||||
Watt | — | — | — | 33.33 | % | 25.00 | % | 25.0 | % | |||||||||||||||
TOTAL | 100.0 | % | 100.0 | % | 100.0 | % | 100.00 | % | 100.00 | % | 100.0 | % | ||||||||||||
Effective January 2011, the Company admitted TCN/TNHC LP (“Tricon”) as a member of the Company for a contribution of $6,600,000. As a result of this transaction, capital percentages were adjusted as following:
| Pre –Transaction with Tricon | Post – Transaction with Tricon | |||||||||||||||||||||||
Investor | Capital % | Economic % | Voting % | Capital % | Economic % | Voting % | ||||||||||||||||||
TNHCP | 33.33 | % | 50.0 | % | 50.0 | % | 25.00 | % | 50.0 | % | 50.0 | % | ||||||||||||
IHP | 33.33 | % | 25.0 | % | 25.0 | % | 25.00 | % | 16.67 | % | 16.67 | % | ||||||||||||
Watt | 33.33 | % | 25.0 | % | 25.0 | % | 25.00 | % | 16.67 | % | 16.67 | % | ||||||||||||
Tricon | — | — | — | 25.00 | % | 16.67 | % | 16.67 | % | |||||||||||||||
TOTAL | 100.0 | % | 100.0 | % | 100.0 | % | 100.00 | % | 100.0 | % | 100.0 | % | ||||||||||||
TNHCP, Watt, IHP, and Tricon are collectively referred to herein as the “Members”.
In accordance with Section 7 of the Agreement, distributions shall first be made to all Members pro rata in proportion to their unreturned capital commitments and then to all Members pro rata in proportion to their economic interest.
Page 2 of 5
Issues:
| 1) | TNHCP has a disproportionate economic interest when compared to its capital interest. Since the equity holders of TNHCP are also executive officers of the Company, should the Company recognize any compensation expense related to the disproportionate economic interest? |
Authoritative Guidance
Accounting Standards Codification 718, Share Based Payment, (“ASC 718”)
Ernst & Young Financial Reporting Developments (“FRD”) – Share Based Payment
Conclusion
Based on a review of the Company’s operating agreement and the employment agreements for the executive officers of the Company, who are also equity owners of TNHCP, we conclude that all economic allocations would be driven by equity ownership and are not related to employment. Accordingly, the Company should not recognize any compensation expense specific to the economic allocation of profits in accordance with the Agreement.
Reasons for Conclusions:
Response to Issue 1:
The CEO, CFO, COO, and CIO of the Company are also the equity holders of TNHCP, which owns a 25% capital interest and 50% economic interest in the Company. The above mentioned executive officers together own 100% of TNHCP.
ASC 718 defines share based compensation as awards issued to employees for services they provide to a company. The definition of shares includes instruments that represent a legal equity interest in a partnership, limited liability partnership, or limited liability company. Section S2.1.5.6 of EY FRD provides the following general factors to consider in determining whether the individual is a partner versus an employee:
| a. | Form of ownership — if the individual has made a contribution and signed a partnership agreement that will provide for an allocation in the profits and losses along with distributions, and the individual receives a K-1 for tax purposes, the arrangement may be more akin to a partner arrangement. Alternatively, employee classification may be appropriate if the individual’s amount of ownership is determined based upon providing a service or meeting a particular performance condition where the failure to meet either of these requirements will result in the partnership interest ceasing to exist. |
Page 3 of 5
| b. | Governance of the partnership — if the individual is part of a visible group that is known to have ultimate authority on the enterprise’s direction, then this is a general indicator of a partner. |
| c. | Funding participation — a partner is generally required to provide a fixed dollar amount based upon its percentage of ownership when capital is needed. |
In his 11 December 2006 speech at the 2006 AICPA National Conference on Current SEC and PCAOB Developments, Joseph Ucuzoglu, Professional Accounting Fellow, Office of the Chief Accountant, U.S. Securities and Exchange Commission, stated, “When making this [partner vs. employee] determination, all relevant features of the special class must be considered. There are no bright lines or litmus tests. When few if any assets underlie the special class, or the holder’s claim to those assets is heavily subordinated, the arrangement often has characteristics of a performance bonus or profit-sharing arrangement. Instruments that provide the holder with substantive voting rights and pari passu dividend rights are at times indicative of an equity interest. Consideration should also be given to any investment required, and any put and call rights that may limit the employee’s downside risk or provide for cash settlement.”
Based on a review of the Company’s operating agreement, we noted the following:
| • | The legal form of the equity interest issued to TNHCP is identical to those issued to the other equity Members of the Company. |
| • | TNHCP receives a K-1 from the Company for tax purposes. |
| • | TNHCP has representation on the board of the Company equal to its economic interest. |
| • | Terms of equity participation features such as capital and voting rights, distribution rights and liquidation rights are consistent amongst the Members. |
| • | The total amount of capital contribution by TNHCP was in pro-rata shares of its capital interest. |
| • | The economic allocation to TNHCP equity interests is not subordinated to the economic interests of other equity Members nor is it tied to performance to a subset of the Company assets. |
| • | TNHCP does not have any preferred transferability of its equity interest when compared to other equity partners. |
| • | There is no vesting requirement for the TNHCP equity interests nor is it tied to the employment agreements of the respective executive officers. |
Page 4 of 5
| • | Termination of employment by the Company, or by a respective executive officer, has no impact on their respective equity interest. For example, the CEO of the Company can choose to end his employment with the Company, or the Company may terminate the CEO, and the CEO would still retain his equity interest in TNHCP. |
| • | There are no put/call or other repurchase features attached specifically to TNHCP’s equity interest. IHP is the only investor whose shares do not contain transfer restrictions, but once IHP exercises its right to transfer shares without receiving the approval of other Members, the other Members’ shares become unrestricted. There is a call option at any time within three months after the occurrence of a Board of Managers Impasse or an Event of Default that allows the other Members to purchase the Member’s interests in the Company who had the impasse or default. This provision applies to all Members of the Company. |
Based on the above, we conclude that the economic allocation to TNHCP is identifiable with its equity interest and is not related to the employment of the Company’s executive officers.
Page 5 of 5
Exhibit B
[See attached]
The New Home Company Predecessor
Weighted Average Shares Outstanding Calculation
Period | Contributions | Conversion Ratio | Common Outstanding | Weighted Shares Outstanding @ 8/17/10 | ||||||||||||
9/17/2009 | (100,000 | ) | 0.1615 | 16,151 | 16,151 | |||||||||||
10/13/2009 | (100,000 | ) | 0.1615 | 16,151 | 16,151 | |||||||||||
10/22/2009 | (250,000 | ) | 0.1615 | 40,377 | 40,377 | |||||||||||
11/10/2009 | (100,000 | ) | 0.1615 | 16,151 | 16,151 | |||||||||||
11/24/2009 | (50,000 | ) | 0.1615 | 8,075 | 8,075 | |||||||||||
12/4/2009 | (100,000 | ) | 0.1615 | 16,151 | 16,151 | |||||||||||
12/14/2009 | (220,000 | ) | 0.1615 | 35,531 | 35,531 | |||||||||||
12/22/2009 | (5,060,000 | ) | 0.1615 | 817,223 | 817,223 | |||||||||||
12/31/2009 | 40,000 | 0.1615 | (6,460 | ) | (6,460 | ) | ||||||||||
|
| |||||||||||||||
Total | 959,348 | |||||||||||||||
|
| |||||||||||||||
The New Home Company LLC
Weighted Average Shares Outstanding Calculation
Period | Contributions | Conversion Ratio | Common Outstanding | Weighted Shares Outstanding at 12/31/10 | Weighted Shares Outstanding at 12/31/11 | Weighted Shares Outstanding at 12/31/12 | Weighted Shares Outstanding at 3/31/12 | Weighted Shares Outstanding at 3/31/13 | ||||||||||||||||||||||||
8/18/2010 | (11,940,000 | ) | 0.1615 | 1,928,387 | 1,928,387 | 1,928,387 | 1,928,387 | 1,928,387 | 1,928,387 | |||||||||||||||||||||||
9/15/2010 | (3,260,000 | ) | 0.1615 | 526,511 | 417,309 | 526,511 | 526,511 | 526,511 | 526,511 | |||||||||||||||||||||||
10/15/2010 | (2,800,000 | ) | 0.1615 | 452,218 | 257,932 | 452,218 | 452,218 | 452,218 | 452,218 | |||||||||||||||||||||||
12/15/2010 | (1,800,000 | ) | 0.1615 | 290,712 | 34,455 | 290,712 | 290,712 | 290,712 | 290,712 | |||||||||||||||||||||||
1/15/2011 | (2,600,000 | ) | 0.1615 | 419,917 | — | 402,660 | 419,917 | 419,917 | 419,917 | |||||||||||||||||||||||
5/15/2011 | (800,000 | ) | 0.1615 | 129,205 | — | 81,417 | 129,205 | 129,205 | 129,205 | |||||||||||||||||||||||
6/15/2011 | (800,000 | ) | 0.1615 | 129,205 | — | 70,443 | 129,205 | 129,205 | 129,205 | |||||||||||||||||||||||
9/15/2011 | (4,800,000 | ) | 0.1615 | 775,231 | — | 227,259 | 775,231 | 775,231 | 775,231 | |||||||||||||||||||||||
12/15/2011 | (1,000,000 | ) | 0.1615 | 161,506 | — | 7,080 | 161,506 | 161,506 | 161,506 | |||||||||||||||||||||||
4/15/2012 | (2,000,000 | ) | 0.1615 | 323,013 | — | — | 230,091 | — | 323,013 | |||||||||||||||||||||||
5/15/2012 | (5,000,000 | ) | 0.1615 | 807,532 | — | — | 508,856 | — | 807,532 | |||||||||||||||||||||||
6/15/2012 | (800,000 | ) | 0.1615 | 129,205 | — | — | 70,443 | — | 129,205 | |||||||||||||||||||||||
9/15/2012 | (800,000 | ) | 0.1615 | 129,205 | — | — | 37,877 | — | 129,205 | |||||||||||||||||||||||
2/15/2013 | (2,000,000 | ) | 0.1615 | 323,013 | — | — | — | — | 157,917 | |||||||||||||||||||||||
3/15/2013 | (9,600,000 | ) | 0.1615 | 1,550,462 | — | — | — | — | 275,638 | |||||||||||||||||||||||
4/15/2013 | (10,000,000 | ) | 0.1615 | 1,615,065 | — | — | — | — | — | |||||||||||||||||||||||
|
|
|
|
|
|
|
|
|
|
|
|
|
| |||||||||||||||||||
Total | (60,000,000 | ) | 9,690,387 | 2,638,082 | 3,986,687 | 5,660,159 | 4,812,892 | 6,635,403 | ||||||||||||||||||||||||
|
|
|
|
|
|
|
|
|
|
|
|
|
| |||||||||||||||||||
Exhibit C
[See attached]

Housiing Marrkett Overrviiew July 2013 Trusted Analysis for Executive Decisions Headquarters 16485 Laguna Canyon Road, Suite 130 Irvine, CA 92618 Tel: 949-870-1200 www.realestateconsulting.com Offices Irvine San Diego Sacramento Texas Florida New England Contact Information Don Walker Chris Porter President Manager (858) 558-8384 x154 (949) 870-1218 dwalker@realestateconsulting.com cporter@realestateconsulting.com John Burns Real Estate Consulting
Unless otherwise indicated, market data is derived from a market study prepared for us in connection with this offering by John Burns Real Estate Consulting, LLC (“JBREC”) based on the most recent data available as of July 2013. Founded in 2001, JBREC is an independent research provider and consulting firm focused on the housing industry. The following information contains forward-looking statements which are subject to uncertainty and you should review “Cautionary Note Concerning Forward-Looking Statements.”
This Market Opportunity section provides a review of the following:
Overview
| • | National Housing Market |
Selected Housing Markets
| • | Orange County |
| • | San Diego County |
| • | Ventura County |
| • | Los Angeles County |
| • | San Francisco Metropolitan Division |
| • | San Jose Metropolitan Statistical Area |
| • | Sacramento Metropolitan Statistical Area |
| • | Phoenix Metropolitan Statistical Area |
National Housing Market
The U.S. housing market continues to improve from the cyclical low points reached during the 2008 to 2009 national recession. Between the 2005 market peak and 2011, new single-family housing sales declined 76%, according to data compiled by the U.S. Census Bureau, and median home prices declined 34%, as measured by the S&P Case-Shiller Index. In 2011, early signs of a recovery began to materialize in many markets around the country as a result of an improving macroeconomic backdrop and favorable housing affordability. In the twelve months ended May 31, 2013, homebuilding permits increased 36% and the annual median single-family existing home price increased 11% year-over-year. Growth in new home sales has outpaced growth in existing home sales over the same period, increasing 29% versus 13% for existing homes, which rose, in part, due to foreclosure-related sales.
Historically, strong housing markets have been associated with very favorable affordability, a healthy domestic economy, positive demographic trends such as population growth and household formation, low mortgage rates, increases in renters that qualify as homebuyers, and locally based dynamics such as housing demand relative to housing supply. Many markets across the U.S. are exhibiting most of these positive characteristics. Relative to long-term historical averages, the U.S. economy is creating more jobs than homebuilding permits issued, the inventory of resale and new unsold homes is well below average, and affordability is near its best level in more than 30 years, as measured by the ratio of homeownership costs to household income.
Despite recent momentum, the U.S. housing market has not fully recovered from the 2008 to 2009 recession as mortgage underwriting standards have tightened and the number of delinquent homes remains elevated relative to historical averages. Additionally, real estate is a local industry and not all markets exhibit the same trends.
98
The U.S. housing market is in the beginning of phase three of a three-phase supply-constrained housing recovery, as described below:
| • | Phase 1—job growth begins. |
| • | Phase2—price appreciation occurs among low-priced homes in foreclosure, increasing resale prices to the point that purchasing a new home provides a good value compared to purchasing an existing home. Reduced resale inventory and great affordability are fueling a surge in demand for new homes in this recovery. |
| • | Phase 3—strong demand and limited supply lead to considerable price appreciation in land-constrained markets, and a resurgence in construction activity in markets with sufficient land supplies. Price appreciation allows discretionary buyers to sell their existing homes and potentially purchase a new home. |
While conditions are improving rapidly, significant future growth is required to return to pre-recession housing market conditions.
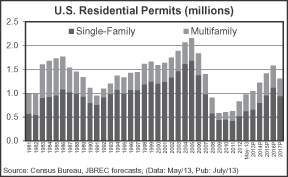
| • | Construction starts, as measured by the U.S. Census Bureau through May 2013, are at 1,020,000 units per year. This represents 53% of a recovery to a level of 1.5 million annual starts, which is comparable to housing starts in the year 2000, a period that is reflective of a more stable market. Permits issued through May 2013 are more than twice the level of the low of 478,000 annual starts in April 2009. |
| • | Existing home sales, as measured by the National Association of Realtors, are at 4,970,000 annualized transactions through May 2013, which is in line with what JBREC estimates to be a stable level based on a ratio of existing home sales activity per household during the late 1980s and 1990s, when the housing market was in a more balanced environment and many economic variables were near historical averages. Existing home sales had fallen to an annualized rate of 3,300,000 transactions in July 2010. |
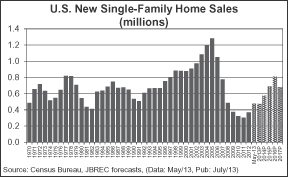
| • | New home sales are at 476,000 annualized transactions through May 2013, as measured by the U.S. Census Bureau, representing 30% of a recovery to a level of 800,000 annual transactions, which JBREC estimates to be a stable level based on new home sales activity during the late 1990s, when the housing market was in a more balanced environment and many economic variables were near historical averages. New home sales had fallen to 273,000 annualized transactions in February 2011. |
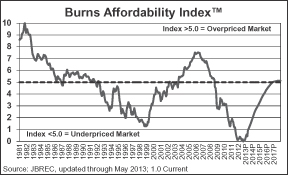
| • | Home affordability for the nation reached its most favorable levels during the housing downturn as prices and mortgage rates declined. A combination of rising prices and mortgage rates is likely to increase the cost of housing relative to incomes for U.S. homebuyers over the next five years, bringing affordability measures closer to the historical median level measured from 1981 to 2012. |
Demand. Job growth is the most important factor for a healthy housing market. While year-over-year job growth is once again positive after significant losses from 2008 through 2010, recent growth has moderated amidst fiscal uncertainty. Additionally, the rate of job growth in economic recoveries has slowed over the last 30 years, primarily as a result of the aging U.S. labor force, productivity improvements and globalization. JBREC assumes that job growth will grow at a 1.6% compound annual rate from 2013 through 2017, ramping up in 2015 and 2016, and slowing in 2017. | 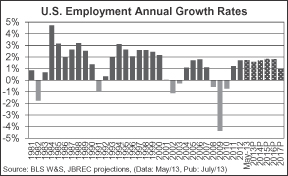 | |
| By the end of 2014, the economy is expected to have recovered all of the 7.7 million jobs lost between 2008 and 2010. | ||
99
The average employment growth to homebuilding permit ratio for the country was 2.3 as of May 31, 2013. A balanced ratio in a stable market is 1.2 to 1.3. This ratio has been above a stable market ratio for several quarters, due to a rise in employment growth coupled with historically low homebuilding permit levels. Eventually, the relative excess job growth to homebuilding permit growth should lead to improving consumer confidence and new home sales, which will drive increased construction activity.
Household formations are expected to average 1.36 million per year through 2017, based on population growth that averages 0.9% per year and headship rates (which is the percentage of people in an age group that head a household) that return to levels that are more consistent with historical trends by 2025. The reduction in headship rates for nearly all age groups from 2000 to 2010 was caused primarily by the economic distress in the late 2000s. Immigration is expected to add to the household and population growth as well, occurring at approximately 0.3% per year, and mostly concentrated in the 20 to 40 year old demographic.
A lack of inventory is limiting sales activity in the existing home market, but sales are expected to grow through 2016, in part, due to continued investor activity. After decreasing to 4.1 million transactions in 2008 from a peak of nearly 7.1 million transactions three years prior, existing home sales transactions are currently at 4.97 million, hampered by a large decrease in the supply of homes on the market. JBREC forecasts that sales will rise to 5.5 million transactions in 2016, which would be slightly higher than the sales activity in 2001, and will decline in 2017 when mortgage rates are assumed to exceed 5.5% and the economy is assumed to slow. The share of sales that were for investment purposes rose to 30% in the first quarter of 2013, which was the highest rate on record. An elevated share of distressed sales is expected to keep investor activity above normal levels in the near term. Many investors are converting distressed inventory to rentals for a long-term hold, which is aiding the recovery process as they are removing marginal inventory that otherwise depresses prices.
The projected slow but steady job growth should support absorption of the rising new home supply, which is coming off historical lows. New home sales transactions reached a trough in 2011 at 273,000 homes sold, and are forecasted to rise steadily to 810,400 sales in 2016—a level last reached in pre-boom 1997 and slightly higher than 2007. The new home market currently has only 161,000 units of completed supply, which is near the lowest level in more than 30 years, and JBREC expects construction levels to increase as the price of housing rebounds.
Supply. JBREC is forecasting measurable improvement in new residential construction activity. Activity should steadily increase through 2016 at a rate that slightly exceeds the recovery in past regional downturns, such as what happened in Houston in the late-1980s and Southern California in the late-1990s. With prices rising, and certain submarkets stabilized, homebuilder demand for lots is increasing substantially.
Very little entitlement processing took place during the housing correction, so the supply of finished, or even |
| |
| approved lots, is very tight today. There will be a lag in the delivery of new lot supply, especially in markets with a prolonged approvals process, such as California. In many metro areas, lot prices are quickly approaching peak values as demand exceeds supply. | ||
100
The number of existing homes available for sale (not including “shadow inventory,” which is the number of homes with a mortgage that are in some form of distress but that are not currently for sale) continues its general downward trend after peaking in 2007. As of May 31, 2013, there were 5.1 months of inventory supply on the market, which is well below the peak level and below the average of 7.2 months of supply over the past 30 years.
The excess of vacant homes in the United States has been entirely cleared over the last year, according to JBREC. The vacant housing inventory had accumulated during the correction as investors and second-home buyers purchased homes for profit and personal use, and again as the severe recession significantly reduced household formations. Household growth has outpaced construction and housing vacancy has stabilized nationally, although this varies by local market.
While the number of homes entering the foreclosure process is declining, the overall volume is still quite high relative to historical levels. Approximately 10.8% of all mortgages are delinquent as of the first quarter of 2013—nearly twice the pre-2008 level. The shadow inventory is still substantial. This supply is likely to be sold or liquidated over the next several years. JBREC believes that banks will dispose of many of these distressed loans through either short sales or foreclosures and will do so at a moderate rate so as to limit the downward pressure on home prices resulting from the liquidation. One risk is that banks change their philosophy and decide to dispose of these distressed loans at a more rapid pace.
The media has made much of the distress in the market, focusing on the homes that are in some form of delinquency or foreclosure. However, only 9% of the total housing units in the United States have some sort of distress; the remaining 91% do not, as estimated by JBREC.
Affordability. Affordability in the existing home market is at historically favorable levels nationally, looking back over the last 30 years. The ratio of annual housing costs (which are mortgage payments plus a portion of the down payment) for the median-priced resale home to the median household income is near an all-time low, dating back to 1981. Due to rising mortgage rates coupled with expected home price appreciation, affordability conditions nationally are expected to weaken gradually in the coming years, reaching their historical median levels in 2016. While affordability conditions vary by market, most markets have experienced their most favorable historical affordability during this cycle.
Home values are trending up, and the combination of low mortgage rates, a declining percentage of distressed sales, and low inventory levels are expected to drive rising home values. JBREC estimates national home values appreciated by approximately 5.2% during the twelve months ended May 31, 2013, and forecasts national appreciation of 9.1% in 2013 and 7.6% in 2014, slowing to 0.8% by 2017. Many factors can influence this outlook. Purchases by the Federal Reserve of mortgage-backed securities cause JBREC to believe that the Federal Reserve would like to see home prices rise. |
|
Increasing home price appreciation will be supported by low mortgage rates, which remain historically favorable and are expected to remain low in the near term due to low inflation and global economic uncertainty.
101
JBREC assumes that average 30-year fixed mortgage rates will rise gradually to 5.7% by 2017, as increasing inflation and an improving economy drive rates higher after this period of very low inflation. This assumption has a very high level of risk as interest rates can change quickly.
There is a strong case for solid price appreciation:
| • | Demand—demand is growing much faster than the new home supply being added to the market, which is helping to reduce the excess existing supply in the market. With a lower level of excess supply, prices will rise as there will be multiple buyers for every house on the market for sale. |
| • | Affordability—the most favorable affordability in decades will make it easier for buyers to pay higher prices for homes. |
| • | Investment—hard assets, such as real estate, are broadly considered an inflation hedge, and many investors will focus on inflation once the current deflation concerns subside. International investors sense a fantastic opportunity to buy U.S. real estate, partially thanks to favorable exchange rates. Also, large institutional investors as well as local investment groups see a great opportunity to buy homes at below replacement cost or below the historical price/income ratio, and have been driving prices up. |
The Bear Case. While the fundamentals are in place for a recovery in the housing market, there are a number of factors that are slowing the recovery, including the following.
| • | The market is experiencing a low level of activity from entry-level buyers due to a lack of savings, challenges with back-end debt-to-income ratios and credit, and uncertainty about the housing market and the economy. |
| • | A low level of home purchases by current homeowners is occurring due to the high loan-to-value ratios of many existing homeowners. |
| • | The economy could still experience slow and volatile growth in the years to come, and even a recession. Recessions caused by excess leverage, such as the recent recession, usually resolve over many years and the path is typically very volatile. |
| • | A large number of mortgaged homes will continue to go through the foreclosure process and will be sold under duress. |
| • | Mortgage rates could rise. |
| • | The implementation of qualified mortgage and qualified residential mortgage rules proposed in the Dodd Frank Wall Street Reform and Consumer Protection Act could make mortgages more difficult to obtain. The recent qualified mortgage definition recommended a 43% backend debt-to-income ratio, which is generally more accommodative than the early 1990s. |
| • | Development and building costs are rising, which could negatively impact homebuilder margins. |
In addition, the government deficit is substantial, and the United States will be subject to further credit rating downgrades until political leadership develops and executes a plan to address the deficit. A lack of fiscal accountability could cause U.S. economic problems for years to come.
Conclusion. In summary, housing is a risky asset class, but JBREC believes the outlook for the housing market is very favorable as a result of several factors, including the following:
| • | Demand is strong.The number of adults finding employment is exceeding new home supply by a ratio of 2.3 to 1. |
| • | Supply is low.Resale inventory is well below the historical average months of supply, new home inventory is near an all-time low, and new construction is well below historical averages. |
| • | Affordability is historically favorable.With mortgage rates at 4.5% as of early July 2013, and home prices in many markets back to levels last seen in 2003-2004, homeownership is an attractive financial option. |
102
JBREC forecasts that the excesses of the recent downturn will clear and that home prices and construction will increase for the foreseeable future.
The following table provides a summary of actual economic data and estimates, forecasts and projections for the eight primary markets for the most recent data available as of July 2013.
| Forecasted 2013 Home Value Appreciation(1) | Data: Twelve months ended May 31, 2013 | |||||||||||||||||||
Market | Job Growth | Permits | Job Growth / Permit Ratio | Months of Resale Supply(2) | ||||||||||||||||
Orange County | 13.7 | % | 24,500 | 6,662 | 3.7 | 2.3 | ||||||||||||||
San Diego | 13.78 | % | 20,300 | 6,720 | 3.0 | 2.5 | ||||||||||||||
Ventura | 13.5 | % | 4,300 | 614 | 7.0 | 2.8 | ||||||||||||||
Los Angeles | 9.0 | % | 44,100 | 11,960 | 3.7 | 2.8 | ||||||||||||||
San Francisco | 14.4 | % | 25,300 | 6,099 | 4.1 | 2.8 | ||||||||||||||
San Jose | 15.9 | % | 26,400 | 6,201 | 4.3 | 2.2 | ||||||||||||||
Sacramento | 16.5 | % | 7,100 | 4,123 | 1.7 | 1.2 | ||||||||||||||
Phoenix | 19.6 | % | 47,200 | 17,563 | 2.7 | 2.7 | ||||||||||||||
| (1) | This information is contained in the market study provided to us by JBREC and is based upon various assumptions and forward-looking estimates. Actual results may differ materially from this forecast. |
| (2) | Estimated months of supply as of May 31, 2013. |
103
Orange County, CA Housing Market Overview
Orange County, California, also referred to as the Santa Ana-Anaheim-Irvine metropolitan division, is a part of a single MSA which consists of Los Angeles and Orange Counties together. Orange County has over 3.1 million people and 1.0 million households, making it the third-most populous county in California. Considered to be a set of suburban commuter cities several decades ago, Orange County now has its own vibrant economy and employment centers, and stands on its own identity as a mature community and culture independent of the larger Los Angeles County to its north. Because of its coastal location and its status as a thriving employment center, Orange County is a “first choice” region for housing within the greater Southern California real estate market.
| ||
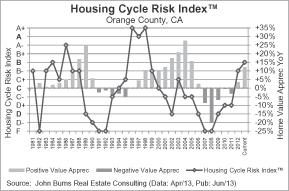
The housing fundamentals of Orange County have shown considerable improvement in recent years, which is a positive sign for home price appreciation in this market, indicating a recovery from the recession of the last few years. The John Burns Real Estate Consulting Housing Cycle Risk Index measures the health of the housing market based on the performance of 24 market fundamentals in relation to their own history, and has historically been a one- to three-year leading indicator for home price appreciation. The improvement in the overall fundamentals is the result of improving job growth, low supply, good affordability, and the turning of the business cycle. The affordability fundamentals are good, with prices having bottomed at levels last seen in 2003 and 2004, at the same time that low mortgage rates are at 4.5% as of early July 2013. The combination of prices being below peak and historically low mortgage rates continue to provide a good buying opportunity.
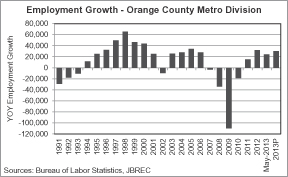
There are 1.4 million non-farm payroll jobs in Orange County, and employment growth has been positive since 2011 after job losses in 2007 through 2010. The metro area lost 165,200 jobs (10.9%) from the 2006 peak before adding a combined 75,200 jobs (5.6% growth) from 2011 through May 2013. JBREC expects employment growth of 30,000 jobs (2.1%) in 2013.
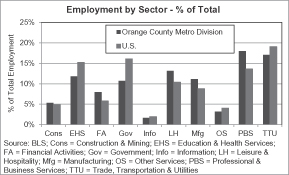
Although the area is famous for its vacation destinations such as Disneyland and Knott’s Berry Farm, employment in Orange County is distributed over many industries and sectors. The largest employment sector is the high-paying Professional Business Services (18.0% of jobs) sector, followed by the Trade, Transportation & Utilities (17.1%) sector. Leisure and Hospitality (13.1%), Educational and Health Services |
| |
| (11.8%), Manufacturing (11.1%) and Government (10.7%) follow in size. While Disney is indeed the county’s largest employer, the next three places are held by the University of California, Irvine; St. Joseph’s Health; and Boeing. The headquarters of several Fortune 500 companies are in Orange County, including Ingram Micro and First American in Santa Ana, Western Digital in Lake Forest, and Pacific Life in Newport Beach. The city of Irvine is the home of Allergan, Broadcom, Standard Pacific and Gateway. The Asian-based automobile and electronics companies Mazda, Toshiba, Toyota, Samsung, Kia, Mitsubishi and Hyundai all have regional or national headquarters in Orange County. | ||
104
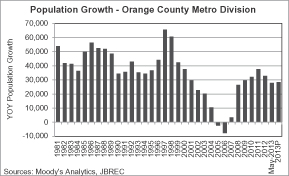
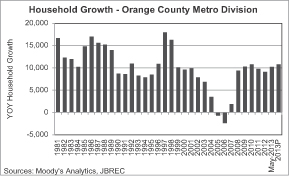
While Orange County lost 0.4% of its population in 2005 and 2006, it has gained population every year since then, adding a total of 186,600 people (6.4%) from 2007 through May 2013. JBREC assumes population growth of 28,400 people (0.9% growth) and household growth of 10,800 (1.1% growth) in 2013.
 |  |
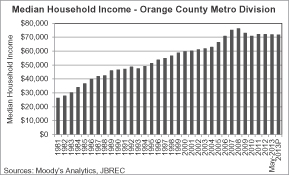
As of May 2013, the median household income in Orange County was $71,803, having peaked in 2008 at $76,181. Notably, Orange County median household income is well above the corresponding figure of $53,728 for Los Angeles County, showing the prevalence of higher-income jobs, many of them professional, in Orange County. JBREC expects income growth will be relatively flat for Orange County in 2013.
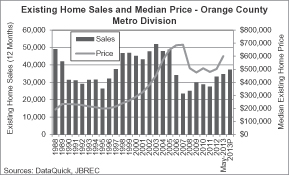
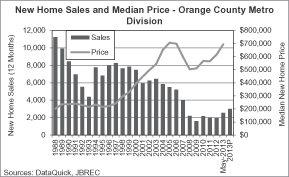
Existing home sales in Orange County are rising after dipping in 2011. In the twelve months ended May 31, 2013, existing home sales for the area increased to 34,768, up 48% from the trough of 2007. Existing home sales levels are still well below the peak level of 52,000 in 2003. Home prices have increased sharply in Orange County. The median existing single-family detached home price declined 31% between 2007 and 2009, due in part to a shift in sales activity away from the higher price points and a loss in value. The strength of the Orange County economy is seen in the fact that this decline was less than the corresponding drop of 41% in Los Angeles County. As of May 2013, the median price for existing single-family detached homes was $600,000, up from $495,000 in May 2012 and above the 2004 median price level of $570,000, but still below the median price for 2005.
New home sales activity for the twelve months ended May 31, 2013 has risen from the trough levels of 2009, but remains low for this market. New home sales transactions totaled 2,531 for the twelve months ended May 31, 2013, well below the peak of 6,436 in 2003. JBREC expects the new home sales volume to increase to 3,000 transactions in 2013. The median new home price is once again rising after declining from the peak level in 2005. As of May 2013, the median new home price was $694,250, which is up 14.8% from May 2012, but still down slightly from its top of $706,500 in 2005. The median new home price can be heavily influenced by the mix of home types being sold at any given time, and should not be relied upon as the only indicator of market trends. |
| |
105
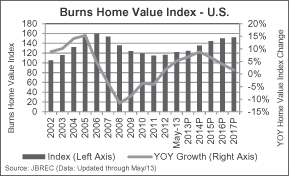
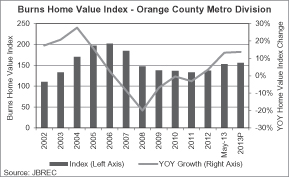
Home values in Orange County are poised for continued positive growth in 2013, according to JBREC. The Burns Home Value Index provides an estimate of home value trends in an MSA, based on an “electronic appraisal” of every home in the market, rather than just the small sample of homes that are actually transacting. JBREC forecasts home values to rise by 13.7% in 2013, after rising 13.3% during the twelve months ended May 31, 2013.
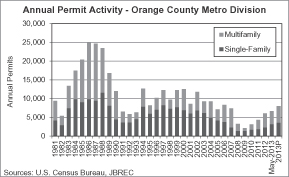
Homebuilding permit activity in Orange County continues to increase from its lowest levels in decades, with the mix of permits issued gradually moving toward multi-family housing as the county “fills up” and available land slowly decreases. While JBREC forecasts that much of the growth in the housing inventory in 2013 will be for multifamily units, single-family construction is also expected to rebound from trough levels during the downturn in housing. Single-family homebuilding permits had fallen to 1,330 units in 2008, but rose to 3,123 over the twelve months ended May 31, 2013. Multifamily permits totaled 3,539 over the twelve months ended May 31, 2013 and are projected to rise to 4,500 in 2013. The potential exists for a significant increase in homebuilding permit activity in Orange County over the next decade due to a number of large, restructured investments such as: Heritage Fields at the former El Toro Marine Corps Air Station; the former Tustin Marine Corps Air Station; Baker Ranch; Rancho Mission Viejo; and the Irvine Ranch.
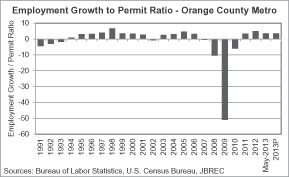
The demand being generated for housing is greater than the new supply being added to the market, with job growth in 2012 nearly five times the number of homebuilding permits issued in that same time. The employment growth to homebuilding permit ratio as of May 2013 was 3.7 and that ratio is expected to remain relatively steady for 2013 due to strong job growth.
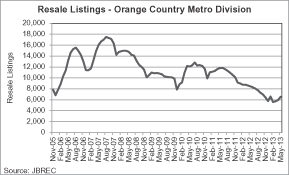
Resale listings in Orange County are low, which could lead to more competitiveness and increasing prices in the resale market. Through May 2013, the county had 6,550 homes listed on the market, which represented a 23% decline from one year prior and a 46% drop from 2010. By comparison, listings exceeded 17,000 homes on the market in some months of 2007. The level of listings as of May 2013 translates to a very low 2.3 months of supply, based on existing home |
| |
| sales activity over the most recent twelve months. A 6.0 month supply is considered equilibrium for most markets. The May 2013 inventory level is well below the peak level of 8.9 months of supply in 2008. | ||
106
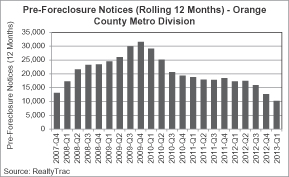
Pre-foreclosure notices are declining in Orange County, which is a positive sign for home prices, as pre-foreclosure notices are an indicator of future distress. In the twelve months ended March 31, 2013, approximately 10,200 notices were issued, representing a 41% decline from one year prior and a 68% decline from the peak in 2009.
While the number of homes falling into pre-foreclosure is declining, there is a moderate level of potential distressed homes that are not yet on the market and may limit upward movement for home prices. JBREC estimated the shadow inventory as of March 31, 2013 at 15,400, or about 5.0 months of supply. The shadow inventory is approximately two times the very low level of listings that are on the market. JBREC believes that most shadow inventory homes will gradually become distressed sales over the next few years, and the pace of distressed sales will be slow enough that home prices will not be significantly negatively affected.
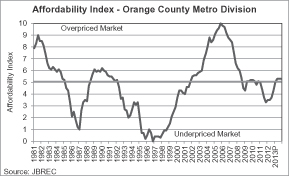
When comparing the monthly costs of owning the median-priced home with the median household income, |
| |
| affordability conditions are slightly better than the historical median affordability conditions in the Orange County metro division. JBREC’s Affordability Index takes into consideration the change in mortgage rates over time in its estimate of the ownership costs, which can significantly impact the monthly payment. JBREC forecasts affordability conditions in Orange County will weaken further in 2013 as home prices and mortgage rates are expected to rise. | ||
In summary, the housing fundamentals in Orange County are solid. Job growth is positive for housing demand in this market, particularly as job growth outpaces the supply of new homes being added to the market. Low levels of existing home listings are creating a more competitive resale market, which should influence future home price appreciation. Prices are at low levels not seen since 2004, in a time when mortgage rates are also low. The combination of relatively low prices and low mortgage rates in a county of high-income jobs suggests a continued rebound in the form of rising construction activity and home prices.
107
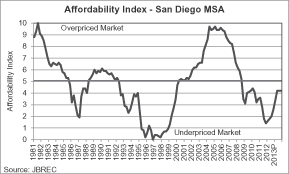
San Diego, CA Housing Market Overview
The San Diego-Carlsbad-San Marcos, California MSA consists of San Diego County. San Diego is the second-most populous county in the State of California, with over 3.2 million people and more than 1.1 million households, which is slightly larger than neighboring Orange County. The coastal county is known for its defense/military bases, high-tech industry, and tourism, as well as manufacturing and research. The majority of demand for housing is generated by growth in the region’s diverse economy, but San Diego has also attracted certain affluent second-home buyers and retirees for quality of life reasons. | ||
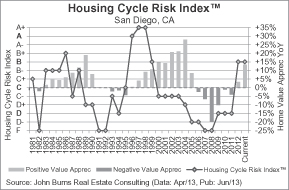
The housing fundamentals in San Diego are improving, which is a positive sign for price appreciation in this market. The John Burns Real Estate Consulting Housing Cycle Risk Index measures the health of the housing market based on the performance of 24 market fundamentals in relation to their own history, and has historically been a one- to three-year leading indicator for home price appreciation. The overall housing market fundamentals grade has improved since 2008, as the demand, supply and affordability fundamentals have all improved in this market. The risk of a substantial oversupply of residential lots and homes in this MSA are reduced relative to most other markets in the country due to a very difficult entitlement process in which it can take several years to convert a raw property into entitled and finished residential lots.
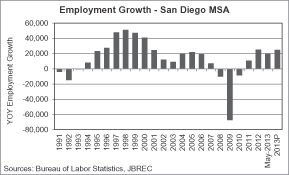
San Diego has a payroll employment level of nearly 1.3 million workers, and job growth has returning to the market after witnessing a decrease in employment of 6.6% between 2008 and 2010. On a percentage basis, the San Diego metro area witnessed the smallest decrease in employment of the Southern California metro areas. The metro area has added 59,800 jobs (4.9% growth) since 2011, and JBREC assumes job growth of 25,000 (2.0%) in 2013.
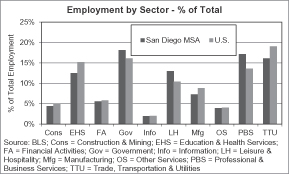
Defense/military has a large presence in San Diego’s employment, including the largest naval fleet in the world. The county is also home to a large number of research and manufacturing businesses, particularly in the wireless and biotechnology sectors, and is home to two Fortune 500 companies (Qualcomm and Sempra Energy). The Government sector is the county’s |
| |
| largest, accounting for 18.1% of employment, The Professional and Business Services sector is nearly equal in size, accounting for 17.2% of jobs, and is generally considered to be a high-income employment sector. The Trade, Transportation and Utilities sector comprises 16.1% of employment. Compared to the nation, San Diego has a higher concentration of jobs in the Professional and Business Services, Leisure and Hospitality, and Government sectors. | ||
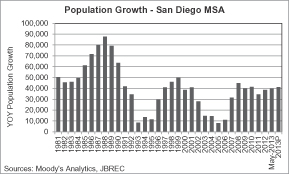
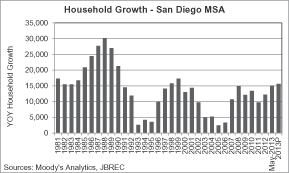
Population and household growth in San Diego have rebounded after slowing in the early- to mid-2000s. From 2008 to 2012, population growth averaged 39,900 people (1.3%) per year and household growth averaged
108
12,500 (1.2%) per year. JBREC assumes population growth of 41,300 people (1.3% growth) and household growth of 15,600 households (1.4% growth) in 2013.
 |  |
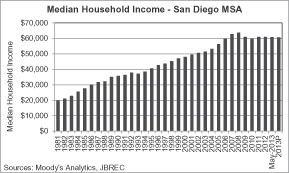
As of May 2013, the median household income in San Diego was $60,709, which is higher than the national average. After peaking above $63,500 in 2008, the median household income in San Diego declined in 2009 and 2010. JBREC assumes income levels will remain relatively flat in 2013.
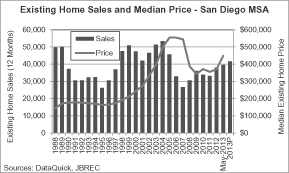
San Diego’s existing home sales are improving. In the twelve months ended May 31, 2013, sales had reached 39,655 transactions, representing an increase of more than 48% from the 2007 market trough of 26,715. The federal and state tax credits, as well as increased levels of distressed sales, helped to boost sales in 2008 and 2009. Sales slowed in 2010 and 2011 as the tax credits began to expire and the number of homes on the market began to decline, but sales are rising once again. Resale prices had witnessed strong appreciation from the late 1990s through 2005, but remained essentially flat in 2006 and decreased from 2007 through 2009. The median price in San Diego declined 38% from the peak in 2005 to the trough in 2009, due in part to a shift in sales activity away from the higher price points and a loss in value. Home prices are now rising rapidly.
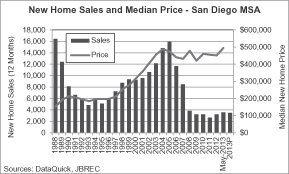
San Diego’s new home sales activity is steadily increasing from trough levels in 2011, but the increase is expected to accelerate as both demand and supply return to the market. New home sales totaled 3,581 in the twelve months ended May 31, 2013, and JBREC forecasts 3,500 transactions in 2013, which is still low in comparison to historical levels for this market. The median new home price was the highest it had ever been in May 2013 at $495,000. However, new home prices should not be relied upon as the only indicator of market trends, as they can be heavily influenced by the mix of home types being sold at any given time. Resale home prices are a better indication of market trends. |
| |
109
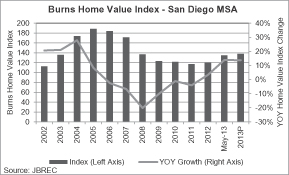
Home values in the San Diego MSA are rebounding, and are poised for continued positive growth in 2013, according to the Burns Home Value Index. The index shows that San Diego home values appreciated 14.0% during the twelve months ended May 31, 2103, following six years of declining values from 2006 through 2011. JBREC forecasts home values to rise 13.7% in 2013.
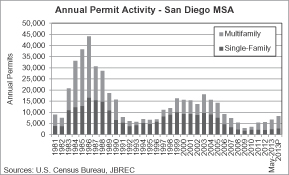
Homebuilding permit activity in San Diego is rising from its lowest levels in decades, but for the twelve months ended May 31, 2013 levels were approximately one-third of the highest level during the early 2000s. The trough of the market for construction activity occurred in 2009 at just under 3,000 total homebuilding permits, which was less than 7% of the peak permit level in the county in 1986. During the twelve months ended May 31, 2013, San Diego issued 6,720 homebuilding permits, which is much lower than the demand generated by the recent improvement in employment growth. Over the 30-year period from 1983 through May 2013, 52% of the homebuilding permits issued were for single-family homes. During the twelve months ended May 31, 2013, 37% of the homebuilding permits issued were for single-family homes. This shift is due to a lack of land zoned for traditional single-family detached homes and a resulting increase in the share of infill, attached housing.
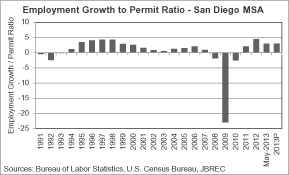
The demand being generated for housing is greater than the new supply being added to the market, with job growth in the twelve months ended May 31, 2013 higher than the number of homebuilding permits issued in that same time. The employment growth to homebuilding permit ratio was 3.0 in May 2013, as compared to the 1.3 average employment growth to homebuilding permit ratio for the market from 1981 through 2012, and is expected to remain high in 2013.
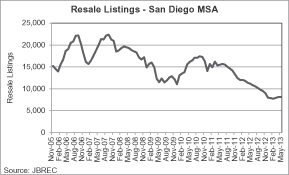
Resale listings in San Diego are low, causing the resale market to become more competitive and leading to increases in prices. As of May 2013, San Diego had 8,120 homes listed on the market, which represented a decline of 27% from the prior year. In late 2006 and again in late 2007, listings surpassed 22,000 homes on the market. The level of listings as of May 2013 equated to 2.5 months of supply, based on existing home sales activity over the prior twelve months. This represents a significant decrease from the more than nine months of supply in 2008. |
| |
110
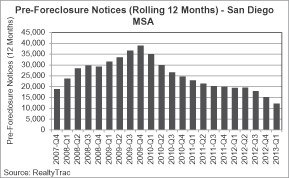
In addition to the decline in listings, pre-foreclosure notices have been trending downward, which is a positive sign for home prices in the San Diego market. Pre-foreclosure notices are an indicator of future home sales that will be distressed sales. In the twelve months ended March 31, 2013, just over 12,000 pre-foreclosure notices had been issued, representing a 38% decline from the prior year and a 69% decline from the peak in 2009.
While the level of future distressed home sales is generally declining, there remains a moderate level of distressed homes that are not yet on the market that will act to limit rapid appreciation of home prices. As of March 31, 2013, the shadow inventory amounted to an estimated 17,900 homes, or 5.0 months of supply. This is approximately two times the level of listings that were on the market at that time. JBREC believes that most shadow inventory homes in San Diego will gradually become distressed sales over the next few years, and the pace of distressed sales will be slow enough that home prices will not be significantly negatively affected. |
| |
When comparing the monthly costs of owning the median-priced home with the median household income, through May 31, 2013, affordability in San Diego is better than the area’s historical median dating back to 1981. Affordability conditions are expected to worsen in 2013 as home prices and mortgage rates are expected to rise. | ||
In summary, San Diego’s housing fundamentals are solid. Job growth exceeds the area’s new construction levels, and listings are low. As the fundamentals that drive the San Diego housing market reflect a more stable environment, the market is on track to return to solid price appreciation and rising construction.
111
Ventura, CA Housing Market Overview
The Ventura MSA, also referred to as the Oxnard-Thousand Oaks-Ventura MSA, consists of Ventura County. The county is home to nearly 844,000 people and more than 278,000 households. The coastal county has a rich history, while simultaneously providing amenities found in much more urban settings. Although Ventura lives in the large shadow of Los Angeles County to the south, it has a vibrant economy in its own right, and household income levels are significantly higher than surrounding metros. Limited land supply and a tough land planning and approval environment will continue to restrict the supply of new homes over the next few years.
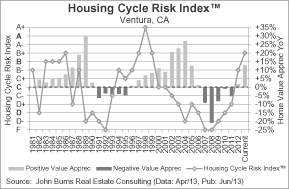
The housing fundamentals in Ventura are improving, which is a positive sign for home price appreciation in this market, indicating a recovery from the recession of the last few years. The improvement in the overall fundamentals is the result of improving job growth, low supply and excellent affordability. In particular, the supply fundamentals stand out, given the very low levels of homebuilding permit activity and resale listings. The combination of prices being below peak and low mortgage rates provide a historic buying opportunity, which makes for good affordability conditions.
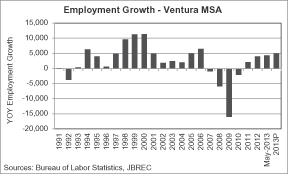
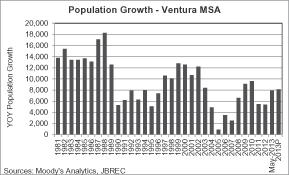
There are nearly 284,000 non-farm payroll jobs in Ventura County, and employment growth has been positive since 2011 after job losses that lasted from 2007 through 2010. The metro area lost 25,000 jobs (8.4%) from the 2006 peak before adding 10,900 jobs (4.0% growth) in 2011 through May 2013. JBREC assumes employment growth rising to 5,000 jobs added in 2013.
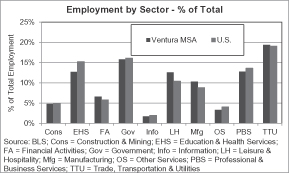
The largest employment sector is Trade, Transportation and Utilities (19.4% of jobs), followed by the Government (15.8%) sector. The high-paying Professional Business Services sector comprises an additional 12.8% of jobs in the MSA, which is lower than the national average for this sector. The Fortune 500 pharmaceutical company Amgen is headquartered in Thousand Oaks. |
|
112
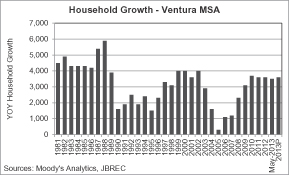
The Ventura MSA showed a slowing in population growth and household growth in the mid-2000s, but has rebounded, adding an estimated 7,900 people and 3,500 households during the twelve months ended May 31, 2013. JBREC assumes population growth of approximately 8,100 people (1.0% growth) and household growth of approximately 3,600 (1.3% growth) in 2013.
 |  |
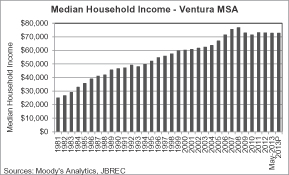
As of May 2013, the median household income in Ventura County was $72,803, having peaked in 2008 at $76,888. Notably, Ventura’s median household income is well above the median income for Los Angeles County, showing the prevalence of higher-income jobs, many of them professional, in Ventura County. JBREC assumes median incomes will remain relatively flat for Ventura in 2013.
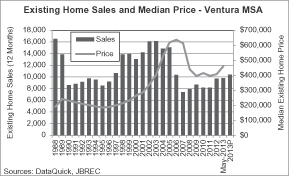
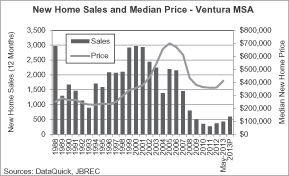
Existing home sales in Ventura are rising rapidly after remaining relatively flat in 2011. In the twelve months ended May 31, 2013, existing home sales for the area increased to 9,805, up 32% from the trough of 2007. Existing home sales levels during the twelve months ended May 31, 2013 were still well below the recent peak level of 16,153 in 2003. Home prices are starting to turn around in Ventura. The median existing single-family detached home price declined 38% between 2007 and 2009, due in part to a shift in sales activity away from the higher price points and a loss in value. Although substantial, this decline was slightly less than the corresponding drop of 41% in Los Angeles County. As of May 2013, the median price for existing single-family detached home prices was $460,000, up from $406,250 in May 2012 and slightly above the 2003 median price level of $403,000.
New home sales activity for the twelve months ended May 31, 2013 has risen from the trough levels of 2011, but remains very low for this market. New home sales transactions totaled 427 for the twelve months ended May 31, 2013, well below the peak of 2,965 in 2000. JBREC expects the new home sales volume to increase to 600 transactions in 2013. The median new home price is once again starting to increase after declining from the peak level in 2005. As of May 2013, the median new home price was $412,000, which is up 8% from May 2012, but still down 41% from its top |
| |
| of $699,000 in 2005. The median new home price can be heavily influenced by the mix of home types being sold at any given time, and should not be relied upon as the only indicator of market trends. | ||
113
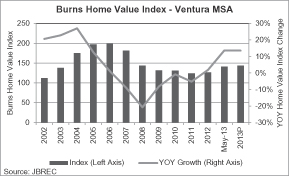
Home values in Ventura are poised for continued positive growth in 2013, according to JBREC. JBREC forecasts home values to rise by 13.5% in 2013, after rising 13.6% during the twelve months ended May 31, 2013.
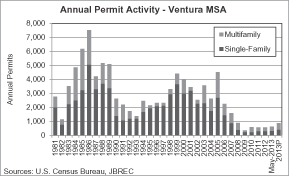
Homebuilding permit activity in Ventura is starting to pick up, but remains at very low levels. While JBREC forecasts that much of the growth in the housing inventory in 2013 will be for multifamily units, single-family construction is also expected to rebound steadily. Single-family homebuilding permits had fallen to 204 units in 2009, but rose to 305 over the twelve months ended May 31, 2013. Single-family homebuilding permits are expected to account for roughly 45% of the total residential construction activity in 2013, rising to 390 permits. In contrast, multifamily permits totaled 309 during the twelve months ended May 31, 2013 and are projected to rise to 480 in 2013. Limited available land will keep construction activity well below what was seen over the last few decades.
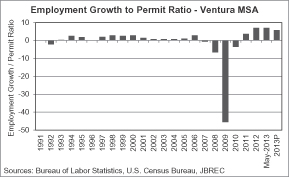
The demand being generated for housing is greater than the new supply being added to the market, with job growth in the twelve months ended May 31, 2013 approximately seven times the number of homebuilding permits issued in that same time; the employment growth to homebuilding permit ratio for the twelve months ended May 31, 2013 was 7.0. That ratio is expected to remain high in 2013, due to improving job growth and low permit levels.
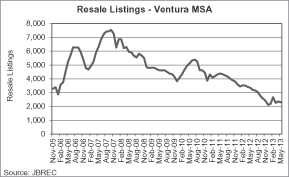
Resale listings in Ventura are low, which could lead to more competitiveness and increasing prices in the resale market. As of May 2013, the county had 2,303 homes listed on the market, which represented a 31% decline from one year prior and a 55% drop from 2010. By comparison, listings exceeded 7,000 homes on the market in some months of 2007. The level of listings as of May 31, 2013 translates to a very low 2.8 months of supply, based on existing home sales activity. A 6.0 month supply is considered equilibrium for most markets. The May 2013 inventory level is well below the peak level of 11.8 months of supply in 2008. |
|
114
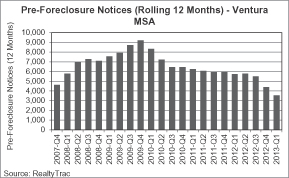
Pre-foreclosure notices are declining in Ventura, which is a positive sign for home prices, as pre-foreclosure notices are an indicator of future distress. In the twelve months ended March 31, 2013, approximately 3,500 notices were issued, representing a 38% decline from one year prior and a 61% decline from the peak in 2009.
While the number of homes falling into pre-foreclosure is declining, there is a moderate level of potential distressed homes that are not yet on the market and may limit upward movement for home prices. As of March 31, 2013, JBREC estimated the shadow inventory at 5,300, or about 5.0 months of supply. The shadow inventory is nearly two times the very low level of listings that were on the market at that time. JBREC believes that most shadow inventory homes will gradually become distressed sales over the next few years, and the pace of distressed sales will be slow enough that home prices will not be significantly negatively affected.
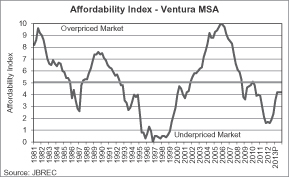
When comparing the monthly costs of owning the median-priced home with the median household income, |
| |
affordability conditions are better than the historical median affordability conditions in Ventura. JBREC forecasts affordability conditions in Ventura will weaken in 2013 as home prices and mortgage rates are expected to rise.
In summary, the housing fundamentals in Ventura are improving steadily. Job growth is positive for housing demand in this market, particularly as job growth outpaces the supply of new homes being added to the market. Low levels of existing home listings are creating a more competitive resale market, which should influence future home price appreciation. Prices are still at relatively low levels in a time when mortgage rates are also low. The combination of low prices and low mortgage rates in a county of high-income jobs suggests a rebound in the form of rising construction activity and home prices. | ||
115
Los Angeles, CA Housing Market Overview
The Los Angeles metropolitan division is a part of a single MSA which consists of Los Angeles and Orange Counties together; the Los Angeles division represents Los Angeles County only. This county has over 10.0 million people and 3.3 million households, making it the most populous county in the entire nation as well as in California, representing slightly less than 30% of the state population and about 3% of the population of the entire nation. Owing to its size, this market has a wide diversity of submarkets and demographics, which make it critical for builders and developers to understand the local consumer. A large percentage of new homebuilding activity will likely occur in either infill locations close to job growth or in more distant areas where land is available for traditional single-family detached home development.
| ||
The housing fundamentals of Los Angeles County have shown considerable improvement in recent years, which is a positive sign for home price appreciation in this market, indicating a recovery from the recession of the last few years. The improvement in the overall fundamentals is the result of improving job growth and declining distressed sales, crossed with low construction levels in the recession. The affordability fundamentals are excellent, with prices on average having fallen to levels consistent with prices in 2003 at the same time that mortgage rates are at a low level, around 4.5% as of early July. The current affordability conditions continue to provide a good buying opportunity.
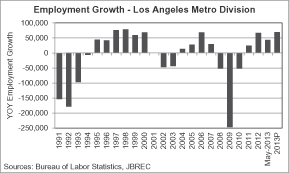
There are more than 3.9 million non-farm payroll jobs in Los Angeles County, and employment growth is once again positive after job losses in 2008 through 2010. The metro area lost 349,700 jobs (8.5%) from the 2007 peak before adding 141,500 jobs (3.8% growth) from 2011 through May 2013. The recent recession resulted in fewer losses than the 433,900 jobs lost in the downturn of 1991 through 1994, which had fallen upon a smaller population. JBREC assumes employment growth of 70,000 jobs in 2013.
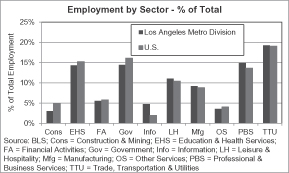
Although the area is famous for its entertainment industry, employment in Los Angeles County is distributed over many industries and sectors. The largest employment sector is Trade, Transportation and Utilities (19.2% of jobs), followed by the high-paying Professional and Business Services (14.9%), Government (14.4%), and Educational and Health Services (14.3%). Los Angeles County is home to such Fortune 500 companies as Walt Disney, DirecTV, Occidental Petroleum and Edison International, as well as the U.S headquarters for automobile companies |
| |
| Toyota, Honda and Isuzu. The city and county governments are also major employers, as is the educational system. The ports of Los Angeles and Long Beach handle one-fourth of all container traffic coming into the United States, making the complex the largest port in the country and the third-largest in the world. | ||
116
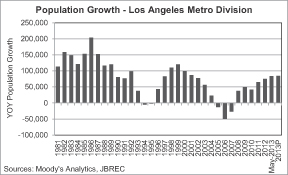
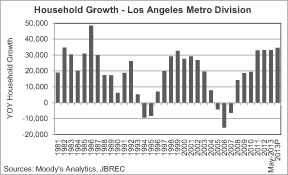
Los Angeles County lost a little less than one percent of its population in the three years from 2005 through 2007, but has added 341,500 people from 2008 through May 2013 (3.5% cumulative growth). JBREC assumes population growth of approximately 84,500 people (0.8% growth) and household growth of approximately 34,500 households (1.0% growth) in 2013.
 |  |
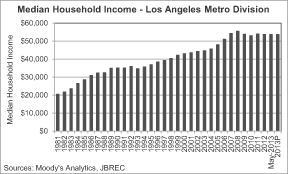
As of May 2013, the median household income in Los Angeles County was $53,728, having declined modestly since 2008 when it peaked at $55,537. JBREC assumes the median income will be flat in 2013.
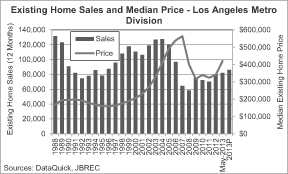
Existing home sales in Los Angeles County are rising vigorously after declining in 2010 and 2011. In the twelve months ended May 31, 2013, existing home sales for the area increased to 82,089, up 40% from the trough of the market in 2008. Existing home sales levels for the twelve months ended May 31, 2013 were still well below the peak levels that topped 127,000 transactions in both 2003 and 2004. Home prices have turned around in Los Angeles County. In a classic business cycle, the median existing single-family detached home price declined by 44% between 2007 and 2009, representing the withdrawal of generous lending that had made high prices possible and led to many distressed sales. As of May 2013, the median price for existing single-family detached home prices was $420,000, up from $326,000 in May 2012 and above the 2004 median price level of $410,000.
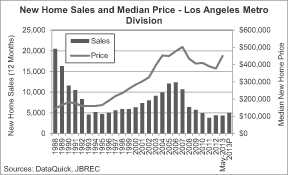
New home sales activity for the twelve months ended May 31, 2013 rose from trough levels in 2011, but remains very low in comparison to history in this market. New home sales transactions totaled 4,323 for the twelve months ended May 31, 2013, up from 3,822 in 2011, but still well short of the peak at 12,370 in 2006. The median new home price is once again rising after declining from the peak level in 2007. As of May 2013 the median new home price was $450,000, down 10.5% from its peak of $502,867 in 2007. The median new home price can be heavily influenced by the mix of home types being sold at any given time in this broad region. As a result, resale home prices are a better indication of market trends. |
|
117
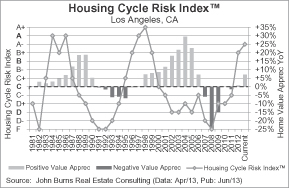
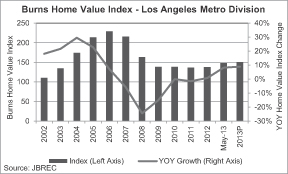
Home values in Los Angeles County are poised for continued positive growth in 2013, according to the Burns Home Value Index. JBREC forecasts home values to rise by 9.0% in 2013, after growing 8.2% during the twelve months ended May 2013.
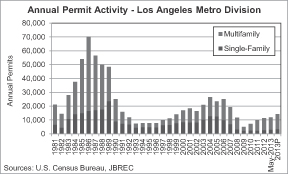
While the mix of new housing construction in this county has historically been a fairly balanced split between attached homes and single-family detached homes, the market is becoming a more attached-dominated market as the availability of land for detached housing is diminished. JBREC forecasts that much of the growth in the housing in 2013 will be for multifamily units, but single-family construction is also expected to rebound from trough levels during the downturn in housing. Single-family homebuilding permits had fallen to 2,268 units in 2009 as construction slowed, but rose to 3,007 over the twelve months ended May 31, 2013. Single-family homebuilding permits are expected to account for approximately one-fourth of the total residential construction activity in 2013, rising to 3,360 permits. In contrast, multi-family permits totaled 8,953 during the twelve months ended May 31, 2013 and are projected to rise to 11,000 in 2013.
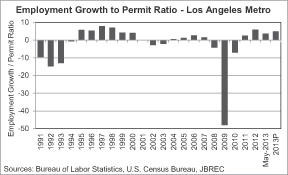
The demand being generated for housing is greater than the new supply being added to the market, with job growth in the twelve months ended May 31, 2013 nearly four times the number of homebuilding permits issued in that same time; the employment growth to homebuilding permit ratio through May 2013 was 3.7. This ratio is expected to remain high in 2013, owing to relatively strong job growth and low permit levels.
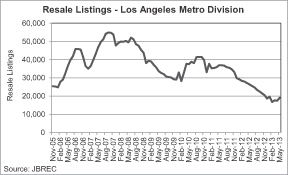
Resale listings in Los Angeles County are very low, which could lead to more competitiveness and increasing prices in the resale market. As of May 2013, the county had 19,100 homes listed on the market, which represented a 28% decline from one year prior and an almost 50% drop from 2010. By comparison, listings exceeded 50,000 homes on the market in much of 2007 and 2008. The level of listings as of May 2013 translates to a very low 2.8 months of supply, based on existing home sales activity over the most recent twelve months. A 6.0 month supply is considered equilibrium for most markets. The May 2013 inventory level is well below the level of more than 11 to 12 months of supply in 2008, when listings had peaked. |
|
118
Pre-foreclosure notices are declining in Los Angeles County. This is a positive sign for home prices, as pre-foreclosure notices are an indicator of future distress. In the twelve months ended March 31, 2013, approximately 35,600 notices were issued, representing a 38% decline from one year prior and a 68% decline from the peak in 2009.
While the number of homes falling into pre-foreclosure is declining, there is a moderate level of potential distressed homes that are not yet on the market and may limit upward movement for home prices. As of March 31, 2013, JBREC estimated the shadow inventory at 58,300 homes, or about 7.0 months of supply. This is approximately three times the very low level of listings on the market at that same time. JBREC believes that most shadow inventory homes will gradually become distressed sales over the next few years, and the pace of distressed sales will be slow enough that home prices will not be significantly negatively affected.
When comparing the monthly costs of owning the median-priced home with the median household income, |
| |
affordability conditions are good in relation to history in the Los Angeles metro area. JBREC forecasts affordability conditions in Los Angeles County will begin to weaken in 2013 as home prices and mortgage rates are expected to rise.
In summary, the housing fundamentals in Los Angeles are excellent. Solid job growth is positive for housing demand in this market, particularly as job growth significantly outpaces the supply of new homes being added to the market. Low levels of existing home listings are creating a more competitive resale market, which should influence future home price appreciation. Additionally, the combination of prices that are down from peak levels and low mortgage rates means that affordability is good for the buyer, suggesting a coming cyclic rebound in the form of increased construction activity and rising home prices. | ||
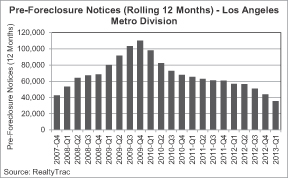
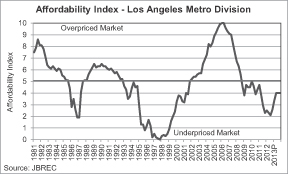
119
San Francisco, CA Housing Market Overview
The San Francisco Metropolitan Division consists of three counties: San Francisco, San Mateo and Marin. It is part of the larger San Francisco-Oakland-Hayward MSA, which also includes the East Bay counties of Alameda and Contra Costa. All three counties in the San Francisco Metropolitan Division are affluent and housing there tends to be expensive. Combined, the three counties have a population of more than 1.8 million. The San Francisco metro is mature and largely developed in core locations. Limited land supply and a tough land planning and approval environment restrict the supply of new homes. Homebuyers typically evaluate opportunities to buy higher density product closer-in, or commute to outlying locations for relative affordability and detached homes. Like many other markets, the San Francisco Metro experienced a housing correction; however, San Francisco’s economy was still struggling from the technology correction during the early parts of the national housing boom so home prices did not rise or fall as much as other metros.
The housing fundamentals of the San Francisco metro have shown considerable improvement in recent years, based largely on gains in affordability, which is a positive sign for home price appreciation in this market, indicating a recovery from the recession of the last few years. The improvement in the overall fundamentals is the result of improving job growth, increasing affordability, and the turning of the business cycle. The affordability fundamentals are excellent (by San Francisco standards), with prices reset to 2004 and 2005 levels, at the same time that low mortgage rates are now at 4.5%. The combination of below-peak prices and lower mortgage payments continues to provide a good buying opportunity. As a result, properties are now quickly snapped up by eager buyers, mostly at higher prices than one year ago and sometimes above their asking prices.
There are over 1.0 million non-farm payroll jobs in the San Francisco metro, and employment growth has resumed since 2011 after job losses in 2009 and 2010. The metro area lost 60,600 jobs (6.1%) in 2009 and 2010 before adding 84,900 jobs (9.1% growth) from 2011 through May 2013. JBREC assumes employment growth of 25,300 jobs (2.5%) in 2013.
The strongest sector for employment is the high-paid Professional and Business Services (23.0% of jobs), followed by Trade, Transportation and Utilities (15.1%), Leisure and Hospitality (13.6%), Government (13.3%), and Educational and Health Services (11.4%). In the city of San Francisco itself, tourism is a major industry. Many private companies make their headquarters in San Francisco, including Wells Fargo (the largest private employer in the city), Union Bank, the construction firm Bechtel, and Visa. In San Mateo |
| |
| County the largest private employers are Genentech, Oracle, and Kaiser Permanente. These counties are also home to many smaller companies, often startups, in the biotech and computer/Internet fields, in the spirit of Silicon Valley to the south. | ||
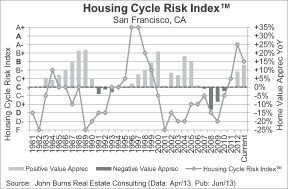
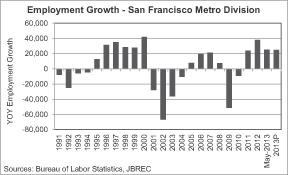
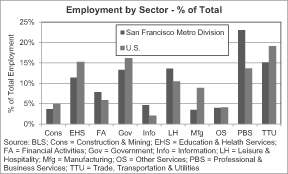
120
While the San Francisco metro lost 1.6% of its population in the dot-com recession from 2001 through 2004, it has gained population every year since then, adding 126,100 people (7.4% cumulative) from 2007 through May 2013. JBREC assumes population growth of approximately 11,000 people (0.6% growth) and household growth of approximately 6,100 (0.8% growth) in 2013.
| 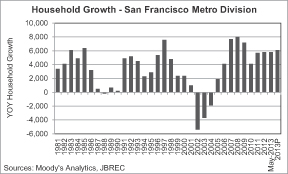 |
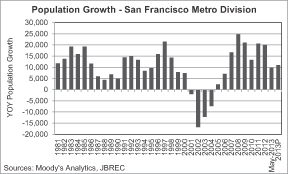
As of May 2013, the median household income in the three-county metro was $77,525, just short of its peak of $78,514 in 2008. This high level of median household income suggests the prevalence of well-paying professional jobs. JBREC assumes the median income will decline by 0.4% in 2013.
Existing home sales in the San Francisco metro rose sharply during the twelve months ended May 2013 and had been increasing for three years before that, since 2009. In the twelve months ended May 31, 2013, existing home sales for the area increased to 17,526, up 12.7% from May 2012 and up 40% from the trough of 2008. Current existing home sales levels are still well below the peak level of 24,979 in 2004. The median existing single-family detached home price declined by 22% between 2007 and 2011, but this was a far smaller decline than in many metros, thanks to limited supply, less of a price increase early in the decade because of the crash in the technology sector, and an abundance of high-paying jobs. As of May 2013, the median price for existing single-family detached home prices was $854,500, up 17.4% from $728,000 in May 2012. Since the economy remains strong, supply remains low, and mortgage rates are low, prices are likely to rise in the near and medium term.
New home sales activity during the twelve months ended May 31, 2013 has risen above the levels of 2011, but there have always been relatively few new sales compared to the population of this mature and land-constrained metro. New home sales transactions totaled 1,003 for the twelve months ended May 31, 2013, up from 826 in 2011, but well below the peak of 2,516 in 2004, and we expect sales to remain relatively flat in 2013. The median new home price continues to strongly rise. As of May 2013, the median new home price was $633,000, which is down from a year ago. However, the |
|
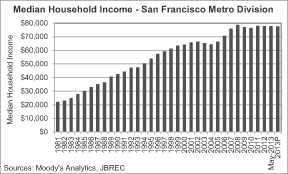
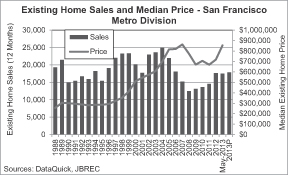
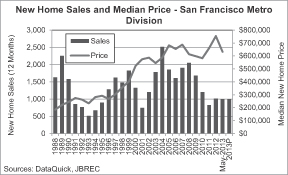
121
median new home price can be heavily influenced by the mix of home types being sold at any given time in this broad region. As a result, resale home prices are a better indication of market trends, especially given that the new home sales volume in this market is very much lower than the existing home sales volume.
Home values in the San Francisco metro are poised for continued positive growth in 2013, according to the Burns Home Value Index. JBREC forecasts home values to rise by 14.4% in 2013, after growing 13.8% during the twelve months ended May 31, 2013.
Because of cultural preference and the lack of buildable land, the mix of new permits has favored multifamily in-fill housing over single-family homes for the last two decades. JBREC forecasts that this trend will continue in 2013. Single-family construction is also expected to rebound from trough levels during the downturn in housing. Single-family homebuilding permits had fallen to only 349 units in 2010 and 374 units in 2011, but rose to 521 over the twelve months ended May 31, 2013. Single-family homebuilding permits are expected to rise to approximately 700 in 2013, but remain low given the constraints in this market. Historically, more than one-half of the single-family homebuilding permits issues in the metro division have been in San Mateo County, and this has risen to two-thirds of single-family permits in 2011 and 2012. Multifamily permits totaled 5,578 during the twelve months ended May 31, 2013.
The demand being generated for housing is greater than the new supply being added to the market, with job growth in the twelve months ended May 31, 2013 outpacing the number of homebuilding permits issued in that same time by more than four to one. The ratio is expected to remain high in 2013 as permit activity is not expected to dramatically increase.
Resale listings in the San Francisco metro are low, which could lead to more competitiveness and increasing prices in the resale market. As of May 2013, the county had just 4,060 homes listed on the market, which represented a 8% decline from one year prior and a 42% drop from 2010. This level of listings translates to a very low 2.8 months of supply, based on existing home sales activity over the twelve months through May 31, 2013. A 6.0 month supply is considered equilibrium for most markets. The May 2013 inventory level is well below the peak level of 6.3 months of supply in 2009 and 2010. Note that even the peak level of inventory was rather low, indicating the existing home market conditions have always been tight. It is not surprising, therefore, that both new and existing homes |
|
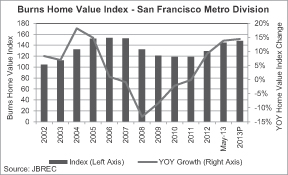
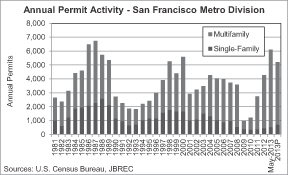
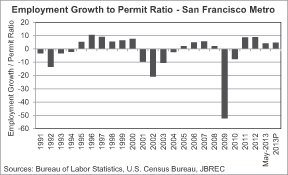
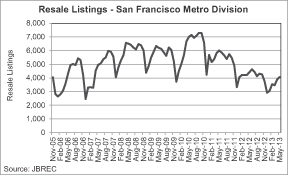
122
are often quickly purchased when they come to market, whether by investors or by households planning to occupy the residences; sometimes the homes are sold as soon as they are listed, and sometimes they sell at higher prices than had been expected. Again, the governing factor is the lack of supply.
Pre-foreclosure notices are declining in this metro. This is a positive sign for home prices, as pre-foreclosure notices are an indicator of future distress. In the twelve months ended March 31, 2013, approximately 3,500 notices were issued, representing a 43% decline from one year prior and a 62% decline from the peak in 2009.
While the number of homes falling into pre-foreclosure is declining, there is a moderate level of potential distressed homes that are not yet on the market and may limit upward movement for home prices. JBREC estimated the shadow inventory as of March 31, 2013 at 5,200 homes, or about 3.0 months of supply. This level of shadow inventory is slightly more than the level of listings that were on the market at that time. JBREC believes that most shadow inventory homes will gradually become distressed sales over the next few years, but the pace of distressed sales will be slow enough that home prices will not be significantly negatively affected.
When comparing the monthly costs of owning the median-priced home with the median household income, |
| |
affordability conditions are at the historic median in the San Francisco metro area. JBREC estimates that affordability will weaken in 2013 as home prices and mortgage rates are both expected to rise.
In summary, the housing fundamentals in the San Francisco metro are solid, with a recovery underway and the potential for strong price appreciation. There is solid growth of high-income jobs to support demand in an environment of low and constrained supply. Affordability is slightly better than average for the metro’s history. Limited lot and land supplies and the political environment affecting project approvals are long-term conditions in the Bay Area, which underscores the importance of a management team with strong local knowledge and planning and development expertise. | ||
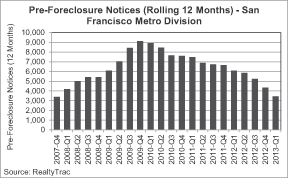
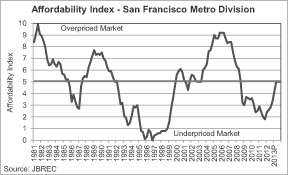
123
San Jose, CA Housing Market Overview
The San Jose MSA consists of Santa Clara and San Benito counties. With over 1.9 million people and 641,000 households, San Jose is one of the larger markets in the state of California. Widely regarded as a leading technology center, the metro area is home to many of the world’s foremost technology companies. The job growth from this South Bay market has a ripple effect on regional housing demand. The mix of housing in San Jose is shifting from a fairly balanced split between attached homes and single-family detached homes to a more attached-dominated market, due to limited land for detached housing as well as political and environmental challenges.
San Jose’s housing fundamentals have shown considerable improvement in recent years, which is a positive sign for home price appreciation in this market. The improvement in the overall fundamentals is the result of improving job growth and rising sales activity paired with low homebuilding permit and listings levels. The affordability fundamentals in San Jose are improved from 2005, and affordability conditions are nearing the MSA’s historical median.
There are nearly 930,000 non-farm payroll jobs in the San Jose metro area, and employment growth is once again positive after job losses in 2009 and 2010. The metro area lost 59,800 jobs (6.5%) from the 2008 peak before adding 74,700 jobs (8.7% growth) from 2011 through May 2013. The recent recession resulted in fewer losses than the downturn caused by the “dot com” bust in the early 2000s, when San Jose lost 182,300 jobs between 2001 and 2004, or 17.5% of the market total. JBREC assumes employment growth of 30,000 jobs (3.3%) in 2013.
Because of its dominance in the technology industry, San Jose has a very high concentration of employment in related job sectors when compared to the nation as a whole. Technology and innovation-related employment contribute significantly to the sizeable economy in the MSA. The largest employment sector is the higher-paying Professional and Business Services sector, which accounts for over 20% of the payroll jobs in the metro area. The next largest sector is Manufacturing, which accounts for 17% of the jobs in San Jose—nearly twice the national average. The Information sector, at approximately 6% of all jobs, is three times the concentration of the nation, and is also considered to be a higher-paying sector. Technology |
| |
| companies dominate the Fortune 500 companies in San Jose, which include Hewlett-Packard, Apple, Google, SanDisk and Intel, among many others. Approximately 41% of the U.S. venture capital investment activity in 2012 took place in Silicon Valley (which also includes the San Francisco market to the north), amounting to nearly $10.9 billion, according to the PricewaterhouseCoopers MoneyTree Report. | ||
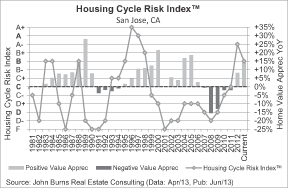
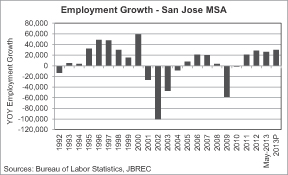
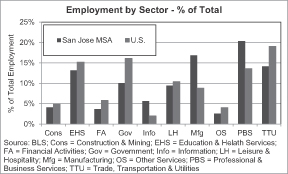
124
Unlike the years that followed the dot com bust in the early 2000s, San Jose has not witnessed a drop in population or households in the recent downturn. Growth has remained strong, with an average of 25,100 people (1.4% growth) added each year from 2007 through 2012, and an average of 8,000 households (1.3% growth) added annually. JBREC assumes population growth of approximately 14,800 people (0.8% growth) and household growth of approximately 6,600 households (1.0% growth) in 2013.
| 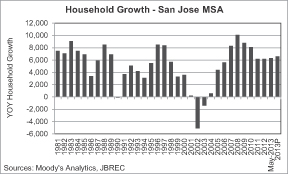 |
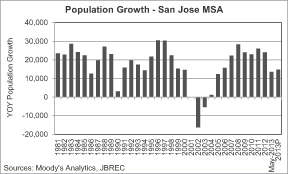
As of May 2013, the median household income in the San Jose metro area was $86,302, which is the highest among the major Bay Area markets, driven by tech jobs. The San Jose median household income peaked above $87,300 in 2008, declining in 2009 and 2010. JBREC assumes incomes will grow by 0.9% growth in 2013.
Existing home sales in San Jose are rising after remaining relatively flat in 2010 and 2011. In the twelve months ended May 31, 2013, existing home sales for the area increased nearly 31% to 19,874 transactions from the trough of the market at 15,130 transactions in 2008. Existing home sales levels during the twelve months ended May 31, 2013 constituted a return to the levels prevalent in the mid-1990s. Home prices also continue to rise in San Jose. The total decline in the median existing single-family detached home price of nearly 37% between 2008 and 2009 was a result of sales activity shifting to lower price points, as well as a loss of value. The median existing single-family detached home price of $730,000 in May 2013 was on par with the median price in 2006 for this market.
San Jose’s new home sales activity is rising from trough levels in 2011, but remains historically low for this market. New home sales transactions totaled 1,538 for the twelve months ended May 31, 2013. The San Jose market has historically accounted for 28% of the new home sales activity among the three major Bay Area markets (San Jose, San Francisco and Oakland) over the last 20 years and, during the twelve months ended May 31, 2013, San Jose made up 27% of the total. The median new home price is once again rising after declining from the peak at $644,300 in 2007. As of May 2013, the median new home price was $708,000 which |
|
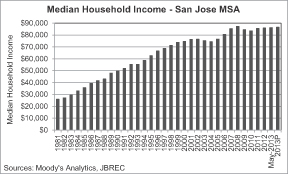
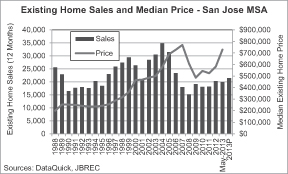
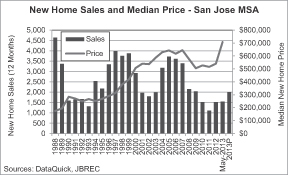
125
exceeds the 2007 peak. The median new home price can be heavily influenced by the mix of home types being sold at any given time in this broad region. As a result, resale home prices are a better indication of market trends, especially given that the new home sales volume in this market is considerably lower than the existing home sales volume.
Home values in the San Jose MSA are rebounding sharply, and are poised for continued positive growth in 2013, according to the Burns Home Value Index. The index shows that San Jose home values appreciated 15.1% during the twelve months ended May 31, 2013, following five years of declining prices from 2007 through 2011. JBREC forecasts home values to rise by 15.9% in 2013.
While the mix of new housing construction in San Jose has historically been a fairly balanced split between attached homes and single-family detached homes, the market is becoming a more attached-dominated market as the availability of land for detached housing is diminished. JBREC forecasts that much of the growth in the housing inventory in 2013 will be for multifamily units, but single-family construction is also expected to rebound from trough levels during the downturn in housing. Single-family homebuilding permits had fallen to 642 units in 2009 as construction slowed, but more than doubled to 1,678 single-family homebuilding permits over the twelve months ended May 31, 2013. Single-family homebuilding permits are expected to account for approximately one-third of the total residential construction activity in 2013, rising to 2,000 permits.
The demand being generated for housing is greater than the new supply being added to the market, with job growth in the twelve months ended May 31, 2013 significantly higher than the number of homebuilding permits issued in that same time. The employment growth to homebuilding permit ratio for the twelve months ended May 31, 2013 was 4.3. Historically, the ratio has been closer to 1.2 jobs added for every homebuilding permit issued. The ratio is expected to remain high in 2013 due to solid job growth amidst relatively low permit levels.
Resale listings in San Jose are very low, which could lead to more competitiveness and increasing prices in the resale market. Through May 31, 2013, San Jose had 3,710 homes listed on the market, which represented an 11% decline from one year prior. By comparison, listings exceeded 10,000 homes on the market in August 2008. The May 2013 level of listings translates to a very low 2.2 months of supply, based on existing home sales activity over the most recent twelve months. A 6.0 month supply is considered equilibrium for most markets. The May 2013 inventory level is well below the level of more than 8.5 months of supply when listings had peaked. |
|
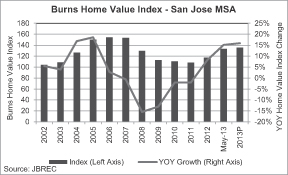
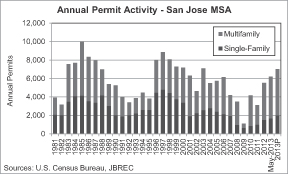
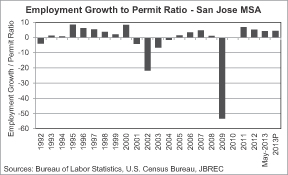
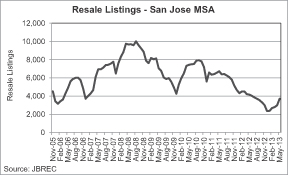
126
Pre-foreclosure notices are once again declining in the San Jose market after flattening in 2011. This is a positive sign for home prices, as pre-foreclosure notices are an indicator of future distress. In the twelve months ended March 31, 2013, approximately 4,400 notices were issued, representing a 48% decline from one year prior and a 74% decline from the peak in 2009.
While the number of homes falling into pre-foreclosure is declining, there is a moderate level of potential distressed homes that are not yet on the market and may limit upward movement for home prices. As of March 31, 2013, JBREC estimated the shadow inventory at 6,700 homes, or 3.0 months of supply. This is approximately two times the very low level of listings on the market at that time. JBREC believes that most shadow inventory homes will gradually become distressed sales over the next few years, and the pace of distressed sales will be slow enough that home prices will not be significantly negatively affected.
When comparing the monthly costs of owning the median-priced home with the median household income, affordability conditions are good in relation to history in |
|
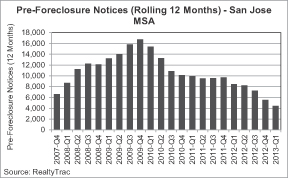
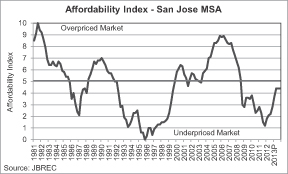
the San Jose MSA. JBREC’s Affordability Index takes into consideration the change in mortgage rates over time in its estimate of the ownership costs, which can significantly impact the monthly payment. Affordability conditions at the end of 2011 were at the market’s best since 1997. While affordability conditions weakened slightly in 2012 as home prices rose, overall affordability remains favorable (by San Jose standards) in comparison to historical levels. JBREC forecasts affordability conditions in San Jose will weaken considerably in 2013 as home prices and mortgage rates are expected to rise.
In summary, the housing fundamentals in San Jose are improving. The combination of solid job growth and a high-income employment base are positive for housing demand in this market, particularly as job growth outpaces the supply of new homes being added to the market. Low levels of existing home listings are creating a more competitive resale market, which should influence future home price appreciation.
127
Sacramento, CA Housing Market Overview
The Sacramento-Arden-Arcade-Roseville metro consists of four counties: El Dorado, Placer, Sacramento and Yolo counties. Sacramento’s status as the capital of California provides a large employment basis for solid middle-class households. This is a major metro area with more than 2.2 million residents and more than 830,000 jobs, comparable to, for instance, greater Portland or Charlotte. Because of the relative availability of land and the low prices for housing in the area, this region experienced a great deal of construction and rapidly rising prices during the boom of the last decade. Sacramento has long been impacted by Bay Area commuters and relocations. High prices and a lack of developable land in the Bay Area traditionally push buyers into the greater Sacramento area, although that impact was muted during the housing downturn.
The housing fundamentals of the Sacramento metro have shown considerable improvement in the last year, based largely on gains in affordability, which is a positive sign for home price appreciation in this market, indicating a recovery from the recession of the last few years. The improvement in the overall fundamentals is the result of improving job growth, strongly increasing affordability, and the turning of the business cycle. The affordability fundamentals are good, with prices comparable to 2003-2004 levels, at the same time that mortgage rates are at 4.5% as of early July 2013.
There are 833,300 non-farm payroll jobs in the Sacramento metro, and employment growth turned positive in 2012 after job losses from 2008 through 2011. The metro area lost 94,400 jobs (10.1%) from 2008 through 2011 before adding 24,700 jobs (3.0% growth) from 2012 through May 2013. JBREC assumes improving employment growth averaging 12,000 jobs (1.5%) in 2013.
Because Sacramento is the state capital, by far the largest sector of employment is Government (27.0%), followed by Trade, Transportation and Utilities (16.9%), Professional and Business Services (13.9%), and Educational and Health Services (13.0%). Beside governmental and educational organizations at various levels, the largest private employers in Sacramento include Sutter Health, Kaiser Permanente, Intel, and Dignity Health. |
|
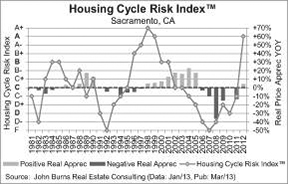
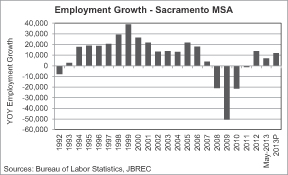
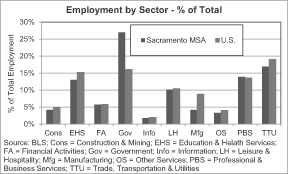
128
The population and number of households continue to grow at a relatively steady pace in the Sacramento MSA, with improved growth assumed in the near term. Over the twelve months ended May 31, 2013, the population rose to 2,221,000, adding 24,800 (1.1%) from a year prior. JBREC assumes population growth of approximately 24,900 (1.1% growth) and household growth of approximately 8,700 (1.1% growth) in 2013.
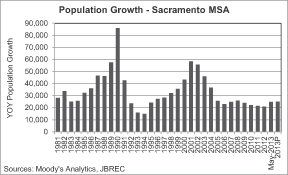 | 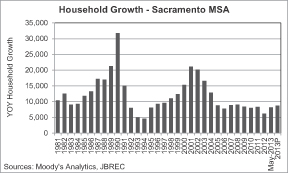 |
As of May 2013, the median household income in the Sacramento metro area was $59,085, increasing from 2010 and 2011, but still below the peak of $61,139 in 2008. JBREC assumes continued increases in incomes, with growth of 0.4% in 2013.
Existing home sales in the Sacramento metro area have steadily increased since 2011 after dipping in 2010. In the twelve months ended May 31, 2013, existing home sales for the area increased to 35,981, up 4.0% from May 2012 and up 66% from the trough in 2007.
Existing home sales for the twelve months ended May 31, 2013 were still well below the peak level of 50,459 in 2004, and are forecasted to top 37,000 transactions in 2013. The median existing single-family detached home price declined by 51% between 2006 and 2011, representing the withdrawal of generous lending and a falling back from unsustainable prices. As of May 2013, the median single-family detached existing home price was $260,000, which was up 39% from $187,000 in May 2012.
The new home sales volume during the twelve months ended May 31, 2013 increased sharply following 6 years of decline in the Sacramento MSA, but remains well below the sales volume from the boom years when construction rang out at an intense pace. New home sales transactions totaled 2,973 for the twelve months ended May 31, 2013, which was up from 2,067 a year prior. By comparison, new home sales in the MSA reached 16,635 in 2003, and surpassed 15,000 transactions per year for four consecutive years from 2002 through 2005, indicating the strength of the boom in this area. JBREC projects new home sales will reach 3,400 transactions in 2013. The median new home price |
|
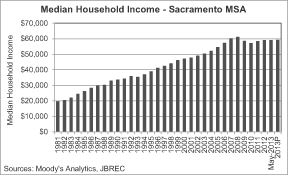
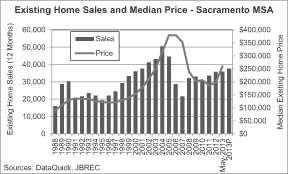
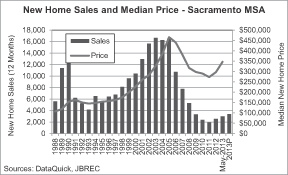
129
as of May 2013 was $347,000, which was up 19.7% from May 2012, but still far below the peak of $466,000 attained in 2005. The median new home price can be heavily influenced by the mix of home types being sold at any given time. As a result, resale home prices are a better indication of market trends, especially given the very low level of new homes that are transacting.
Home values in the Sacramento MSA are poised for positive growth in 2013, according to the Burns Home Value Index. JBREC forecasts home values to rise by 16.5% in 2013, after growing 16.2% during the twelve months ended May 31, 2013. The predicted home value appreciation is based on the current over-correction of the housing cycle on the downside, and the current excellent affordability conditions resulting from the combination of low prices and low mortgage rates.
Single-family construction has begun to rebound from trough levels during the housing downturn, with continued growth projected in the near future. Because of the availability of land, new single-family construction has tended to be higher than multifamily construction in the Sacramento area. Single-family homebuilding permits had fallen to 1,873 units in 2011, but rose to 3,527 over the twelve months ended May 31, 2013. By comparison, single-family homebuilding permits topped 18,000 units in 2003 and 2004. Single-family homebuilding permits are expected to rise to 3,800 in 2013, which is still well below peak levels. Multifamily permits totaled only 596 during the twelve months ended May 31, 2013 and are projected to rise to 800 units in 2013.
The demand being generated for housing is slightly greater than the new supply being added to the market, with job growth in the twelve months ended May 31, 2013 outpacing the number of homebuilding permits issued in that same time by almost two to one. Job growth is expected to outpace homebuilding activity at a similar level in 2013.
Resale listings in the Sacramento metro area are low, which could lead to more competitiveness and increasing prices in the resale market. As of May 2013, the MSA had just 3,460 homes listed on the market, which represented a 7% decline from one year prior. The May 2013 level of listings translates to only 1.2 months of supply, based on existing home sales activity over the twelve months ended May 31, 2013. A 6.0 month supply is considered equilibrium for most markets. In contrast, inventory in October 2007 constituted 8.3 months of supply. Given the low levels of inventory, existing homes are being quickly purchased when they come to market, whether by investors or by households planning to occupy the residences. |
|
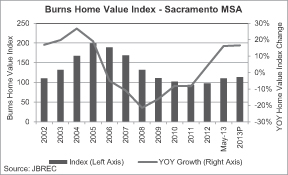
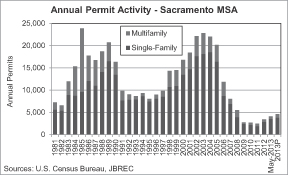
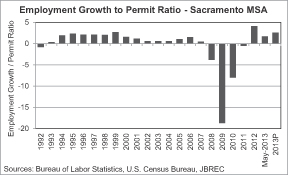
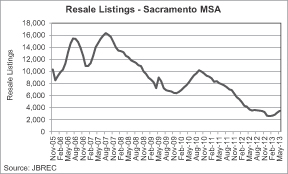
130
Pre-foreclosure notices are declining in the Sacramento metro area, which is a positive sign for home prices, as pre-foreclosure notices are an indicator of future distress. In the twelve months ended March 31, 2013, just over 13,200 notices were issued, representing a 41% decline from one year prior and a 76% decline from the peak in 2009.
While the number of homes falling into pre-foreclosure is declining, there is a significant number of potential distressed homes that are not yet on the market. The high number of defaults and distressed properties (both short sales and REOs) continues to be a slight drag on the Sacramento real estate market. JBREC estimated the shadow inventory as of March 31, 2013 at 20,229, or about 6.7 months of supply. This level of shadow inventory is about four times the very low level of listings on the market at that time. JBREC believes that most shadow inventory homes will gradually become distressed sales over the next few years, and will act as a slight drag on the Sacramento market, but the pace of distressed sales will be slow enough that home prices will not be massively impacted. While declining, the sheer size of the shadow inventory makes it something not to be dismissed. |
|
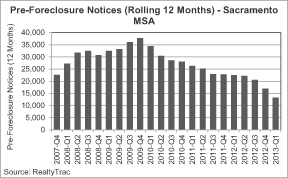
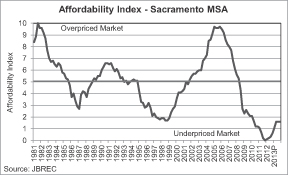
When comparing the monthly costs of owning the median-priced home with the median household income, affordability conditions are excellent in relation to history in the Sacramento metro area. JBREC estimates that affordability conditions reached their historical best level in early 2012 and will weaken in 2013 as home prices and mortgage rates rise.
In summary, the housing fundamentals in the Sacramento metro are outstanding. Prices are relatively low and, at the same time, mortgage rates remain very low. The combination of overcorrected prices, low mortgage rates and tremendously low levels of homes for sale supports a cyclic recovery and strong optimism regarding prices and construction in this market.
131
Phoenix, AZ Housing Market Overview
The Phoenix-Mesa-Glendale Metropolitan Area consists of Maricopa and Pinal counties. With 4.4 million people and 1.6 million households, Phoenix is the largest market in the state of Arizona. Phoenix is well-known as a retirement mecca and enjoys plenty of tourism, but is also ranked second in the country for solar power installations and is a manufacturing and distribution hub that operates at a 40% savings from California locations. Key cities in the MSA include Phoenix, Mesa, Scottsdale and Tempe.
The housing fundamentals in the Phoenix MSA have shown considerable improvement in recent years, which is typically a precursor for home price appreciation. The John Burns Real Estate Consulting Housing Cycle Risk Index measures the health of the housing market based on the performance of 24 market fundamentals in relation to their own history, and has historically been a one- to three-year leading indicator for home price appreciation. The improvement in the overall fundamentals is due to the combination of significantly improved demand fundamentals as a result of improving job growth and rising sales activity, and improved supply fundamentals as a result of low homebuilding permit and listings levels. The affordability fundamentals in Phoenix are very good, but are beginning to show signs of weakening as prices rise in this market.
There are more than 1.8 million non-farm payroll jobs in the Phoenix metro area, and employment growth resumed in 2011 after three years of losses from 2008 through 2010. The metro area lost 228,500 jobs, or 11.9% from the 2007 peak of 1.9 million, before adding 113,300 jobs (6.7%) since 2011. JBREC assumes Phoenix will add 45,000 new jobs (2.6%) in 2013
Phoenix has a diverse employment distribution that resembles that of the nation as a whole, with some differences. The largest employment sector is the Trade, Transportation and Utilities sector, which accounts for 20% of the jobs in the metro. Phoenix has a larger combined concentration of jobs in the sectors that generally represent higher incomes: Professional and Business Services, Financial Activities and Information. The combination of these three sectors represents 26% of the jobs in the metro, versus 21% for the nation. |
|
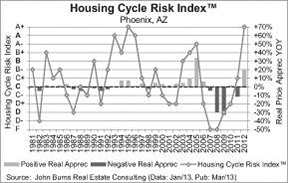
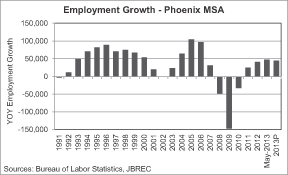
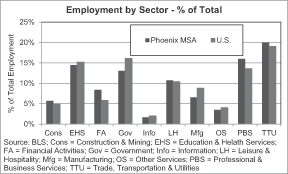
Metro leaders are focused on development or expansion of several industry clusters, including renewable energy, biomedical/personalized medicine, advanced business services, manufacturing and distribution, data centers, emerging technology and aerospace and aviation. Several of these sectors capitalize on the many sunny, clear days each year and lower cost of doing business, which is reportedly 40% lower than California. Top employers include city, county and state government, Bank of America, Wells Fargo, Raytheon, Arizona State University and Apollo Group, which is the parent company for Phoenix University and many other accessible education programs.
132
Population and household growth slowed in Phoenix during the recession, with an average of 61,840 people (1.5% growth) and 22,160 households (1.5% growth) added annually from 2008 through 2012. JBREC assumes a return to strong population growth of approximately 120,400 people (2.8% growth) and strong household growth of 42,700 households (2.7% growth) in 2013.
| 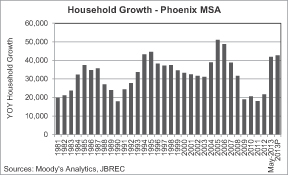 |
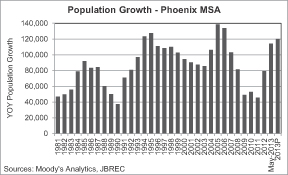
The median household income is rising in the Phoenix metro, increasing 2.5% during the twelve months ended May 2013 to nearly $53,300. While the median household income is still below the peak of $55,700 in 2008, JBREC assumes continued income growth of 2.1% in 2013.
Phoenix’s existing home sales volume has recovered significant from the low in 2007, but remains below the peak in 2003. Approximately 101,000 existing home sales for the twelve months ended May 31, 2013 were 67% higher than the trough at 60,600 transactions in volume in 2008. JBREC forecasts that existing home sales will reach 101,900 transactions in 2013, which would be the most since 2005.
The median existing home sales price rose 23.3% during the twelve months ended May 31, 2013, following five years of declining or weak prices. From the 2006 peak to the 2010 trough, the median existing single-family detached home price declined by 54% as a result of sales activity shifting to lower price points, as well as a loss of value. The median existing single-family detached home price of $185,000 as of May 2013 was on par with the median price in 2004 for this market.
New home sales activity increased sharply in Phoenix during the twelve months ended May 31, 2013, and JBREC forecasts strong sales growth for the next several years. New home sales transactions totaled 12,152 for the twelve months ended May 31, 2013, which was up 43% from the recent trough in 2011. JBREC projects that new home sales activity will increase to 13,000 transactions in 2013, which would be the highest level since 2008. |
|
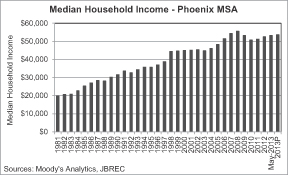
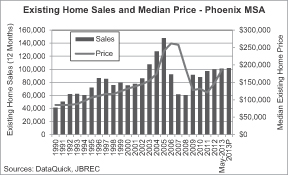
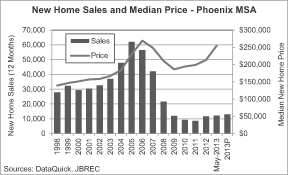
133
While solid growth is forecasted for the next several years, new home sales activity is likely to remain well below the peak levels achieved in 2005. Very low resale and new home inventory levels paired with recovering demand are driving new home prices higher, as consumers want to take advantage of low mortgage rates and good affordability. New homes typically have a pricing premium over resale homes, and that gap is growing again as housing recovers. DataQuick indicates the May 2013 median price for new homes was $255,181. The median new home price rose 26% during the twelve months ended May 2013 after declining from the peak of $269,300 in 2006. The median new home price can be heavily influenced by the mix of home types being sold and, as a result, resale home prices are a better indication of market trends.
Phoenix home values rose 19.1% during the twelve months ended May 31, 2013, following five years of declining values, during which time home values declined 55% from the 2006 peak, according to JBREC’s Burns Home Value Index. The index provides an estimate of home value trends in an MSA, and is calculated based on an “electronic appraisal” of every home in the market, rather than just the small sample of homes that are actually transacting. JBREC forecasts home values to rise 19.6% in 2013.
Single-family homebuilding permit activity in the Phoenix metro continues to rise from very low levels, and JBREC forecasts volume to grow in 2013 as the demand for housing increases. Single-family homebuilding permits totaled 12,510 in the twelve months ended May 31, 2013, rising from 7,212 units at the low point of the cycle in 2010. JBREC forecasts that single-family homebuilding permits will reach 14,000 issuances in 2013, which would be the highest level since 2007 in this market.
The pace of job growth is ahead of permit activity in Phoenix, resulting in current demand outpacing the new supply being added to the market. During the twelve months ended May 31, 2013, approximately 2.7 jobs were added to the market for every 1 homebuilding permit issued. Historically, this ratio has been closer to 1.2 for the Phoenix metro. The ratio is expected to fall slightly to 2.5 in 2013 as employment growth increases.
The resale inventory has steadily declined in the Phoenix metro since 2011, dropping by 3% in the last year. As of May 2013, there were 17,425 listings in the metro, translating to 2.1 months of supply, based on sales activity during the twelve months ended May 31, 2013. A 6.0 month supply is considered equilibrium for most markets. Low levels of inventory could lead to more competitiveness and increasing prices in the resale market. The level of listings as of May 2013 was well below the peak of more than 58,200 listings in October 2007, and the months of supply had been as high as 12.6 months in March 2008. |
|
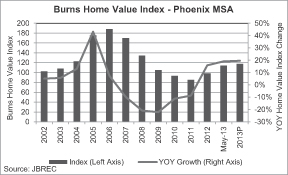
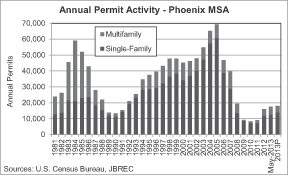
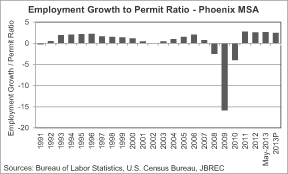
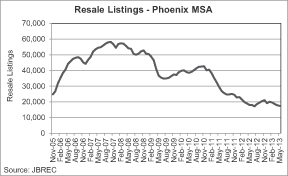
134
Pre-foreclosure notices have been declining in the Phoenix metro division since a peak in the fourth quarter of 2009. At the peak, approximately 117,300 notices were issued in Phoenix. In the twelve months ended March 31, 2013, approximately 34,700 notices had been issued, which represents a 39% decline from the twelve months ended March 31, 2012.
There is a relatively high level of potential distressed homes that are not yet on the market and may limit home price appreciation. As of March 31, 2013, the shadow inventory amounted to an estimated 32,050 homes, or 4.1 months of supply at the resale sales rate during the twelve months ended May 31, 2013. JBREC believes that most shadow inventory homes will gradually become distressed sales over the next few years; however, demand for the distressed inventory will exceed the slow pace of inventory coming to market so that material home price declines are unlikely.
When comparing the monthly costs of owning the median-priced home with the median household income, current affordability conditions are good in relation to |
| |
| history in the Phoenix metro. JBREC’s Affordability Index takes into consideration the change in mortgage rates over time in its estimate of the ownership costs, which can significantly impact the monthly payment. Affordability conditions at 2012 year-end were near the market’s best. JBREC forecasts that affordability conditions in Phoenix will worsen in 2013 as home prices and mortgage rates are expected to rise. | ||
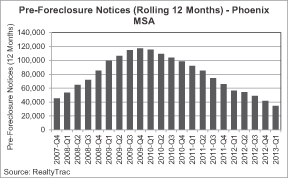
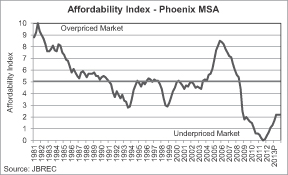
In summary, the Phoenix metropolitan area is recovering, with strong job growth that is fueling housing demand. Additional demand for homes by retirees and second-home buyers isn’t captured in the job growth metrics, which serve as a proxy for demand. Investors have also been active buyers in recent years, helping to clear much of the distress. Because resale and new home inventories are very limited, home prices are appreciating. Homebuilders are reporting very strong sales and improving pricing power, leading many to intentionally slow sales while working to open new sections or communities. Lot and land prices are escalating quickly.
Use of Estimates and Forward-Looking Statements
This market study was prepared for The New Home Company in connection with this offering by JBREC. Founded in 2001, JBREC is an independent research provider and consulting firm focused on the housing industry. The market study contains forward-looking statements which are subject to uncertainty.
The estimates, forecasts and projections prepared by JBREC are based upon numerous assumptions and may not prove to be accurate. This market study contains estimates, forecasts and projections that were prepared by JBREC, a real estate consulting firm. The estimates, forecasts and projections relate to, among other things, home value indices, payroll employment growth, median household income, housing permits and household formation. No assurance can be given that these estimates are, or that the forecasts and projections will prove to be, accurate. These estimates, forecasts and projections are based on data (including third-party data), significant assumptions, proprietary methodologies and the experience and judgment of JBREC. No assurance can be given regarding the accuracy or appropriateness of the assumptions and judgments made, or the methodologies used, by JBREC. The application of alternative assumptions, judgments or methodologies could result in materially less favorable estimates, forecasts and projections than those contained in this market study. Other real estate experts have different views regarding these forecasts and projections that may be more positive or negative, including in terms of the timing, magnitude and direction of future changes.
135
The forecasts and projections are forward-looking statements and involve risks and uncertainties that may cause actual results to be materially different from the projections. JBREC has made these forecasts and projections based on studying the historical and current performance of the residential housing market and applying JBREC’s qualitative knowledge about the residential housing market. The future is difficult to predict, particularly given that the economy and housing markets can be cyclical, subject to changing consumer and market psychology, geo-political events, and governmental policies related to mortgage regulations and interest rates. There will usually be differences between projected and actual outcomes, because events and circumstances frequently do not occur as expected, and the differences may be material. Accordingly, the forecasts and projections included in this market study might not occur or might occur to a different extent or at a different time. For the foregoing reasons, JBREC cannot provide any assurance that the estimates, forecasts and projections contained in this market study are accurate, actual outcomes may vary significantly from those contained or implied by the forecasts and projections, and you should not place undue reliance on these estimates, forecasts and projections. Except as required by law, we are not obligated to, and do not intend to, update the statements in this prospectus to conform to actual outcomes or changes in our or JBREC’s expectations. See “Risk Factors—Risks Related to Our Business—The estimates, forecasts and projections relating to our markets prepared by JBREC are based upon numerous assumptions and may not prove to be accurate.”
136
Exhibit D
[See attached]
AMENDMENT NO. 1 TO SUPPLEMENT TO AMENDED AND RESTATED LIMITED
LIABILITY COMPANY AGREEMENT
This Amendment No. 1 to Supplement to Amended and Restated Limited Liability Company Agreement, dated July , 2013 (this “Amendment No. 1”), of The New Home Company LLC, a Delaware limited liability company (the “Company”), is by and among TNHC Partners LLC, a Delaware limited liability company (“TNHC Partners”), IHP Capital Partners VI, LLC, a Delaware limited liability company (“IHP”), Watt/TNHC LLC, a California limited liability company (“Watt”), and TCN/TNHC LP, a Delaware limited partnership (“Tricon”), as the members (each a “Member” and collectively the “Members”) of the Company, with reference to the following facts:
A. On or about June 25, 2009, the Certificate of Formation for the Company, was filed with the Secretary of State of the State of Delaware.
B. The Members are parties to that certain Amended and Restated Limited Liability Company Agreement of the Company, dated August 18, 2010 (the “Original Agreement”), as amended by that certain First Amendment to Amended and Restated Limited Liability Company Agreement of the Company, dated December 20, 2010 (the “First Amendment”), that certain Second Amendment to Amended and Restated Limited Liability Company Agreement of the Company, dated February 20, 2012 (the “Second Amendment”), that certain Third Amendment to Amended and Restated Limited Liability Company Agreement of the Company, dated January 25, 2013 (the “Third Amendment”), and that certain Fourth Amendment to Amended and Restated Limited Liability Company Agreement, dated April 16, 2013 (the “Fourth Amendment”), and collectively, the Original Agreement, the First Amendment, the Second Amendment, the Third Amendment and the Fourth Amendment are referred to as the “LLC Agreement”), and the Members are parties to that Supplement to Amended and Restated Limited Liability Company Agreement, dated June 13, 2013 (the “Supplement”) . All capitalized terms not otherwise defined herein shall have the meanings set forth in the LLC Agreement.
C. The Members desire to consummate an initial public offering (the “IPO”) of the Company’s shares of common stock (the “Common Stock”) following a conversion (the “Conversion”) of the Company from a Delaware limited liability company to a Delaware corporation.
D. The parties hereto desire to adopt and approve this Amendment No. 1 to the Supplement on the terms hereof.
NOW, THEREFORE, in consideration of the mutual covenants contained herein and other good and valuable consideration, the receipt and sufficiency of which are hereby acknowledged, each of the Members hereby agrees as follows:
1.Amendment and Restatement of Article 2. Article 2 of the Supplement is hereby amended and restated in its entirely as follows:
“Section 2.1Allocated Value. Following the Conversion and the pricing of the IPO, if the Allocated Value (as defined below) to
each of IHP, Watt and Tricon (each an “External Member” and collectively, the “External Members”) does not meet the Allocated Value requirements set forth in this Supplement, TNHC Partners shall transfer shares of Common Stock (the “Management Transfer”) it received pursuant to the Conversion and the pricing of the IPO to each of the External Members in accordance with the calculations set forth in this Supplement. For purposes of this Supplement, “Allocated Value” means the value of the shares of Common Stock received by each of the External Members in the Conversion and the pricing of the IPO (excluding the value of the shares of Common Stock received by the External Members associated with the capital raise related to the Fourth Amendment), calculated by multiplying the total number of shares of Common Stock received by such External Member in the Conversion and the pricing of the IPO (excluding the value of the shares of Common Stock received by the External Members associated with the capital raise related to the Fourth Amendment) by the price to the public of the shares of Common Stock sold in the IPO. It is understood that the number of shares of Common Stock received by an External Member in the Conversion and the pricing of the IPO excludes the value of the shares associated with the capital raise related to the Fourth Amendment because the Allocated Value does not, and is not intended to, take into account the value of the shares of Common Stock to be received by the External Members associated with the capital raise related to the Fourth Amendment.
Section 2.2Management Transfer. At or prior to the closing of the IPO, TNHC Partners shall effect the Management Transfer to each External Member as follows:
(a) If the Allocated Value is less than $27,500,000, such number of shares of Commons Stock that is necessary so that the Allocated Value after the Management Transfer is increased by 50% of the difference between the Allocated Value prior to the Management Transfer and $27,500,000; and
(b) If the Allocated Value immediately after the Management Transfer effected in accordance with Section 2.2(a) does not equal or exceed $25,000,000, such number of shares in addition to the shares of Common Stock transferred in accordance with Sections 2.2(a) as is necessary for the Allocated Value to equal $25,000,000 after the transfers in accordance with Section 2.2(a) and this Section 2.2(b).
In the event that the Allocated Value for each External Member exceeds $27,500,000 immediately after the pricing of the IPO,
2
there shall be no transfer of shares of Common Stock from TNHC Partners to the External Members pursuant to the Management Transfer.
Section 2.3Illustrative Calculations. For avoidance of doubt, attached hereto asExhibit A are calculations illustrating the computation of the Allocated Value.”
2.Consent and Approval. Each party executing this Amendment No. 1 consents to and approves all of the provisions of this Amendment No. 1.
3.Full Force and Effect. Except as modified hereby, the Supplement remains in full force and effect without modification.
4.Counterparts/Execution. This Amendment No. 1 may be executed in one or more counterparts, each of which shall be an original, but all of which taken together shall be deemed to be one instrument. Execution of this Amendment No. 1 may be made by signatures delivered by fax or electronic mail (to be followed by delivery of the hard copy original signatures, but effective upon the delivery of signatures by fax or electronic mail).
[SIGNATURE PAGES FOLLOW]
3
IN WITNESS WHEREOF, this Amendment has been executed effective as of the Effective Date.
TNHC PARTNERS LLC, a Delaware limited liability company | ||
| By: |
| |
| H. LAWRENCE WEBB, Manager | ||
| By: |
| |
| WAYNE J. STELMAR, Manager | ||
| By: |
| |
| JOSEPH D. DAVIS, Manager | ||
| By: |
| |
| THOMAS REDWITZ, Manager | ||
| IHP CAPITAL PARTNERS VI, LLC, | ||||||
| a Delaware limited liability company | ||||||
| By: | Institutional Housing Partners VI, L.P., | |||||
| a California limited partnership | ||||||
| Its Manager | ||||||
| By: | IHP Capital Partners | |||||
| a California corporation | ||||||
| Its General Partner | ||||||
| By: |
| |||||
| Print name: | ||||||
| Print title: | ||||||
| By: |
| |||||
| Print name: | ||||||
| Print title: | ||||||
| WATT/TNHC LLC, | ||
a California limited liability company | ||
By: |
| |
| Print name: | ||
| Print title: | ||
| TCN/TNHC LP, | ||||
| a Delaware limited partnership | ||||
| By: | TCN/TNHC GP LLC | |||
| a Delaware limited liability company | ||||
| Its General Partner | ||||
| By: |
| |||
| Print name: | ||||
| Print title: | ||||