Exhibit 99.1
CAUTIONARY STATEMENT CONCERNING FORWARD-LOOKING STATEMENTS
This offering circular and the documents that we incorporate by reference herein may contain “forward-looking statements” within the meaning of the Private Securities Litigation Reform Act of 1995 (set forth in Section 27A of the Securities Act, and Section 21E of the Securities Exchange Act of 1934, as amended (the “Exchange Act”)). Also, documents we subsequently file with the SEC and incorporate by reference may contain forward-looking statements.
These forward-looking statements include statements relating to our anticipated financial performance, business prospects, consummation of the transactions contemplated by this offering circular, the use of proceeds, and/or statements preceded by, followed by or that include the words “believe,” “anticipate,” “intend,” “estimate,” “expect,” “project,” “could,” “plans,” “seeks” and similar expressions. These forward-looking statements speak only as of the dates stated and we do not undertake any obligation to update or revise publicly any forward-looking statements, whether as a result of new information, future events or otherwise, even if experience or future events make it clear that any expected results expressed or implied by these forward-looking statements will not be realized. Although we believe that the expectations reflected in these forward-looking statements are reasonable, these expectations may not prove to be correct or we may not achieve the financial results, savings or other benefits anticipated in the forward-looking statements. These forward-looking statements are necessarily estimates reflecting the best judgment of our senior management and involve a number of risks and uncertainties, some of which may be beyond our control, including significant business, economic, competitive, regulatory and other risks and uncertainties. If any of those risks and uncertainties materialize, actual results could differ materially from those discussed in any such forward-looking statement. Among the factors that could cause actual results to differ materially from those discussed in forward-looking statements are those discussed under the heading “Risk Factors” in this offering circular, as well as in our other reports filed from time to time with the SEC. These factors include, but are not limited to:
| | • | | economic changes either nationally or in the markets in which we operate, including declines in employment, volatility of mortgage interest rates and inflation; |
| | • | | our geographic concentration in California; |
| | • | | shortages of or increased prices for labor, land or raw materials used in housing construction; |
| | • | | a downturn in the homebuilding industry; |
| | • | | volatility and uncertainty in the credit markets and broader financial markets; |
| | • | | our business and investment strategy; |
| | • | | availability of land to acquire and our ability to acquire such land on favorable terms or at all; |
| | • | | our liquidity and availability, terms and deployment of capital; |
| | • | | the loss of any of our customers with whom our fee building business is concentrated; |
| | • | | delays in land development or home construction resulting from adverse weather conditions, regulatory approval delays or other events outside our control; |
| | • | | product liability, warranty and construction defect claims; |
| | • | | our customers’ abilities to obtain mortgage financing; |
| | • | | issues concerning our joint venture partnerships; |
| | • | | the cost and availability of insurance and surety bonds; |
| | • | | changes in, or the failure or inability to comply with, governmental laws and regulations; |
| | • | | the timing of receipt of regulatory approvals and the opening of projects; |
1
| | • | | the degree and nature of our competition; |
| | • | | our leverage and debt service obligations; |
| | • | | restrictive covenants relating to our operations in our current or future debt arrangements, including the notes offered hereby; |
| | • | | availability of qualified personnel and subcontractors and our ability to retain our key personnel; |
| | • | | the impact of recent accounting standards; and |
| | • | | additional factors set forth under “Risk Factors” included herein, as well as those factors or conditions described under “Management’s Discussion and Analysis of Financial Condition and Results of Operations” and “Risk Factors,” in each case in our Annual Report on Form 10-K for the year ended December 31, 2016 and in subsequent filings with the SEC, incorporated by reference in this offering circular. |
MARKET DATA
Market data and competitive position data used throughout or incorporated by reference in this offering circular are based on the good faith estimates of management, which estimates are based upon their review of internal surveys, independent industry publications and other publicly available information. These sources generally state that the information they provide has been obtained from sources believed to be reliable, but that the accuracy and completeness of the information are not guaranteed. We have not independently verified the data obtained from these sources. Forecasts and other forward-looking information obtained from these sources are subject to the same qualifications and additional uncertainties regarding the other forward-looking statements in this offering circular. See “Cautionary Statement Concerning Forward-Looking Statements.”
2
SUMMARY
This summary contains basic information about our business and this offering and highlights selected information contained elsewhere in this offering circular or in documents incorporated by reference. This summary is not complete and does not contain all of the information that you should consider before deciding whether or not to invest in the notes offered hereby. For a more complete understanding of our business and this offering before making an investment decision, you should read this entire offering circular, especially the description of the terms and conditions of the notes discussed under “Description of the Notes” and the risks discussed under “Risk Factors” included in, or otherwise incorporated by reference in, this offering circular, as well as the consolidated financial statements and notes and other information included elsewhere or incorporated by reference in this offering circular.
Company Overview
We are a new generation homebuilder focused on the design, construction and sale of innovative and consumer-driven homes in major metropolitan areas within select growth markets in California and Arizona, including coastal Southern California, the San Francisco Bay area, metro Sacramento and the greater Phoenix area. We also seek to create unique communities via our significant land entitlement and development expertise.
We were founded in August 2009, towards the end of an unprecedented downturn in the U.S. homebuilding industry. In January 2014, we completed our initial public offering of shares of our common stock. We believe our management team, led by our CEO, Larry Webb, has extensive and complementary construction, design, marketing, development and entitlement expertise, as well as strong relationships with key land sellers within each of our local markets, and a reputation for quality building, which provide a competitive advantage in being able to acquire land, participate in and create masterplans, obtain entitlements and build quality homes.
We focus on identifying unique sites and creating communities that allow us to design, construct and sell consumer-driven single-family detached and attached homes where we are rewarded for thoughtful land planning and architecture. Additional defining characteristics of our markets include barriers to entry, job growth, high employment to building permit ratios and increasing populations, which can create growing demand for new housing. Our management team has deep local market knowledge of the California homebuilding, land planning and development business. We perform extensive consumer research that helps us create land plans and design homes that meet the needs and desires of our targeted buyers. We believe our approach to market research, architectural design and construction expertise across an extensive range of product offerings allow us the flexibility to pursue a wide array of land acquisition opportunities that appeal to a broad range of potential homebuyers, including entry-level, move-up, move-down and luxury customers. The homes that we and our unconsolidated joint ventures are building range in price from approximately $300,000 to over $9 million, with home sizes ranging from approximately 800 to 6,200 square feet. We believe that customer-focused community creation and product development is a key component of the lifestyle connection we seek to establish with each homebuyer.
Additionally, we strive to enhance the home-buying experience and buyers’ personal investment in their homes by actively engaging them in the selection of design options and upgrades. We believe that our on-site design studios, which allow buyers to personalize our home offerings, are a key source of competitive differentiation and often contribute to greater profitability and fewer cancellations. In addition to our on-site design studios, we also believe our emphasis on customer care provides us a competitive advantage. In 2013, 2014 and 2015 we were awarded the Eliant Homebuyers’ Choice Award for Best Overall Customer Care Experience. Our commitment to customer satisfaction is a key element of our company culture, which fosters an environment where team members can innovate. We believe our reputation for high quality, differentiated architecture and design, as well as high customer satisfaction and company culture, enhances our overall financial performance and generates increased customer loyalty.
We seek to maximize returns and reduce exposure to land risk through the use of land options, joint ventures and other flexible land acquisition arrangements. We believe our lot option and joint venture strategy is an important factor
3
in allowing us to leverage our entity-level capital and returns on equity, participate in and develop larger masterplan communities, and establish a homebuilding platform focused on high-growth, land-constrained markets. In addition, we believe that our professional reputation and long-standing relationships with key land sellers, including masterplan community developers, brokers and other builders, as well as our joint venture partners, enable us to acquire well-positioned land parcels through favorable structures in our existing markets as well as new target markets.
Industry and Market Overview
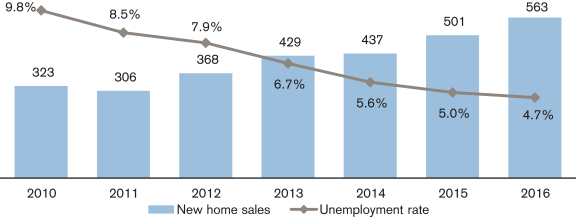
Since the global financial crisis in 2008, the U.S. housing market has experienced steady growth and has gained momentum amidst a more supportive macro-economic backdrop. As of December 2016, the U.S. unemployment rate, according to the U.S. Census Bureau, was 4.7%, while in January 2010 the U.S. unemployment rate stood at 9.8%. Similarly, the University of Michigan Consumer Sentiment Index in January 2017 measured an approximate 32% improvement compared to January 2010. During the housing recovery, home buyers have taken advantage of low interest rates, favorable home affordability and improving economic conditions. New home sales in January 2017 were reported at a seasonally adjusted annual rate of 536,000, a gain of approximately 55% over the same time period in 2010, according to the U.S. Census Bureau. Similarly, from November 2015 to November 2016, house prices across the United States gained an average of 6.1% according to the Federal Housing Finance Agency, and have increased at a compound annual growth rate of 4.5% since November 2010. According to the U.S. Census Bureau, despite momentum in the U.S. housing market, new home sales still remain well below long term historical levels, while affordability and availability of financing remain favorable, implying room for continued growth.
New home sales (in thousands) overlay with U.S. unemployment rate
Housing industry conditions within our markets
We currently operate in the western United States with three homebuilding divisions: Southern California, Northern California and, our newest division, Arizona, which was established in 2015. Our markets are characterized by positive employment trends, growing populations and high barriers to entry. From December 2015 to December 2016, according to the Bureau of Labor Statistics, the United States recorded a reduction in the unemployment rate of 0.3%, while according to the Federal Reserve Bank of St. Louis for the same period, California recorded a reduction of 0.7% and Arizona 1.1%, all on a seasonally adjusted basis. This strength in employment, most notably in California, has been a key driver of California’s outperformance with an employment to permit ratio of 3.7x as of February 2017, according to market data compiled by Meyers Research.
Similarly, according to the Federal Reserve Bank of St. Louis, from January 2010 to January 2015, the United States recorded population growth of approximately 3.9%, while California grew by approximately 4.5%
4
and Arizona by approximately 6.4%. As of December 2016, according to the U.S. Census Bureau, California is the most populous state and Arizona ranked fifth in numeric change of population growth year-over-year. Furthermore, according to the U.S. Census Bureau, California added approximately 332,500 jobs in 2016, accounting for approximately 16% of the total non-farm payroll growth in the United States during the year.
California’s population growth and improved employment levels are reflected in the year-over-year increase in residential building permits issued. From December 2015 to December 2016, California measured an increase of approximately 11.0% in residential building permits issued, significantly outpacing the approximate 8.0% increase experienced in the United States as a whole. Over the same time period, Arizona increased its residential building permits issued by approximately 8.0%, in-line with the broader U.S. average.
Specifically within our core markets of coastal Southern California, the San Francisco Bay area, metro Sacramento and the greater Phoenix area, we are observing positive underlying demographic and economic fundamentals that support our homebuilding business.
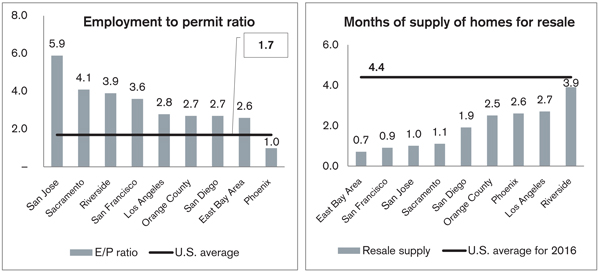
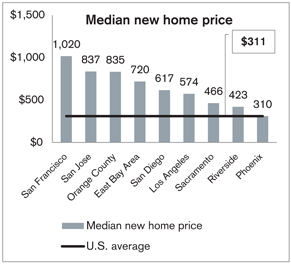
Source: John Burns Real Estate Consulting, as of December 2016.
5
Our Strengths
We believe the following strengths provide us with a significant competitive advantage in implementing our business strategy:
Flexible and complementary homebuilding and fee building business units
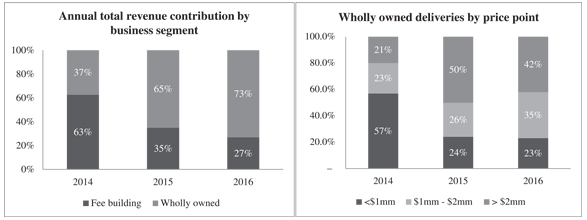
We are uniquely structured with two core business units: homebuilding and fee building. Our homebuilding operations also include our unconsolidated joint ventures. The combination of these business units has been instrumental in enabling us to efficiently leverage our capital, participate in and develop larger, master planned communities and establish a marquee homebuilding platform within our high-growth, high barrier-to-entry and land-constrained submarkets. In 2016, our wholly owned homebuilding business generated $508 million of revenue, our fee building business generated $187 million of revenue and our share of our unconsolidated joint ventures generated $8 million in pretax income. Our wholly owned business, which we have strategically focused on expanding since our initial public offering, is the foundation of our operations and creates returns through the sale of homes with an emphasis on acquiring finished lots on favorable lot option or phased takedown terms. In addition, we develop raw and partially improved land parcels. Our opportunistic joint venture investments allow us to participate in larger, more capital intensive developments and provides another source of lots for our homebuilding business. The fee building business allows us to generate additional cash flow and profits utilizing nominal capital, leverage our SG&A through the construction of homes on behalf of landowners, strengthens our relationships with masterplan developers, and, we believe, gives us access to a number of the best trade partners in our markets given the scale of our operations.
Focus on attractive growth markets in California and Arizona
We are currently focused on identifying well-located sites and creating communities that allow us to design, construct and sell consumer-driven homes in major metropolitan areas in Southern California, the San Francisco Bay area, metro Sacramento and the greater Phoenix area. Given our existing land positions, strong local relationships, reputation for quality building and ability to source accretive land acquisition opportunities, we believe our business is well positioned to capitalize on the housing market expansion underway in these markets. Certain defining characteristics of our markets include land constraints, barriers to entry, job growth and increasing populations, which can create growing demand for new housing. Operating in our core markets enables us to continually improve our market share and strengthen profitability. Moreover, our management team has deep local market knowledge of the homebuilding, land planning and development businesses in our markets. We believe this experience and our strong relationships with local market participants also enables us to source finished or improved lots, as well as unimproved land parcels, which we would seek to entitle and develop. In addition to pursuing growth opportunities in our California and Arizona markets, we will also explore new markets with a diligent focus on maintaining our disciplined land acquisition strategy, the quality of our brand and the quality of our homes.
Diverse product capabilities to meet consumer demand
We consider ourselves to be a local market, consumer-driven homebuilder with expertise across a wide variety of product types and customer segments, including the entry-level, move-up, move-down and luxury customer segments. The homes that we and our unconsolidated joint ventures build range in price from approximately $300,000 to over $9 million, with homes ranging in size from 800 to 6,200 square feet. We have had the opportunity to strategically shift between targeted price points based on the markets in which we operate and the demand of our customers. We believe that our customer-focused community creation and product development, as well as exemplary customer service, are key components of the lifestyle connection we seek to establish with each home buyer.
6
In addition to understanding the key economic drivers of demand for new homes in our markets, we focus on understanding the pool of potential buyers, the product types sought by those buyers and the proper price point for the product types in each market. Through architects, consultants and homeowner focus groups for the various price points in our target markets, we study and aim to improve the design of our products, create land plans and design homes that meet the needs and desires of our specific targeted buyers. Our homes are competitively priced, but are not designed to be the lowest cost option in the market. Our core operating philosophy is to provide a positive, memorable experience for our home buyers by actively engaging with them in the building process, tailoring the product to the buyer’s lifestyle needs and enhancing communication, knowledge and satisfaction.
Conservative land management coupled with strong land development capabilities
We own and control strategic land positions in our core markets. As of December 31, 2016, we owned and controlled 1,576 lots to support our wholly owned business, representing approximately a 6.3 year supply based on our last twelve months home closings. In addition, we also controlled another 935 lots pursuant to our fee building contracts. We believe that our professional reputation and long-standing relationships with key land sellers, including master plan community developers, brokers and other builders, enable us to acquire well-positioned land parcels.
In an effort to mitigate land risk, we enter into land option contracts and phased takedown agreements when feasible. As of December 31, 2016, our lots under option accounted for approximately 63% of our wholly owned lots owned and controlled. As of December 31, 2016, our lot option deposits totaled $38 million and would require an additional $463 million to purchase all of our optioned land. If market conditions were to deteriorate, these option agreements give us the flexibility to terminate the option, generally only forfeiting our deposit. We also utilize joint ventures and other flexible land acquisition arrangements, such as land banks, to reduce our exposure to land risk.
Seasoned management team with deep land development expertise
Our executive management team has an average of over 25 years of managing and growing homebuilding companies. Their combined real estate industry experience includes land acquisition, entitlement, master-planned
7
community creation, land development, home construction, financing, marketing and sales of single-family detached and attached homes in communities in a variety of markets. Our current executive team, including Larry Webb, Tom Redwitz and John Stephens, along with the support and expertise of divisional senior management, closely manage the operational and financial aspects of our business and bring significant experience, market knowledge and expertise. Wayne Stelmar, our recently retired Chief Investment Officer and former Chief Financial Officer, will continue to provide strategic insight and expertise as a consultant and board member. In addition, Leonard Miller will join our executive team as Chief Operating Officer on March 13, 2017. Mr. Miller’s proven track record of operational excellence and leadership within the public homebuilding sector will be a significant asset to our company going forward.
We believe that our executive team’s extensive experience, relationships, local market knowledge and reputation provide us with a competitive advantage in being able to acquire land, create masterplans, obtain entitlements, build quality homes and complete projects on budget and on schedule. Additionally, our founders are personally invested in the success of the company, collectively owning approximately 12% of our shares outstanding as of December 31, 2016.
Our Strategies
Grow our wholly owned business
We believe that we have expertise in all of our markets, which supports our strategy to expand our wholly owned footprint. We continually review the allocation of capital among our markets, based on both aggregate demographic information and operating results. We use these results to focus our investments in markets where we believe we can increase our profitability and return on capital. As such, we principally seek expansion through organic growth. We recognize the importance of size and scale as a homebuilder, and fundamentally understand that in order to grow market share, drive revenues, generate operating leverage and expand margins, we must bolster our wholly owned operations, including expanding the price points that we serve.
During 2016, we grew our wholly owned home sales revenue by 81% over the prior year. Since our initial public offering in January 2014, we have grown our wholly owned community count from four to 15 communities as of year-end 2016. Our backlog has grown substantially; up 12% in terms of dollars at December 31, 2016 over the prior year end and the highest it has been at any year end in our history. Along with our continued focus on our wholly owned business, we will consider a wide range of options for new investment. Ultimately, our principal concerns are maintaining a conservative risk profile while generating solid returns for our stakeholders.
8
Offer a broad range of consumer-driven product offerings and a superior home buying experience
A key element of our strategy is to allow our customers to personalize their homes regardless of price point. Unlike many homebuilders with centralized locations to which buyers travel to select options and upgrades, our communities have on-site design centers with dedicated designers with deep knowledge of the attributes of the homes offered in the community. The specific options and upgrades available for the community, both structural and finishes, are selected by the buyers as they navigate the design process. In many cases, these options and upgrades can represent a meaningful part of the total purchase price of a home. We believe that the active participation of buyers in selecting options and upgrades results in buyers becoming more personally invested in their homes, ultimately resulting in fewer cancellations. With this “hands on” approach to home personalization, we have been able to achieve top tier gross margin dollars per home, as well as maintain one of the lowest cancellation rates relative to our peers. We also believe our diversified product strategy enables us to better serve a wide range of buyers, adapt quickly to changing market conditions and improve performance while strategically reducing risk.
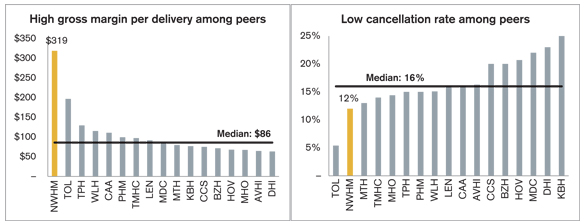
Note: Data in the above graphs is as of respective 2016 fiscal years, with the exception of the cancellation rate for WLH, which is for the nine months ended September 30, 2016.
Expand product and geographic diversity
Building on our success as a premier builder in the luxury market, we have embarked on a strategy to expand our wholly owned product offerings to include a higher concentration of affordably priced homes. These new neighborhoods will have all the hallmarks of a typical New Home community, with an emphasis on highly desirable locations, innovative architecture and state-of-the-art design, but will be priced at a level that will cater to a wider range of buyers. We believe that these new communities will be a great complement to our existing product portfolio and will allow us to continue to generate strong inventory turns as a result of higher absorption rates and shorter cycle times. Our strategic decision to acquire sites that will offer first time and first move-up product in highly desirable locations will allow us to address a deeper pool of buyers while continuing to be a category leader in the second move-up and luxury segments.
In tandem with our product diversification efforts, we are also exploring opportunities to expand our geographic footprint. While we believe there are ample opportunities to expand within our existing markets, we also believe that we are poised for growth in new and adjacent markets. Our recent move into the greater Phoenix area was our first expansion out of California and we expect to begin selling and delivering homes in that new market in 2017. We are also exploring additional markets that we believe exhibit the traits and qualities of our existing markets in California and Arizona.
9
Minimize land risk and increase returns through land options while also leveraging the strength of our land planning and development expertise
Consistent with our current land acquisition strategy, we plan to continue to seek out opportunities to purchase land utilizing options, which allow us to manage our land risk prudently while also increasing our return on capital. We also intend to leverage the strength of our land planning and land development expertise in each of our markets to add value to our land, capture incremental profit opportunities and provide a steady supply of lots to support the planned growth of our wholly owned business. We seek to acquire land where we believe our development and entitlement skills can help earn a risk-adjusted return that is accretive to our overall return profile and superior to other existing market opportunities.
Focus on our cost structure
Cost control throughout our business is a core element of our corporate culture. Our management team focuses on controlling costs and implementing measures designed to enhance our efficiency. We competitively bid each phase of development while maintaining strong relationships with our trade partners. We manage production schedules closely and, while respecting our valued relationships, require high accountability from our vendors and trade partners. As a result of our efforts, our SG&A as a percentage of home sales revenue for 2016 was 10.4%. Our fee building business, which includes joint venture management fees, absorbs a portion of our overhead costs and gives us a larger scale and operating efficiencies. In addition, fee building requires significantly lower capital while yielding attractive returns that are complementary to our wholly owned business segment.
Maintain a conservative balance sheet
We intend to utilize both debt and equity as part of our ongoing financing strategy, coupled with the redeployment of cash flow from continuing operations. We expect to employ prudent levels of leverage to finance the acquisition and development of our lots and construction of our homes. We believe that our strong balance sheet and liquidity leave us well positioned to support our ongoing operations and growth initiatives. We have consistently employed a financing strategy in which we seek to maintain a conservative capital structure that is aligned with our flexible business model. We believe that this offering of notes is a further evolution of our corporate finance strategy and provides long-term financing, while complementing the flexibility of our $260 million revolving credit facility. After giving effect to this offering and the use of proceeds therefrom, the notes will represent our only long-term debt. Following the application of the use of net proceeds, as of December 31, 2016, we would have had aggregate cash and revolving credit facility availability of approximately $418 million, which we believe to be sufficient for our working capital needs. Pro forma for the offering, our debt-to-book capitalization will be 50.1% and our net debt-to-book capitalization will be 26.2%. Although we are comfortable with our leverage following this offering, we will remain focused on reducing our cost of capital, while maintaining adequate liquidity and prudent leverage.
Corporate Information
The New Home Company Inc. was incorporated in Delaware in 2014 and our predecessor company was founded in 2009. Our principal executive offices are located at 85 Enterprise, Suite 450, Aliso Viejo, California 92656. Our main telephone number is (949) 382-7800.
10
Implications of Being an Emerging Growth Company
We are an “emerging growth company,” as defined in the Jumpstart Our Business Startups Act of 2012 (the “JOBS Act”), and we are eligible to take advantage of certain exemptions from various reporting requirements that are applicable to companies that are not “emerging growth companies.” These provisions include, among other matters:
| | • | | an exemption from the auditor attestation requirement in the assessment of our internal control over financial reporting; |
| | • | | reduced disclosure about our executive compensation arrangements; and |
| | • | | an exemption from the requirement to seek non-binding advisory votes on executive compensation and golden parachute arrangements. |
We have elected to adopt the reduced disclosure requirements available to emerging growth companies. As a result of these elections, the information that we incorporate in this offering circular may be different from the information you may receive from other public companies. In addition, it is possible that some investors will find the notes less attractive as a result of our elections, which may cause a less active trading market for the notes (if any) and more volatility in the value of the notes.
We will remain an “emerging growth company” until the earlier of (1) the last day of the fiscal year (a) following the fifth anniversary of the completion of our initial public offering (December 31, 2019), (b) in which we have total annual gross revenue of at least $1.0 billion or (c) in which we are deemed to be a large accelerated filer, which means, among other things, that the market value of our common stock that is held by non-affiliates is at least $700 million as of the last business day of our most recently completed second fiscal quarter, and (2) the date on which we have issued more than $1.0 billion in non-convertible debt during the prior three-year period.
11
SUMMARY CONSOLIDATED FINANCIAL DATA
The following table sets forth certain of our historical consolidated financial and other data. The summary historical consolidated financial and other data as of December 31, 2016, 2015 and 2014, and for the years ended December 31, 2016, 2015 and 2014 have been derived from our audited consolidated financial statements and the related notes included and incorporated by reference in this offering circular. Our historical results for any prior period are not necessarily indicative of results expected in any future period. The following information is a summary only and should be read together with our consolidated financial statements and the related notes included in this offering circular and incorporated herein by reference. See “Where You Can Find More Information.”
| | | | | | | | | | | | |
| | | Year Ended December 31, | |
| | | 2016 | | | 2015 | | | 2014 | |
| | | (dollars in thousands) | |
Statement of Operations Data | | | | | | | | | | | | |
Revenues: | | | | | | | | | | | | |
Home sales | | $ | 507,949 | | | $ | 280,209 | | | $ | 56,094 | |
Fee building, including management fees from unconsolidated joint ventures(1) | | | 186,507 | | | | 149,890 | | | | 93,563 | |
| | | | | | | | | | | | |
| | | 694,456 | | | | 430,099 | | | | 149,657 | |
| | | | | | | | | | | | |
Cost of Sales: | | | | | | | | | | | | |
Home sales | | | 433,559 | | | | 235,232 | | �� | | 46,843 | |
Home sales impairments | | | 2,350 | | | | — | | | | — | |
Land sales impairment | | | 1,150 | | | | — | | | | — | |
Fee building | | | 178,103 | | | | 139,677 | | | | 89,057 | |
| | | | | | | | | | | | |
| | | 615,162 | | | | 374,909 | | | | 135,900 | |
Gross Margin: | | | | | | | | | | | | |
Home sales | | | 72,040 | | | | 44,977 | | | | 9,251 | |
Land sales | | | (1,150 | ) | | | — | | | | — | |
Fee building | | | 8,404 | | | | 10,213 | | | | 4,506 | |
| | | | | | | | | | | | |
| | | 79,294 | | | | 55,190 | | | | 13,757 | |
Home sales gross margin percentage | | | 14.2 | % | | | 16.1 | % | | | 16.5 | % |
Fee building gross margin percentage | | | 4.5 | % | | | 6.8 | % | | | 4.8 | % |
Selling and marketing expenses | | | (26,744 | ) | | | (13,741 | ) | | | (3,983 | ) |
General and administrative expenses | | | (25,882 | ) | | | (20,278 | ) | | | (12,420 | ) |
Equity in net income of unconsolidated joint ventures | | | 7,691 | | | | 13,767 | | | | 8,443 | |
Other expense, net | | | (409 | ) | | | (1,027 | ) | | | (794 | ) |
| | | | | | | | | | | | |
Income before income taxes | | | 33,950 | | | | 33,911 | | | | 5,003 | |
Provision for income taxes | | | (13,024 | ) | | | (12,533 | ) | | | (246 | ) |
| | | | | | | | | | | | |
Net income | | | 20,926 | | | | 21,378 | | | | 4,757 | |
Net loss attributable to noncontrolling interest | | | 96 | | | | 310 | | | | 30 | |
| | | | | | | | | | | | |
Net income attributable to The New Home Company Inc. | | $ | 21,022 | | | $ | 21,688 | | | $ | 4,787 | |
| | | | | | | | | | | | |
Other Financial Data (unaudited): | | | | | | | | | | | | |
Total interest incurred | | $ | 7,484 | | | $ | 4,722 | | | $ | 1,857 | |
Adjusted homebuilding gross margin(2) | | | 79,721 | | | | 47,488 | | | | 9,783 | |
Adjusted homebuilding gross margin percentage(2) | | | 15.7 | % | | | 16.9 | % | | | 17.4 | % |
Adjusted EBITDA(3) | | $ | 43,240 | | | $ | 46,519 | | | $ | 6,619 | |
Adjusted EBITDA margin percentage(3) | | | 6.2 | % | | | 10.8 | % | | | 4.4 | % |
Ratio of Adjusted EBITDA to total interest incurred(3) | | | 5.8x | | | | 9.9x | | | | 3.6x | |
12
| | | | | | | | | | | | |
| | | Year Ended December 31, | |
| | | 2016 | | | 2015 | | | 2014 | |
| | | (dollars in thousands) | |
Operating data: | | | | | | | | | | | | |
Selling communities at end of period | | | 15 | | | | 10 | | | | 4 | |
Number of net new home orders | | | 253 | | | | 174 | | | | 79 | |
New homes delivered | | | 250 | | | | 148 | | | | 53 | |
Average sales price of homes delivered | | $ | 2,032 | | | $ | 1,893 | | | $ | 1,058 | |
Cancellation rate | | | 12 | % | | | 10 | % | | | 13 | % |
Backlog (number of homes) | | | 79 | | | | 67 | | | | 41 | |
Backlog (dollar value) | | $ | 187,296 | | | $ | 166,567 | | | $ | 86,711 | |
| | | | | | | | | | | | | | | | |
| | | December 31, 2016 | | | December 31, | |
| | | Actual | | | As
Adjusted(4) | | | 2015 | | | 2014 | |
Consolidated Balance Sheet Data | | | | | | | | | | | | | | | | |
Cash and cash equivalents(5) | | $ | 30,496 | | | $ | 157,621 | | | $ | 45,874 | | | $ | 44,058 | |
Real estate inventories owned(6) | | | 286,928 | | | | 286,928 | | | | 200,636 | | | | 157,629 | |
Investment in and advances to unconsolidated joint ventures | | | 50,857 | | | | 50,857 | | | | 60,572 | | | | 60,564 | |
Total assets | | | 419,136 | | | | 546,261 | | | | 351,270 | | | | 291,958 | |
Total debt | | | 118,000 | | | | 245,125 | | | | 83,082 | | | | 113,751 | |
Total liabilities | | | 174,512 | | | | 301,637 | | | | 129,573 | | | | 141,532 | |
Total The New Home Company Inc. stockholders’ equity | | | 244,523 | | | | 244,523 | | | | 220,775 | | | | 148,084 | |
Select Credit Statistics: | | | | | | | | | | | | | | | | |
Ratio of inventory, investments in unconsolidated joint ventures and cash and cash equivalents-to-total debt | | | 3.1x | | | | 2.0x | | | | 3.7x | | | | 2.3x | |
Ratio of debt-to-capital | | | 32.5 | % | | | 50.1 | % | | | 27.3 | % | | | 43.4 | % |
Ratio of net debt-to-capital(7) | | | 26.2 | % | | | 26.2 | % | | | 14.3 | % | | | 31.9 | % |
| (1) | Management fees from unconsolidated joint ventures were $8.2 million, $12.4 million and $9.6 million, for the years ended December 31, 2016, 2015 and 2014, respectively. |
| (2) | Adjusted homebuilding gross margin and adjusted homebuilding gross margin percentage are non-GAAP measures. The following table reconciles homebuilding gross margin and homebuilding gross margin percentage, as reported and prepared in accordance with GAAP, to the non-GAAP measures adjusted homebuilding gross margin and adjusted homebuilding gross margin percentage. The adjusted homebuilding gross margin percentage is calculated by dividing adjusted homebuilding gross margin by home sales revenue for a given period. We believe this information is meaningful, as it isolates the impact home sales impairments and leverage have on homebuilding gross margin and permits investors to make better comparisons with our competitors, who adjust gross margins in a similar fashion. |
| | | | | | | | | | | | |
| | | Year Ended December 31, | |
| | | 2016 | | | 2015 | | | 2014 | |
| | | (dollars in thousands) | |
Home sales revenue | | $ | 507,949 | | | $ | 280,209 | | | $ | 56,094 | |
Cost of home sales | | | 435,909 | | | | 235,232 | | | | 46,843 | |
| | | | | | | | | | | | |
Homebuilding gross margin | | | 72,040 | | | | 44,977 | | | | 9,251 | |
Add: Home sales impairments | | | 2,350 | | | | — | | | | — | |
| | | | | | | | | | | | |
Homebuilding gross margin before impairments | | | 74,390 | | | | 44,977 | | | | 9,251 | |
Add: interest in cost of home sales | | | 5,331 | | | | 2,511 | | | | 532 | |
| | | | | | | | | | | | |
Adjusted homebuilding gross margin | | $ | 79,721 | | | $ | 47,488 | | | $ | 9,783 | |
| | | | | | | | | | | | |
Adjusted homebuilding gross margin percentage | | | 15.7 | % | | | 16.9 | % | | | 17.4 | % |
13
| (3) | Adjusted EBITDA, adjusted EBITDA margin percentage and the ratio of adjusted EBITDA to total interest incurred are non-GAAP measures. Adjusted EBITDA means net income attributable to us (plus cash distributions of income from unconsolidated joint ventures) before (a) income taxes, (b) interest expense, (c) amortization of previously capitalized interest included in cost of sales or other expense, (d) non-cash impairment charges and abandoned project costs, (e) gain (loss) on extinguishment of debt, (f) depreciation and amortization, (g) amortization of equity-based compensation and (h) income (loss) from unconsolidated joint ventures. Adjusted EBITDA margin percentage is calculated by dividing adjusted EBITDA by total revenue for a given period. The ratio of adjusted EBITDA to total interest incurred is calculated by dividing adjusted EBITDA by total interest incurred for a given period. Other companies may calculate adjusted EBITDA differently. Adjusted EBITDA is presented herein because management believes the presentation provides useful information to our investors regarding our financial condition and results of operations because adjusted EBITDA is a widely utilized indicator of a company’s operating performance. Adjusted EBITDA should not be considered as an alternative for net income, cash flows from operating activities and other consolidated income or cash flow statement data prepared in accordance with GAAP or as a measure of profitability or liquidity. A reconciliation of net income attributable to us to adjusted EBITDA, adjusted EBITDA margin percentage and the ratio of adjusted EBITDA to total interest incurred is provided in the following table. |
| | | | | | | | | | | | |
| | | Year Ended December 31, | |
| | | 2016 | | | 2015 | | | 2014 | |
| | | (dollars in thousands) | |
Net income attributable to The New Home Company Inc. | | $ | 21,022 | | | $ | 21,688 | | | $ | 4,787 | |
Interest amortized to cost of sales and other expense | | | 5,331 | | | | 2,596 | | | | 532 | |
Provision for income taxes | | | 13,024 | | | | 12,533 | | | | 246 | |
Depreciation and amortization | | | 511 | | | | 473 | | | | 381 | |
| | | | | | | | | | | | |
EBITDA | | | 39,888 | | | | 37,290 | | | | 5,946 | |
Add: amortization of equity-based compensation | | | 3,471 | | | | 3,884 | | | | 2,322 | |
Add: cash distributions of income from unconsolidated joint ventures | | | 3,742 | | | | 18,477 | | | | 6,040 | |
Add: non-cash impairments | | | 3,500 | | | | — | | | | — | |
Add: abandoned project costs | | | 580 | | | | 635 | | | | 754 | |
Less: gain from notes payable principal reduction | | | 250 | | | | — | | | | — | |
Less: income from unconsolidated joint ventures | | | 7,691 | | | | 13,767 | | | | 8,443 | |
| | | | | | | | | | | | |
Adjusted EBITDA | | $ | 43,240 | | | $ | 46,519 | | | $ | 6,619 | |
| | | | | | | | | | | | |
Adjusted EBITDA margin percentage | | | 6.2 | % | | | 10.8 | % | | | 4.4 | % |
| | | | | | | | | | | | |
Ratio of adjusted EBITDA to total interest incurred | | | 5.8x | | | | 9.9x | | | | 3.6x | |
| (4) | Gives effect to the sale by us of $250.0 million in aggregate principal amount of notes in this offering and the anticipated use of net proceeds thereof as described in “Use of Proceeds.” |
| (5) | Cash and cash equivalents, as of December 31, 2016 on an as adjusted basis, reflects our receipt of the estimated net proceeds from this offering in excess of the repayment of all borrowings outstanding under our revolving credit facility as of December 31, 2016. As of December 31 2016, we had $118.0 million of borrowings outstanding under our revolving credit facility. As of March 3, 2017, we had $169.0 million of borrowings outstanding under our revolving credit facility. |
| (6) | Effective July 1, 2016, certain capitalizable selling and marketing costs were reclassified to other assets from real estate inventories. Prior year periods have been reclassified to conform to current year presentation. $9.3 million and $5.9 million, was reclassified from real estate inventories to other assets for the years ended December 31, 2015 and 2014, respectively. |
14
| (7) | Net debt-to-capital is a non-GAAP measure. The following table reconciles our ratio of debt-to-capital to the non-GAAP ratio of net debt-to-capital. The ratio of debt-to-capital is computed as the quotient obtained by dividing total debt by the sum of total debt plus equity, exclusive of noncontrolling interest. The ratio of net debt-to-capital is computed as the quotient obtained by dividing net debt (which is total debt less cash to the extent necessary to reduce the debt balance to zero) by total capital, exclusive of noncontrolling interest. The most directly comparable GAAP financial measure is the ratio of debt-to-capital. We believe the ratio of net debt-to-capital is a relevant financial measure for investors to understand the leverage employed in our operations and as an indicator of our ability to obtain financing. We believe that by deducting our cash from our total debt, we provide a measure of our indebtedness that takes into account our cash liquidity. We believe this provides useful information as the ratio of debt-to-capital does not take into account our liquidity and we believe that the ratio net of cash provides supplemental information by which our financial position may be considered. Investors may also find this to be helpful when comparing our leverage to the leverage of our competitors that present similar information. |
| | | | | | | | | | | | | | | | |
| | | December 31, 2016 | | | | | | | |
| | | Actual | | | As Adjusted(4) | | | December 31,
2015 | | | December 31,
2014 | |
| | | (dollars in thousands) | | | | |
Total debt | | $ | 118,000 | | | $ | 245,125 | | | $ | 83,082 | | | $ | 113,751 | |
Equity, exclusive of noncontrolling interest | | | 244,523 | | | | 244,523 | | | | 220,775 | | | | 148,084 | |
| | | | | | | | | | | | | | | | |
Total capital | | $ | 362,523 | | | $ | 489,648 | | | $ | 303,857 | | | $ | 261,835 | |
| | | | | | | | | | | | | | | | |
Ratio of debt-to-capital | | | 32.5 | % | | | 50.1 | % | | | 27.3 | % | | | 43.4 | % |
| | | | | | | | | | | | | | | | |
Total debt | | | 118,000 | | | | 245,125 | | | $ | 83,082 | | | $ | 113,751 | |
Less: cash, cash equivalents and restricted cash | | | 31,081 | | | | 158,206 | | | | 46,254 | | | | 44,340 | |
| | | | | | | | | | | | | | | | |
Net debt | | | 86,919 | | | | 86,919 | | | | 36,828 | | | | 69,411 | |
Equity, exclusive of noncontrolling interest | | | 244,523 | | | | 244,523 | | | | 220,775 | | | | 148,084 | |
| | | | | | | | | | | | | | | | |
Total capital | | $ | 331,442 | | | $ | 331,442 | | | $ | 257,603 | | | $ | 217,495 | |
| | | | | | | | | | | | | | | | |
Ratio of net debt-to-capital | | | 26.2 | % | | | 26.2 | % | | | 14.3 | % | | | 31.9 | % |
| | | | | | | | | | | | | | | | |
15