Exhibit 99.1
|
CORPORATE PRESENTATION
Encana Corporation
October 2014
|
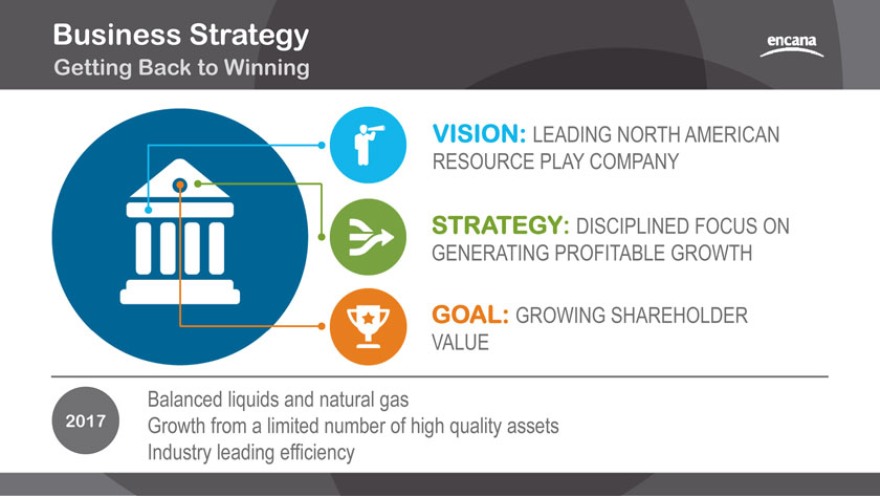
Business Strategy
Getting Back to Winning
VISION: LEADING NORTH AMERICAN RESOURCE PLAY COMPANY
STRATEGY: DISCIPLINED FOCUS ON GENERATING PROFITABLE GROWTH
GOAL: GROWING SHAREHOLDER VALUE
2017
Balanced liquids and natural gas
Growth from a limited number of high quality assets Industry leading efficiency
|
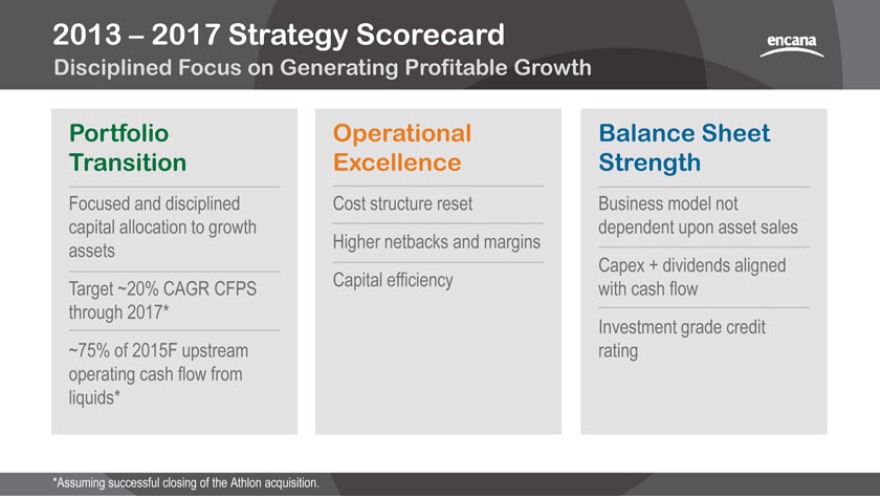
2013 2017 Strategy Scorecard
Disciplined Focus on Generating Profitable Growth
Portfolio Transition
Focused and disciplined capital allocation to growth assets Target ~20% CAGR CFPS through 2017* ~75% of 2015F upstream operating cash flow from liquids*
Operational Excellence
Cost structure reset
Higher netbacks and margins Capital efficiency
Balance Sheet Strength
Business model not dependent upon asset sales Capex + dividends aligned with cash flow Investment grade credit rating
*Assuming successful closing of the Athlon acquisition.
|
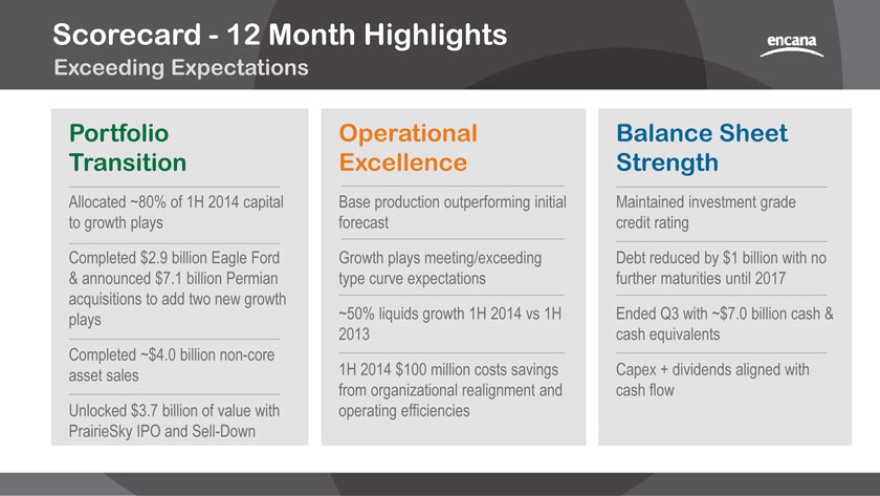
Scorecard—12 Month Highlights
Exceeding Expectations
Portfolio Transition
Allocated ~80% of 1H 2014 capital to growth plays Completed $2.9 billion Eagle Ford & announced $7.1 billion Permian acquisitions to add two new growth plays Completed ~$4.0 billion non-core asset sales Unlocked $3.7 billion of value with PrairieSky IPO and Sell-Down
Operational Excellence
Base production outperforming initial forecast Growth plays meeting/exceeding type curve expectations ~50% liquids growth 1H 2014 vs 1H 2013
1H 2014 $100 million costs savings from organizational realignment and operating efficiencies
Balance Sheet Strength
Maintained investment grade credit rating Debt reduced by $1 billion with no further maturities until 2017 Ended Q3 with ~$7.0 billion cash & cash equivalents Capex + dividends aligned with cash flow
|
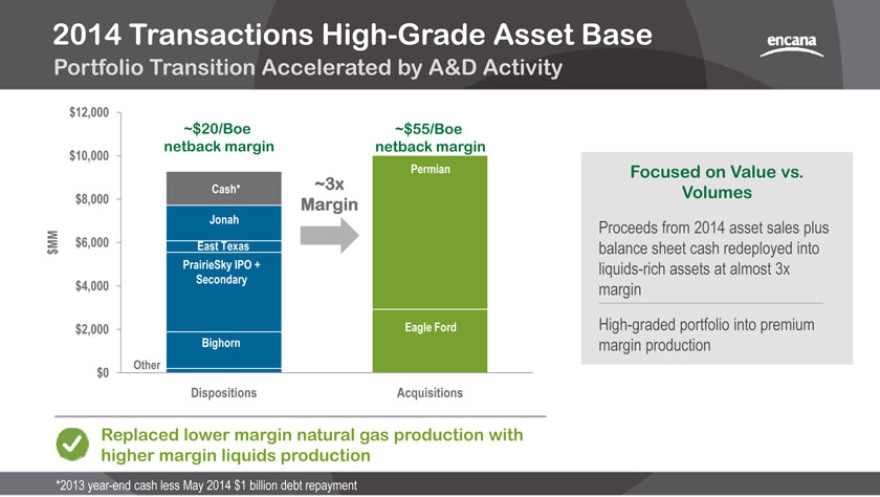
2014 Transactions High-Grade Asset Base
Portfolio Transition Accelerated by A&D Activity
$12,000
~$20/Boe ~$55/Boe netback margin netback margin $10,000
Permian Cash* ~3x $8,000 Margin
Jonah MM $6,000 East Texas $
PrairieSky IPO + $4,000 Secondary
$2,000 Eagle Ford Bighorn
Other $0
Dispositions Acquisitions
Focused on Value vs. Volumes
Proceeds from 2014 asset sales plus balance sheet cash redeployed into liquids-rich assets at almost 3x margin High-graded portfolio into premium margin production
Replaced lower margin natural gas production with higher margin liquids production
*2013 year-end cash less May 2014 $1 billion debt repayment
|
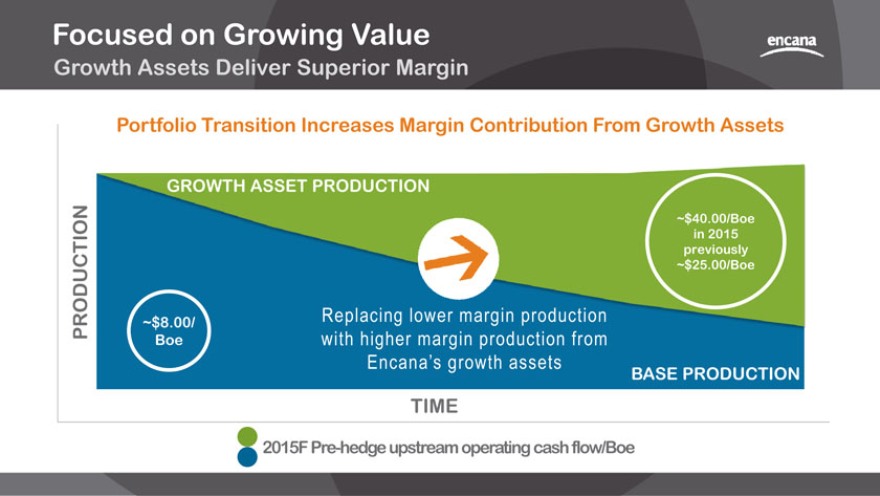
Focused on Growing Value
Growth Assets Deliver Superior Margin
Portfolio Transition Increases Margin Contribution From Growth Assets
PRODUCTION
GROWTH ASSET PRODUCTION
~$8.00/ Boe
Replacing lower margin production with higher margin production from Encana’s growth assets
~$40.00/Boe in 2015 previously
~$25.00/Boe
BASE PRODUCTION
TIME
2015F Pre-hedge upstream operating cash flow/Boe
|
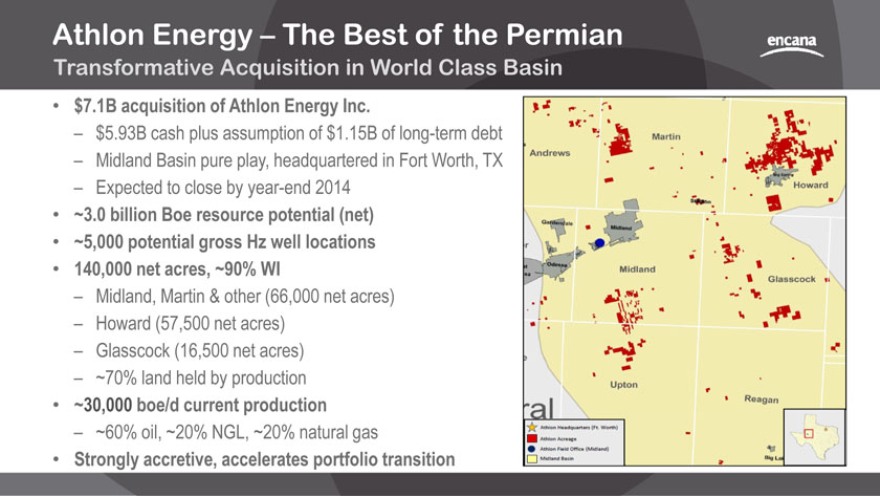
Athlon Energy The Best of the Permian
Transformative Acquisition in World Class Basin
$7.1B acquisition of Athlon Energy Inc.
$5.93B cash plus assumption of $1.15B of long-term debt
Midland Basin pure play, headquartered in Fort Worth, TX
Expected to close by year-end 2014
~3.0 billion Boe resource potential (net)
~5,000 potential gross Hz well locations
140,000 net acres, ~90% WI
Midland, Martin & other (66,000 net acres)
Howard (57,500 net acres)
Glasscock (16,500 net acres)
~70% land held by production
~30,000 boe/d current production
~60% oil, ~20% NGL, ~20% natural gas
Strongly accretive, accelerates portfolio transition
|
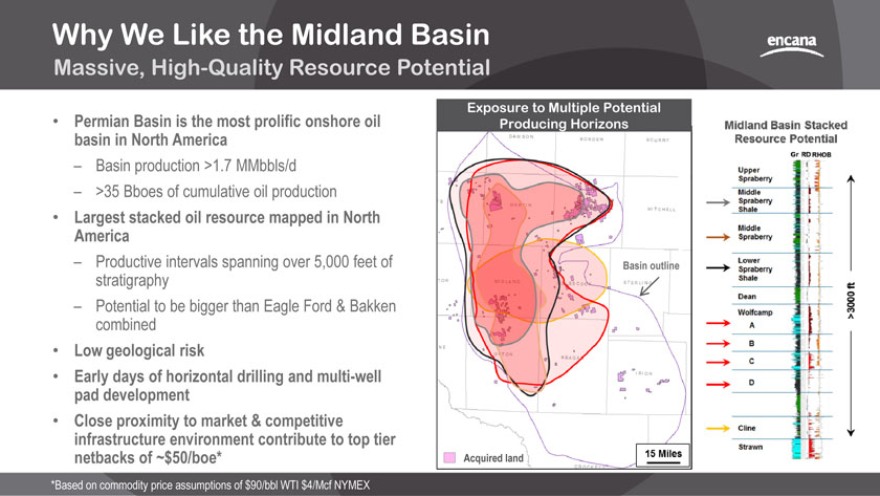
Why We Like the Midland Basin
Massive, High-Quality Resource Potential
Permian Basin is the most prolific onshore oil basin in North America
Basin production >1.7 MMbbls/d
>35 Bboes of cumulative oil production
Largest stacked oil resource mapped in North America
Productive intervals spanning over 5,000 feet of stratigraphy
Potential to be bigger than Eagle Ford & Bakken combined
Low geological risk
Early days of horizontal drilling and multi-well pad development
Close proximity to market & competitive infrastructure environment contribute to top tier netbacks of ~$50/boe*
*Based on commodity price assumptions of $90/bbl WTI $4/Mcf NYMEX
Exposure to Multiple Potential Producing Horizons
Midland Basin Stacked Resource Potential
|
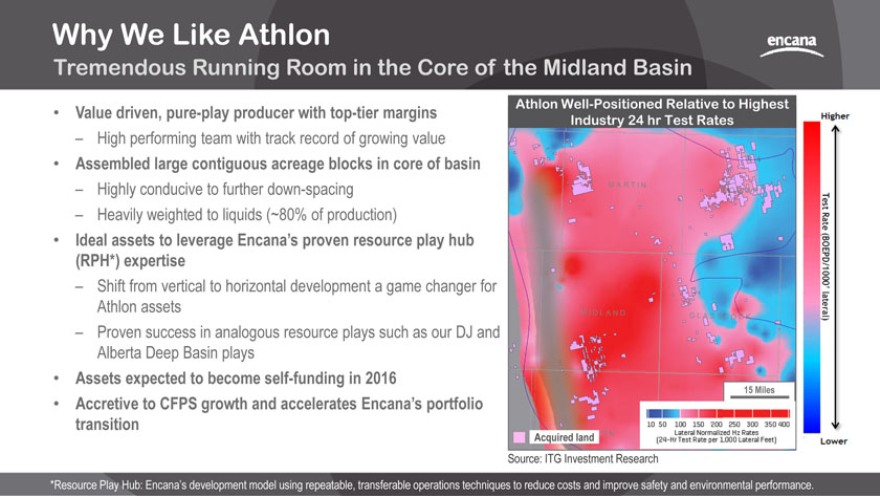
Why We Like Athlon
Tremendous Running Room in the Core of the Midland Basin
Value driven, pure-play producer with top-tier margins
High performing team with track record of growing value
Assembled large contiguous acreage blocks in core of basin
Highly conducive to further down-spacing
Heavily weighted to liquids (~80% of production)
Ideal assets to leverage Encana’s proven resource play hub
(RPH*) expertise
Shift from vertical to horizontal development a game changer for Athlon assets
Proven success in analogous resource plays such as our DJ and Alberta Deep Basin plays
Assets expected to become self-funding in 2016
Accretive to CFPS growth and accelerates Encana’s portfolio transition
Athlon Well-Positioned Relative to Highest Industry 24 hr Test Rates
Source: ITG Investment Research
*Resource Play Hub: Encana’s development model using repeatable, transferable operations techniques to reduce costs and improve safety and environmental performance.
|
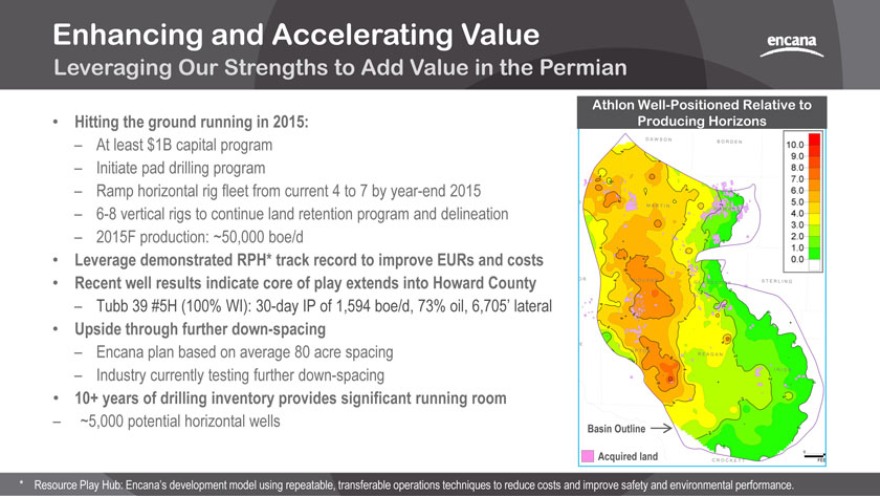
Enhancing and Accelerating Value
Leveraging Our Strengths to Add Value in the Permian
Hitting the ground running in 2015:
At least $1B capital program
Initiate pad drilling program
Ramp horizontal rig fleet from current 4 to 7 by year-end 2015
6-8 vertical rigs to continue land retention program and delineation
2015F production: ~50,000 boe/d
Leverage demonstrated RPH* track record to improve EURs and costs
Recent well results indicate core of play extends into Howard County
Tubb 39 #5H (100% WI): 30-day IP of 1,594 boe/d, 73% oil, 6,705’ lateral
Upside through further down-spacing
Encana plan based on average 80 acre spacing
Industry currently testing further down-spacing
10+ years of drilling inventory provides significant running room
~5,000 potential horizontal wells
Athlon Well-Positioned Relative to Producing Horizons
* Resource Play Hub: Encana’s development model using repeatable, transferable operations techniques to reduce costs and improve safety and environmental performance.
|
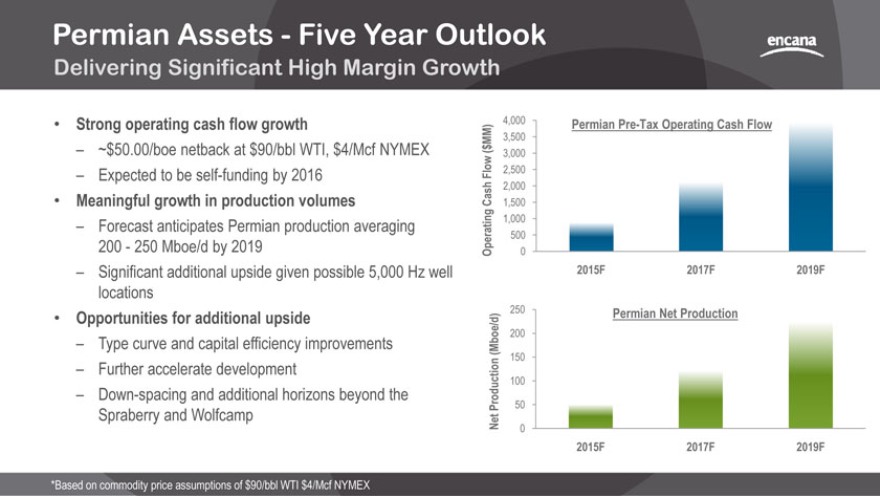
Permian Assets—Five Year Outlook
Delivering Significant High Margin Growth
Strong operating cash flow growth
~$50.00/boe netback at $90/bbl WTI, $4/Mcf NYMEX
Expected to be self-funding by 2016
Meaningful growth in production volumes
Forecast anticipates Permian production averaging 200—250 Mboe/d by 2019
Significant additional upside given possible 5,000 Hz well locations
Opportunities for additional upside
Type curve and capital efficiency improvements
Further accelerate development
Down-spacing and additional horizons beyond the Spraberry and Wolfcamp
*Based on commodity price assumptions of $90/bbl WTI $4/Mcf NYMEX
4,000 Permian Pre-Tax Operating Cash Flow
MM) 3,500
( $
3,000 Flow 2,500 Cash 2,000
1,500
1,000
Operating 500
0
2015F 2017F 2019F
250 Permian Net Production
(Mboe/d) 200
150
Production 100 Net 50
0
2015F 2017F 2019F
|
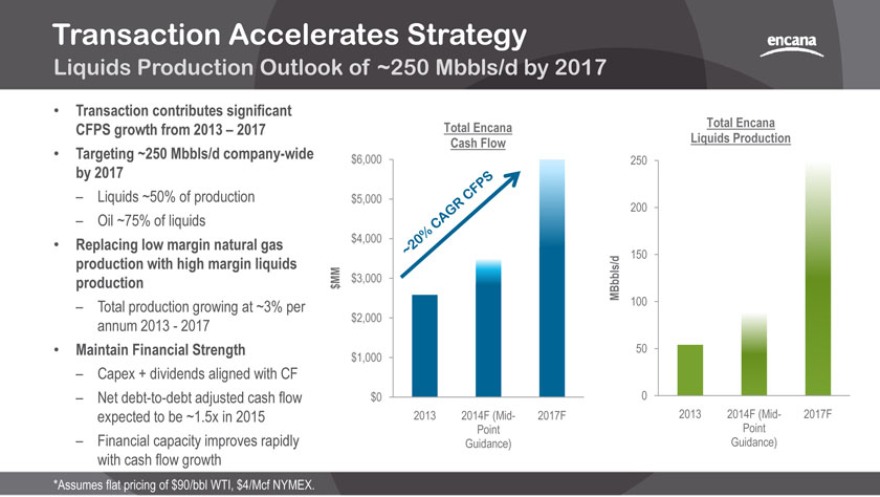
Transaction Accelerates Strategy
Liquids Production Outlook of ~250 Mbbls/d by 2017
Transaction contributes significant CFPS growth from 2013—2017
Targeting ~250 Mbbls/d company-wide by 2017
Liquids ~50% of production
Oil ~75% of liquids
Replacing low margin natural gas production with high margin liquids production
Total production growing at ~3% per annum 2013—2017
Maintain Financial Strength
Capex + dividends aligned with CF
Net debt-to-debt adjusted cash flow expected to be ~1.5x in 2015
Financial capacity improves rapidly with cash flow growth
*Assumes flat pricing of $90/bbl WTI, $4/Mcf NYMEX.
Total Encana Total Encana
Cash Flow Liquids Production $6,000 250
$5,000
200
$4,000
150 MM $3,000 $ MBbbls/d
100 $2,000
50 $1,000
$0 0
2013 2014F (Mid- 2017F 2013 2014F (Mid- 2017F Point Point Guidance) Guidance)
|
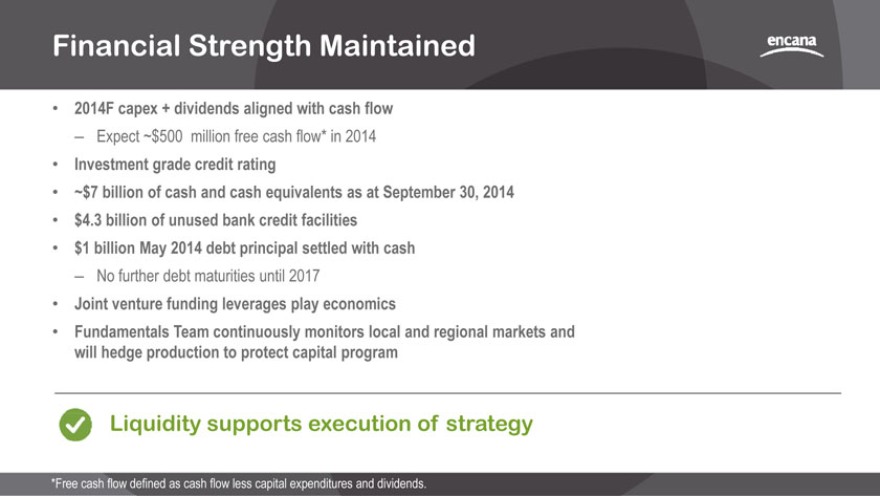
Financial Strength Maintained
2014F capex + dividends aligned with cash flow
Expect ~$500 million free cash flow* in 2014
Investment grade credit rating
~$7 billion of cash and cash equivalents as at September 30, 2014
$4.3 billion of unused bank credit facilities
$1 billion May 2014 debt principal settled with cash
No further debt maturities until 2017
Joint venture funding leverages play economics
Fundamentals Team continuously monitors local and regional markets and will hedge production to protect capital program
Liquidity supports execution of strategy
*Free cash flow defined as cash flow less capital expenditures and dividends.
|
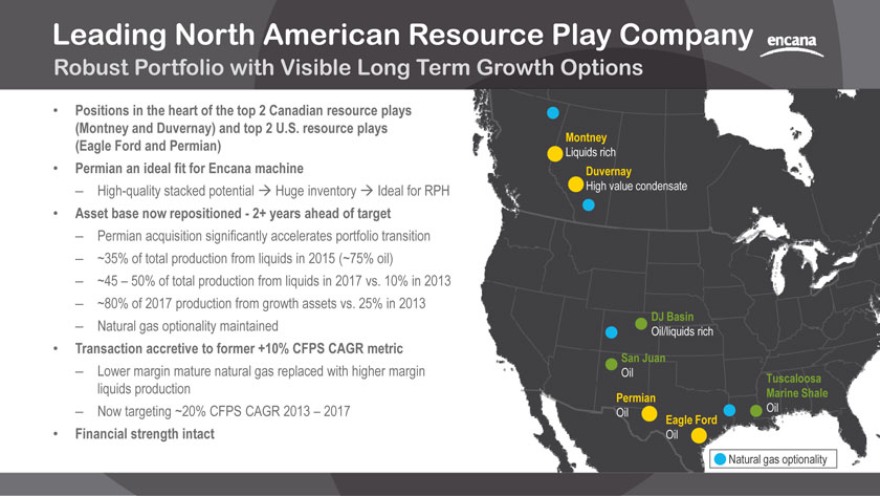
Leading North American Resource Play Company
Robust Portfolio with Visible Long Term Growth Options
Positions in the heart of the top 2 Canadian resource plays
(Montney and Duvernay) and top 2 U.S. resource plays
(Eagle Ford and Permian)
Permian an ideal fit for Encana machine
High-quality stacked potential® Huge inventory® Ideal for
Asset base now repositioned—2+ years ahead of target
Permian acquisition significantly accelerates portfolio transit
~35% of total production from liquids in 2015 (~75% oil)
~45—50% of total production from liquids in 2017 vs. 10% in 2013
~80% of 2017 production from growth assets vs. 25% in 2013
Natural gas optionality maintained
Transaction accretive to former +10% CFPS CAGR metric
Lower margin mature natural gas replaced with higher margin
liquids production
Now targeting ~20% CFPS CAGR 2013—2017
Financial strength intact
Montney
Liquids rich
Duvernay
High value condensate
DJ Basin
Oil/liquids rich
San Juan
Oil Tuscaloosa
Permian Marine Shale
Oil Oil
Eagle Ford
Oil
Natural gas optionality
|
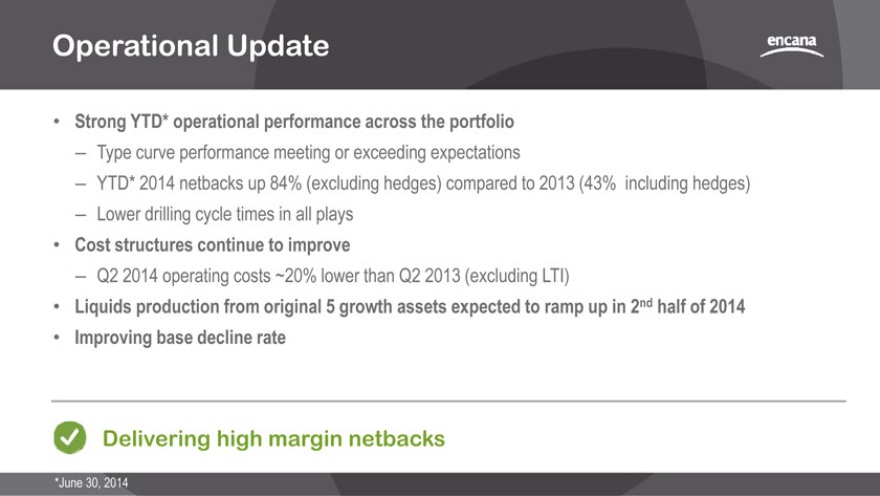
Operational Update
Strong YTD* operational performance across the portfolio
Type curve performance meeting or exceeding expectations
YTD* 2014 netbacks up 84% (excluding hedges) compared to 2013 (43% including hedges)
Lower drilling cycle times in all plays
Cost structures continue to improve
Q2 2014 operating costs ~20% lower than Q2 2013 (excluding LTI)
Liquids production from original 5 growth assets expected to ramp up in 2nd half of 2014
Improving base decline rate
Delivering high margin netbacks
*June 30, 2014
|
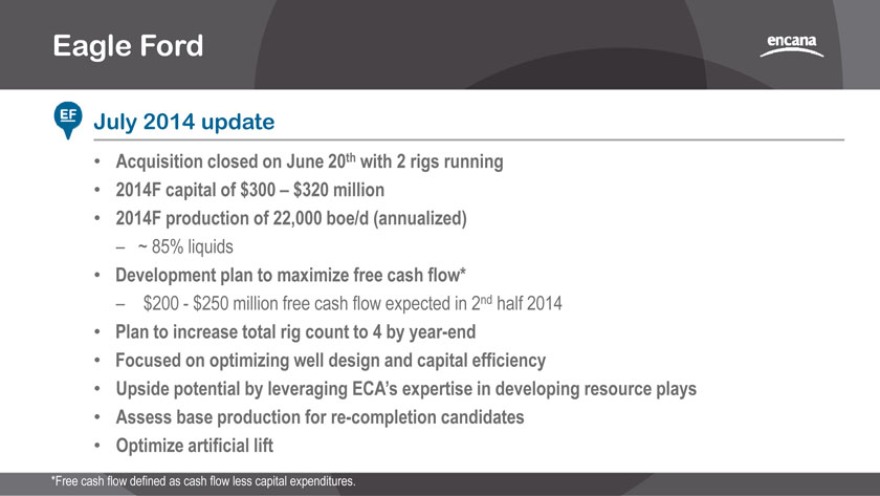
Eagle Ford
July 2014 update
Acquisition closed on June 20th with 2 rigs running
2014F capital of $300 $320 million
2014F production of 22,000 boe/d (annualized)
~ 85% liquids
Development plan to maximize free cash flow*
$200—$250 million free cash flow expected in 2nd half 2014
Plan to increase total rig count to 4 by year-end
Focused on optimizing well design and capital efficiency
Upside potential by leveraging ECA’s expertise in developing resource plays
Assess base production for re-completion candidates
Optimize artificial lift
*Free cash flow defined as cash flow less capital expenditures.
|
Montney
July 2014 update
Continued success with high intensity completions in Cutbank Ridge
7 high-intensity completions wells brought on in Q2 with 30 day IPs of 12-14 MMcf/d; ~100% above prior type curve
Higher than expected liquid yields
Currently drilling on 3 multi-well pad sites in Pipestone
Drilling efficiencies continue to drive costs down ~9% compared to Q1 2014
Gordondale 2014 drilling & completion programs finished, multi-well pads expected on-line in Q3 2014
Continue to develop long term take-away capacity
Completed 100 MMcf/d compression facility in Pipestone
Completed 60 MMcf/d expansion at Dawson South compressor station
50 net wells drilled YTD as of June 30th
6 rigs currently running
|
DJ Basin
July 2014 update
YTD drilling cycle times averaging 3 days faster than expectations
Drilled first 7-day spud-to-rig release 4,150 ft. well
Successfully drilled 3rd 10,000 ft. lateral well
Added second completions crew in May
Continuing to optimize well spacing and completion design
32 net wells drilled YTD as of June 30th
6 rigs currently running
|
San Juan
July 2014 update
Advancing efficient commercial development
YTD production and capital are in line with expectations
Continuing to further delineate acreage
Consistent well performance at or above expectations
30 day IPs of 400—500 bbls/d oil
Optimizing well design
Well permitting time continues to improve
9 net (14 gross) wells drilled YTD as of June 30th
3 rigs currently running, 4th rig expected to arrive in Q3
|
Duvernay
July 2014 update
Currently drilling on three 8-well pads in the Kaybob/Simonette area
Completions commencing in Q3
10 high-intensity-completions wells meeting or exceeding type curve expectations
30 day IPs averaging ~1,300 boe/d
Tighter stage spacing and larger fracs improving productivity
Kaybob/Simonette spud to rig release times ~17 days faster in Q2 vs. Q1 2014
~$1.5 million cost savings per well
15-31 plant expansion on track for Q3/Q4 start-up
Gross operated field capacity of 55 MMcf/d with 10,000 bbls/d of condensate expected by year-end
12 net wells drilled YTD as of June 30th
5 rigs currently running
|
Tuscaloosa Marine Shale
July 2014 update
Demonstrating achievement of type curve across Tier 1 acreage
Wells drilled YTD 2014 generally meeting normalized type curve expectations
Cost improvements continue to be achieved
Mathis and Lewis wells demonstrated record drilling times
Progressing well completion design
Plan to complete appraisal of play by year-end
6 net (10 gross) wells drilled YTD as of June 30th
2 rigs currently running
|
Base Asset Optimization
Improving Declines, Increasing Returns
Focus across all fields on base optimization projects to offset PDP declines
Haynesville re-frac program
Excellent results from 2 wells completed to date
IPs up to 100% higher than expectations
5 additional wells planned for Q3
Evaluating re-frac potential in DJ Basin, Montney and Eagle Ford
Field booster compression
Artificial lift initiatives
Well recompletions
Well positioned to exceed targeted 10% reduction in 2014 base decline
|
Key 2014 Deliverables
Disciplined and focused capital program
Targeting 75% of 2014 capex allocated to growth assets
Pre-hedge upstream operating cash flow expected to be up ~70% year over year
Accelerate high-margin growth plays
Advance TMS and Willesden Green Duvernay appraisals
Finalize Duvernay/Montney midstream solution
Continued focus on cost reduction and capital efficiency improvement
~80% forecast increase in 2014 netbacks
Optimize base production performance
Reduce base decline to 25% 27%
Maintain balance sheet integrity
Shareholders to benefit from new strategy in 2014
|
Disciplined Focus on Profitable Growth
VISION: Leading North American oil and gas resource play company
High quality rocks
Scale and running room
Operational excellence
Portfolio optionality
STRATEGY: Disciplined focus on generating profitable growth
Capital allocated to high return and scalable assets
Acceleration of oil/liquids growth
Reduce cost structures and drive efficiency improvements
GOAL: Growing shareholder value
Sustainable business model through commodity cycle
Cash flow per share growth
Investment grade credit rating
Dividend paying*
Unlocking value from massive resource base
*Dividends are subject to the discretion of the Board of Directors.
|

Supplemental
|
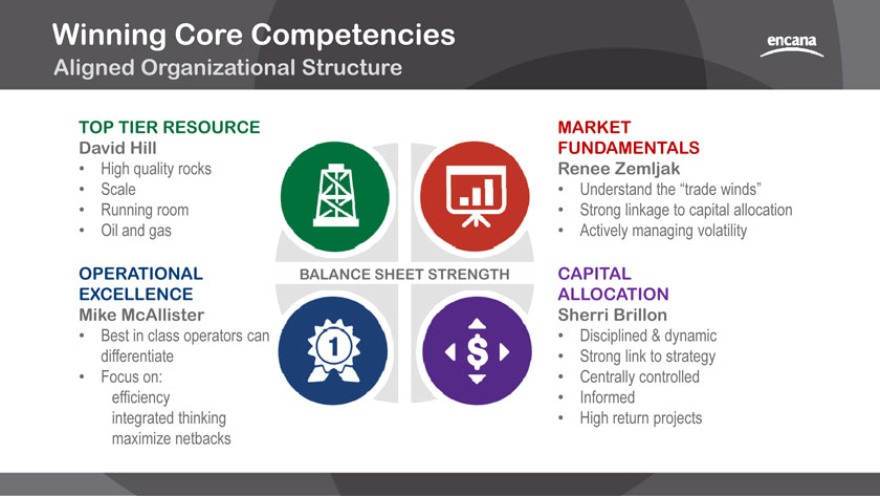
Winning Core Competencies
Aligned Organizational Structure
TOP TIER RESOURCE David Hill
High quality rocks
Scale
Running room
Oil and gas
OPERATIONAL EXCELLENCE Mike McAllister
Best in class operators can differentiate
Focus on: efficiency integrated thinking maximize netbacks
BALANCE SHEET STRENGTH
MARKET
FUNDAMENTALS Renee Zemljak
Understand the “trade winds”
Strong linkage to capital allocation
Actively managing volatility
CAPITAL ALLOCATION Sherri Brillon
Disciplined & dynamic
Strong link to strategy
Centrally controlled
Informed
High return projects
|
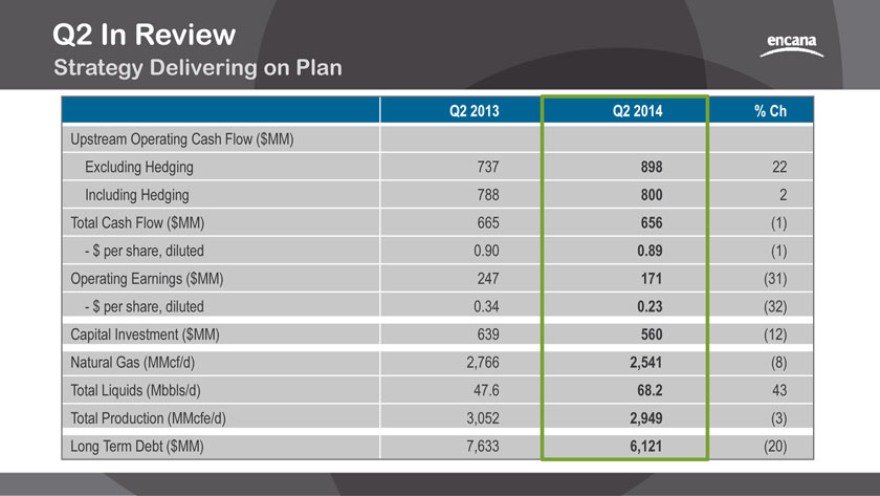
Q2 In Review
Strategy Delivering on Plan
Q2 2013 Q2 2014 % Ch
Upstream Operating Cash Flow ($MM)
Excluding Hedging 737 898 22 Including Hedging 788 800 2 Total Cash Flow ($MM) 665 656 (1) —$ per share, diluted 0.90 0.89 (1) Operating Earnings ($MM) 247 171 (31) —$ per share, diluted 0.34 0.23 (32) Capital Investment ($MM) 639 560 (12) Natural Gas (MMcf/d) 2,766 2,541 (8) Total Liquids (Mbbls/d) 47.6 68.2 43 Total Production (MMcfe/d) 3,052 2,949 (3) Long Term Debt ($MM) 7,633 6,121 (20)
|

YTD* Review
Strategy Delivering on Plan
YTD 2013 YTD 2014 % Ch
Total Cash Flow ($MM) 1,244 1,750 41 —$ per share, diluted 1.69 2.36 40 Operating Earnings ($MM) 426 686 61 —$ per share, diluted 0.58 0.93 60 Capital Investment ($MM) 1,354 1,071 (21) Natural Gas (MMcf/d) 2,821 2,675 (5) Oil & Field Condensate (Mbbls/d) 21.5 33.1 54 NGLs (Mbbls/d) 24.1 34.9 45 Total Liquids (Mbbls/d) 45.6 68.0 49 Total Production (MMcfe/d) 3,094 3,083—Long Term Debt ($MM) 7,633 6,121 (20)
*June 30, 2014
|
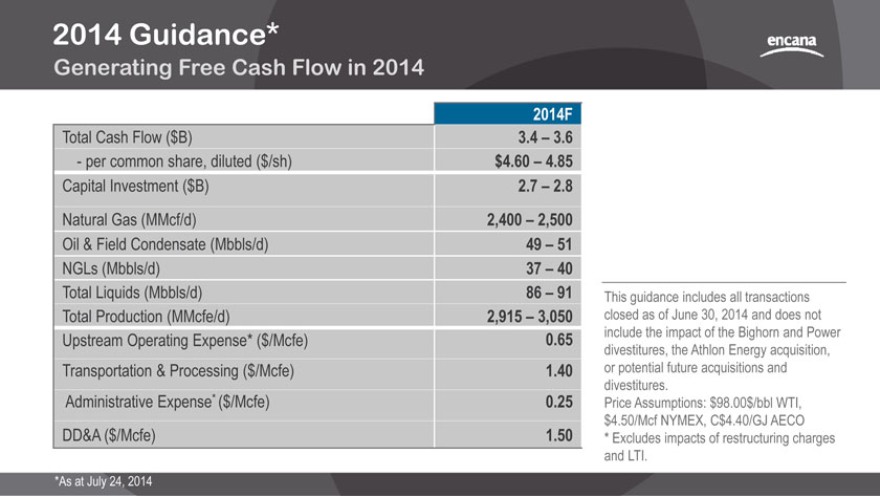
2014 Guidance*
Generating Free Cash Flow in 2014
Total Cash Flow ($B) 3.4 - 3.6 - per common share, diluted ($/sh) $4.60 - 4.85 Capital Investment ($B) 2.7 - 2.8 Natural Gas (MMcf/d) 2,400 - 2,500 Oil & Field Condensate (Mbbls/d) 49 - 51 NGLs (Mbbls/d) 37 - 40 Total Liquids (Mbbls/d) 86 - 91 Total Production (MMcfe/d) 2,915 - 3,050 Upstream Operating Expense* ($/Mcfe) 0.65 Transportation & Processing ($/Mcfe) 1.40 Administrative Expense* ($/Mcfe) 0.25 DD&A ($/Mcfe) 1.50
This guidance includes all transactions closed as of June 30, 2014 and does not include the impact of the Bighorn and Power divestitures, the Athlon Energy acquisition, or potential future acquisitions and divestitures.
Price Assumptions: $98.00$/bbl WTI,
$4.50/Mcf NYMEX, C$4.40/GJ AECO
* Excludes impacts of restructuring charges and LTI.
*As at July 24, 2014
|
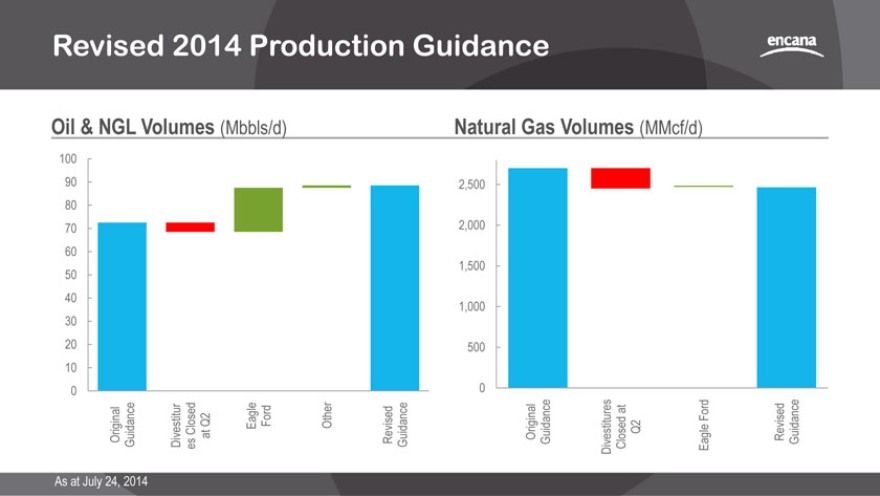
Revised 2014 Production Guidance
Oil & NGL Volumes (Mbbls/d)
Natural Gas Volumes (MMcf/d)
0 10 20 30 40 50 60 70 80 90 100
Original Guidance
Divestitures Closed at Q2
Eagle Ford
Other
Revised Guidance
0 500 1,000 1,500 2,000 2,500 Original Guidance
Divestitures Closed at Q2
Eagle Ford
Revised Guidance
As at July 24, 2014
|
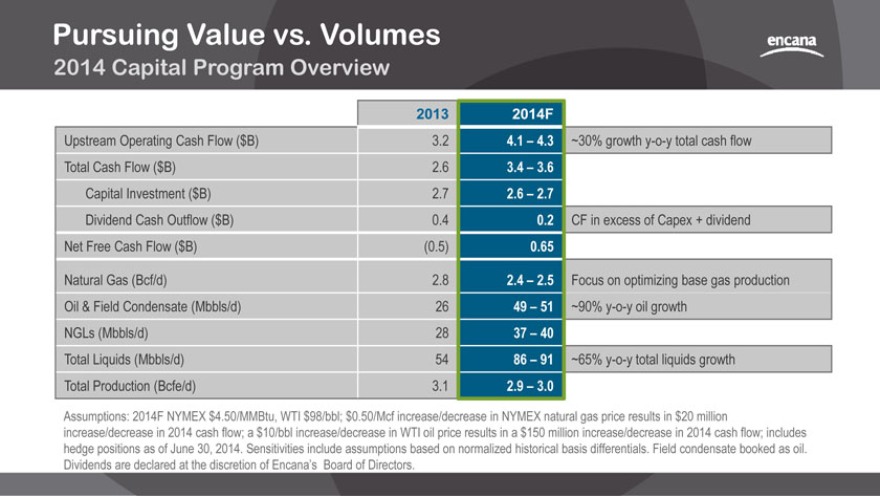
Pursuing Value vs. Volumes
2014 Capital Program Overview
2013 2014F
Upstream Operating Cash Flow ($B) 3.2 4.1 - 4.3 Total Cash Flow ($B) 2.6 3.4 - 3.6 Capital Investment ($B) 2.7 2.6 - 2.7 Dividend Cash Outflow ($B) 0.4 0.2 Net Free Cash Flow ($B) (0.5) 0.65
Natural Gas (Bcf/d) 2.8 2.4 - 2.5 Oil & Field Condensate (Mbbls/d) 26 49 - 51 NGLs (Mbbls/d) 28 37 - 40 Total Liquids (Mbbls/d) 54 86 - 91 Total Production (Bcfe/d) 3.1 2.9 - 3.0
~30% growth y-o-y total cash flow
CF in excess of Capex + dividend
Focus on optimizing base gas production ~90% y-o-y oil growth
~65% y-o-y total liquids growth
Assumptions: 2014F NYMEX $4.50/MMBtu, WTI $98/bbl; $0.50/Mcf increase/decrease in NYMEX natural gas price results in $20 million increase/decrease in 2014 cash flow; a $10/bbl increase/decrease in WTI oil price results in a $150 million increase/decrease in 2014 cash flow; includes hedge positions as of June 30, 2014. Sensitivities include assumptions based on normalized historical basis differentials. Field condensate booked as oil.
Dividends are declared at the discretion of Encana’s Board of Directors.
|
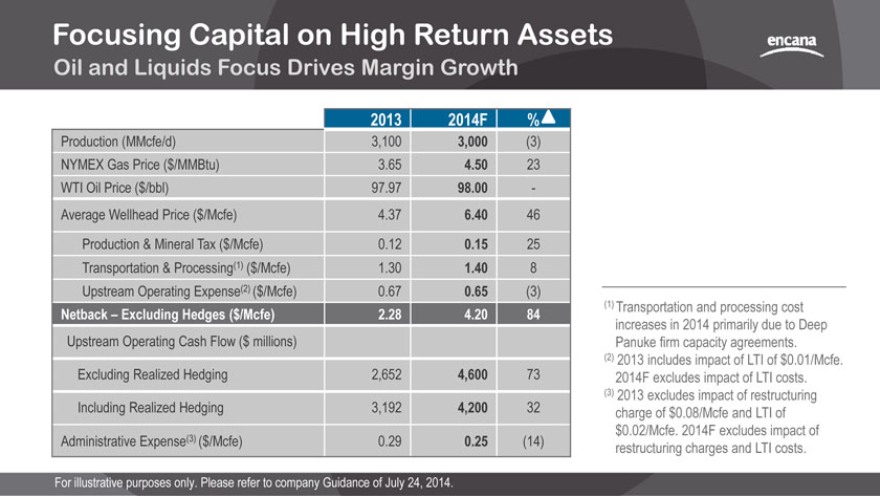
Focusing Capital on High Return Assets
Oil and Liquids Focus Drives Margin Growth
2013 2014F %
Production (MMcfe/d) 3,100 3,000 (3) NYMEX Gas Price ($/MMBtu) 3.65 4.50 23 WTI Oil Price ($/bbl) 97.97 98.00—Average Wellhead Price ($/Mcfe) 4.37 6.40 46 Production & Mineral Tax ($/Mcfe) 0.12 0.15 25 Transportation & Processing(1) ($/Mcfe) 1.30 1.40 8 Upstream Operating Expense(2) ($/Mcfe) 0.67 0.65 (3)
Netback Excluding Hedges ($/Mcfe) 2.28 4.20 84
Upstream Operating Cash Flow ($ millions)
Excluding Realized Hedging 2,652 4,600 73 Including Realized Hedging 3,192 4,200 32 Administrative Expense(3) ($/Mcfe) 0.29 0.25 (14)
(1) Transportation and processing cost increases in 2014 primarily due to Deep Panuke firm capacity agreements. (2) 2013 includes impact of LTI of $0.01/Mcfe.
2014F excludes impact of LTI costs. (3) 2013 excludes impact of restructuring charge of $0.08/Mcfe and LTI of
$0.02/Mcfe. 2014F excludes impact of restructuring charges and LTI costs.
For illustrative purposes only. Please refer to company Guidance of July 24, 2014.
|
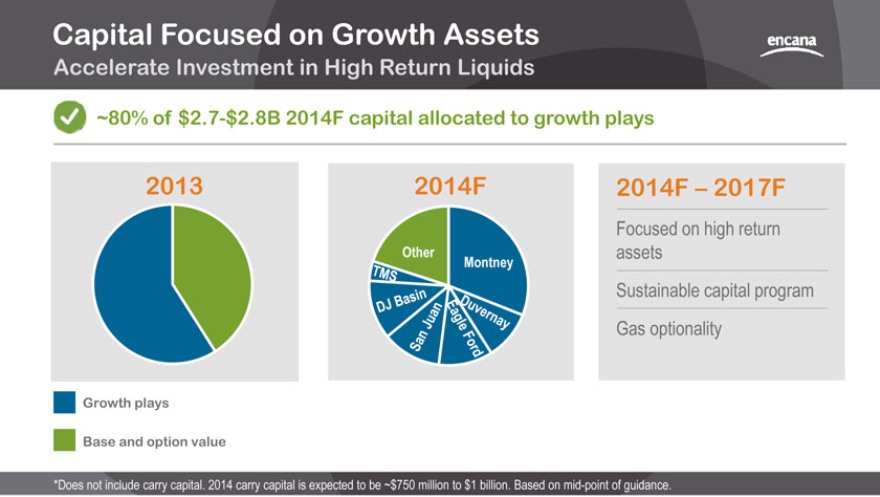
Capital Focused on Growth Assets
Accelerate Investment in High Return Liquids
~80% of $2.7-$2.8B 2014F capital allocated to growth plays
2013
2014F
Other
Montney
2014F 2017F
Focused on high return assets Sustainable capital program Gas optionality
Growth plays
Base and option value
*Does not include carry capital. 2014 carry capital is expected to be ~$750 million to $1 billion. Based on mid-point of guidance.
|
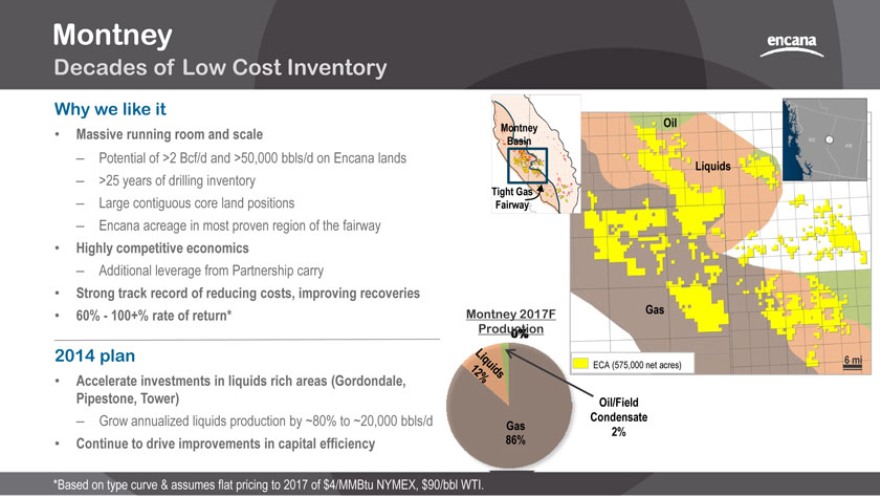
Montney
Decades of Low Cost Inventory
Why we like it
Massive running room and scale
Potential of >2 Bcf/d and >50,000 bbls/d on Encana lands
>25 years of drilling inventory
Large contiguous core land positions
Encana acreage in most proven region of the fairway
Highly competitive economics
Additional leverage from Partnership carry
Strong track record of reducing costs, improving recoveries
60%—100+% rate of return*
2014 plan
Accelerate investments in liquids rich areas (Gordondale,
Pipestone, Tower)
Grow annualized liquids production by ~80% to ~20,000 bbls/d
Continue to drive improvements in capital efficiency
Montney Oil Basin
Liquids
Tight Gas Fairway
Montney 2017F Gas
Production 0%
6 mi
ECA (575,000 net acres)
Oil/Field
Condensate Gas
2% 86%
*Based on type curve & assumes flat pricing to 2017 of $4/MMBtu NYMEX, $90/bbl WTI.
|

Montney
Key Statistics
Land (net acres): 575,000 Average working interest: 66%
Type Curve EUR/well: 7 - 9 Bcfe, 650 - 1,000 MBoe Type Curve ROR: 60 - >100% Well inventory (gross): 3,700 Well costs (DCT): $8 - $10 million Royalty rate: 11% - 15% 2014F Production (net) Oil/field condensate: 6,000 - 6,500 bbls/d NGLs: 13,500 - 14,000 bbls/d Natural gas: 525 - 545 MMcf/d 2014F Capital (net): $800 - $900 million 2014F Wells: 80 - 85 (net), 110 - 120 (gross) 2014F rigs: 6 - 8 Supply cost*: $1.30-2.30 /Mcfe, $30 - $40/Boe
*Supply Cost is defined as the flat NYMEX/WTI price that yields an IRR of 9% and does not include land or G&A costs. Low end of natural gas supply cost reflects joint venture leverage.
|
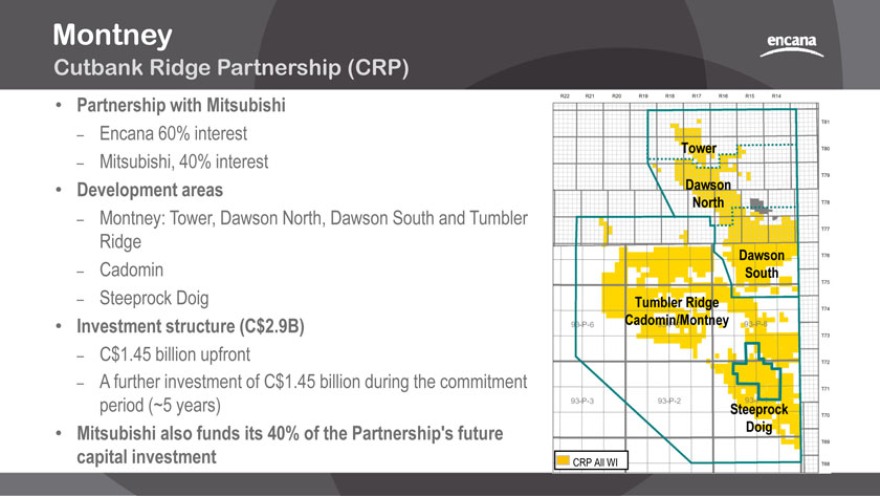
Montney
Cutbank Ridge Partnership (CRP)
Partnership with Mitsubishi
Encana 60% interest
Mitsubishi, 40% interest
Development areas
Montney: Tower, Dawson North, Dawson South and Tumbler Ridge
Cadomin
Steeprock Doig
Investment structure (C$2.9B)
C$1.45 billion upfront
A further investment of C$1.45 billion during the commitment period (~5 years)
Mitsubishi also funds its 40% of the Partnership’s future capital investment
Tower
Dawson North
Dawson
South
Tumbler Ridge
Cadomin/Montney
Steeprock
Doig
CRP All WI
|
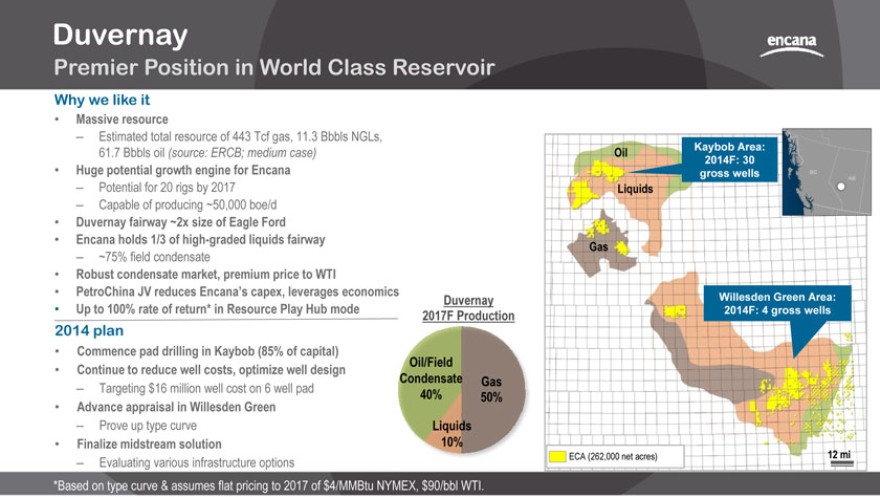
Duvernay
Premier Position in World Class Reservoir
Why we like it
Massive resource
Estimated total resource of 443 Tcf gas, 11.3 Bbbls NGLs,
61.7 Bbbls oil (source: ERCB; medium case)
Huge potential growth engine for Encana
Potential for 20 rigs by 2017
Capable of producing ~50,000 boe/d
Duvernay fairway ~2x size of Eagle Ford
Encana holds 1/3 of high-graded liquids fairway
~75% field condensate
Robust condensate market, premium price to WTI
PetroChina JV reduces Encana’s capex, leverages economics
Up to 100% rate of return* in Resource Play Hub mode
2014 plan
Commence pad drilling in Kaybob (85% of capital)
Continue to reduce well costs, optimize well design
Targeting $16 million well cost on 6 well pad
Advance appraisal in Willesden Green
Prove up type curve
Finalize midstream solution
Evaluating various infrastructure options
*Based on type curve & assumes flat pricing to 2017 of $4/MMBtu NYMEX, $90/bbl WTI.
Duvernay 2017F Production
Oil/Field
Condensate Gas 40% 50% Liquids 10%
O Kaybob Area: 2014F: 30 gross wells
Gas
Willesden Green Area: 2014F: 4 gross wells
ECA (262,000 net acres) 12 mi
|
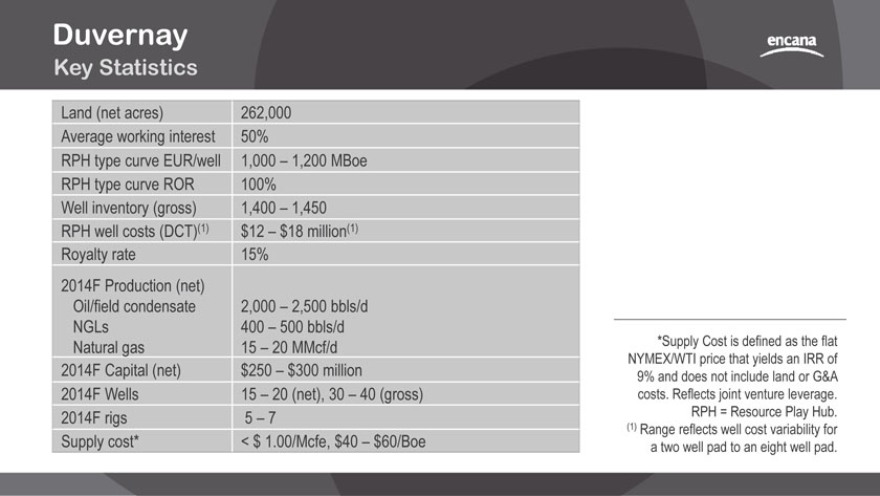
Duvernay
Key Statistics
Land (net acres) 262,000 Average working interest 50%
RPH type curve EUR/well 1,000 - 1,200 MBoe RPH type curve ROR 100% Well inventory (gross) 1,400 - 1,450 RPH well costs (DCT)(1) $12 - $18 million(1) Royalty rate 15% 2014F Production (net) Oil/field condensate 2,000 - 2,500 bbls/d NGLs 400 - 500 bbls/d Natural gas 15 - 20 MMcf/d 2014F Capital (net) $250 - $300 million
2014F Wells 15 - 20 (net), 30 - 40 (gross) 2014F rigs 5 - 7 Supply cost* < $ 1.00/Mcfe, $40 - $60/Boe
*Supply Cost is defined as the flat NYMEX/WTI price that yields an IRR of 9% and does not include land or G&A costs. Reflects joint venture leverage.
RPH = Resource Play Hub. (1) Range reflects well cost variability for a two well pad to an eight well pad.
|
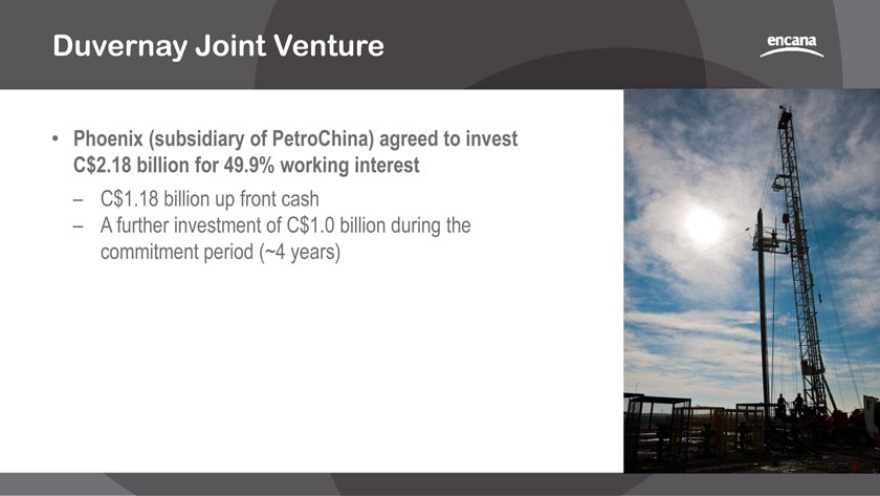
Duvernay Joint Venture
Phoenix (subsidiary of PetroChina) agreed to invest C$2.18 billion for 49.9% working interest
C$1.18 billion up front cash
A further investment of C$1.0 billion during the commitment period (~4 years)
|
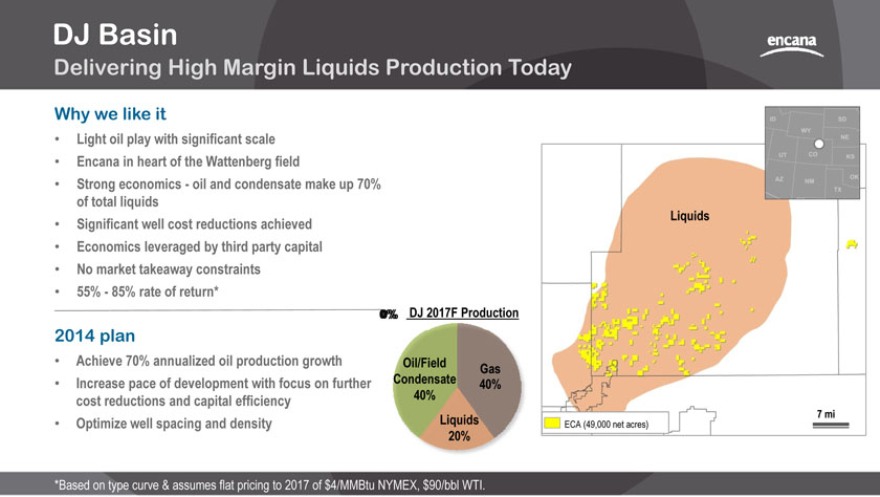
DJ Basin
Delivering High Margin Liquids Production Today
Why we like it
Light oil play with significant scale
Encana in heart of the Wattenberg field
Strong economics—oil and condensate make up 70% of total liquids
Significant well cost reductions achieved
Economics leveraged by third party capital
No market takeaway constraints
55%—85% rate of return*
2014 plan
Achieve 70% annualized oil production growth
Increase pace of development with focus on further cost reductions and capital efficiency
Optimize well spacing and density
0% DJ 2017F Production
Oil/Field Gas Condensate 40% 40%
Liquids
20%
Liquids
*Based on type curve & assumes flat pricing to 2017 of $4/MMBtu NYMEX, $90/bbl WTI.
7 mi
ECA (49,000 net acres)
|
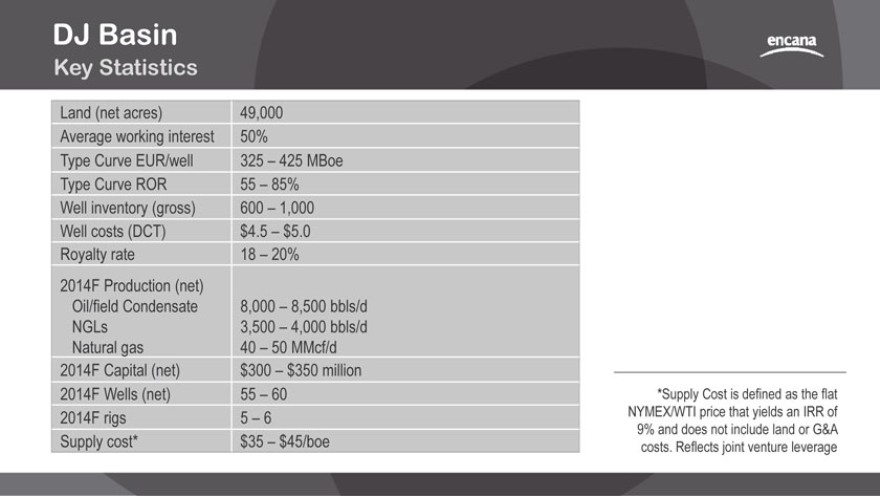
DJ Basin
Key Statistics
Land (net acres) 49,000 Average working interest 50%
Type Curve EUR/well 325 - 425 MBoe Type Curve ROR 55 - 85% Well inventory (gross) 600 - 1,000 Well costs (DCT) $4.5 - $5.0 Royalty rate 18 - 20% 2014F Production (net) Oil/field Condensate 8,000 - 8,500 bbls/d NGLs 3,500 - 4,000 bbls/d Natural gas 40 - 50 MMcf/d 2014F Capital (net) $300 - $350 million 2014F Wells (net) 55 - 60 2014F rigs 5 - 6 Supply cost* $35 - $45/boe
*Supply Cost is defined as the flat NYMEX/WTI price that yields an IRR of 9% and does not include land or G&A costs. Reflects joint venture leverage
|
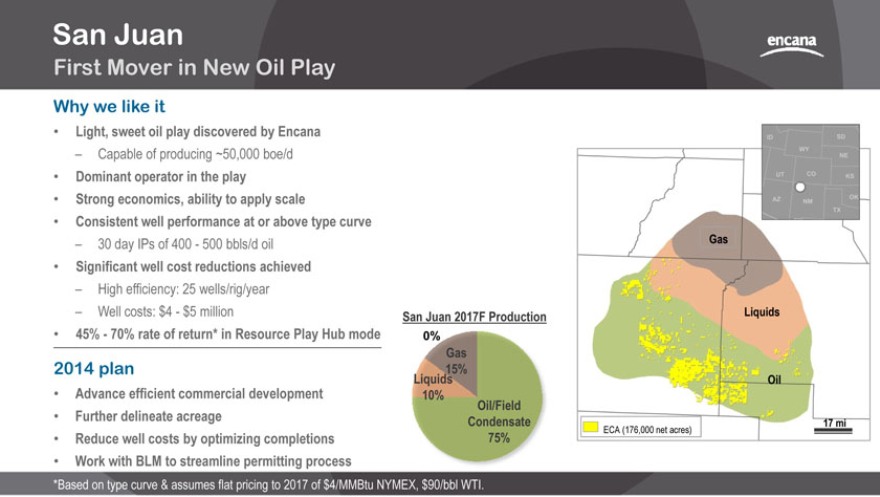
San Juan
First Mover in New Oil Play
Why we like it
Light, sweet oil play discovered by Encana
Capable of producing ~50,000 boe/d
Dominant operator in the play
Strong economics, ability to apply scale
Consistent well performance at or above type curve
30 day IPs of 400—500 bbls/d oil
Significant well cost reductions achieved
High efficiency: 25 wells/rig/year
Well costs: $4—$5 million
45%—70% rate of return* in Resource Play Hub mode
2014 plan
Advance efficient commercial development
Further delineate acreage
Reduce well costs by optimizing completions
Work with BLM to streamline permitting process
San Juan 2017F Production
0%
Gas
15%
Liquids
10%
Oil/Field
Condensate 75%
*Based on type curve & assumes flat pricing to 2017 of $4/MMBtu NYMEX, $90/bbl WTI.
Gas
Liquids
Oil
17 mi
ECA (176,000 net acres)
|
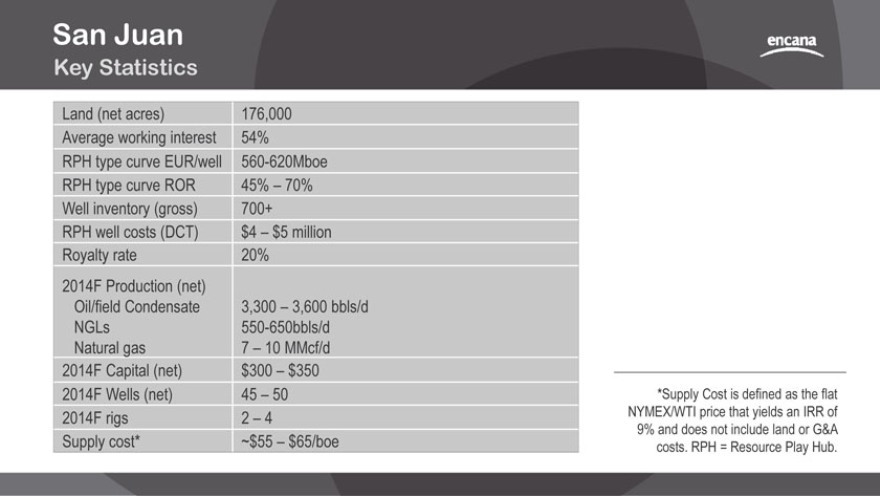
San Juan
Key Statistics
Land (net acres) 176,000 Average working interest 54% RPH type curve EUR/well 560-620Mboe RPH type curve ROR 45% - 70% Well inventory (gross) 700+ RPH well costs (DCT) $4 - $5 million Royalty rate 20% 2014F Production (net) Oil/field Condensate 3,300 - 3,600 bbls/d NGLs 550-650bbls/d Natural gas 7 - 10 MMcf/d 2014F Capital (net) $300 - $350 2014F Wells (net) 45 - 50 2014F rigs 2 - 4 Supply cost* ~$55 - $65/boe
*Supply Cost is defined as the flat NYMEX/WTI price that yields an IRR of 9% and does not include land or G&A costs. RPH = Resource Play Hub.
|
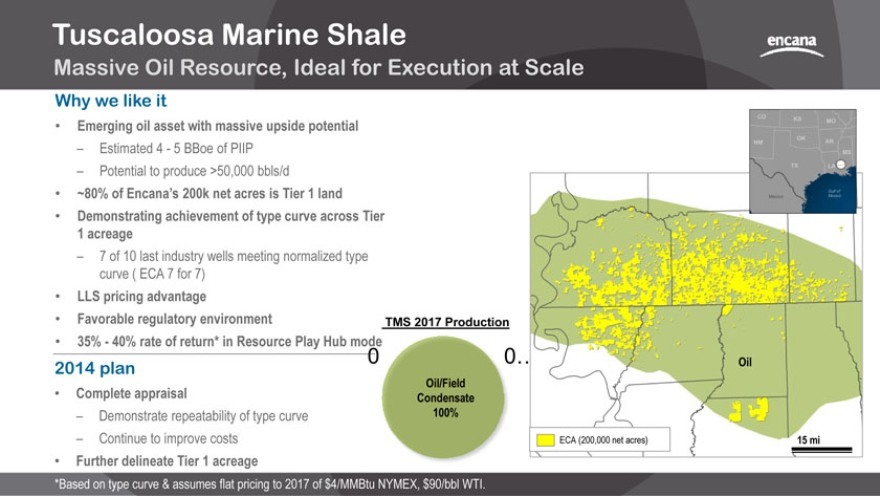
Tuscaloosa Marine Shale
Massive Oil Resource, Ideal for Execution at Scale
Why we like it
Emerging oil asset with massive upside potential
Estimated 4—5 BBoe of PIIP
Potential to produce >50,000 bbls/d
~80% of Encana’s 200k net acres is Tier 1 land
Demonstrating achievement of type curve across Tier 1 acreage
7 of 10 last industry wells meeting normalized type curve ( ECA 7 for 7)
LLS pricing advantage
Favorable regulatory environment
35%—40% rate of return* in Resource Play Hub mode
2014 plan
Complete appraisal
Demonstrate repeatability of type curve
Continue to improve costs
Further delineate Tier 1 acreage
*Based on type curve & assumes flat pricing to 2017 of $4/MMBtu NYMEX, $90/bbl WTI.
TMS 2017 Production
0 0…
Oil/Field Condensate
100%
Oil
ECA (200,000 net acres) 15 mi
|
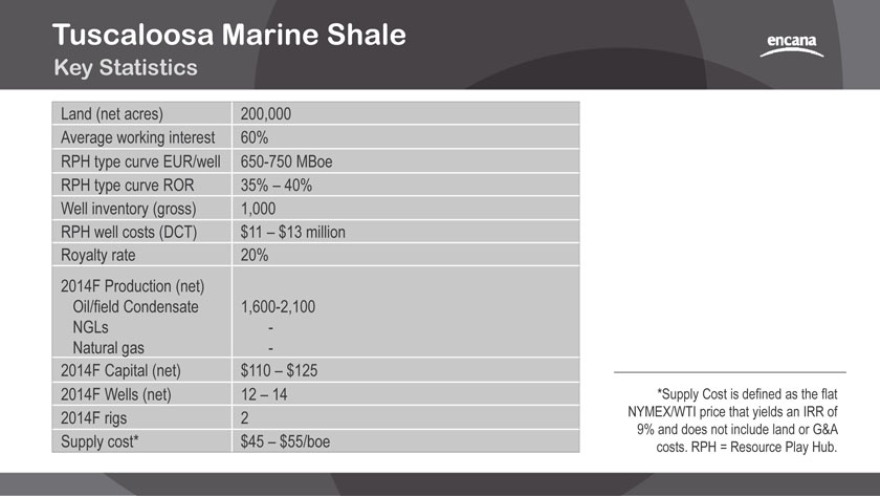
Tuscaloosa Marine Shale
Key Statistics
Land (net acres) 200,000 Average working interest 60% RPH type curve EUR/well 650-750 MBoe RPH type curve ROR 35% 40% Well inventory (gross) 1,000 RPH well costs (DCT) $11 $13 million Royalty rate 20% 2014F Production (net) Oil/field Condensate 1,600-2,100 NGLs — Natural gas —
2014F Capital (net) $110 - $125 2014F Wells (net) 12 - 14 2014F rigs 2 Supply cost* $45 - $55/boe
*Supply Cost is defined as the flat NYMEX/WTI price that yields an IRR of 9% and does not include land or G&A costs. RPH = Resource Play Hub.
|
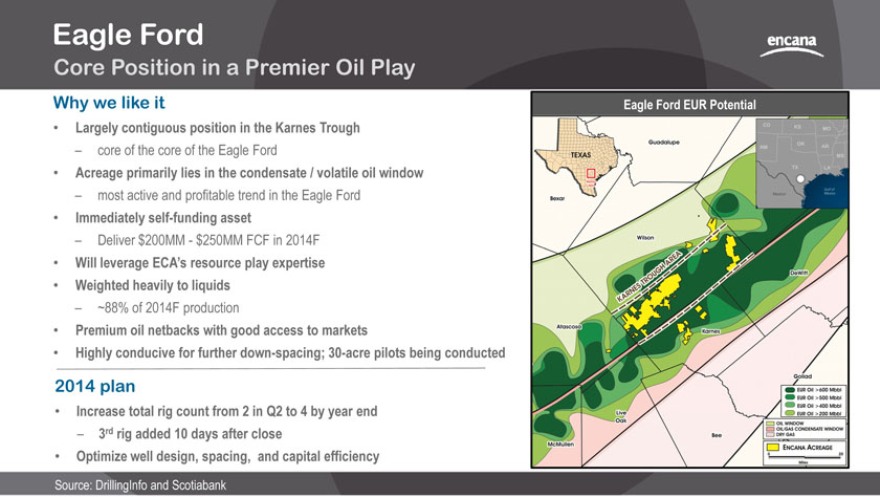
Eagle Ford
Core Position in a Premier Oil Play
Why we like it
Largely contiguous position in the Karnes Trough
core of the core of the Eagle Ford
Acreage primarily lies in the condensate / volatile oil window
most active and profitable trend in the Eagle Ford
Immediately self-funding asset
Deliver $200MM—$250MM FCF in 2014F
Will leverage ECA’s resource play expertise
Weighted heavily to liquids
~88% of 2014F production
Premium oil netbacks with good access to markets
Highly conducive for further down-spacing; 30-acre pilots being conducted
2014 plan
Increase total rig count from 2 in Q2 to 4 by year end
3rd rig added 10 days after close
Optimize well design, spacing, and capital efficiency
Source: DrillingInfo and Scotiabank
Eagle Ford EUR Potential
|

Eagle Ford
Key Statistics
Land (net acres) 45,500 Average working interest 73%
RPH type curve EUR/well 300 - 400 Mboe RPH type curve ROR 50% - 90% Well inventory (gross) 400 RPH well costs (DCT) $7 - $8 million Royalty rate 22% 2014F Production (net) Oil/field Condensate 17,000 bbls/d NGLs 2,000 bbls/d Natural gas 16 MMcf/d 2014F Capital (net) $300 $320 2014F Wells (net) 30 40 - 2014F rigs 2 - 4 Supply cost* ~$35 - 45/boe
*Supply Cost is defined as the flat NYMEX/WTI price that yields an IRR of 9% and does not include land or G&A costs. RPH = Resource Play Hub.
|
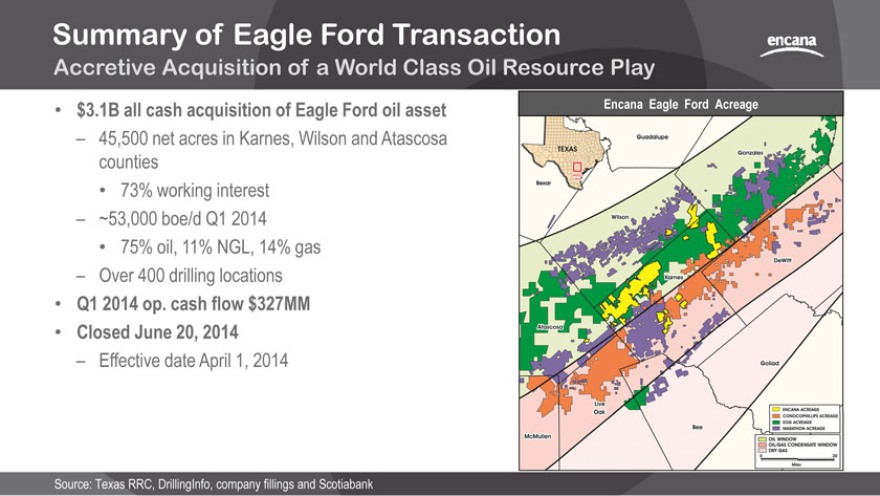
Summary of Eagle Ford Transaction
Accretive Acquisition of a World Class Oil Resource Play
$3.1B all cash acquisition of Eagle Ford oil asset
45,500 net acres in Karnes, Wilson and Atascosa counties
73% working interest
~53,000 boe/d Q1 2014
75% oil, 11% NGL, 14% gas
Over 400 drilling locations
Q1 2014 op. cash flow $327MM
Closed June 20, 2014
Effective date April 1, 2014
Source: Texas RRC, DrillingInfo, company fillings and Scotiabank
Encana Eagle Ford Acreage
|
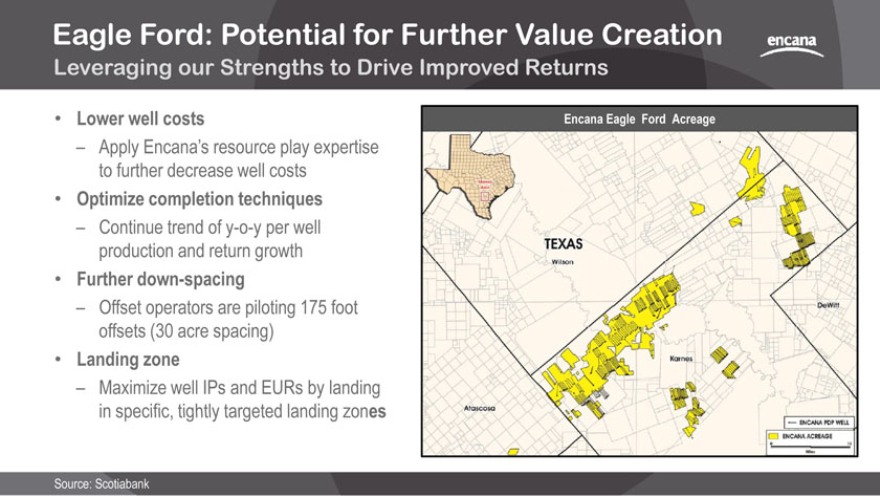
Eagle Ford: Potential for Further Value Creation
Leveraging our Strengths to Drive Improved Returns
Lower well costs
Apply Encana’s resource play expertise to further decrease well costs
Optimize completion techniques
Continue trend of y-o-y per well production and return growth
Further down-spacing
Offset operators are piloting 175 foot offsets (30 acre spacing)
Landing zone
Maximize well IPs and EURs by landing in specific, tightly targeted landing zones
Source: Scotiabank
Encana Eagle Ford Acreage
|
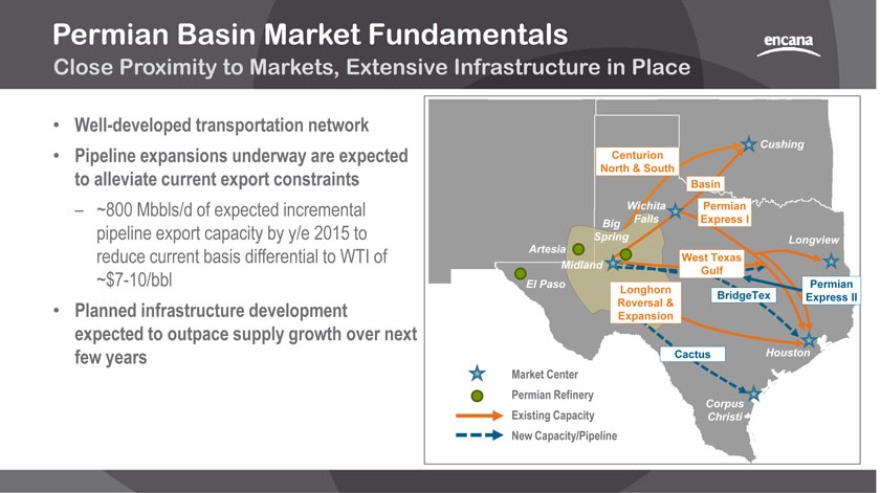
Permian Basin Market Fundamentals
Close Proximity to Markets, Extensive Infrastructure in Place
Well-developed transportation network
Pipeline expansions underway are expected to alleviate current export constraints
~800 Mbbls/d of expected incremental pipeline export capacity by y/e 2015 to reduce current basis differential to WTI of
~$7-10/bbl
Planned infrastructure development expected to outpace supply growth over next few years
Cushing
Centurion North & South
Basin
Wichita Permian
Big Falls Express I
Spring Longview Artesia
West Texas
Midland
Gulf
El Paso Permian Longhorn BridgeTex Express II
Reversal & Expansion
Cactus Houston
Market Center Permian Refinery
Corpus
Existing Capacity Christi
New Capacity/Pipeline
|
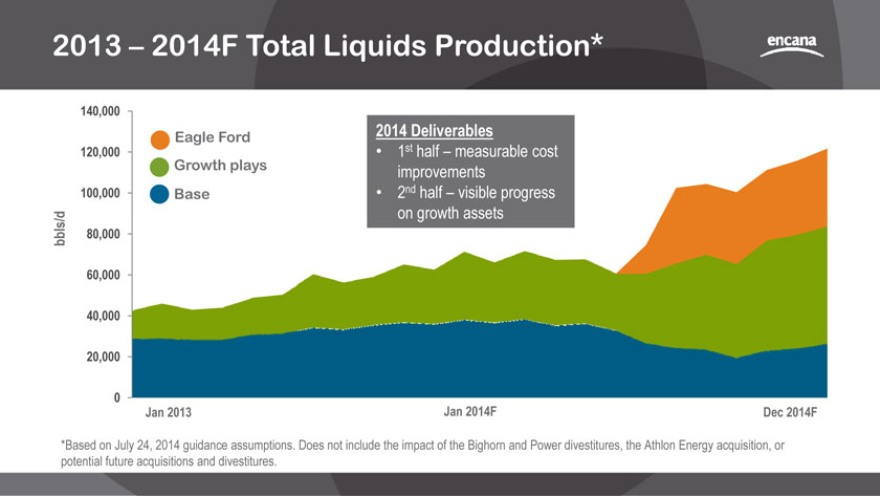
2013 - 2014F Total Liquids Production*
140,000
Eagle Ford 2014 Deliverables
120,000 1st half measurable cost Growth plays improvements 100,000 Base 2nd half visible progress on growth assets bbls/d 80,000
60,000
40,000
20,000
0
Jan 2013 Jan 2014F Dec 2014F
*Based on July 24, 2014 guidance assumptions. Does not include the impact of the Bighorn and Power divestitures, the Athlon Energy acquisition, or potential future acquisitions and divestitures.
|
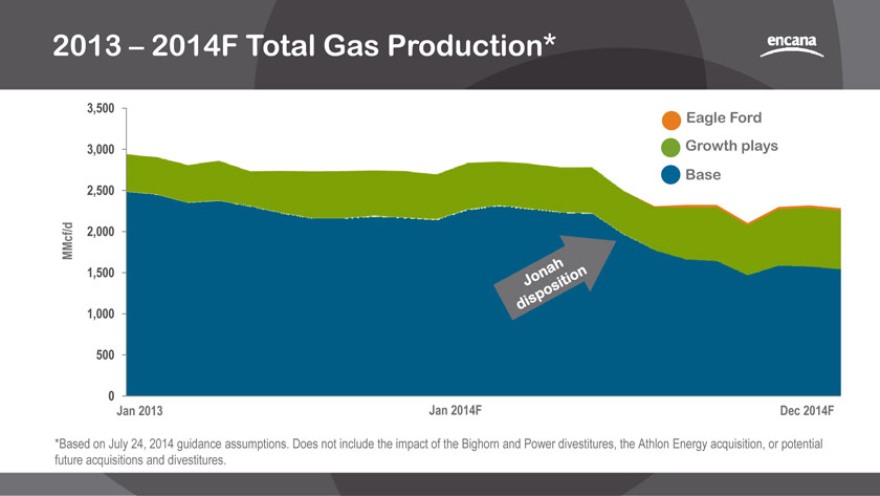
2013 2014F Total Gas Production*
3,500
Eagle Ford 3,000 Growth plays Base
2,500
MMcf/d 2,000 1,500
1,000
500
0
Jan 2013 Jan 2014F Dec 2014F
*Based on July 24, 2014 guidance assumptions. Does not include the impact of the Bighorn and Power divestitures, the Athlon Energy acquisition, or potential future acquisitions and divestitures.
|
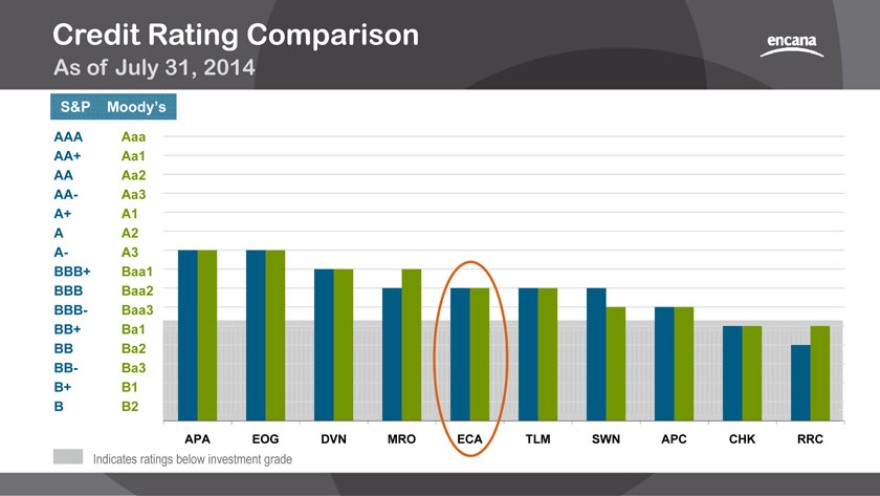
Credit Rating Comparison
As of July 31, 2014
S&P Moody’s
AAA Aaa AA+ Aa1 AA Aa2 AA- Aa3 A+ A1 A A2 A- A3 BBB+ Baa1 BBB Baa2 BBB- Baa3 BB+ Ba1 BB Ba2 BB- Ba3 B+ B1 B B2
APA EOG DVN MRO ECA TLM SWN APC CHK RRC
Indicates ratings below investment grade
|
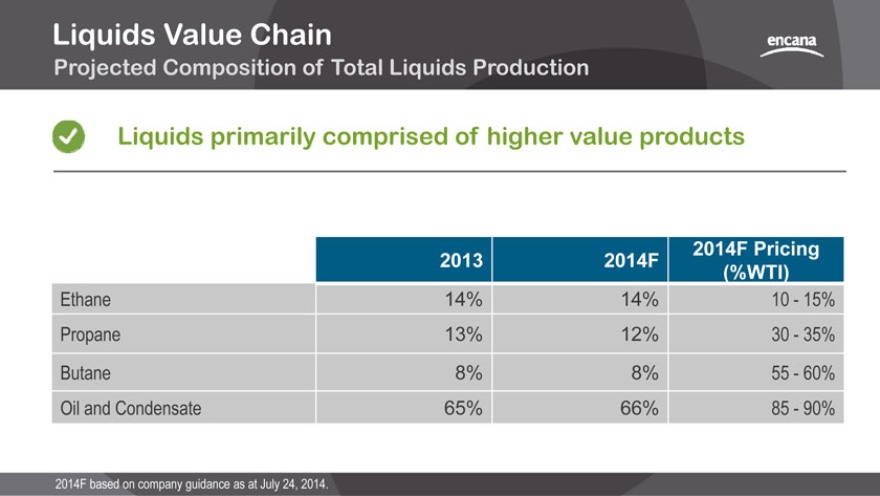
Liquids Value Chain
Projected Composition of Total Liquids Production
Liquids primarily comprised of higher value products
2014F Pricing 2013 2014F
(%WTI)
Ethane 14% 14% 10—15% Propane 13% 12% 30—35% Butane 8% 8% 55—60% Oil and Condensate 65% 66% 85—90%
2014F based on company guidance as at July 24, 2014.
|
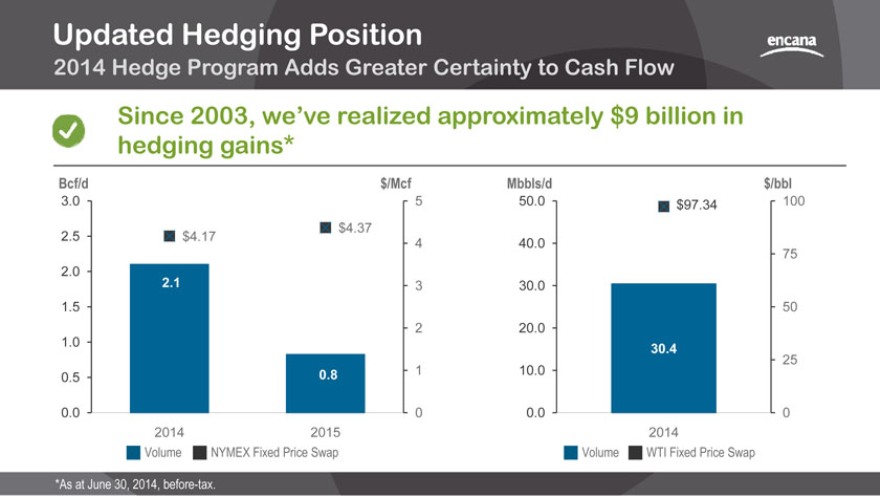
Updated Hedging Position
2014 Hedge Program Adds Greater Certainty to Cash Flow
Since 2003, we’ve realized approximately $9 billion in hedging gains*
Bcf/d $/Mcf
3.0 5
$4.37
2.5 $4.17
4
2.0
2.1 3
1.5
2
1.0
0.8 1
0.5
0.0 0 2014 2015
Volume NYMEX Fixed Price Swap
Mbbls/d $/bbl
50.0 $97.34 100
40.0
75
30.0
50
20.0
30.4
25
10.0
0.0 0 2014
Volume WTI Fixed Price Swap
*As at June 30, 2014, before-tax.
|
Disclaimer
The tender offer (the “Offer”) described in this presentation has not yet commenced, and this presentation is neither an offer to purchase nor a solicitation of an offer to sell any shares of the common stock of Athlon Energy Inc. (“Athlon”) or any other securities. On the commencement date of the Offer, a tender offer statement on Schedule TO, including an offer to purchase, a letter of transmittal and related documents, will be filed with the United States Securities and Exchange Commission (the “SEC”) by Encana Corporation (“Encana” or the “Company”) and a Solicitation/Recommendation Statement on Schedule 14D-9 will be filed with the SEC by Athlon. The offer to purchase shares of Athlon will only be made pursuant to the offer to purchase, the letter of transmittal and related documents filed with such Schedule TO. INVESTORS AND SECURITY HOLDERS ARE URGED TO READ BOTH THE TENDER OFFER STATEMENT AND THE SOLICITATION/RECOMMENDATION STATEMENT REGARDING THE OFFER, AS THEY MAY BE AMENDED FROM TIME TO TIME, WHEN THEY BECOME AVAILABLE BECAUSE THEY WILL CONTAIN IMPORTANT INFORMATION. Investors and security holders may obtain a free copy of these statements (when available) and other documents filed with the SEC at the website maintained by the SEC at www.sec.gov or by directing such requests to the Information Agent for the Offer, which will be named in the tender offer statement.
|

Future Oriented Information
In the interests of providing Encana shareholders and potential investors with information regarding Encana, including management’s assessment of Encana’s and its subsidiaries’ future plans and operations, certain statements contained in this presentation are forward-looking statements or information within the meaning of applicable securities legislation, collectively referred to herein as “forward-looking statements.” Forward-looking statements in this presentation include, but are not limited to: achieving the company’s expectations through 2019 and beyond; the successful execution and acceleration of the company’s strategy; the company’s commitment to growing long term shareholder value through a disciplined focus on generating profitable growth; the company’s vision of becoming the leading North American oil and gas resource play company with scale and running room and replace lower margin mature natural gas with higher margin liquids production; the company’s focus on value instead of production volumes; the company’s plan to unlock value from its resource base and its continued focused investment on a limited number of oil and liquids-rich plays; the company’s expectation to accelerate the execution of other strategic initiatives; he accelerated rebalancing of the company’s portfolio by two years and sharper focus on the core business; the anticipated purchase price for Athlon; the benefits of the transaction to Encana (including achieving higher margins, being accretive to cash flow per share and becoming free cash flow positive in 2016); the massive running room of the Athlon lands (the “Lands”), including the resource potential and high-margin liquids production; expected resource potential and well inventories, including locations and production from each well; anticipated development on the Lands; the expectation that the transaction will add immediate production and will add 10 years of drilling inventory in the Permian Basin; anticipated drilling and number of rigs on the Lands by year-end 2015; the anticipated production and cash flow from Eagle Ford and the anticipated drilling and rig count in Eagle Ford in 2015; proposed pipeline expansions and infrastructure development; the expected growth and total production from the Lands through to 2019 and beyond; expected premium netbacks and the expectation that the Lands will be a strong source of cash flow for many years; the successful implementation of the company’s resource play hub expertise on the Lands and the expectation that the assets will be self-funding in 2016; the company’s plan to invest at least $1 billion in the Lands in 2015; anticipated cash flow, including free cash flow positive in 2016; anticipated production (and the composition thereof) to 2019; the expected closing date of the Athlon transaction and the expectation that closing conditions will be satisfied and regulatory approvals will be obtained; the expected closing date and timing of the other transactions; the company’s expectation to achieve its 2017 target of operating cash flow from production in 2015; expected compound annual growth rate of cash flow per share through to 2017; the company’s expectation to continue to successfully execute on its strategy, maintain operational excellence, balance sheet strength and be well positioned for further success; the company’s plans to reduce costs, improve efficiencies, strengthen cash flow and maximize margins; the company’s focus on operational excellence and leveraging technology and technical expertise across the business and optimizing operations on both base and core growth assets; anticipated capital investment; anticipated debt repayments and the ability to make such repayments; anticipated joint venture funding and resulting benefits; the company’s joint venture and third party commitments and the expectation to fulfill same; expectation to hedge our production to protect our capital program; anticipated drilling and number of rigs and the success thereof and anticipated production from wells to 2017 (including in the DJ Basin, Montney, San Juan, Duvernay and Tuscaloosa Marine Shale growth areas); anticipated 2014 carry capital; the company’s belief that its well positioned to exceed 10% reduction in the 2014 base decline; the company’s plans and timing with respect to appraisal and commerciality of the Tuscaloosa Marine Shale; the anticipated timing and plan to finalize the Duvernay/Montney midstream solution; anticipated oil, natural gas and NGLs prices to 2017 and beyond; anticipated dividends and the expected benefit to shareholders in 2014; maintaining an investment grade credit rating; anticipated cash and cash equivalents; and the expectation of meeting the targets in the company’s 2014 corporate guidance.
Readers are cautioned not to place undue reliance on forward-looking statements, as there can be no assurance that the plans, intentions or expectations upon which they are based will occur. By their nature, forward-looking statements involve numerous assumptions, known and unknown risks and uncertainties, both general and specific, that contribute to the possibility that the predictions, forecasts, projections and other forward-looking statements will not occur, which may cause the company’s actual performance and financial results in future periods to differ materially from any estimates or projections of future performance or results expressed or implied by such forward-looking statements. These assumptions, risks and uncertainties include, among other things: volatility of, and assumptions regarding natural gas and liquids prices, including substantial or extended decline of the same and their adverse effect on the company’s operations and financial condition and the value and amount of its reserves; assumptions based upon the company’s current guidance; fluctuations in currency and interest rates; risk that the company may not conclude divestitures of certain assets or other transactions or receive amounts contemplated under the transaction agreements (such transactions may include third-party capital investments, farm-outs or partnerships, which Encana may refer to from time to time as “partnerships” or “joint ventures” and the funds received in respect thereof which
Encana may refer to from time to time as “proceeds”, “deferred purchase price” and/or “carry capital”, regardless of the legal form) as a result of various conditions not being met; product supply and demand; market competition; risks inherent in the company’s and its subsidiaries’ marketing operations, including credit risks; imprecision of reserves estimates and estimates of recoverable quantities of natural gas and liquids from resource plays and other sources not currently classified as proved, probable or possible reserves or economic contingent resources, including future net revenue estimates; marketing margins; potential disruption or unexpected technical difficulties in developing new facilities; unexpected cost increases or technical difficulties in constructing or modifying processing facilities; risks associated with technology; the company’s ability to acquire or find additional reserves; hedging activities resulting in realized and unrealized losses; business interruption and casualty losses; risk of the company not operating all of its properties and assets; counterparty risk; risk of downgrade in credit rating and its adverse effects; liability for indemnification obligations to third parties; variability of dividends to be paid; its ability to generate sufficient cash flow from operations to meet its current and future obligations; its ability to access external sources of debt and equity capital; the timing and the costs of well and pipeline construction; the company’s ability to secure adequate product transportation; changes in royalty, tax, environmental, greenhouse gas, carbon, accounting and other laws or regulations or the interpretations of such laws or regulations; political and economic conditions in the countries in which the company operates; terrorist threats; risks associated with existing and potential future lawsuits and regulatory actions made against the company; risk arising from price basis differential; risk arising from inability to enter into attractive hedges to protect the company’s capital program; and other risks and uncertainties described from time to time in the reports and filings made with securities regulatory authorities by Encana. There can be no assurance that the transaction will be completed. Completion of the transaction is subject to a number of risks and uncertainties, including that at least a majority of the Athlon shares on a fully diluted basis have tendered to the Offer, that the waiting period under the U.S. Hart-Scott-Rodino Act has expired or been terminated, and other customary conditions. Although Encana believes that the expectations represented by such forward-looking statements are reasonable, there can be no assurance that such expectations will prove to be correct. Readers are cautioned that the foregoing list of important factors is not exhaustive. In addition, assumptions relating to such forward-looking statements generally include Encana’s current expectations and projections made in light of, and generally consistent with, its historical experience and its perception of historical trends, including the conversion of resources into reserves and production as well as expectations regarding rates of advancement and innovation, generally consistent with and informed by its past experience, all of which are subject to the risk factors identified elsewhere in this presentation. Assumptions with respect to forward-looking information regarding expanding Encana’s oil and NGLs production and extraction volumes are based on existing expansion of natural gas processing facilities in areas where Encana operates and the continued expansion and development of oil and NGL production from existing properties within its asset portfolio.
Forward-looking information respecting anticipated 2014 cash flow for Encana is based upon, among other things, achieving average production for 2014 of between 2.40 Bcf/d and 2.50 Bcf/d of natural gas and 86,000 bbls/d to 91,000 bbls/d of liquids, commodity prices for natural gas and liquids based on NYMEX $4.50 per MMBtu and WTI of $98 per bbl, an estimated U.S./Canadian dollar foreign exchange rate of $0.90 and a weighted average number of outstanding shares for Encana of approximately 741 million.
Furthermore, the forward-looking statements contained in this presentation are made as of the date hereof and, except as required by law, Encana undertakes no obligation to update publicly or revise any forward-looking statements, whether as a result of new information, future events or otherwise. The forward-looking statements contained in this presentation are expressly qualified by this cautionary statement.
|
Advisory Regarding Reserves Data & Other Oil & Gas Information Disclosure Protocols
National Instrument (“NI”) 51-101 of the Canadian Securities Administrators imposes oil and gas disclosure standards for Canadian public companies such as Encana engaged in oil and gas activities. Encana complies with the NI 51-101 annual disclosure requirements in its annual information form, most recently dated February 20, 2014 (“AIF”). The Canadian protocol disclosure is contained in Appendix A and under “Narrative Description of the Business” in the AIF. Encana has obtained an exemption dated January 4, 2011 from certain requirements of NI 51-101 to permit it to provide certain disclosure prepared in accordance with U.S. disclosure requirements, in addition to the Canadian protocol disclosure. That disclosure is primarily set forth in Appendix D of the AIF.
Reserves are the estimated remaining quantities of oil and natural gas and related substances anticipated to be recoverable from known accumulations, from a given date forward, based on: analysis of drilling, geological, geophysical and engineering data, the use of established technology, and specified economic conditions, which are generally accepted as being reasonable. Proved reserves are those reserves which can be estimated with a high degree of certainty to be recoverable. It is likely that the actual remaining quantities recovered will exceed the estimated proved reserves. Probable reserves are those additional reserves that are less certain to be recovered than proved reserves. It is equally likely that the actual remaining quantities recovered will be greater or less than the sum of the estimated proved plus probable reserves. Possible reserves are those additional reserves that are less certain to be recovered than probable reserves. It is unlikely that the actual remaining quantities recovered will exceed the sum of the estimated proved plus probable plus possible reserves .
The estimates of economic contingent resources contained in this presentation are based on definitions contained in the Canadian Oil and Gas Evaluation Handbook (“COGEH”). Contingent resources do not constitute, and should not be confused with, reserves. Contingent resources are defined as those quantities of petroleum estimated, on a given date, to be potentially recoverable from known accumulations using established technology or technology under development, but which are not currently considered to be commercially recoverable due to one or more contingencies. Economic contingent resources are those contingent resources that are currently economically recoverable. In examining economic viability, the same fiscal conditions have been applied as in the estimation of reserves. There is a range of uncertainty of estimated recoverable volumes. A low estimate is considered to be a conservative estimate of the quantity that will actually be recovered. It is likely that the actual remaining quantities recovered will exceed the low estimate, which under probabilistic methodology reflects a 90 percent confidence level. A best estimate is considered to be a realistic estimate of the quantity that will actually be recovered. It is equally likely that the actual remaining quantities recovered will be greater or less than the best estimate, which under probabilistic methodology reflects a 50 percent confidence level. A high estimate is considered to be an optimistic estimate. It is unlikely that the actual remaining quantities recovered will exceed the high estimate, which under probabilistic methodology reflects a 10 percent confidence level.
There is no certainty that it will be commercially viable to produce any portion of the volumes currently classified as economic contingent resources. The primary contingencies which currently prevent the classification of Encana’s disclosed economic contingent resources as reserves include the lack of a reasonable expectation that all internal and external approvals will be forthcoming and the lack of a documented intent to develop the resources within a reasonable time frame. Other commercial considerations that may preclude the classification of contingent resources as reserves include factors such as legal, environmental, political and regulatory matters or a lack of markets.
The estimates of various classes of reserves (proved, probable, possible) and of contingent resources (low, best, high) in this presentation represent arithmetic sums of multiple estimates of such classes for different properties, which statistical principles indicate may be misleading as to volumes that may actually be recovered. Readers should give attention to the estimates of individual classes of reserves and contingent resources and appreciate the differing probabilities of recovery associated with each class.
Encana uses the terms resource play, total petroleum initially-in-place, natural gas-in-place, and crude oil-in-place. Resource play is a term used by Encana to describe an accumulation of hydrocarbons known to exist over a large areal expanse and/or thick vertical section, which when compared to a conventional play, typically has a lower geological and/or commercial development risk and lower average decline rate. Total petroleum initially-in-place (“PIIP”) is defined by the Society of Petroleum Engineers—Petroleum Resources Management System (“SPE-PRMS”) as that quantity of petroleum that is estimated to exist originally in naturally occurring accumulations. It includes that quantity of petroleum that is estimated, as of a given date, to be contained in known accumulations prior to production plus those estimated quantities in accumulations yet to be discovered (equivalent to “total resources”). Natural gas-in-place (“NGIP”) and crude oil-in-place (“COIP”) are defined in the same manner, with the substitution of “natural gas” and “crude oil” where appropriate for the word “petroleum”. As used by Encana, estimated ultimate recovery (“EUR”) has the meaning set out jointly by the Society of Petroleum Engineers and World Petroleum Congress in the year 2000, being those quantities of petroleum which are estimated, on a given date, to be potentially recoverable from an accumulation, plus those quantities already produced therefrom.
In this presentation, Encana has provided information with respect to certain of its plays and emerging opportunities which is “analogous information” as defined in NI 51-101. This analogous information includes estimates of PIIP, NGIP, COIP or EUR, all as defined in the COGEH or by the SPE-PRMS, and/or production type curves. This analogous information is presented on a basin, sub-basin or area basis utilizing data derived from Encana’s internal sources, as well as from a variety of publicly available information sources which are predominantly independent in nature. Some of this data may not have been prepared by qualified reserves evaluators or auditors and the preparation of any estimates may not be in strict accordance with COGEH. Regardless, estimates by engineering and geo-technical practitioners may vary and the differences may be significant. Encana believes that the provision of this analogous information is relevant to Encana’s oil and gas activities, given its acreage position and operations (either ongoing or planned) in the areas in question.
Due to the early life nature of the various emerging plays discussed in this document, PIIP is the most relevant specific assignable category of estimated resources. Estimates by engineering and geo-technical practitioners may vary and the differences may be significant. There is no certainty that it will be commercially viable to produce any portion of the estimated PIIP. There is also no certainty that it will be commercially viable to produce any portion of the estimated NGIP, COIP or EUR.
30-day IP and short-term rates are not necessarily indicative of long-term performance or of ultimate recovery.
In this presentation, certain oil and NGLs volumes have been converted to cubic feet equivalent (cfe) on the basis of one barrel (bbl) to six thousand cubic feet (Mcf). Cfe may be misleading, particularly if used in isolation. A conversion ratio of one bbl to six Mcf is based on an energy equivalency conversion method primarily applicable at the burner tip and does not represent value equivalency at the well head. Given that the value ratio based on the current price of oil as compared to natural gas is significantly different from the energy equivalency of 6:1, utilizing a conversion on a 6:1 basis may be misleading as an indication of value.
For convenience, references in this presentation to “Encana”, the “Company”, “we”, “us” and “our” may, where applicable, refer only to or include any relevant direct and indirect subsidiary corporations and partnerships (“Subsidiaries”) of Encana Corporation, and the assets, activities and initiatives of such Subsidiaries.
|

Investor Relations Contacts
Brian Dutton | Director, Investor Relations
403.645.2285 | brian.dutton@encana.com
Patti Posadowski | Senior Advisor, Investor Relations
403.645.2252 | patti.posadowski@encana.com
encana.com