Exhibit (c)(4)
Confidential – Preliminary and Subject to Change Discussion Materials Regarding Project Houston October 6, 2022
Confidential – Preliminary and Subject to Change These materials have been prepared by Evercore Group L.L.C. (“Evercore”) for the Conflicts Committee (the “Conflicts Committee”) of the Board of Directors of Sisecam Resource Partners LLC, the general partner of Sisecam Resources LP (the “Partnership”), to whom such materials are directly addressed and delivered and may not be used or relied upon for any purpose other than as specifically contemplated by a written agreement with Evercore. These materials are based on information provided by or on behalf of the Conflicts Committee, from public sources or otherwise reviewed by Evercore. Evercore assumes no responsibility for independent investigation or verification of such information and has relied on such information being complete and accurate in all material respects. To the extent such information includes estimates and forecasts of future financial performance prepared by or reviewed with the management of the Partnership and/or other potential transaction participants or obtained from public or other third party sources, Evercore has assumed that such estimates and forecasts have been reasonably prepared on bases reflecting the best currently available estimates and judgments of such management (or, with respect to estimates and forecasts obtained from public sources, represent reasonable estimates). No representation or warranty, express or implied, is made as to the accuracy or completeness of such information and nothing contained herein is, or shall be relied upon as, a representation, whether as to the past, the present or the future. These materials were designed for use by specific persons familiar with the business and affairs of the Partnership. These materials are not intended to provide the sole basis for evaluating, and should not be considered a recommendation with respect to, any transaction or other matter. These materials have been developed by and are proprietary to Evercore and were prepared exclusively for the benefit and internal use of the Conflicts Committee. These materials were compiled on a confidential basis for use exclusively by the Conflicts Committee and not with a view to public disclosure or filing thereof under state or federal securities laws, and may not be reproduced, disseminated, quoted or referred to, in whole or in part, without the prior written consent of Evercore or as provided in the engagement letter between Evercore and the Conflicts Committee. These materials do not constitute an offer or solicitation to sell or purchase any securities and are not a commitment by Evercore or any of its affiliates to provide or arrange any financing for any transaction or to purchase any security in connection therewith. Evercore assumes no obligation to update or otherwise revise these materials. These materials may not reflect information known to other professionals in other business areas of Evercore and its affiliates. Evercore and its affiliates do not provide legal, accounting or tax advice. Accordingly, any statements contained herein as to tax matters were neither written nor intended by Evercore or its affiliates to be used and cannot be used by any taxpayer for the purpose of avoiding tax penalties that may be imposed on such taxpayer. Each person should seek legal, accounting and tax advice based on his, her or its particular circumstances from independent advisors regarding the impact of the transactions or matters described herein.
Confidential – Preliminary and Subject to Change Table of Contents Section Executive Summary SIRE Situation Analysis Preliminary Valuation of SIRE Common Units Appendix Weighted Average Cost of Capital Analysis Preliminary Valuation Detail – SIRE Financial Projections Financial Projections and Preliminary Valuation Detail – Sensitivity Case #1 Sensitivity Case #2 – Illustrative Unit 8 Expansion Economics Financial Projections and Preliminary Valuation Detail – Sensitivity Case #3 I II III
Confidential – Preliminary and Subject to Change I. Executive Summary
Confidential – Preliminary and Subject to Change Executive Summary 1 Introduction Evercore Group L.L.C. (“Evercore”) is pleased to provide the following materials to the Conflicts Committee (the “Conflicts Committee”) of the Board of Directors of Sisecam Resource Partners LLC (the “General Partner” or “SIRE GP”), the general partner of Sisecam Resources LP (“SIRE” or the “Partnership”), regarding Sisecam Chemicals Resources LLC’s (“Sisecam Chemicals” or “SCR”) proposal to acquire all common units representing limited partner interests in the Partnership (each, a “Common Unit”) from the holders of such units other than Common Units held by Sisecam Chemicals, the General Partner or their respective affiliates (the “Unaffiliated Unitholders”) (the “Proposed Transaction”) Sisecam Chemicals Wyoming LLC (“SCW LLC”) is a wholly-owned subsidiary of Sisecam Chemicals that currently owns: 14,551,000 Common Units (72% limited partner interest in the Partnership) SIRE GP, which owns a 2.0% general partner interest in the Partnership On July 5, 2022, Sisecam Chemicals proposed to acquire each outstanding Common Unit owned by the Unaffiliated Unitholders for $17.90 in cash (the “Initial Proposal”), and on September 20, 2022, the Conflicts Committee countered at $29.50 (the “Conflicts Committee Counterproposal”) On September 27, 2022, Sisecam Chemicals proposed to acquire each outstanding Common Unit owned by the Unaffiliated Unitholders for $19.00 in cash (the “Proposed Consideration”) The Proposed Consideration represents a 5.8% premium to SIRE’s closing Common Unit price of $17.95 as of July 5, 2022, the last unaffected trading date before the Initial Proposal The Proposed Consideration represents a 6.3% premium to SIRE’s 30-day volume weighted average price (“VWAP”) as of July 5, 2022
Confidential – Preliminary and Subject to Change Executive Summary 2 Changes Since Conflicts Committee Meeting on September 20, 2022 Evercore made the following updates and adjustments from the draft presentation dated September 20, 2022, as requested by the Conflicts Committee: Updated market prices to October 4, 2022 Added an incremental Sensitivity Case for the SIRE Financial Projections (“Sensitivity Case #3”), including: i. IHS price forecasts adjusted based on more recent historical difference between IHS pricing and SIRE’s historical realized price per ton ii. production volumes as provided in the SIRE Financial Projections iii. gross margin as a percent of net revenue consistent with historical results
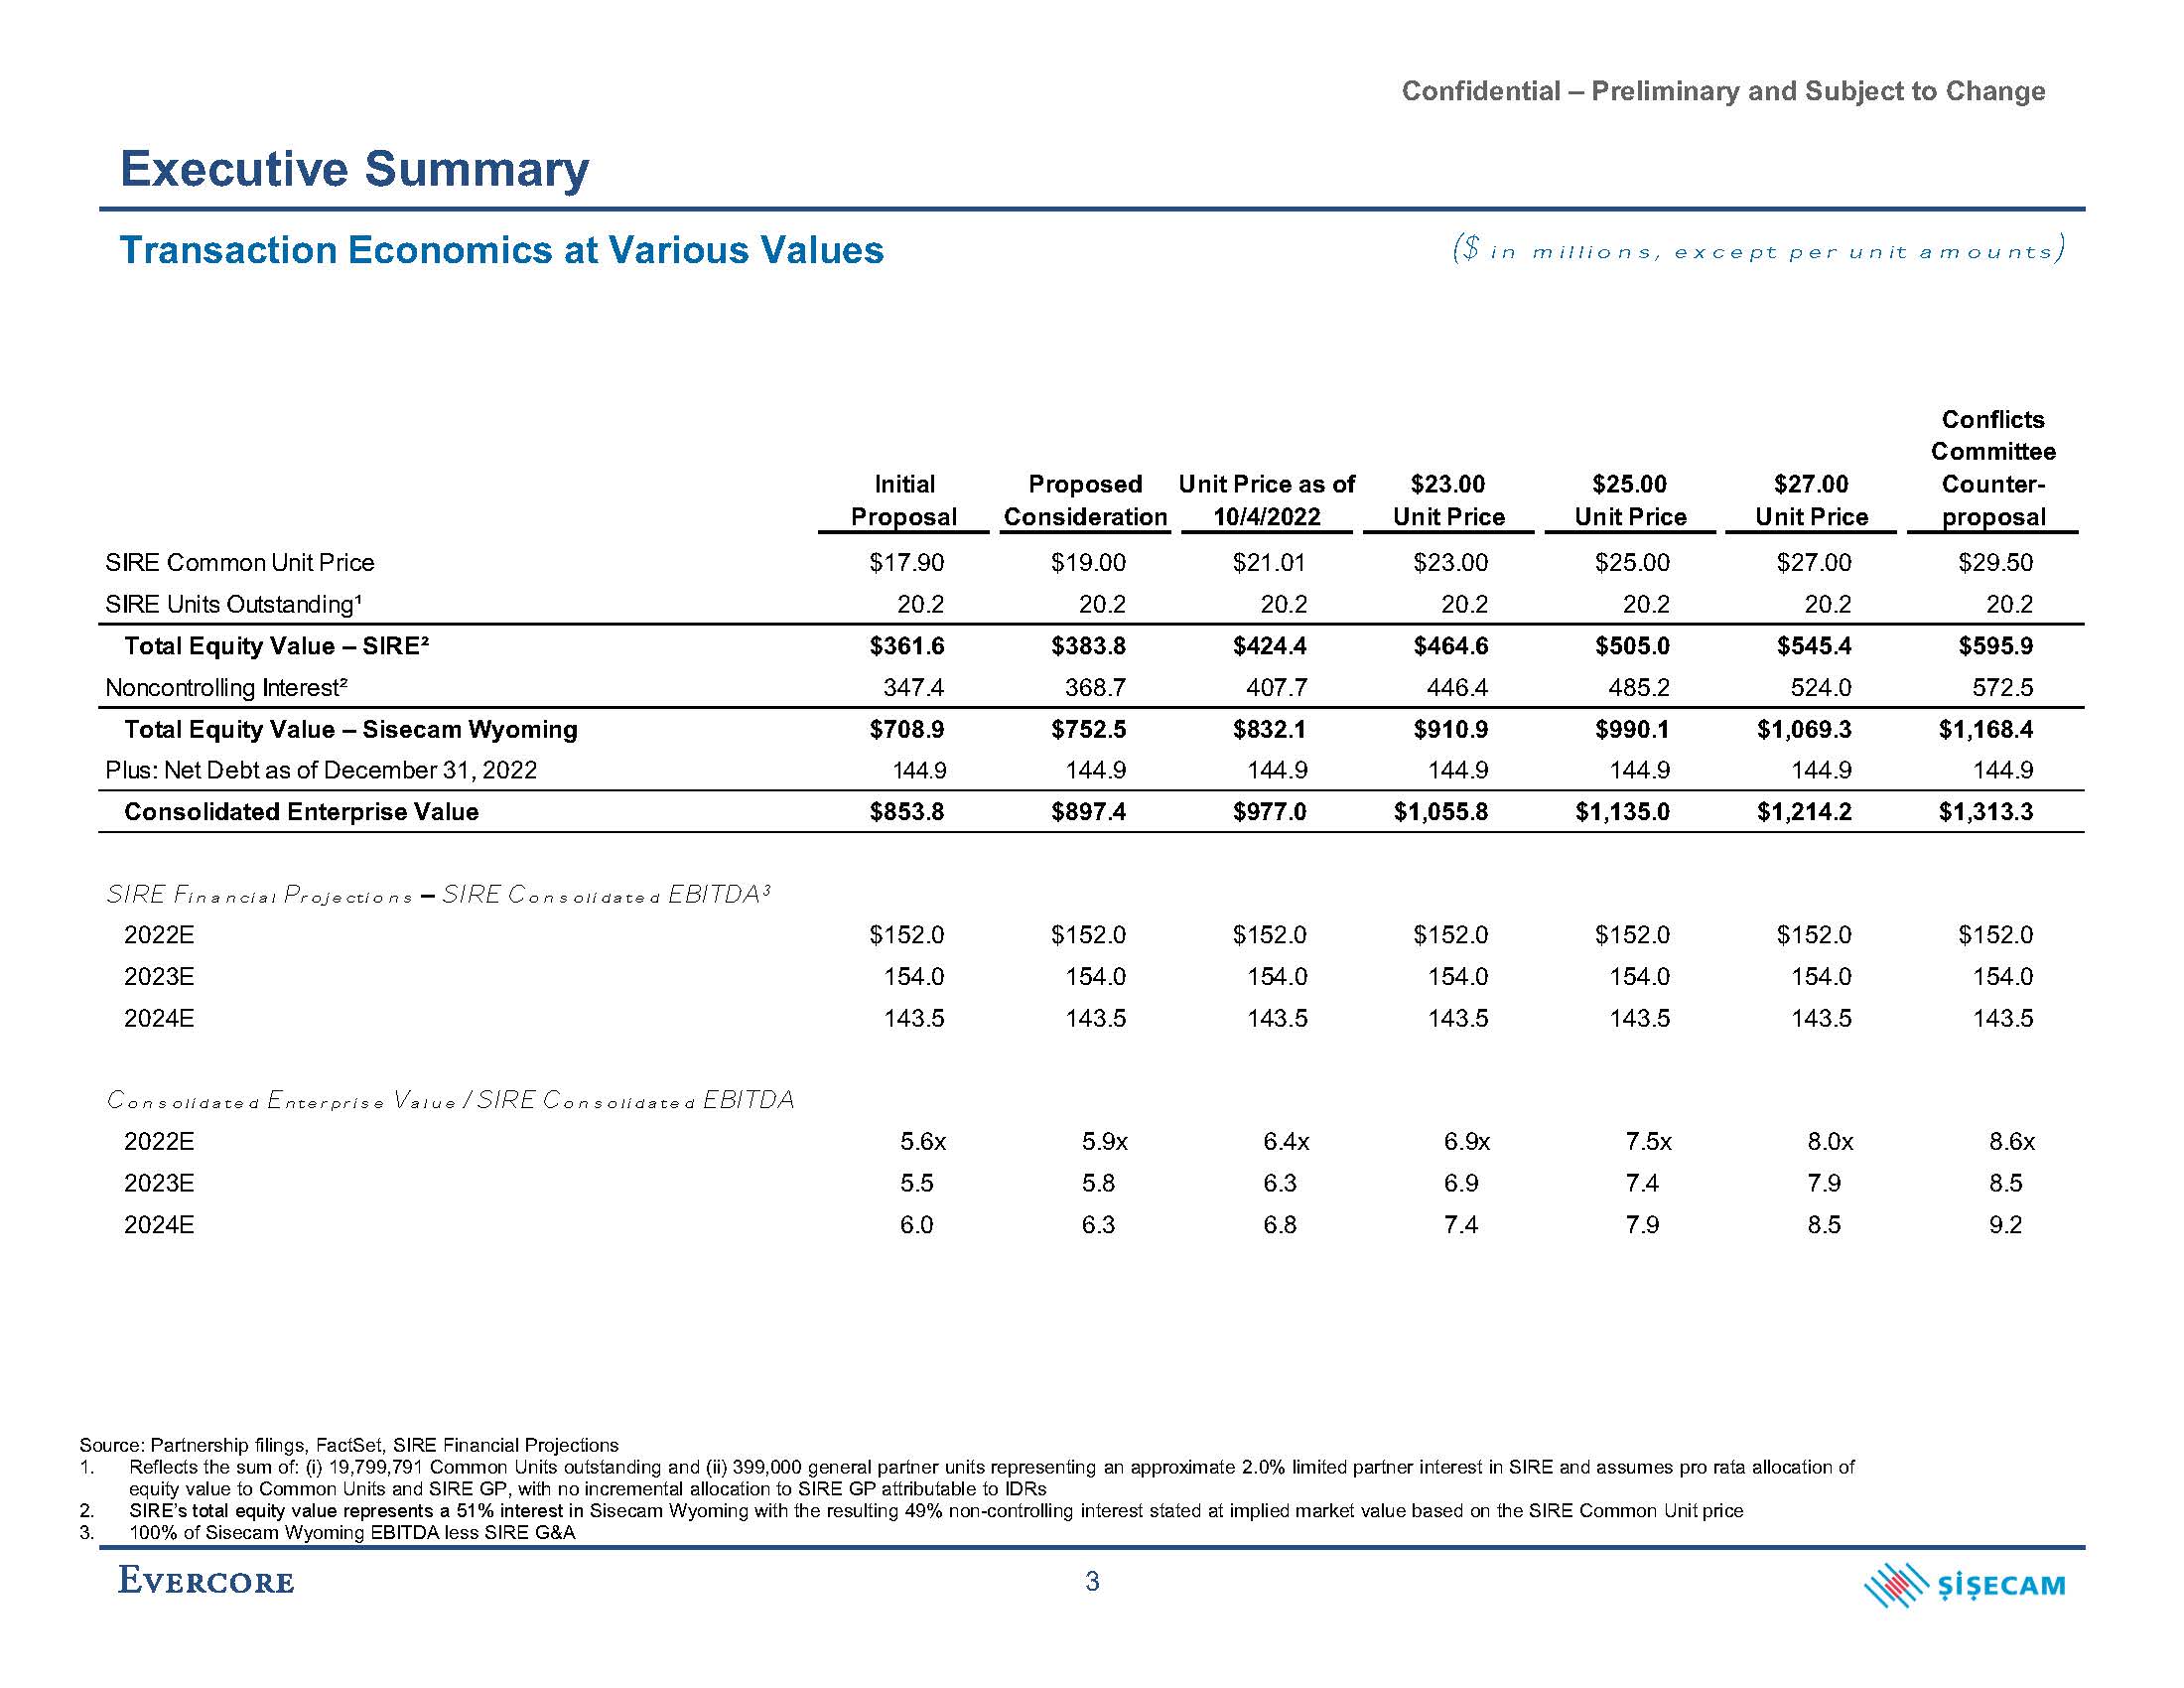
Confidential – Preliminary and Subject to Change Executive Summary 3 Transaction Economics at Various Values ($ in millions, except per unit amounts) Source: Partnership filings, FactSet, SIRE Financial Projections Reflects the sum of: (i) 19,799,791 Common Units outstanding and (ii) 399,000 general partner units representing an approximate 2.0% limited partner interest in SIRE and assumes pro rata allocation of equity value to Common Units and SIRE GP, with no incremental allocation to SIRE GP attributable to IDRs SIRE’s total equity value represents a 51% interest in Sisecam Wyoming with the resulting 49% non-controlling interest stated at implied market value based on the SIRE Common Unit price 100% of Sisecam Wyoming EBITDA less SIRE G&A Conflicts Committee Initial Proposed Unit Price as of $23.00 $25.00 $27.00 Counter- Proposal Consideration 10/4/2022 Unit Price Unit Price Unit Price proposal SIRE Common Unit Price $17.90 $19.00 $21.01 $23.00 $25.00 $27.00 $29.50 SIRE Units Outstanding¹ 20.2 20.2 20.2 20.2 20.2 20.2 20.2 Total Equity Value – SIRE² $361.6 $383.8 $424.4 $464.6 $505.0 $545.4 $595.9 Noncontrolling Interest² 347.4 368.7 407.7 446.4 485.2 524.0 572.5 Total Equity Value – Sisecam Wyoming $708.9 $752.5 $832.1 $910.9 $990.1 $1,069.3 $1,168.4 Plus: Net Debt as of December 31, 2022 144.9 144.9 144.9 144.9 144.9 144.9 144.9 Consolidated Enterprise Value $853.8 $897.4 $977.0 $1,055.8 $1,135.0 $1,214.2 $1,313.3 SIRE Financial Projections – SIRE Consolidated EBITDA³ 2022E $152.0 $152.0 $152.0 $152.0 $152.0 $152.0 $152.0 2023E 154.0 154.0 154.0 154.0 154.0 154.0 154.0 2024E 143.5 143.5 143.5 143.5 143.5 143.5 143.5 Consolidated Enterprise Value / SIRE Consolidated EBITDA 2022E 5.6x 5.9x 6.4x 6.9x 7.5x 8.0x 8.6x 2023E 5.5 5.8 6.3 6.9 7.4 7.9 8.5 2024E 6.0 6.3 6.8 7.4 7.9 8.5 9.2
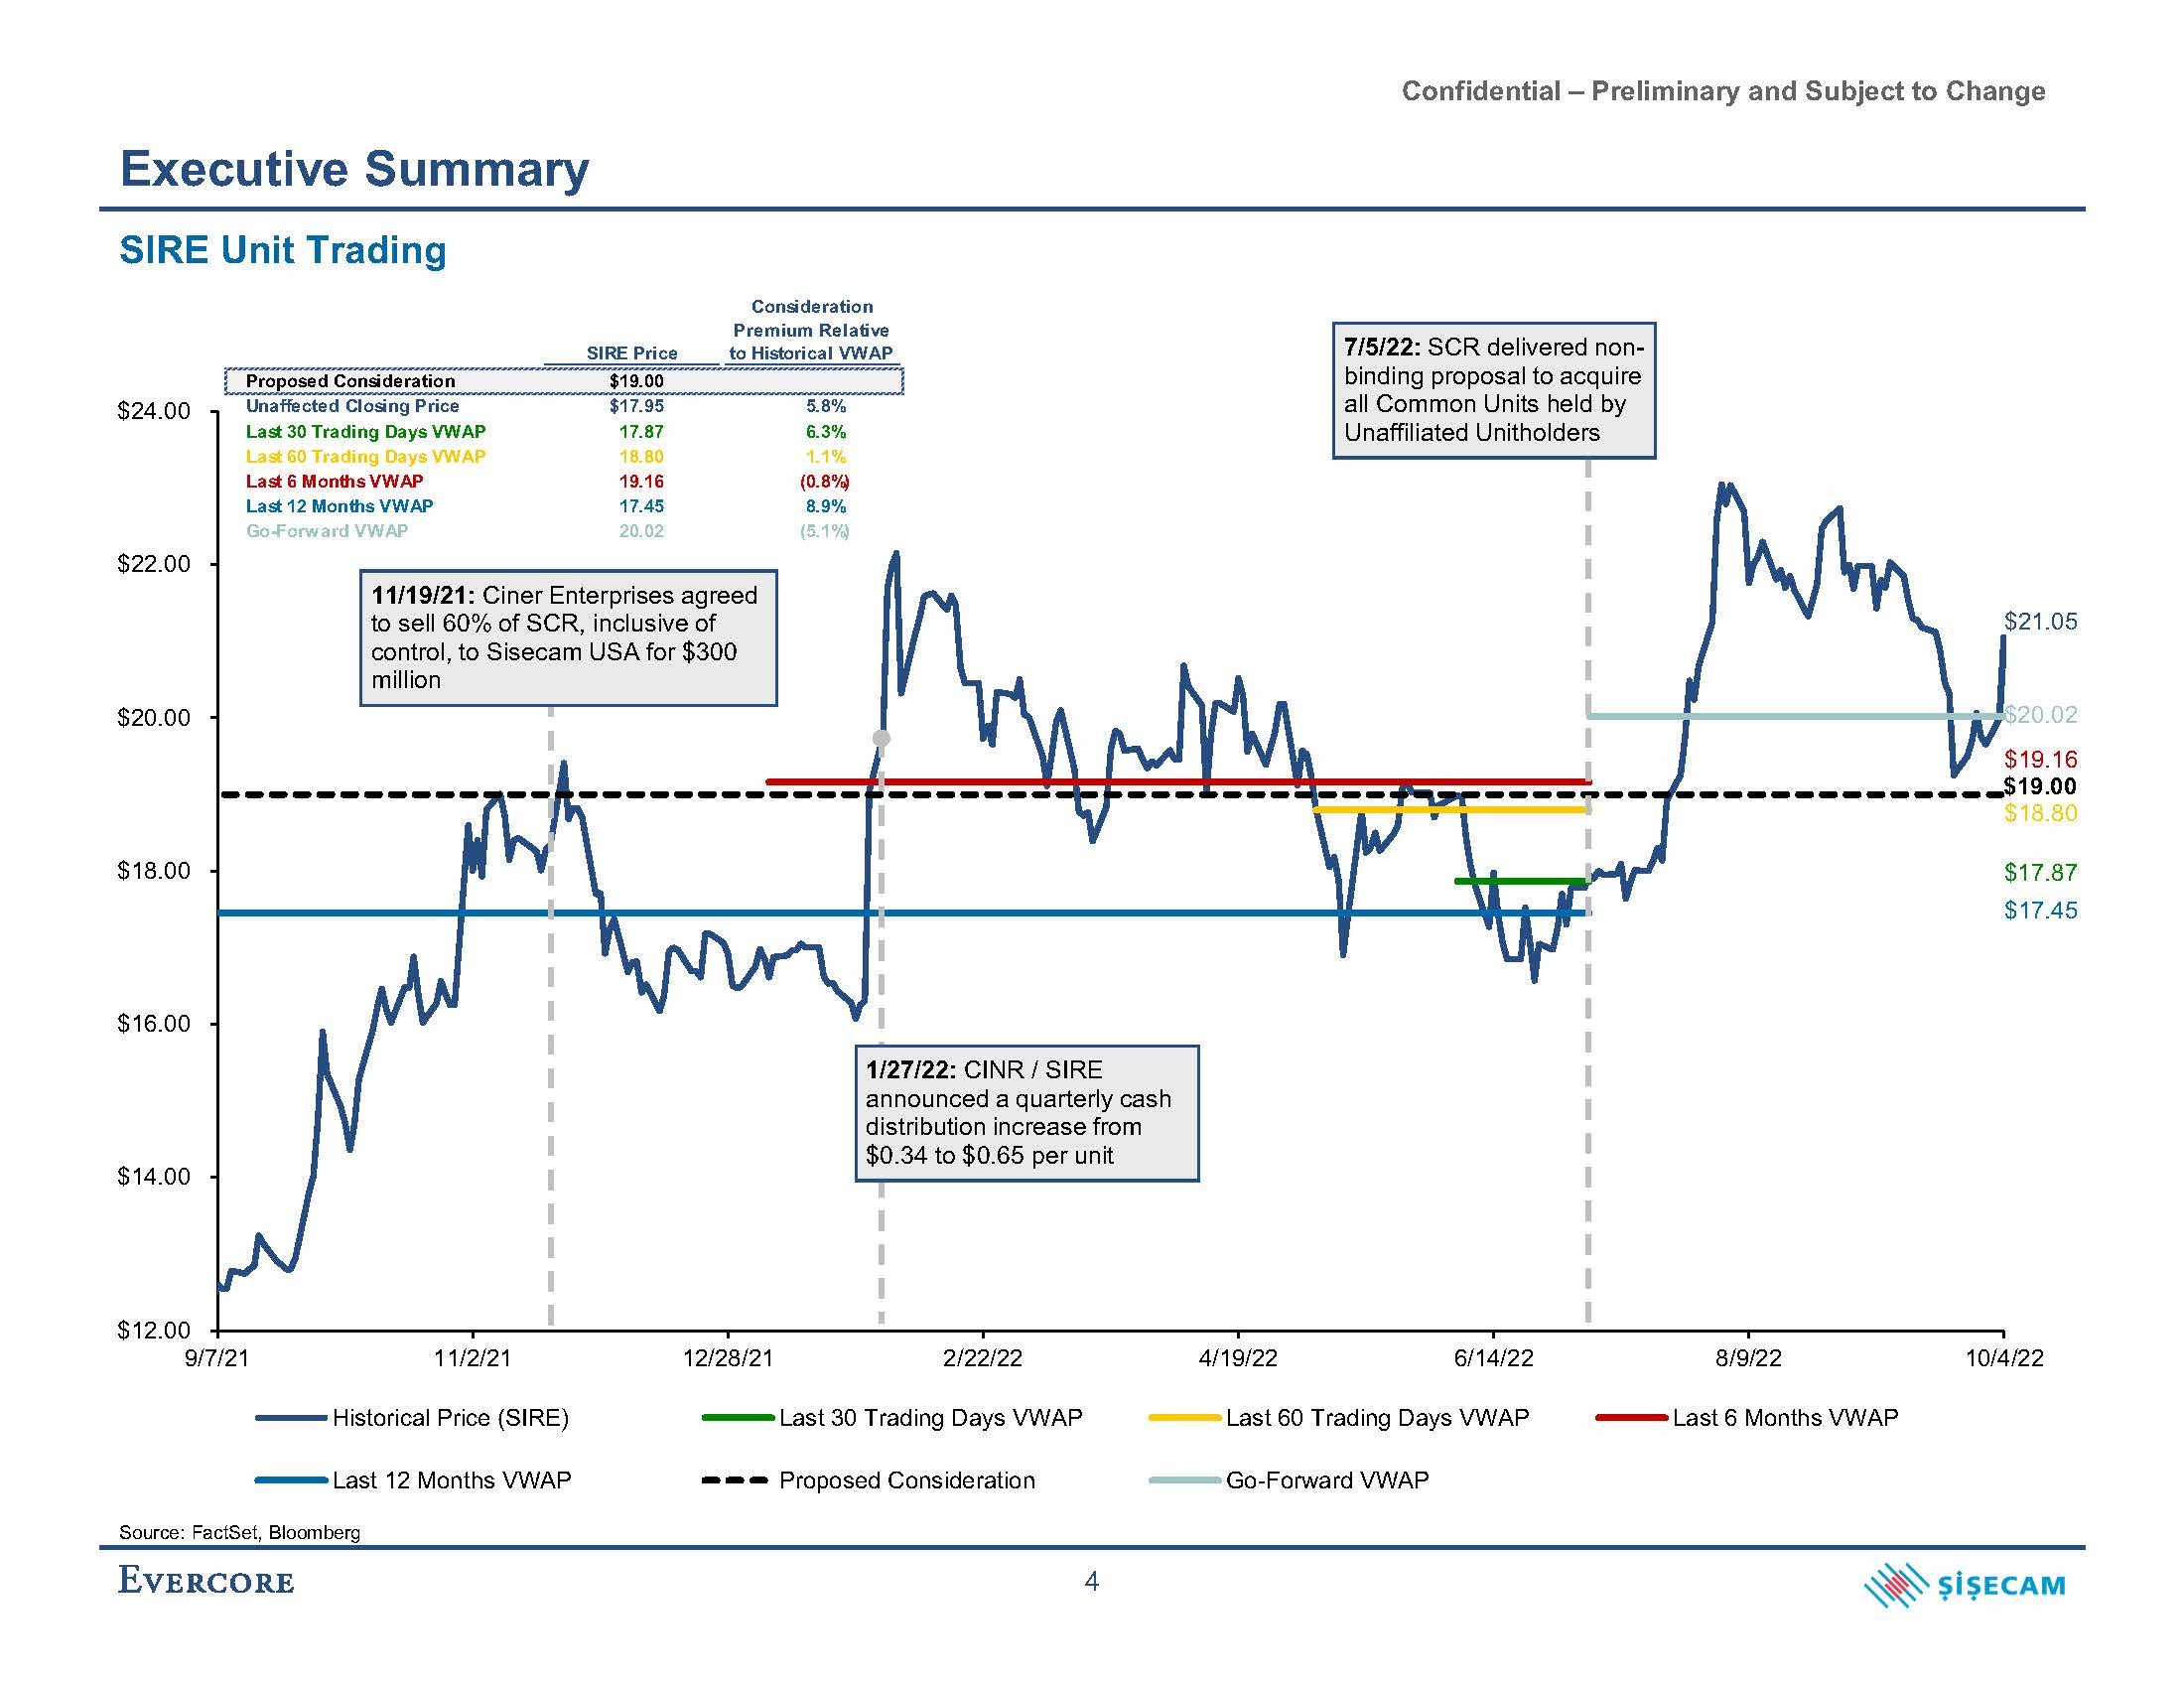
Confidential – Preliminary and Subject to Change $21.05 $17.87 $17.45 $19.00 $18.80 $20.02 $19.16 $12.00 $14.00 $16.00 $18.00 $20.00 $22.00 $24.00 9/7/21 11/2/21 12/28/21 2/22/22 8/9/22 10/4/22 Historical Price (SIRE) Last 30 Trading Days VWAP 4/19/22 6/14/22 Last 60 Trading Days VWAP Last 6 Months VWAP Last 12 Months VWAP Proposed Consideration Go-Forward VWAP Executive Summary SIRE Unit Trading 7/5/22: SCR delivered non- binding proposal to acquire all Common Units held by Unaffiliated Unitholders 11/19/21: Ciner Enterprises agreed to sell 60% of SCR, inclusive of control, to Sisecam USA for $300 million 1/27/22: CINR / SIRE announced a quarterly cash distribution increase from $0.34 to $0.65 per unit Consideration Premium Relative SIRE Price to Historical VWAP Proposed Consideration $19.00 Unaffected Closing Price Last 30 Trading Days VWAP Last 60 Trading Days VWAP $17.95 17.87 18.80 5.8% 6.3% 1.1% (0.8%) 8.9% Last 6 Months VWAP Last 12 Months VWAP Go-Forward VWAP 19.16 17.45 20.02 (5.1%) Source: FactSet, Bloomberg 4
Confidential – Preliminary and Subject to Change II. SIRE Situation Analysis
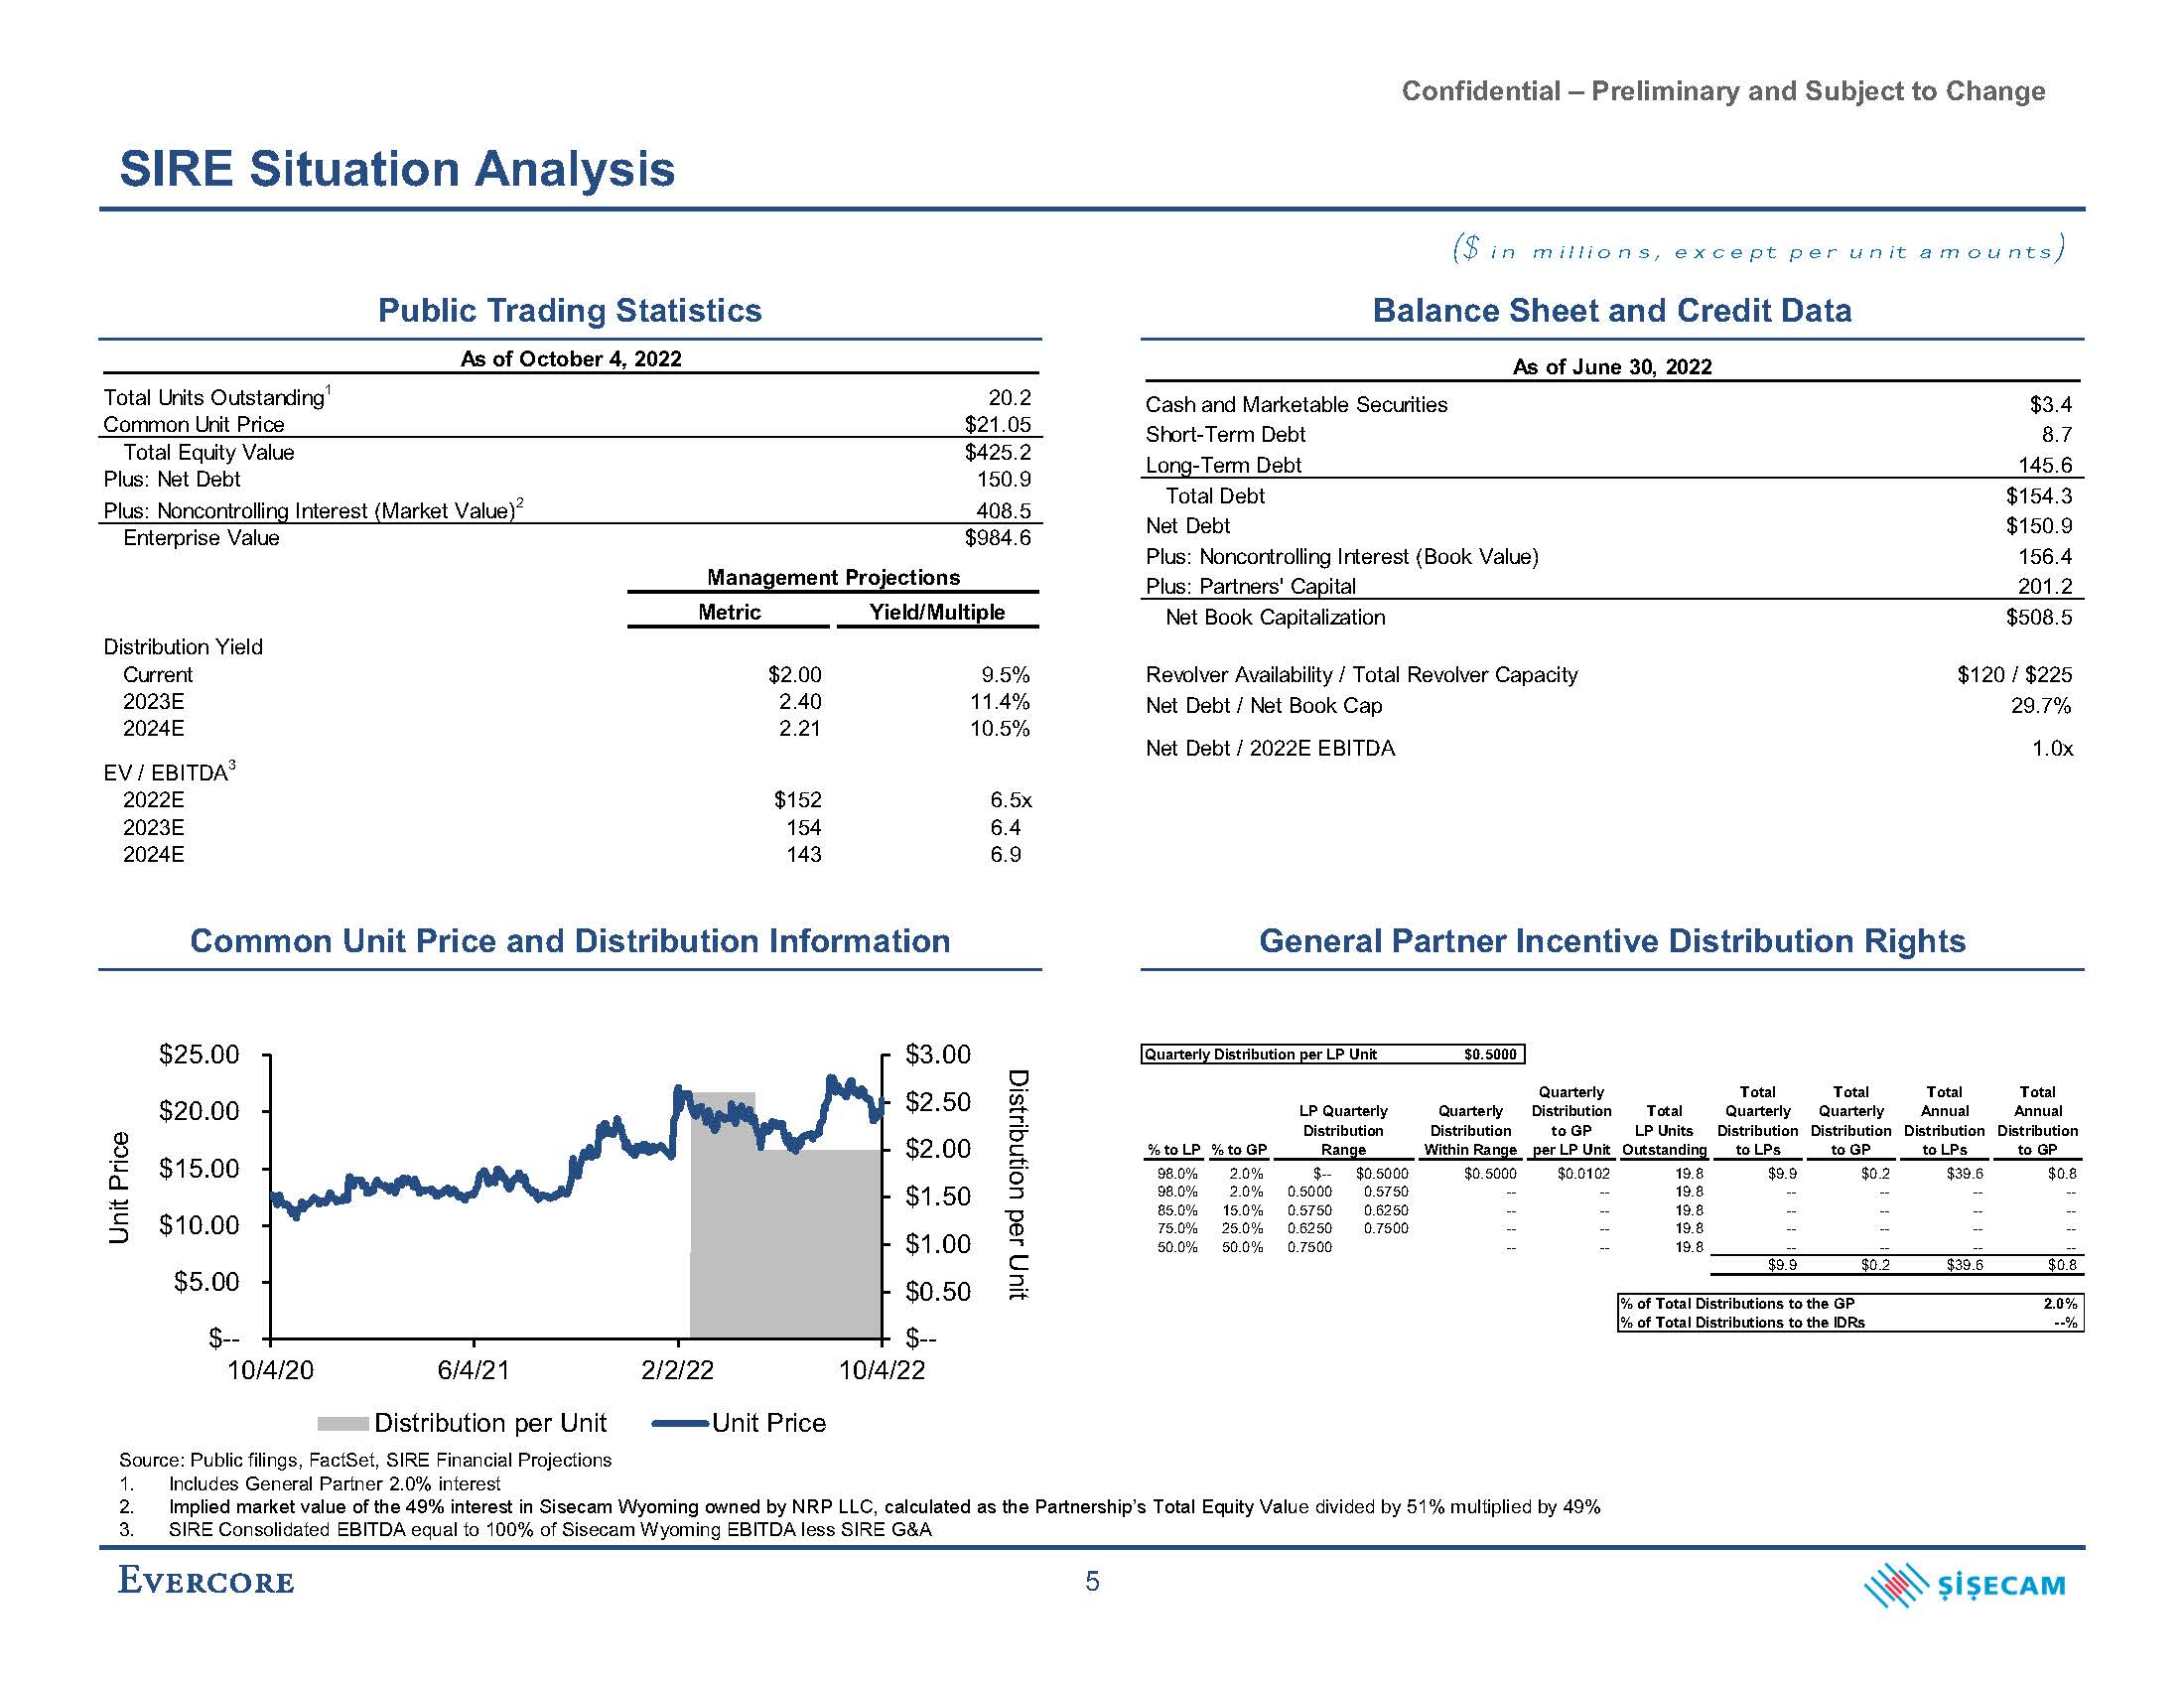
Confidential – Preliminary and Subject to Change SIRE Situation Analysis Public Trading Statistics ($ in millions, except per unit amounts) Balance Sheet and Credit Data Common Unit Price and Distribution Information General Partner Incentive Distribution Rights As of June 30, 2022 Cash and Marketable Securities Short-Term Debt Long-Term Debt $3.4 8.7 145.6 Total Debt Net Debt Plus: Noncontrolling Interest (Book Value) Plus: Partners' Capital $154.3 $150.9 156.4 201.2 Net Book Capitalization $508.5 Revolver Availability / Total Revolver Capacity Net Debt / Net Book Cap Net Debt / 2022E EBITDA $120 / $225 29.7% 1.0x $3.00 $2.50 $2.00 $1.50 $1.00 $0.50 $-- $-- $5.00 $10.00 $15.00 $20.00 $25.00 10/4/20 6/4/21 Distribution per Unit 10/4/22 Distribution per Unit Unit Price 2/2/22 Unit Price Quarterly Distribution per LP Unit $0.5000 Total Total Total Quarterly Quarterly Total Annual Total Annual Quarterly Quarterly Distribution Distribution to GP LP Units Distribution Distribution Distribution Distribution % to LP % to GP LP Quarterly Distribution Range Within Range per LP Unit Outstanding to LPs to GP to LPs to GP 98.0% 2.0% $-- $0.5000 $0.5000 $0.0102 19.8 $9.9 $0.2 $39.6 $0.8 98.0% 2.0% 0.5000 0.5750 -- -- 19.8 -- -- -- -- 85.0% 15.0% 0.5750 0.6250 -- -- 19.8 -- -- -- -- 75.0% 25.0% 0.6250 0.7500 -- -- 19.8 -- -- -- -- 50.0% 50.0% 0.7500 -- -- 19.8 -- -- -- -- $9.9 $0.2 $39.6 $0.8 % of Total Distributions to the GP % of Total Distributions to the IDRs 2.0% --% Source: Public filings, FactSet, SIRE Financial Projections Includes General Partner 2.0% interest Implied market value of the 49% interest in Sisecam Wyoming owned by NRP LLC, calculated as the Partnership’s Total Equity Value divided by 51% multiplied by 49% As of October 4, 2022 Total Units Outstanding1 Common Unit Price 20.2 $21.05 Total Equity Value Plus: Net Debt Plus: Noncontrolling Interest (Market Value)2 $425.2 150.9 408.5 Enterprise Value $984.6 Management Projections Metric Yield/Multiple Distribution Yield Current 2023E 2024E EV / EBITDA3 2022E 2023E 2024E $2.00 2.40 2.21 9.5% 11.4% 10.5% $152 154 143 6.5x 6.4 6.9 3. SIRE Consolidated EBITDA equal to 100% of Sisecam Wyoming EBITDA less SIRE G&A 5
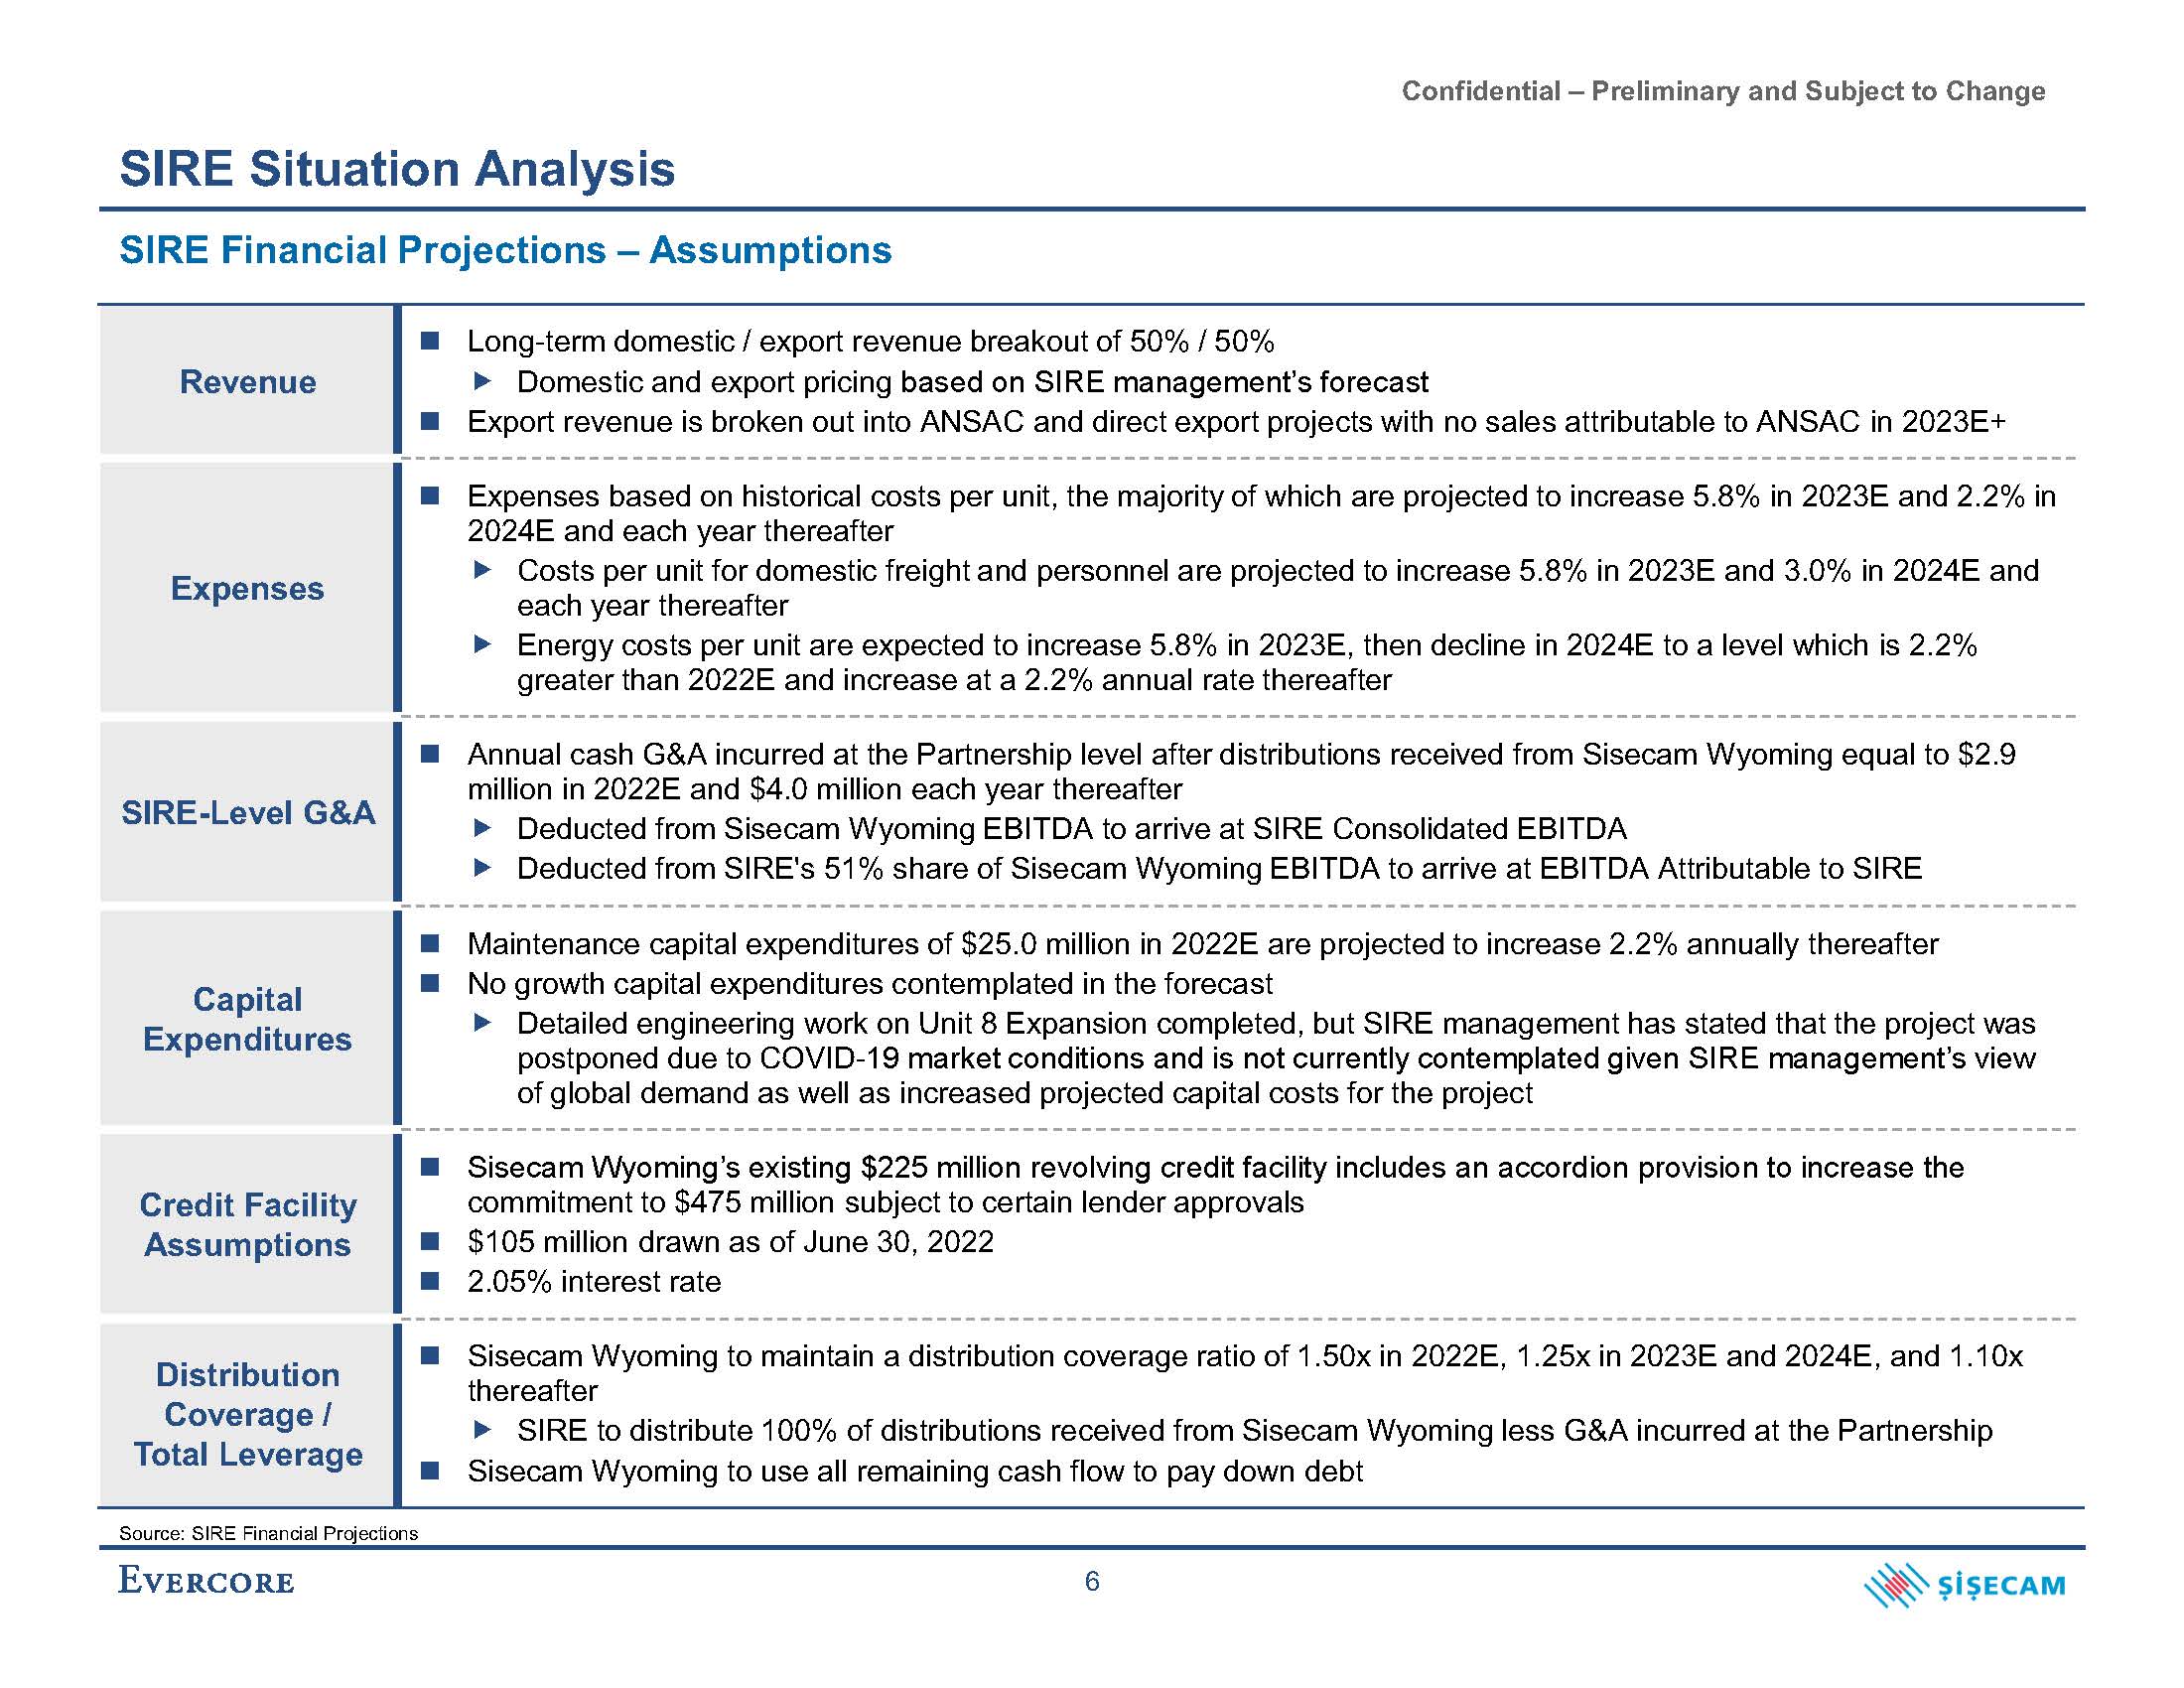
Confidential – Preliminary and Subject to Change SIRE Situation Analysis Source: SIRE Financial Projections 6 SIRE Financial Projections – Assumptions Revenue Long-term domestic / export revenue breakout of 50% / 50% Domestic and export pricing based on SIRE management’s forecast Export revenue is broken out into ANSAC and direct export projects with no sales attributable to ANSAC in 2023E+ Expenses Expenses based on historical costs per unit, the majority of which are projected to increase 5.8% in 2023E and 2.2% in 2024E and each year thereafter Costs per unit for domestic freight and personnel are projected to increase 5.8% in 2023E and 3.0% in 2024E and each year thereafter Energy costs per unit are expected to increase 5.8% in 2023E, then decline in 2024E to a level which is 2.2% greater than 2022E and increase at a 2.2% annual rate thereafter SIRE-Level G&A Annual cash G&A incurred at the Partnership level after distributions received from Sisecam Wyoming equal to $2.9 million in 2022E and $4.0 million each year thereafter Deducted from Sisecam Wyoming EBITDA to arrive at SIRE Consolidated EBITDA Deducted from SIRE's 51% share of Sisecam Wyoming EBITDA to arrive at EBITDA Attributable to SIRE Capital Expenditures Maintenance capital expenditures of $25.0 million in 2022E are projected to increase 2.2% annually thereafter No growth capital expenditures contemplated in the forecast Detailed engineering work on Unit 8 Expansion completed, but SIRE management has stated that the project was postponed due to COVID-19 market conditions and is not currently contemplated given SIRE management’s view of global demand as well as increased projected capital costs for the project Credit Facility Assumptions Sisecam Wyoming’s existing $225 million revolving credit facility includes an accordion provision to increase the commitment to $475 million subject to certain lender approvals $105 million drawn as of June 30, 2022 2.05% interest rate Distribution Coverage / Total Leverage Sisecam Wyoming to maintain a distribution coverage ratio of 1.50x in 2022E, 1.25x in 2023E and 2024E, and 1.10x thereafter SIRE to distribute 100% of distributions received from Sisecam Wyoming less G&A incurred at the Partnership Sisecam Wyoming to use all remaining cash flow to pay down debt
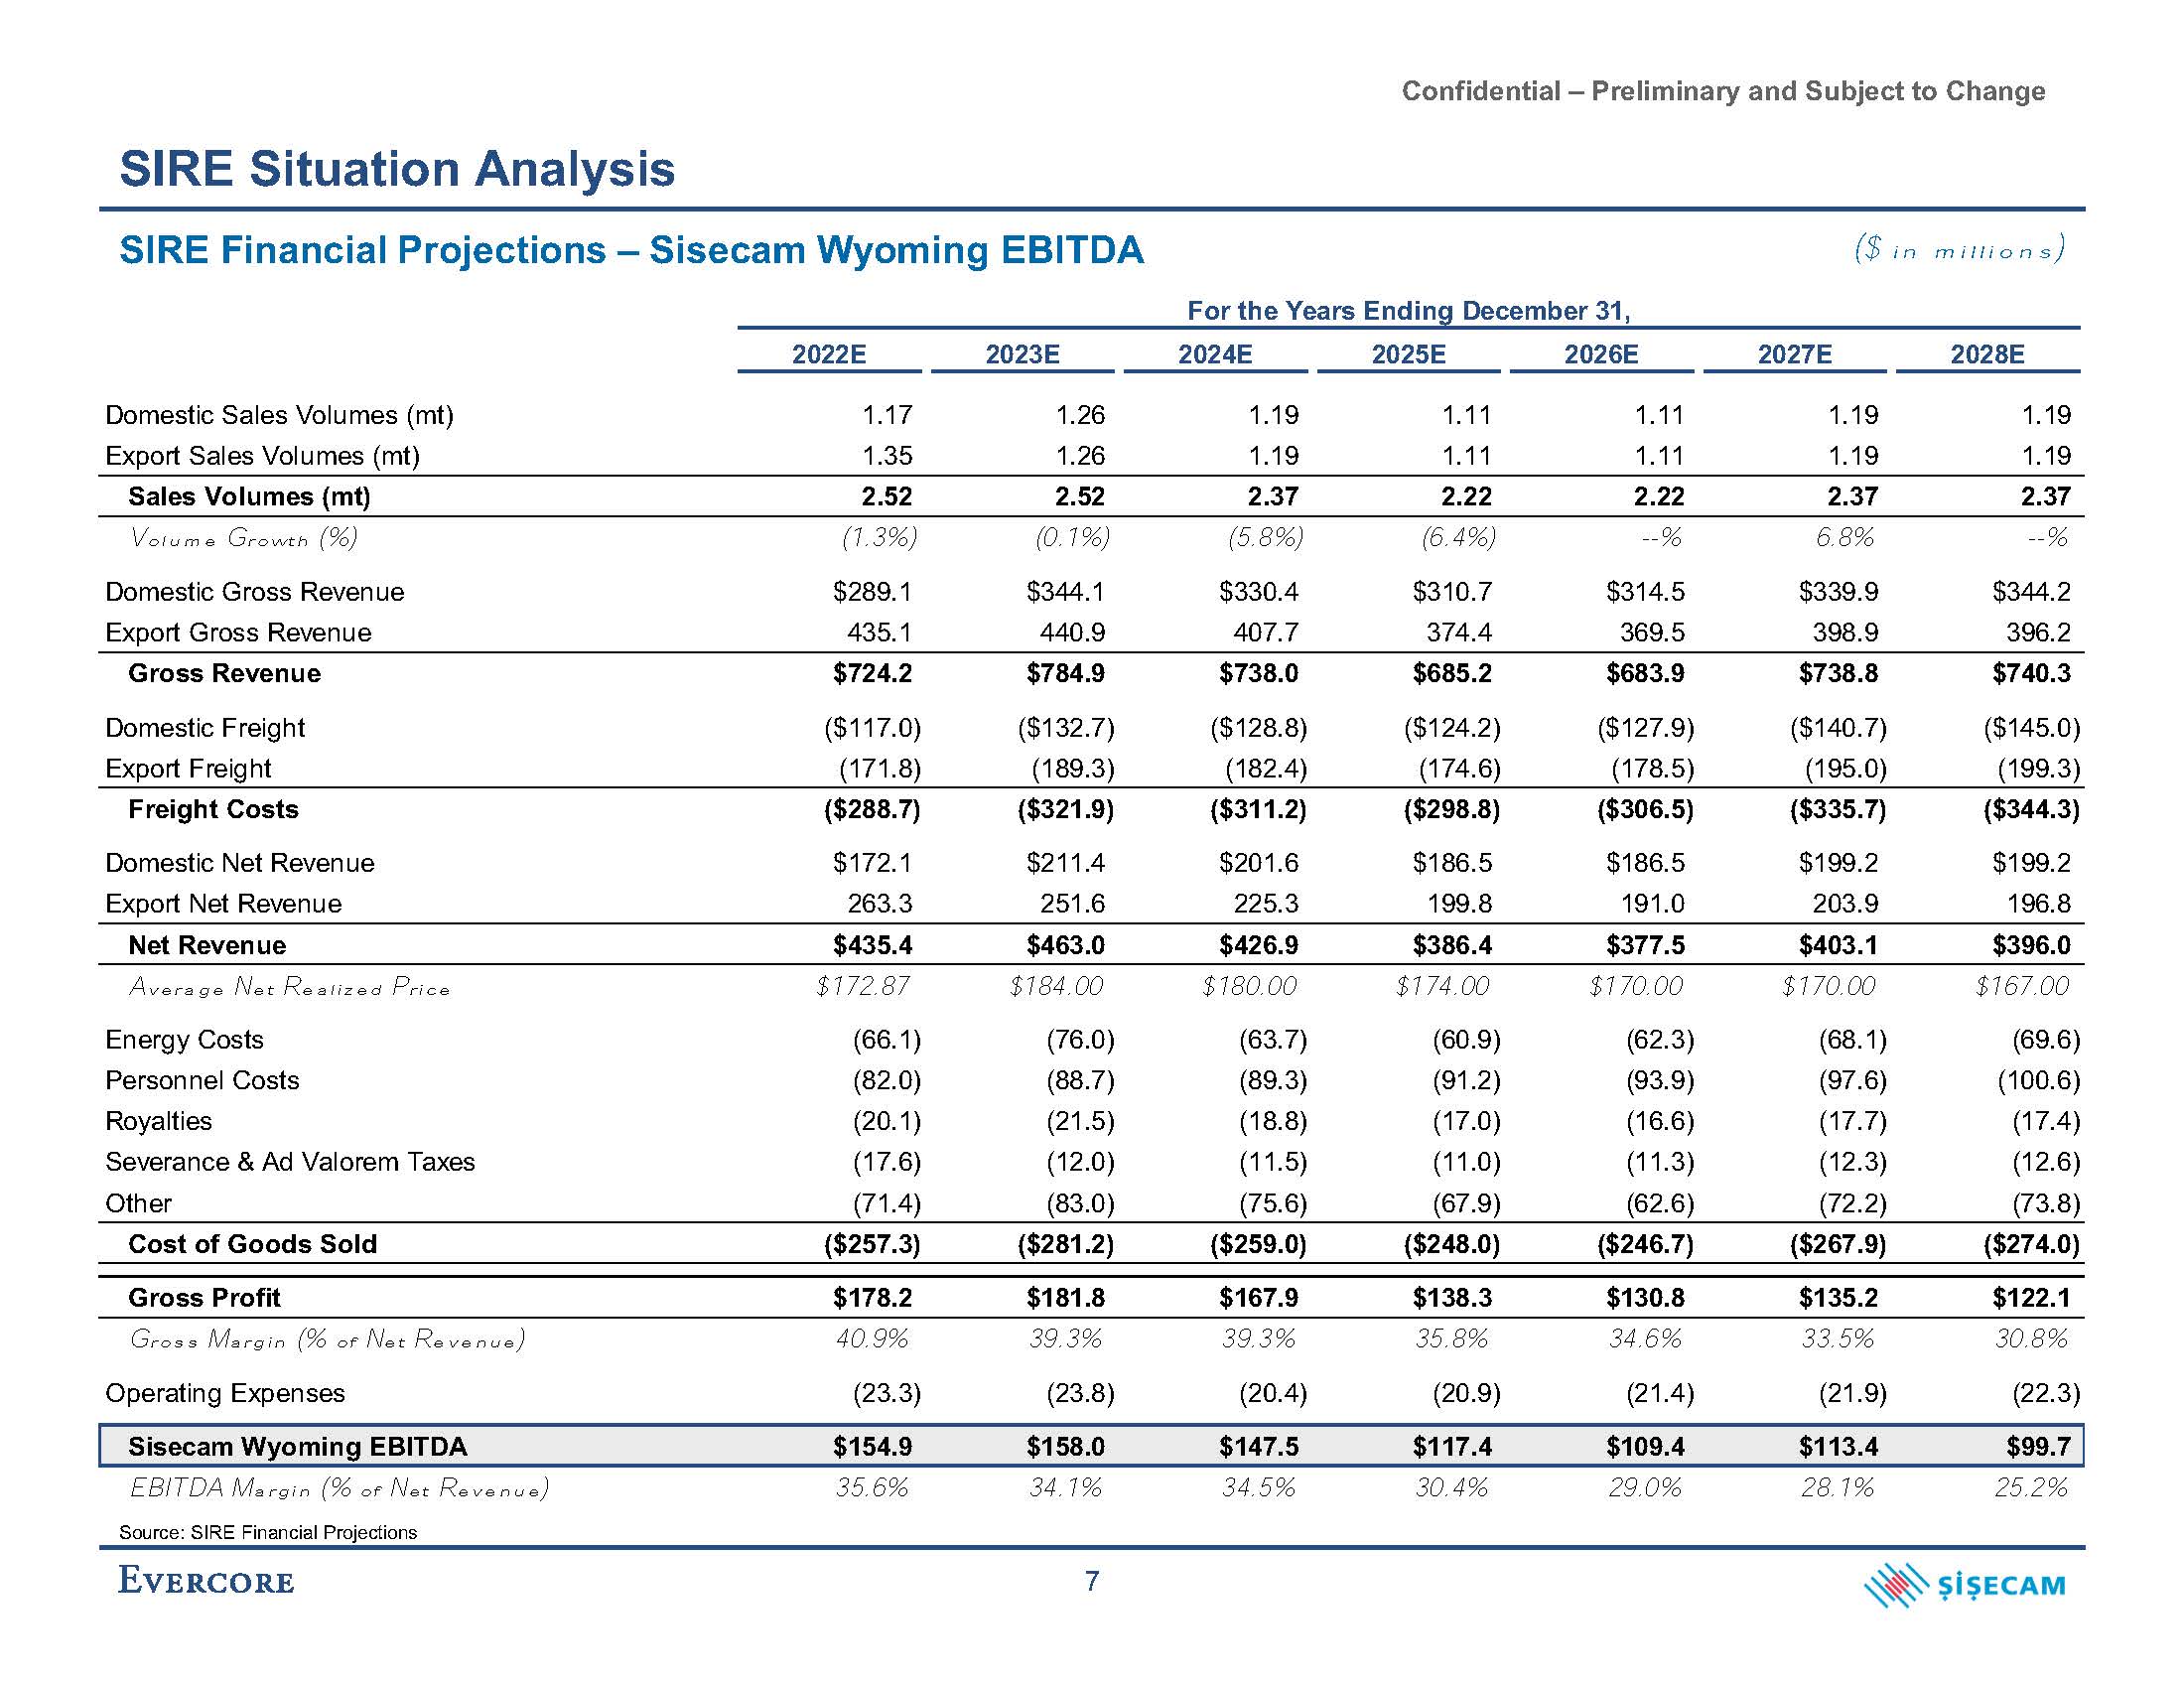
Confidential – Preliminary and Subject to Change SIRE Situation Analysis Source: SIRE Financial Projections 7 SIRE Financial Projections – Sisecam Wyoming EBITDA 2022E 2023E 2024E 2025E 2026E 2027E 2028E Domestic Sales Volumes (mt) 1.17 1.26 1.19 1.11 1.11 1.19 1.19 Export Sales Volumes (mt) 1.35 1.26 1.19 1.11 1.11 1.19 1.19 Sales Volumes (mt) 2.52 2.52 2.37 2.22 2.22 2.37 2.37 Volume Growth (%) (1.3%) (0.1%) (5.8%) (6.4%) --% 6.8% --% Domestic Gross Revenue $289.1 $344.1 $330.4 $310.7 $314.5 $339.9 $344.2 Export Gross Revenue 435.1 440.9 407.7 374.4 369.5 398.9 396.2 Gross Revenue $724.2 $784.9 $738.0 $685.2 $683.9 $738.8 $740.3 Domestic Freight ($117.0) ($132.7) ($128.8) ($124.2) ($127.9) ($140.7) ($145.0) Export Freight (171.8) (189.3) (182.4) (174.6) (178.5) (195.0) (199.3) Freight Costs ($288.7) ($321.9) ($311.2) ($298.8) ($306.5) ($335.7) ($344.3) Domestic Net Revenue $172.1 $211.4 $201.6 $186.5 $186.5 $199.2 $199.2 Export Net Revenue 263.3 251.6 225.3 199.8 191.0 203.9 196.8 Net Revenue $435.4 $463.0 $426.9 $386.4 $377.5 $403.1 $396.0 Average Net Realized Price $172.87 $184.00 $180.00 $174.00 $170.00 $170.00 $167.00 Energy Costs (66.1) (76.0) (63.7) (60.9) (62.3) (68.1) (69.6) Personnel Costs (82.0) (88.7) (89.3) (91.2) (93.9) (97.6) (100.6) Royalties (20.1) (21.5) (18.8) (17.0) (16.6) (17.7) (17.4) Severance & Ad Valorem Taxes (17.6) (12.0) (11.5) (11.0) (11.3) (12.3) (12.6) Other (71.4) (83.0) (75.6) (67.9) (62.6) (72.2) (73.8) Cost of Goods Sold ($257.3) ($281.2) ($259.0) ($248.0) ($246.7) ($267.9) ($274.0) Gross Profit $178.2 $181.8 $167.9 $138.3 $130.8 $135.2 $122.1 Gross Margin (% of Net Revenue) 40.9% 39.3% 39.3% 35.8% 34.6% 33.5% 30.8% Operating Expenses (23.3) (23.8) (20.4) (20.9) (21.4) (21.9) (22.3) Sisecam Wyoming EBITDA $154.9 $158.0 $147.5 $117.4 $109.4 $113.4 $99.7 EBITDA Margin (% of Net Revenue) 35.6% 34.1% 34.5% 30.4% 29.0% 28.1% 25.2% For the Years Ending December 31, ($ in millions)
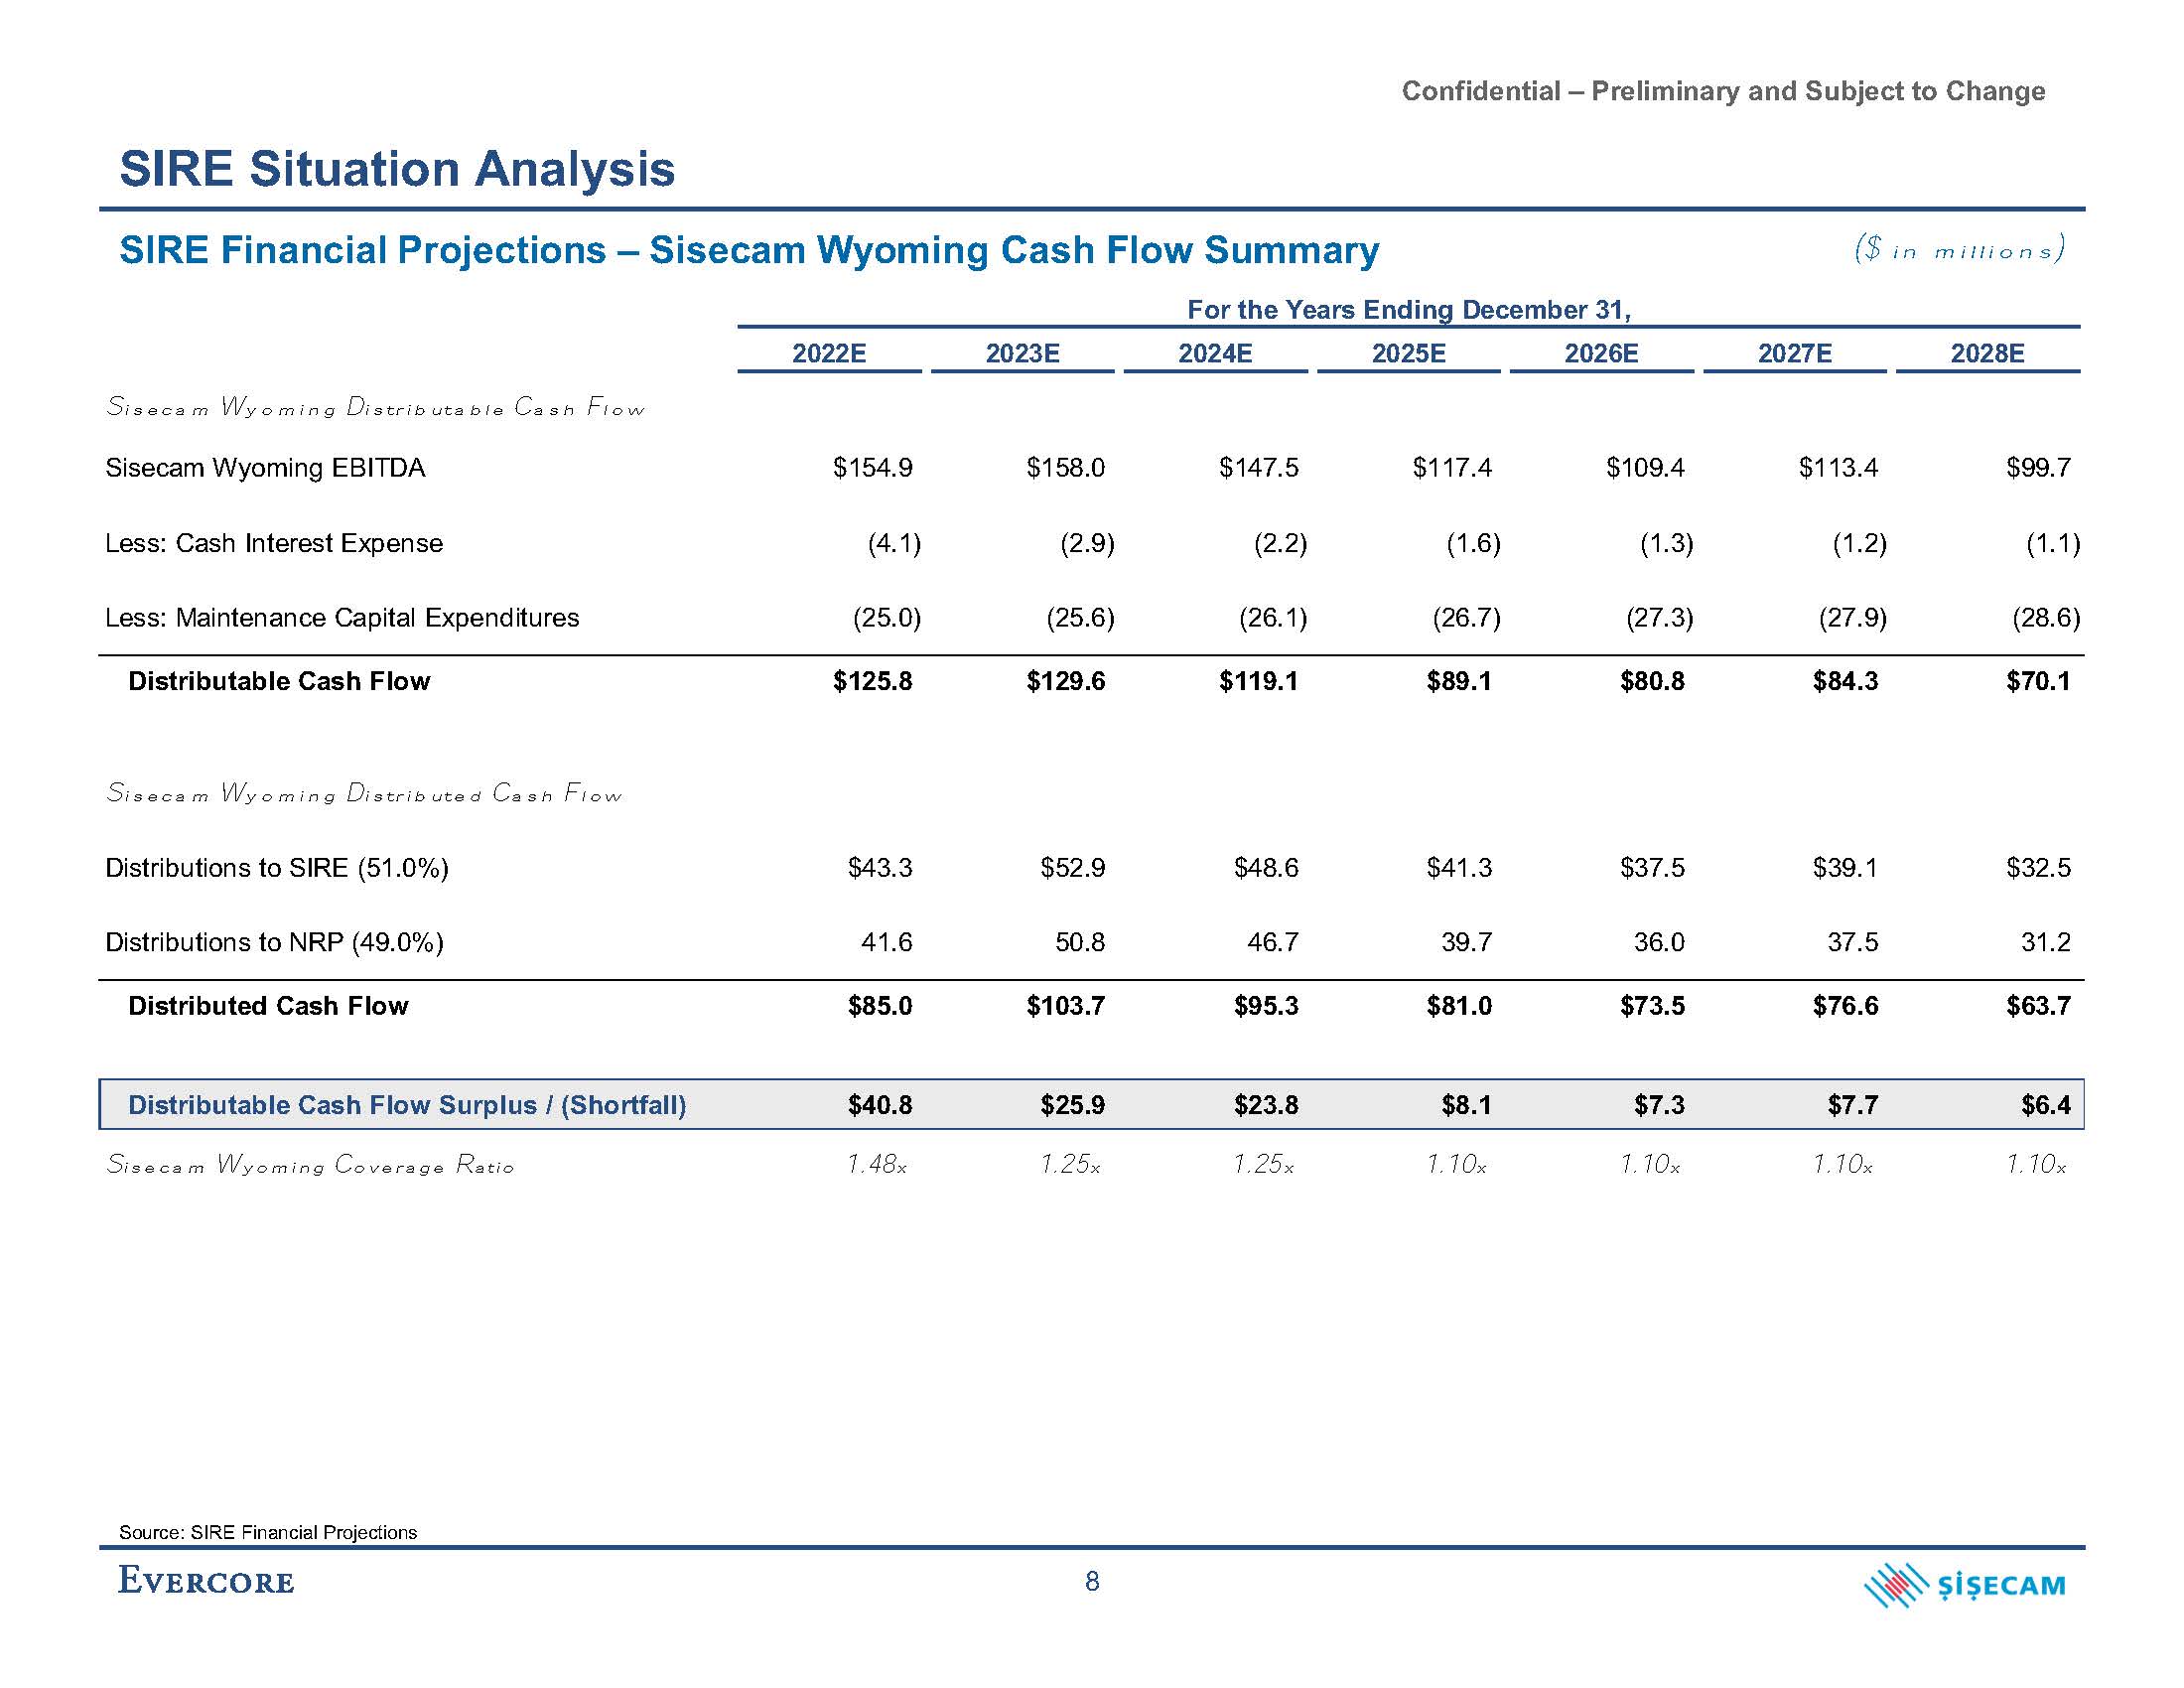
Confidential – Preliminary and Subject to Change SIRE Situation Analysis ($ in millions) Sisecam Wyoming EBITDA $154.9 $158.0 $147.5 $117.4 $109.4 $113.4 $99.7 Less: Cash Interest Expense (4.1) (2.9) (2.2) (1.6) (1.3) (1.2) (1.1) Less: Maintenance Capital Expenditures (25.0) (25.6) (26.1) (26.7) (27.3) (27.9) (28.6) Distributable Cash Flow $125.8 $129.6 $119.1 $89.1 $80.8 $84.3 $70.1 Sisecam Wyoming Distributed Cash Flow Distributions to SIRE (51.0%) $43.3 $52.9 $48.6 $41.3 $37.5 $39.1 $32.5 Distributions to NRP (49.0%) 41.6 50.8 46.7 39.7 36.0 37.5 31.2 Distributed Cash Flow $85.0 $103.7 $95.3 $81.0 $73.5 $76.6 $63.7 Distributable Cash Flow Surplus / (Shortfall) $40.8 $25.9 $23.8 $8.1 $7.3 $7.7 $6.4 Sisecam Wyoming Coverage Ratio 1.48x 1.25x 1.25x 1.10x 1.10x 1.10x 1.10x SIRE Financial Projections – Sisecam Wyoming Cash Flow Summary For the Years Ending December 31, 2022E 2023E 2024E 2025E 2026E 2027E 2028E Sisecam Wyoming Distributable Cash Flow Source: SIRE Financial Projections 8
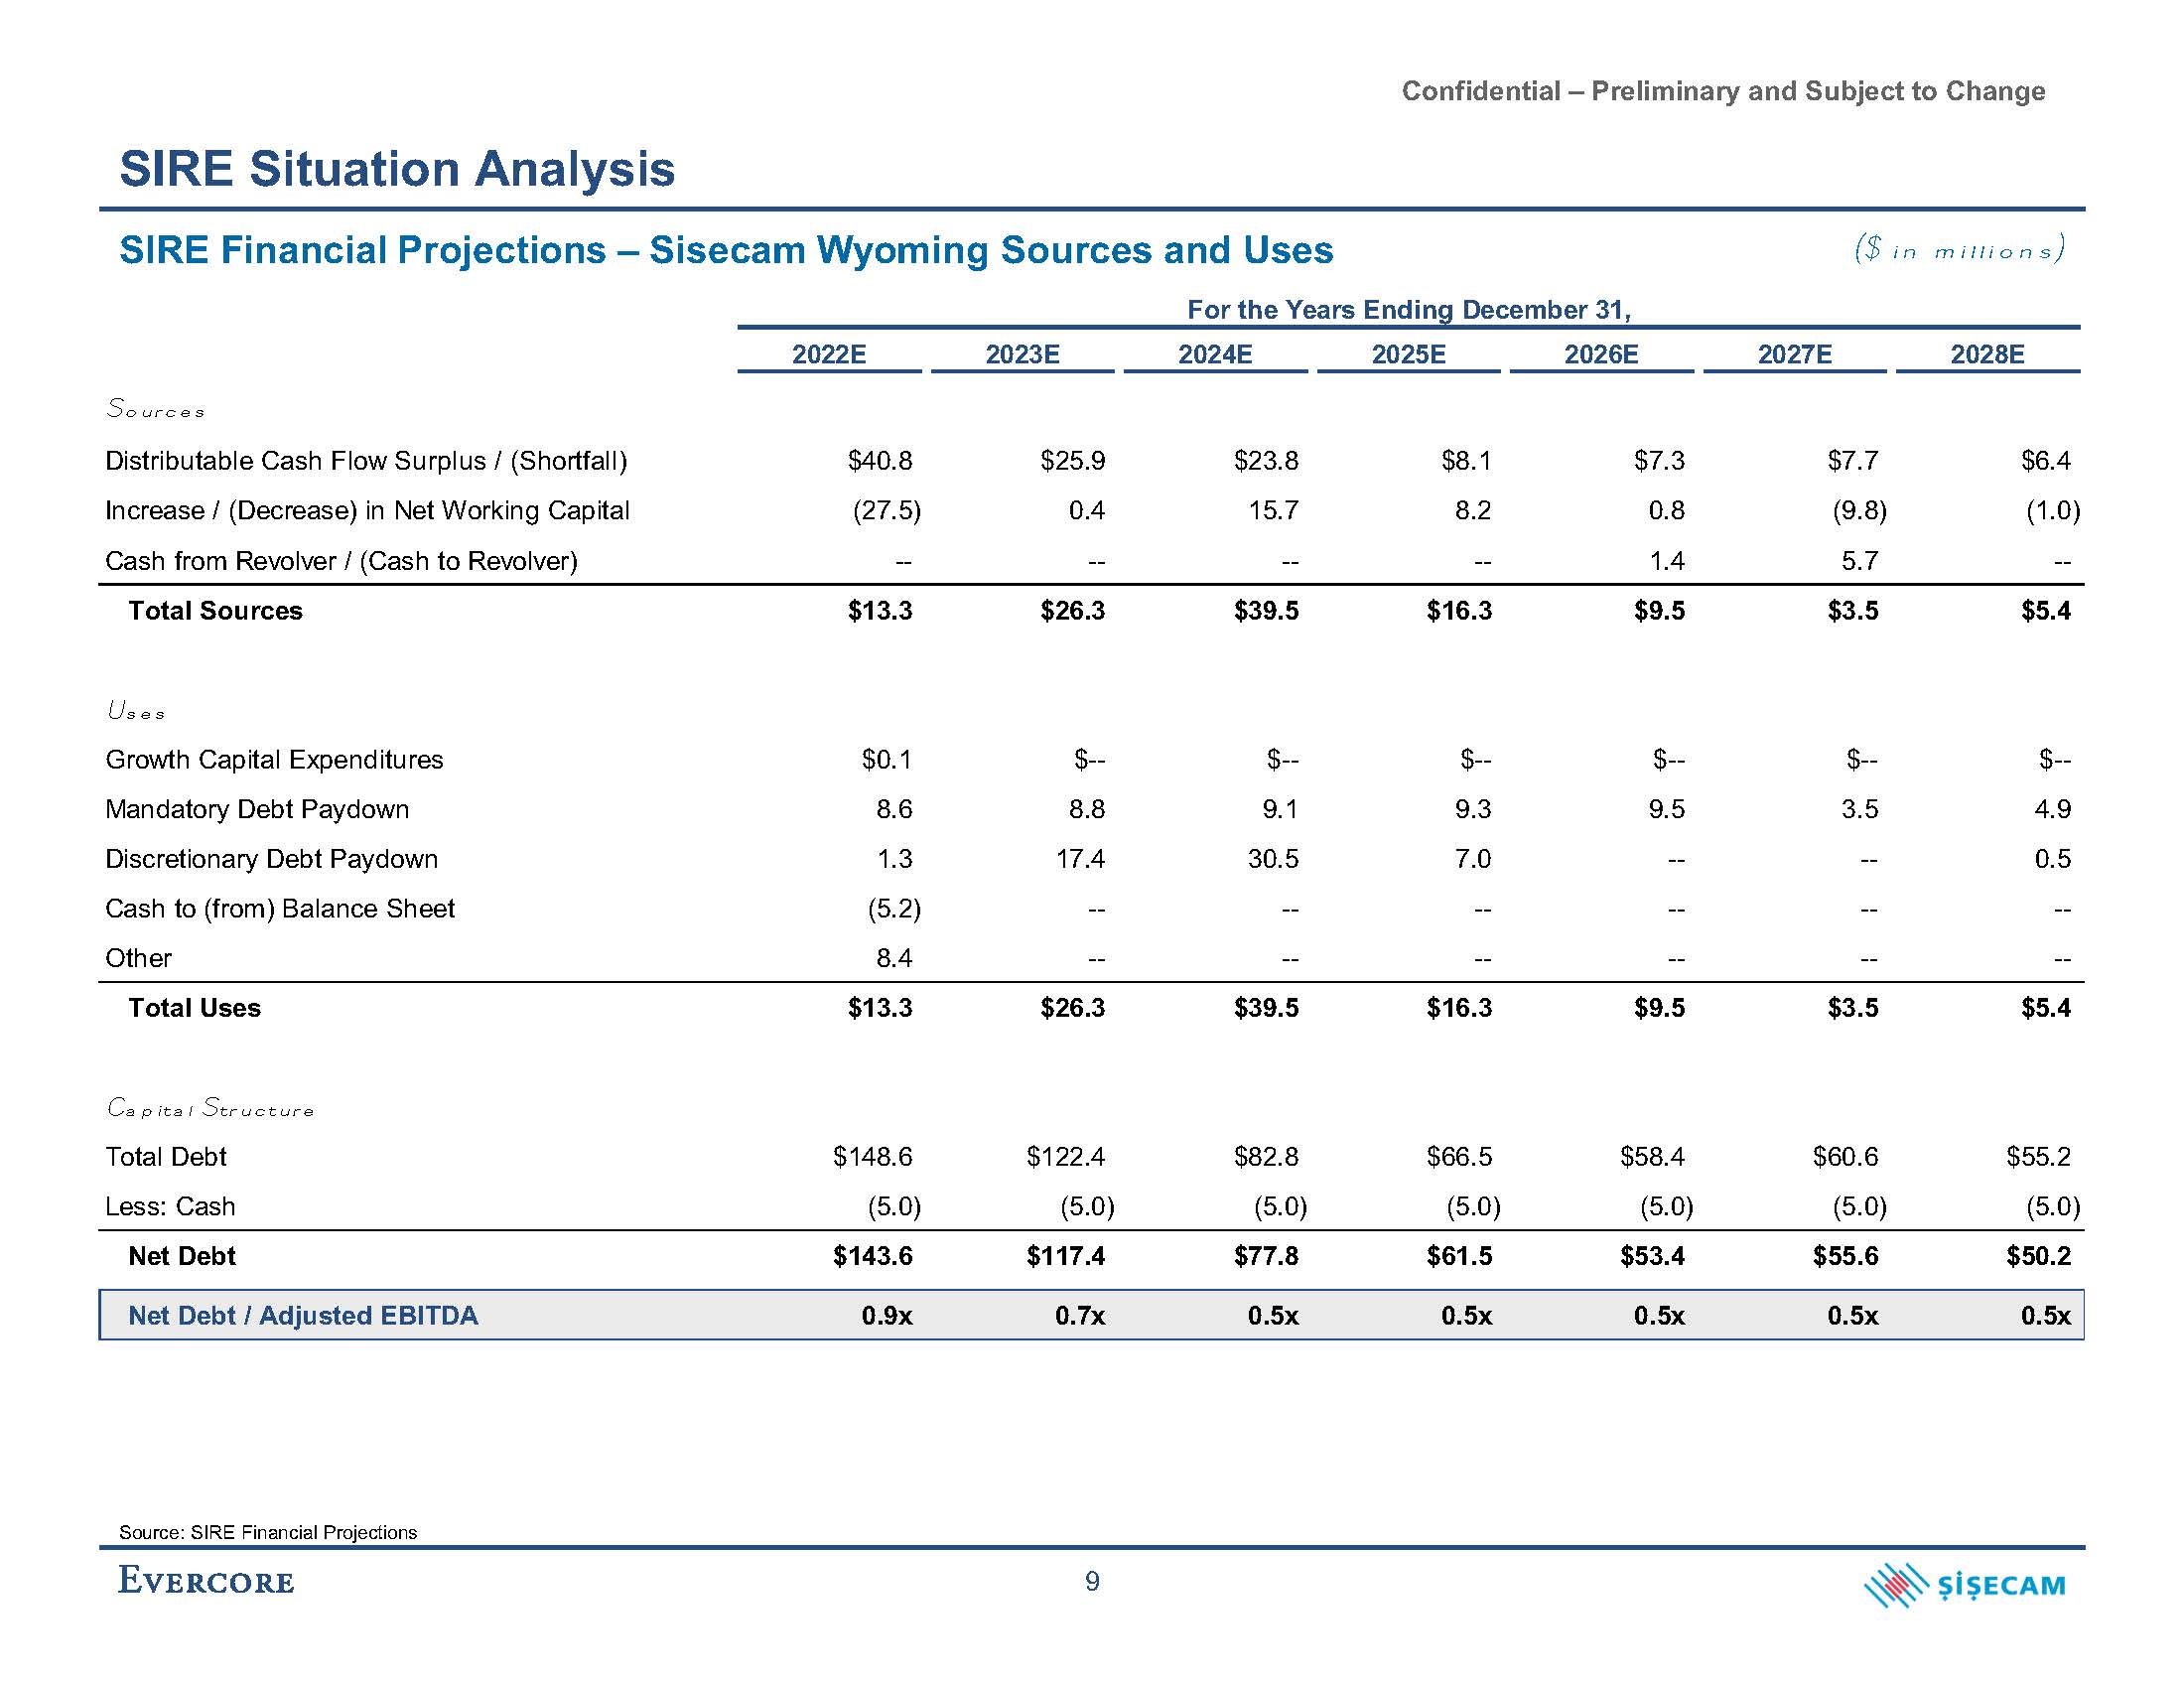
Confidential – Preliminary and Subject to Change SIRE Situation Analysis ($ in millions) Distributable Cash Flow Surplus / (Shortfall) $40.8 $25.9 $23.8 $8.1 $7.3 $7.7 $6.4 Increase / (Decrease) in Net Working Capital (27.5) 0.4 15.7 8.2 0.8 (9.8) (1.0) Cash from Revolver / (Cash to Revolver) -- -- -- -- 1.4 5.7 -- Total Sources $13.3 $26.3 $39.5 $16.3 $9.5 $3.5 $5.4 Uses Growth Capital Expenditures $0.1 $-- $-- $-- $-- $-- $-- Mandatory Debt Paydown 8.6 8.8 9.1 9.3 9.5 3.5 4.9 Discretionary Debt Paydown 1.3 17.4 30.5 7.0 -- -- 0.5 Cash to (from) Balance Sheet (5.2) -- -- -- -- -- -- Other 8.4 -- -- -- -- -- -- Total Uses $13.3 $26.3 $39.5 $16.3 $9.5 $3.5 $5.4 Capital Structure Total Debt $148.6 $122.4 $82.8 $66.5 $58.4 $60.6 $55.2 Less: Cash (5.0) (5.0) (5.0) (5.0) (5.0) (5.0) (5.0) Net Debt $143.6 $117.4 $77.8 $61.5 $53.4 $55.6 $50.2 Net Debt / Adjusted EBITDA 0.9x 0.7x 0.5x 0.5x 0.5x 0.5x 0.5x SIRE Financial Projections – Sisecam Wyoming Sources and Uses For the Years Ending December 31, 2022E 2023E 2024E 2025E 2026E 2027E 2028E Sources Source: SIRE Financial Projections 9
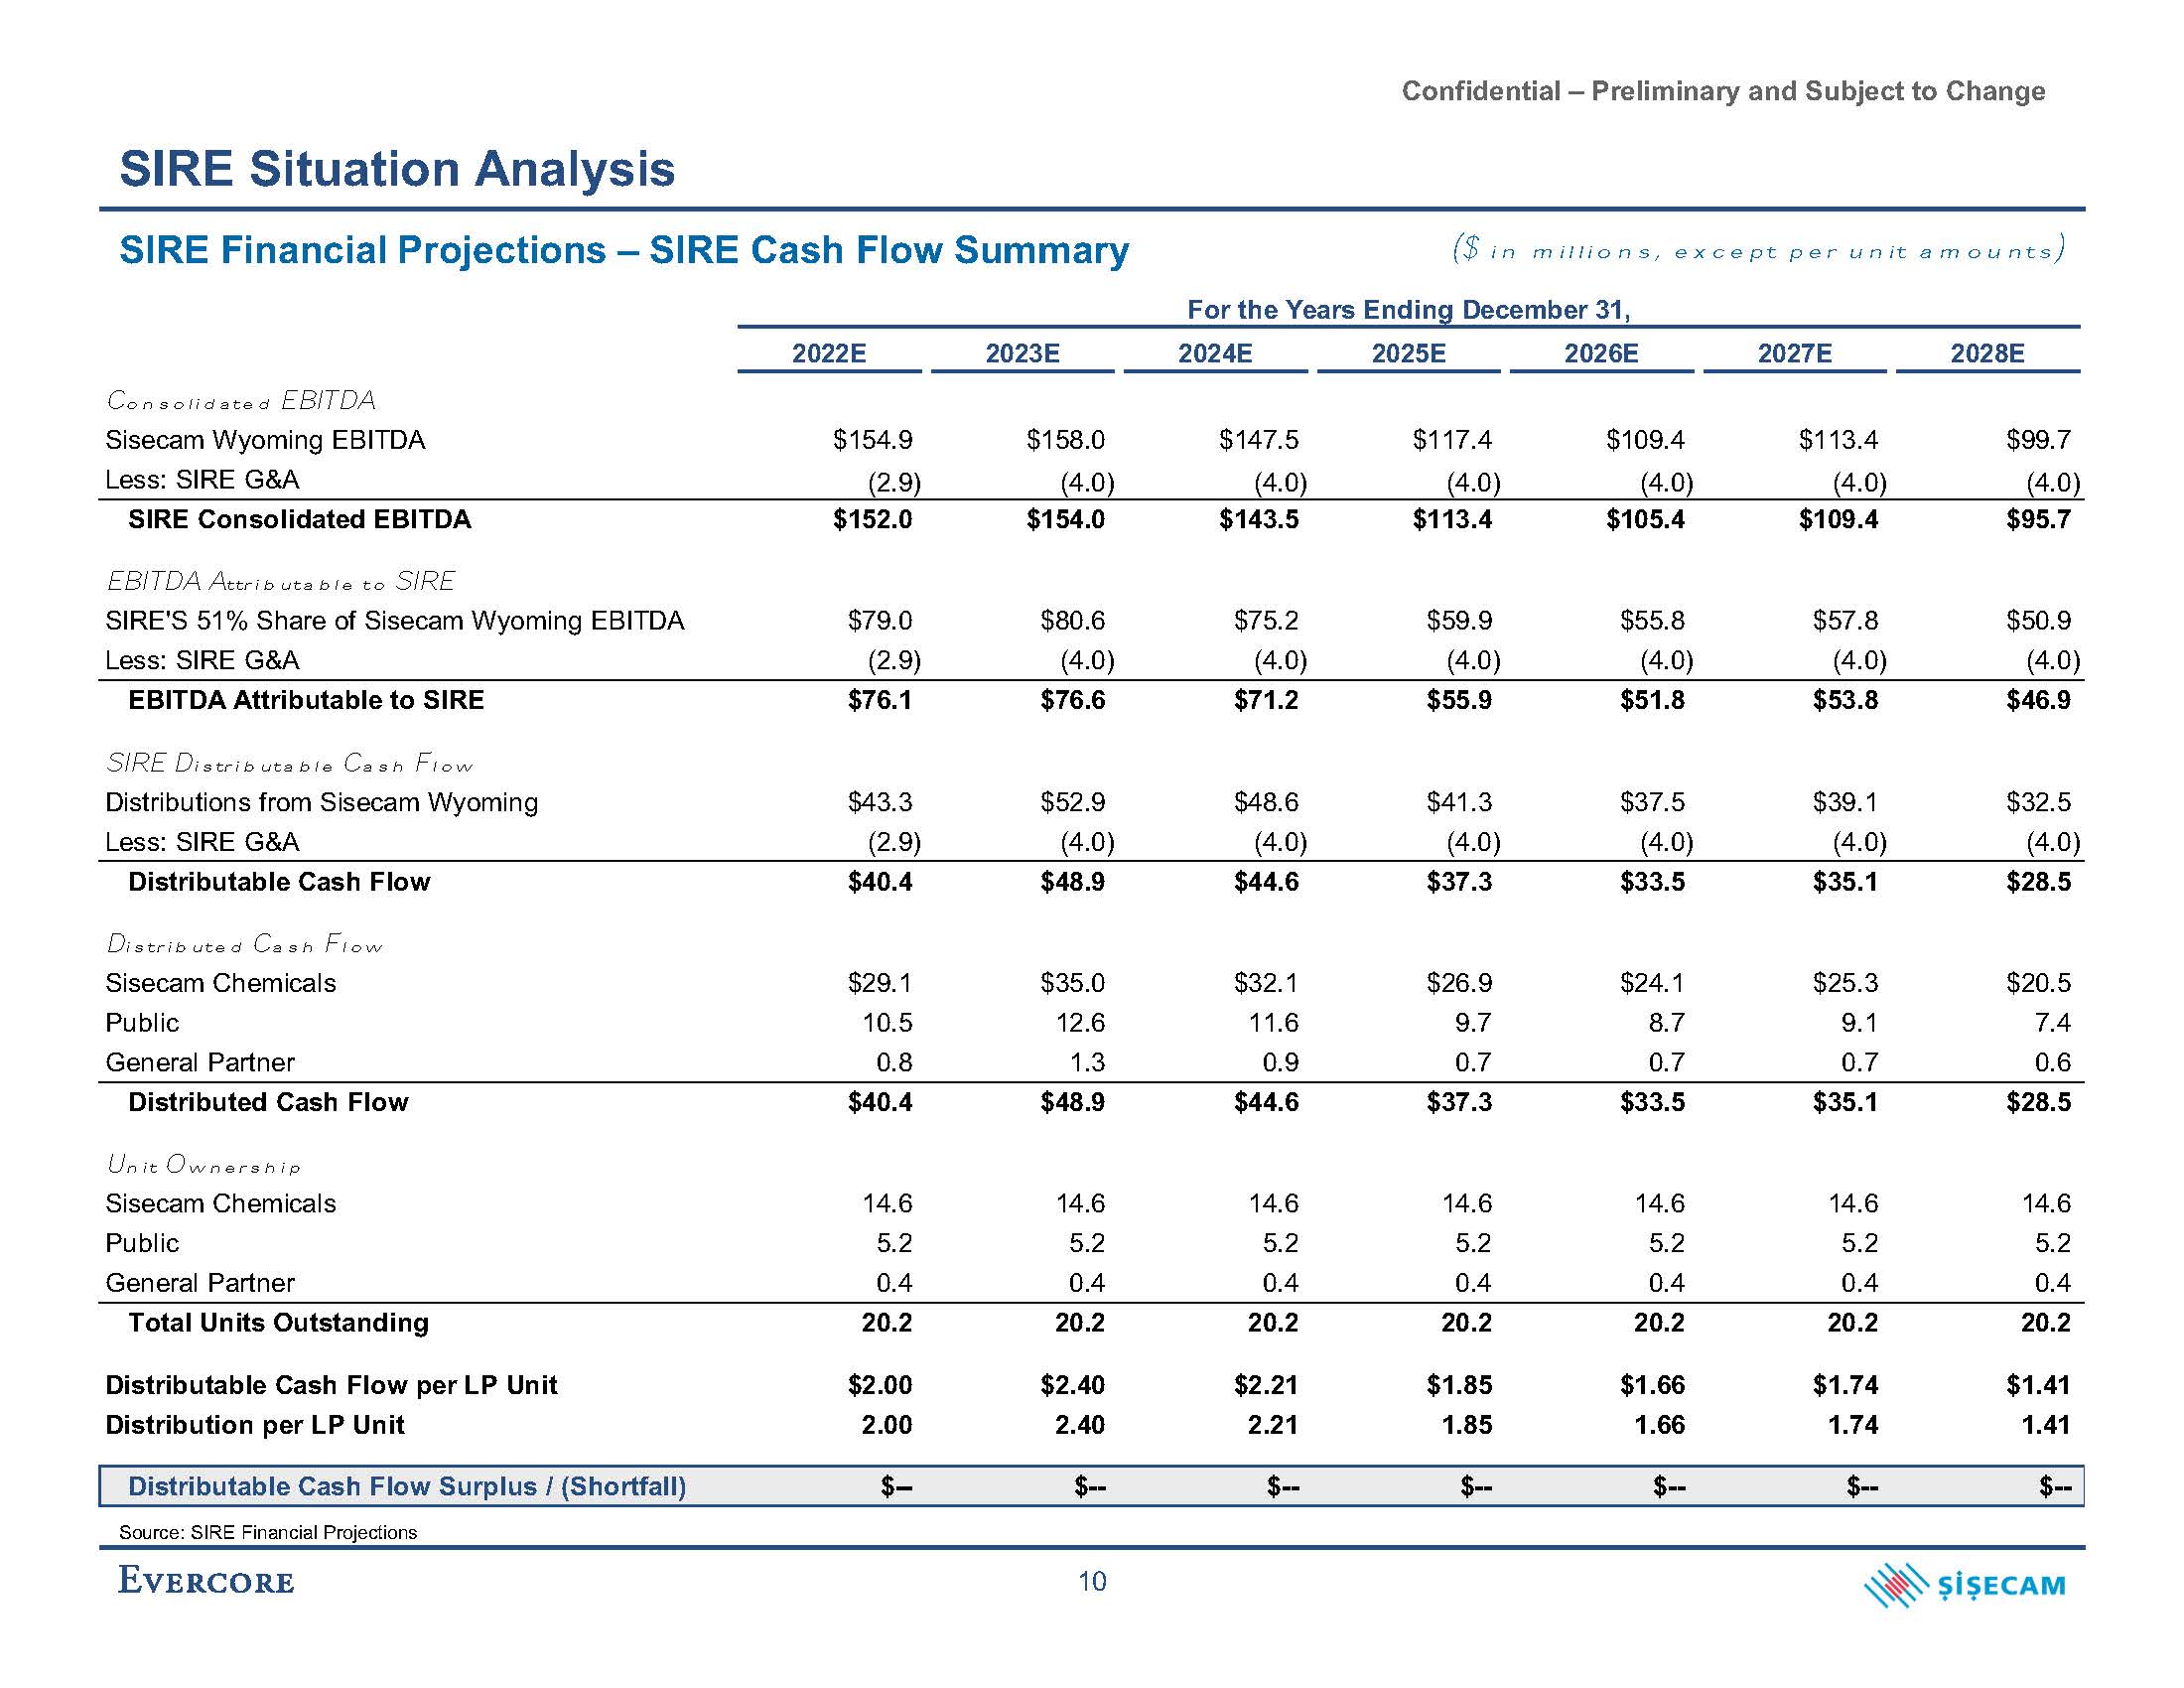
Confidential – Preliminary and Subject to Change SIRE Situation Analysis Source: SIRE Financial Projections 10 SIRE Financial Projections – SIRE Cash Flow Summary ($ in millions, except per unit amounts) For the Years Ending December 31, 2022E 2023E 2024E 2025E 2026E 2027E 2028E Consolidated EBITDA Sisecam Wyoming EBITDA $154.9 $158.0 $147.5 $117.4 $109.4 $113.4 $99.7 Less: SIRE G&A (2.9) (4.0) (4.0) (4.0) (4.0) (4.0) (4.0) SIRE Consolidated EBITDA $152.0 $154.0 $143.5 $113.4 $105.4 $109.4 $95.7 EBITDA Attributable to SIRE SIRE'S 51% Share of Sisecam Wyoming EBITDA $79.0 $80.6 $75.2 $59.9 $55.8 $57.8 $50.9 Less: SIRE G&A (2.9) (4.0) (4.0) (4.0) (4.0) (4.0) (4.0) EBITDA Attributable to SIRE $76.1 $76.6 $71.2 $55.9 $51.8 $53.8 $46.9 SIRE Distributable Cash Flow Distributions from Sisecam Wyoming $43.3 $52.9 $48.6 $41.3 $37.5 $39.1 $32.5 Less: SIRE G&A (2.9) (4.0) (4.0) (4.0) (4.0) (4.0) (4.0) Distributable Cash Flow $40.4 $48.9 $44.6 $37.3 $33.5 $35.1 $28.5 Distributed Cash Flow Sisecam Chemicals $29.1 $35.0 $32.1 $26.9 $24.1 $25.3 $20.5 Public 10.5 12.6 11.6 9.7 8.7 9.1 7.4 General Partner 0.8 1.3 0.9 0.7 0.7 0.7 0.6 Distributed Cash Flow $40.4 $48.9 $44.6 $37.3 $33.5 $35.1 $28.5 Unit Ownership Sisecam Chemicals 14.6 14.6 14.6 14.6 14.6 14.6 14.6 Public 5.2 5.2 5.2 5.2 5.2 5.2 5.2 General Partner 0.4 0.4 0.4 0.4 0.4 0.4 0.4 Total Units Outstanding 20.2 20.2 20.2 20.2 20.2 20.2 20.2 Distributable Cash Flow per LP Unit $2.00 $2.40 $2.21 $1.85 $1.66 $1.74 $1.41 Distribution per LP Unit 2.00 2.40 2.21 1.85 1.66 1.74 1.41 Distributable Cash Flow Surplus / (Shortfall) $-- $-- $-- $-- $-- $-- $--
Confidential – Preliminary and Subject to Change III. Preliminary Valuation of SIRE Common Units
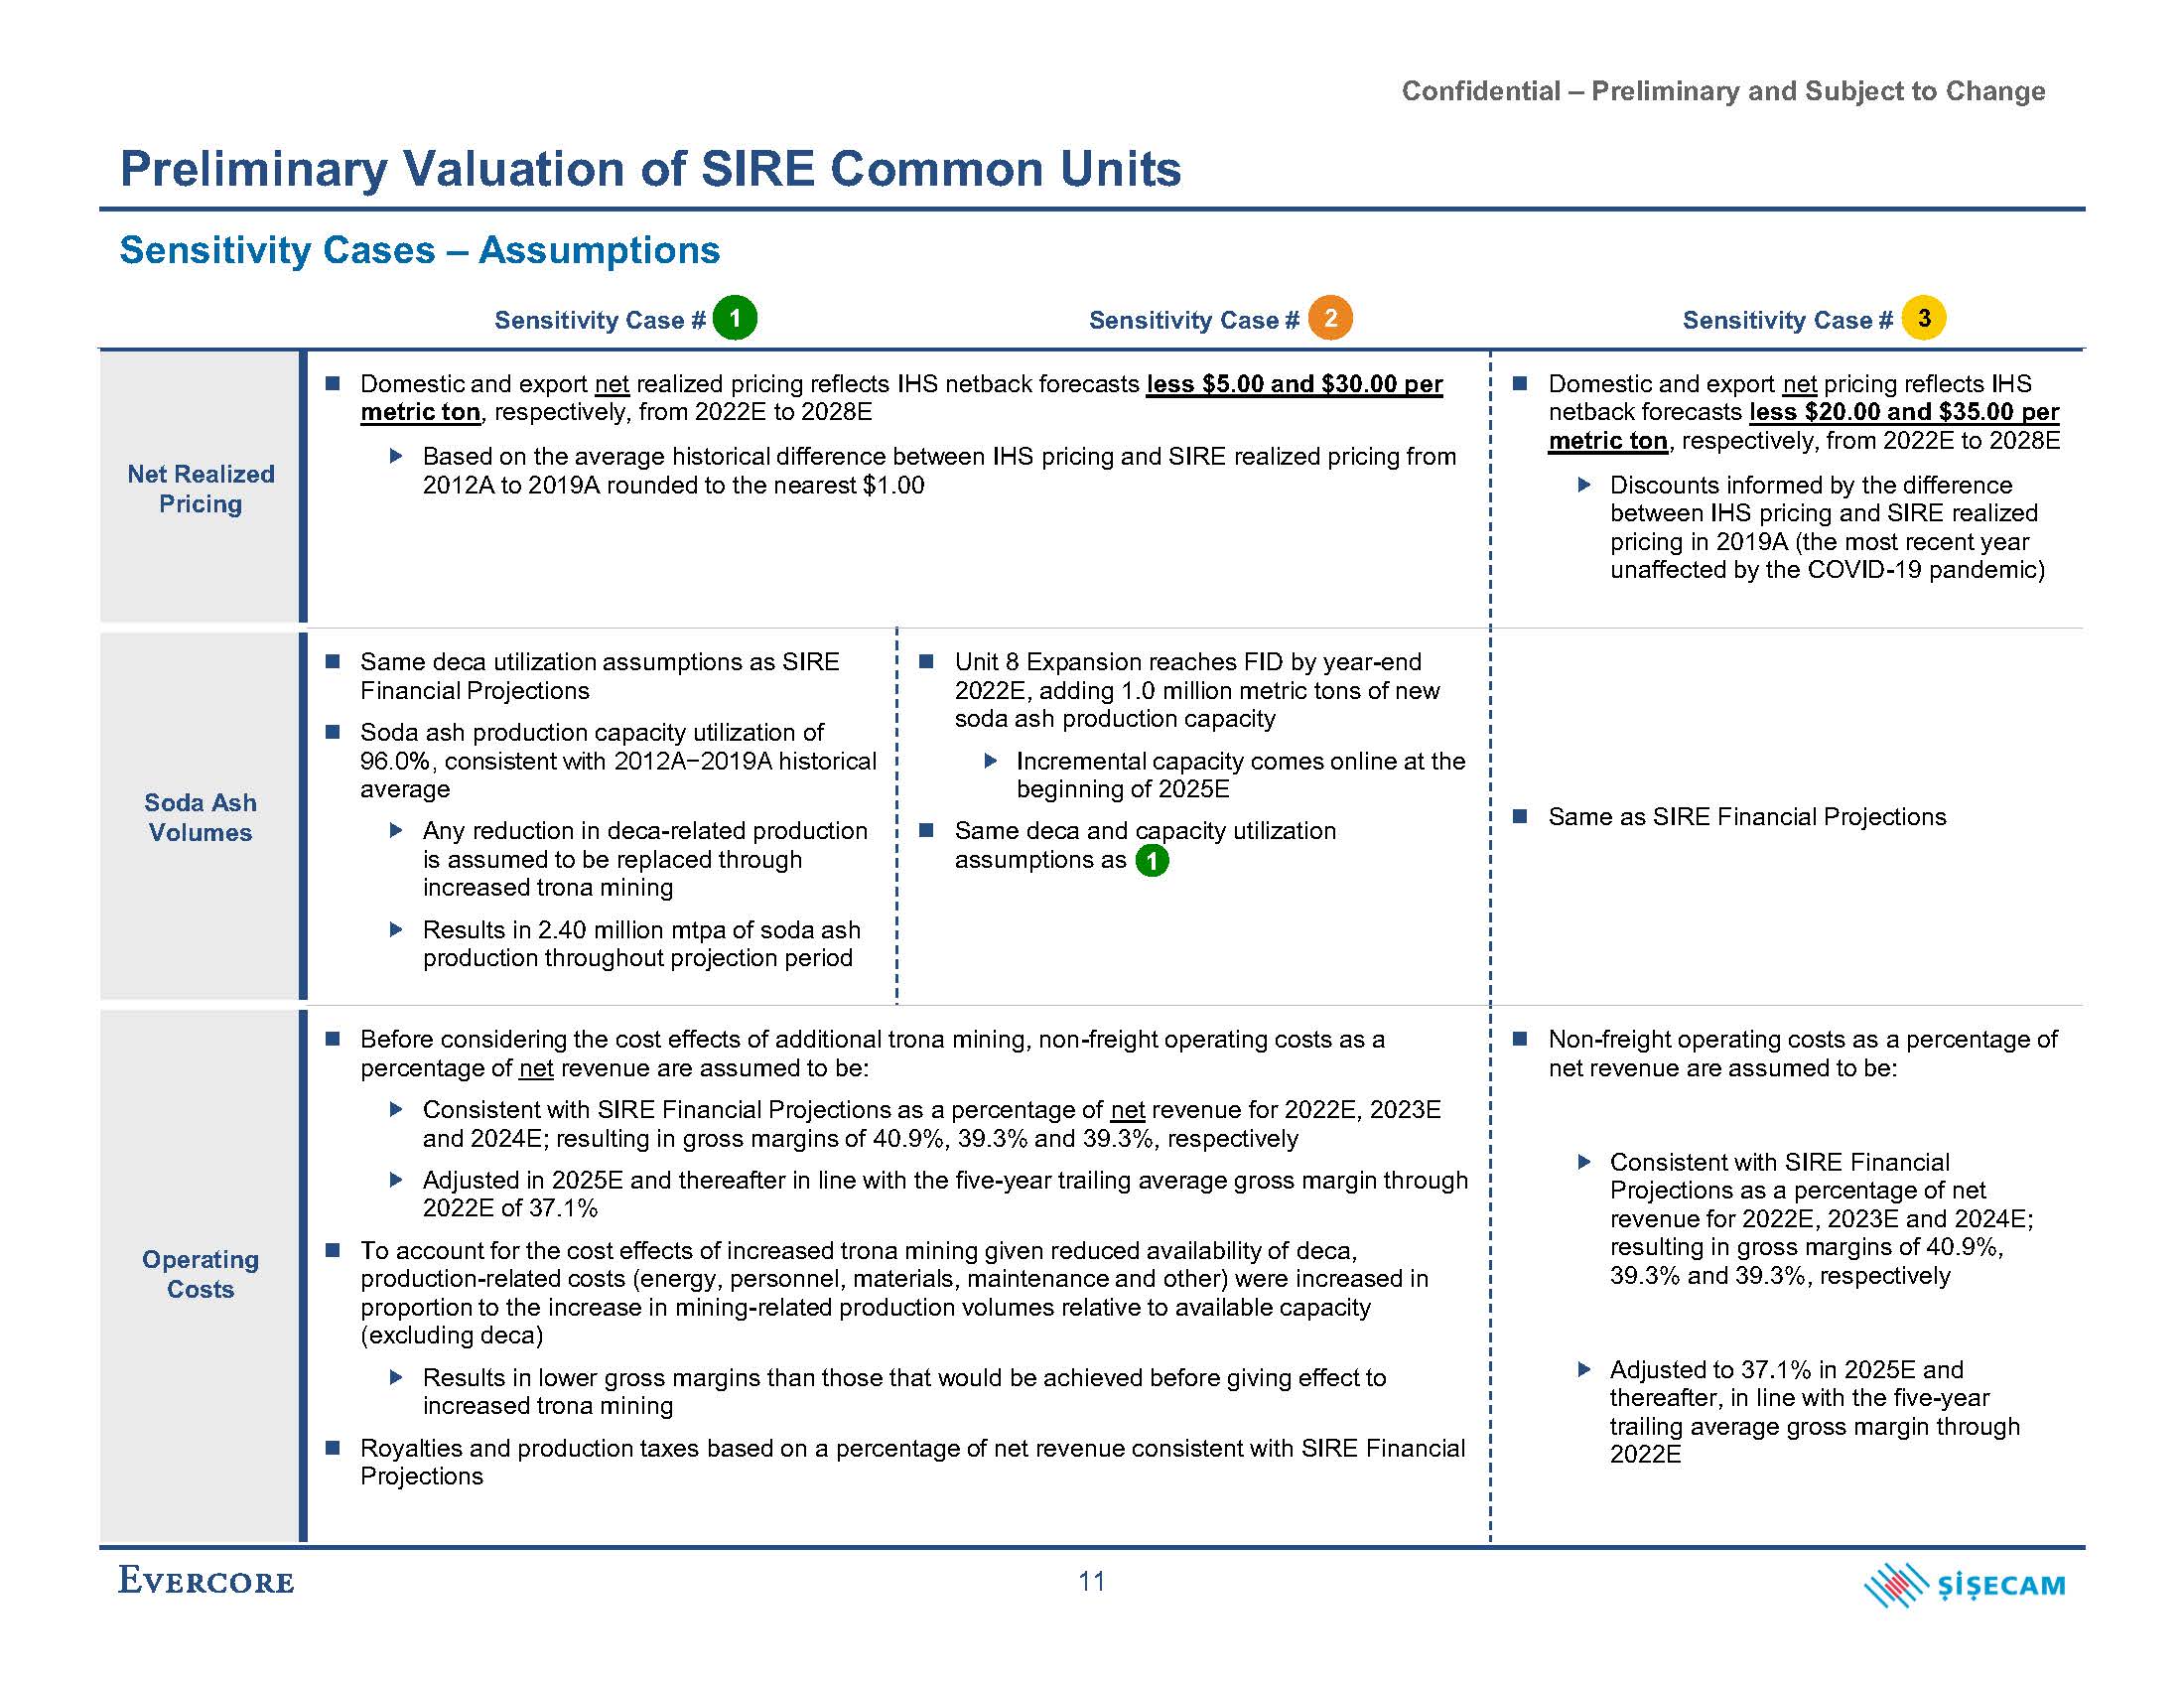
Confidential – Preliminary and Subject to Change Preliminary Valuation of SIRE Common Units Sensitivity Cases – Assumptions Sensitivity Case # 1 Sensitivity Case # 2 Sensitivity Case # 3 Net Realized Pricing Domestic and export net realized pricing reflects IHS netback forecasts less $5.00 and $30.00 per metric ton, respectively, from 2022E to 2028E Based on the average historical difference between IHS pricing and SIRE realized pricing from 2012A to 2019A rounded to the nearest $1.00 Domestic and export net pricing reflects IHS netback forecasts less $20.00 and $35.00 per metric ton, respectively, from 2022E to 2028E Discounts informed by the difference between IHS pricing and SIRE realized pricing in 2019A (the most recent year unaffected by the COVID-19 pandemic) Soda Ash Volumes Same deca utilization assumptions as SIRE Financial Projections Soda ash production capacity utilization of 96.0%, consistent with 2012A−2019A historical average Any reduction in deca-related production is assumed to be replaced through increased trona mining Results in 2.40 million mtpa of soda ash production throughout projection period Unit 8 Expansion reaches FID by year-end 2022E, adding 1.0 million metric tons of new soda ash production capacity Incremental capacity comes online at the beginning of 2025E Same deca and capacity utilization assumptions as 1 Same as SIRE Financial Projections Operating Costs Before considering the cost effects of additional trona mining, non-freight operating costs as a percentage of net revenue are assumed to be: Consistent with SIRE Financial Projections as a percentage of net revenue for 2022E, 2023E and 2024E; resulting in gross margins of 40.9%, 39.3% and 39.3%, respectively Adjusted in 2025E and thereafter in line with the five-year trailing average gross margin through 2022E of 37.1% To account for the cost effects of increased trona mining given reduced availability of deca, production-related costs (energy, personnel, materials, maintenance and other) were increased in proportion to the increase in mining-related production volumes relative to available capacity (excluding deca) Results in lower gross margins than those that would be achieved before giving effect to increased trona mining Royalties and production taxes based on a percentage of net revenue consistent with SIRE Financial Projections Non-freight operating costs as a percentage of net revenue are assumed to be: Consistent with SIRE Financial Projections as a percentage of net revenue for 2022E, 2023E and 2024E; resulting in gross margins of 40.9%, 39.3% and 39.3%, respectively Adjusted to 37.1% in 2025E and thereafter, in line with the five-year trailing average gross margin through 2022E 11
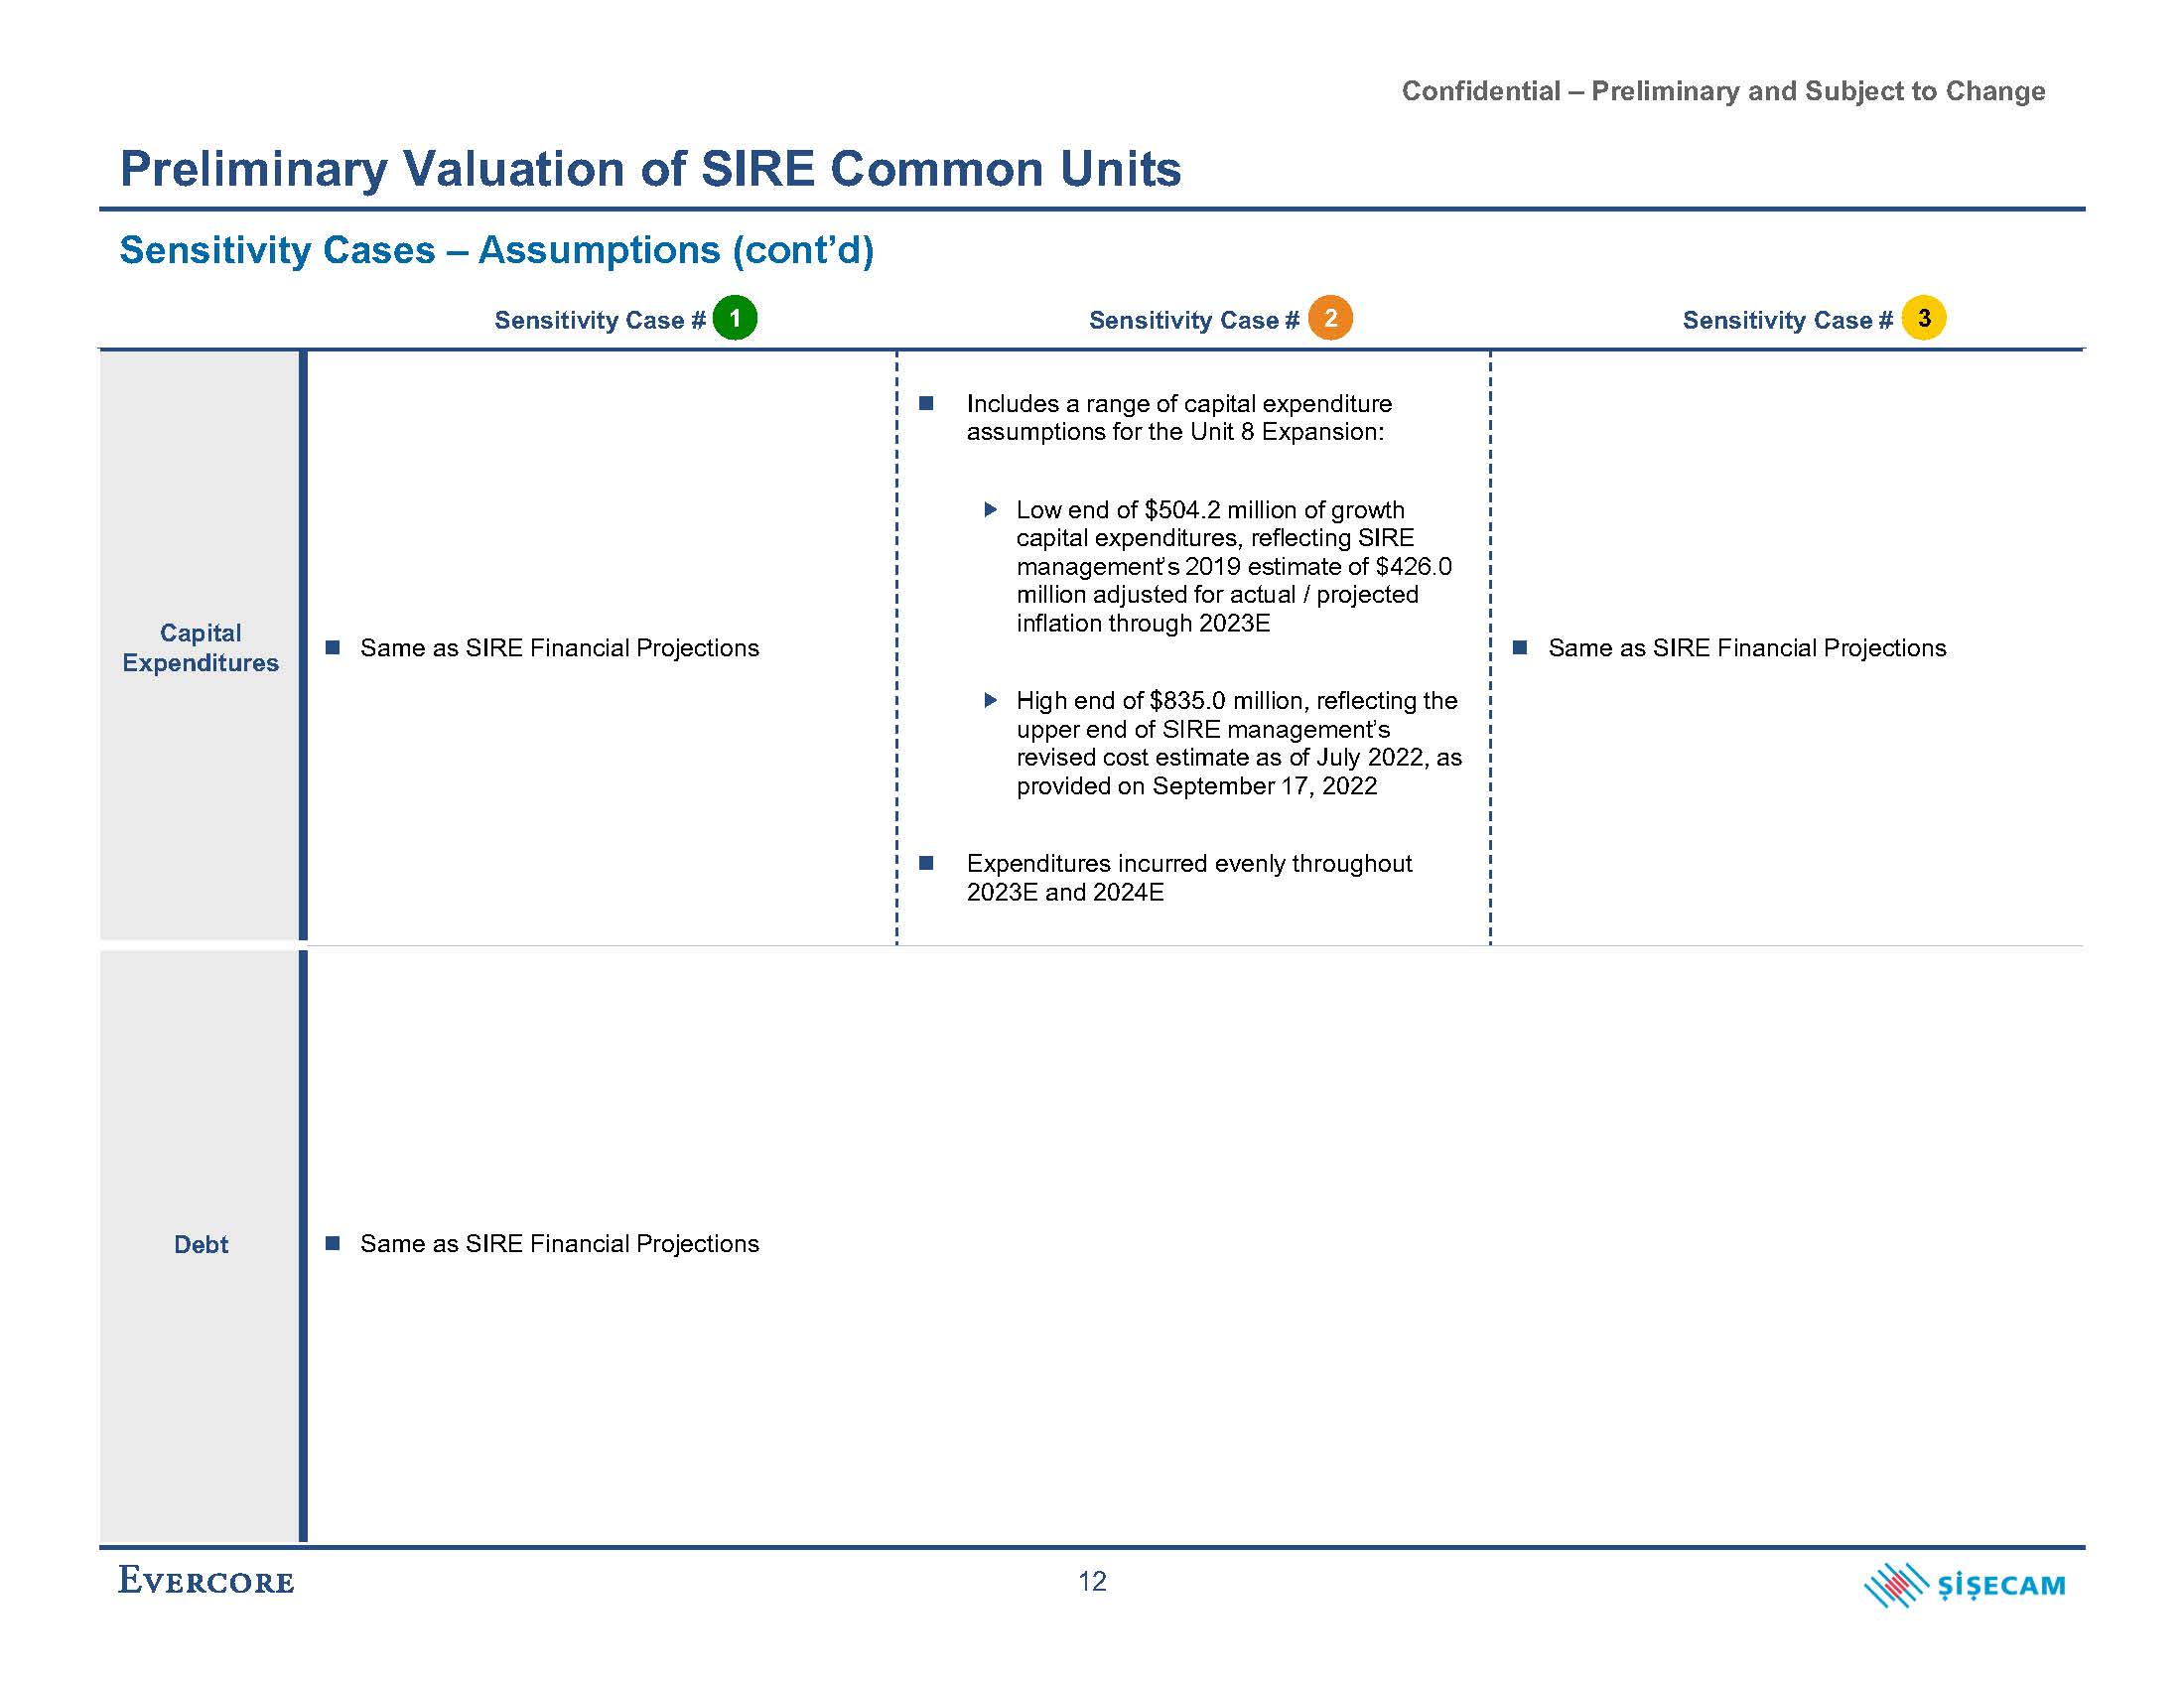
Confidential – Preliminary and Subject to Change Preliminary Valuation of SIRE Common Units Sensitivity Cases – Assumptions (cont’d) Sensitivity Case # 1 Sensitivity Case # 2 Sensitivity Case # 3 Capital Expenditures Same as SIRE Financial Projections Includes a range of capital expenditure assumptions for the Unit 8 Expansion: Low end of $504.2 million of growth capital expenditures, reflecting SIRE management’s 2019 estimate of $426.0 million adjusted for actual / projected inflation through 2023E High end of $835.0 million, reflecting the upper end of SIRE management’s revised cost estimate as of July 2022, as provided on September 17, 2022 Expenditures incurred evenly throughout 2023E and 2024E Same as SIRE Financial Projections Debt Same as SIRE Financial Projections 12
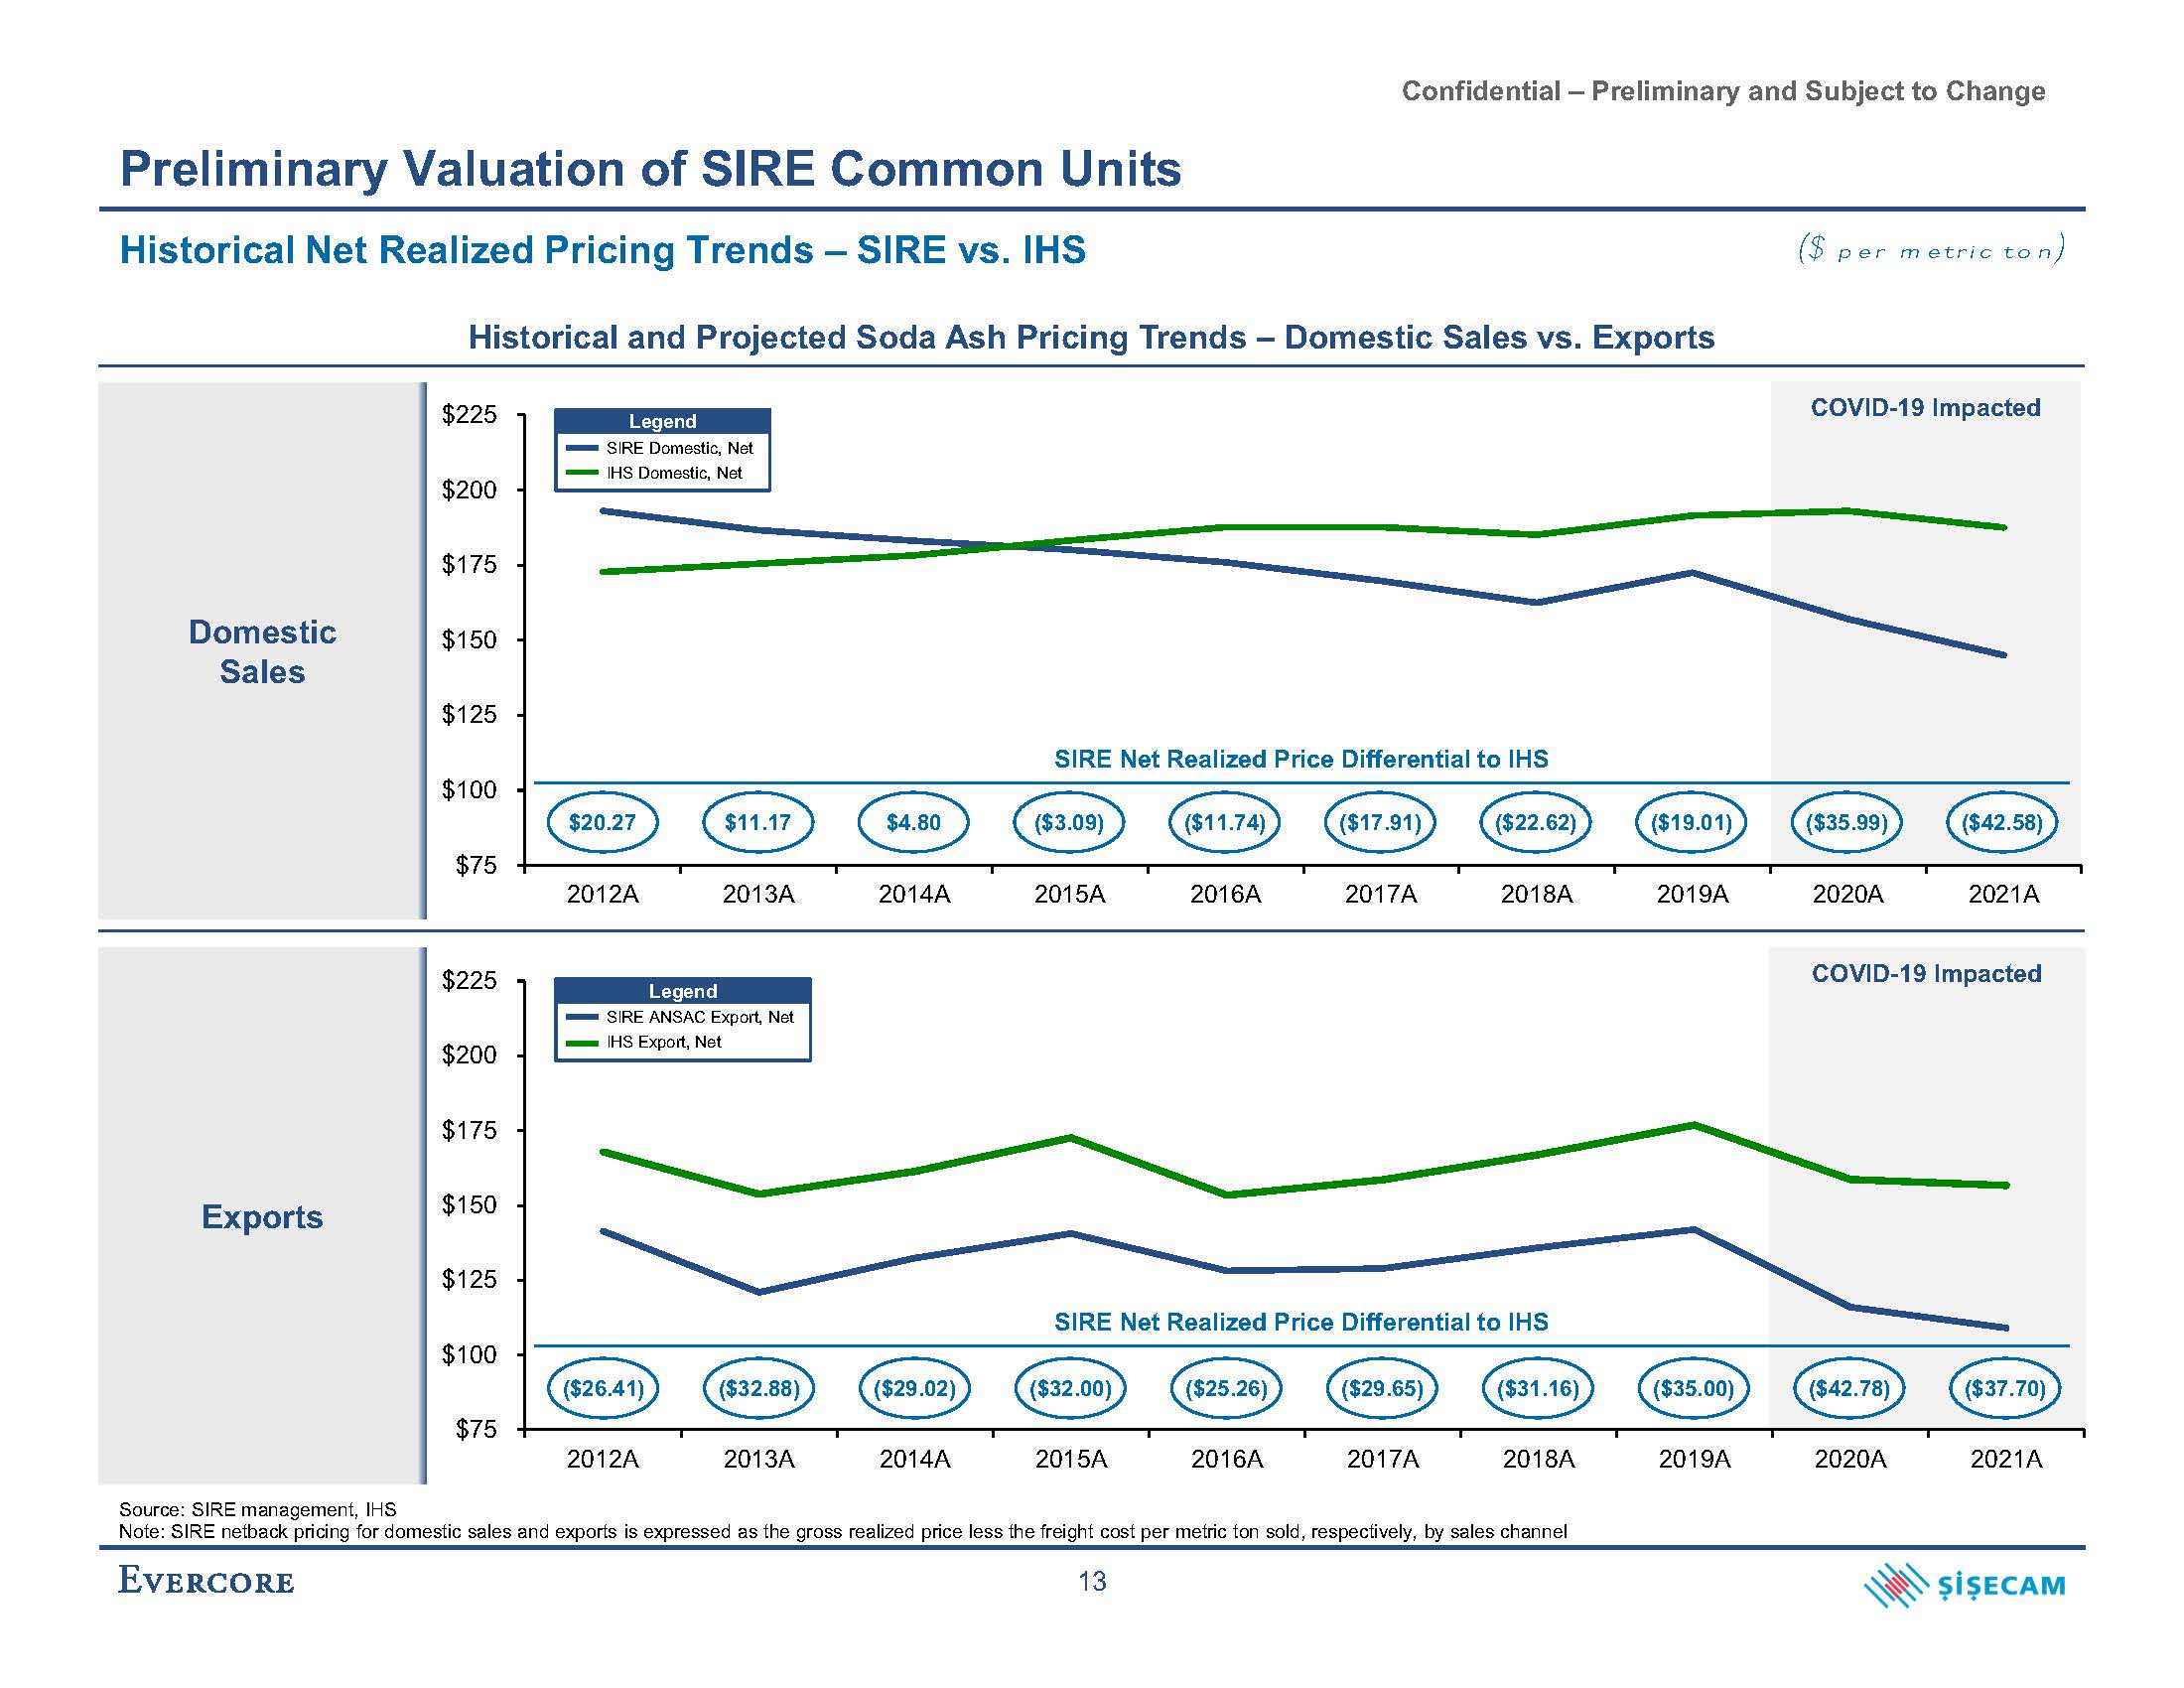
Confidential – Preliminary and Subject to Change COVID-19 Impacted $75 $100 $125 $150 $175 $200 $225 2012A 2013A 2014A 2015A 2016A 2017A 2018A 2019A 2020A 2021A COVID-19 Impacted $75 $100 $125 $150 $200 $175 $225 2012A 2013A 2014A 2019A 2020A 2021A Preliminary Valuation of SIRE Common Units Historical Net Realized Pricing Trends – SIRE vs. IHS Historical and Projected Soda Ash Pricing Trends – Domestic Sales vs. Exports ($ per metric ton) Source: SIRE management, IHS Note: SIRE netback pricing for domestic sales and exports is expressed as the gross realized price less the freight cost per metric ton sold, respectively, by sales channel Domestic Sales Exports Legend SIRE Domestic, Net IHS Domestic, Net Legend SIRE ANSAC Export, Net IHS Export, Net $20.27 $11.17 $4.80 SIRE Net Realized Price Differential to IHS ($3.09) ($11.74) ($17.91) ($22.62) 2015A 2016A 2017A 2018A ($19.01) ($35.99) ($42.58) ($26.41) ($32.88) ($29.02) ($35.00) ($42.78) ($37.70) SIRE Net Realized Price Differential to IHS ($32.00) ($25.26) ($29.65) ($31.16) 13
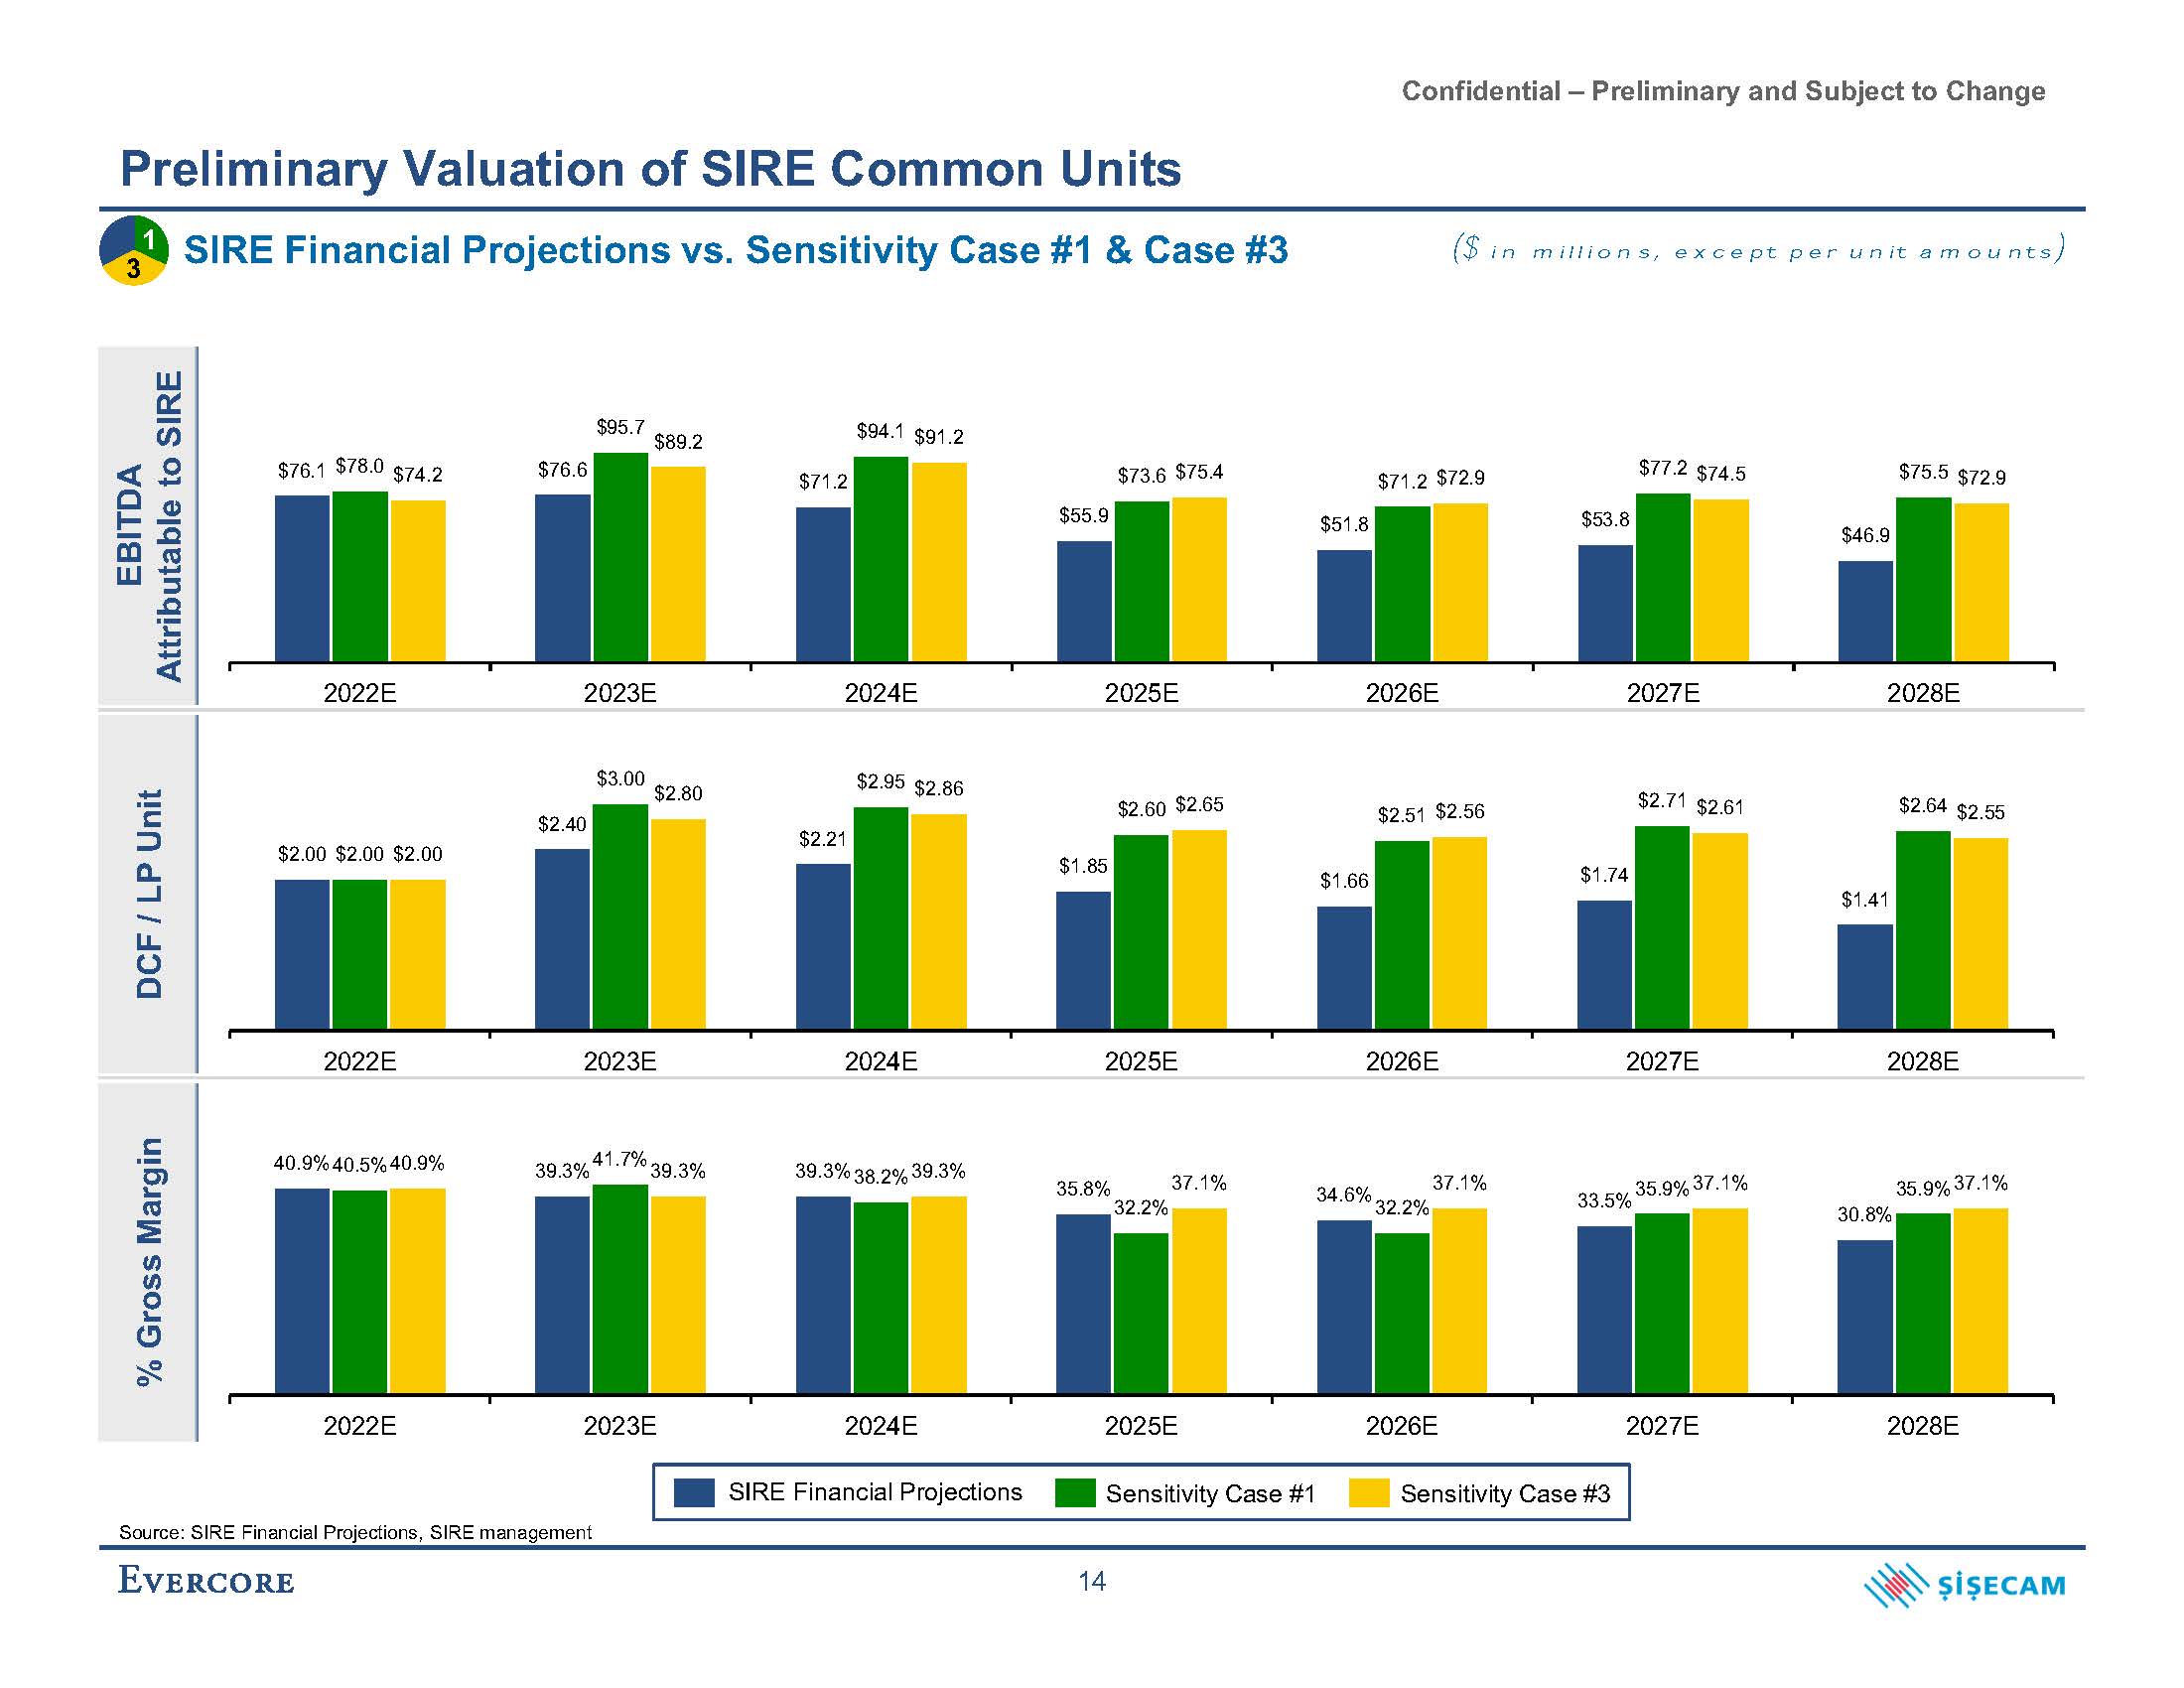
Confidential – Preliminary and Subject to Change 35.8% 34.6% 30.8% 32.2% 32.2% 40.9% 40.5% 40.9% 39.3% 41.7% 39.3% 39.3% 38.2% 39.3% 37.1% 37.1% 33.5% 35.9% 37.1% 35.9% 37.1% 2022E 2023E 2024E 2025E 2026E 2027E 2028E $2.40 $2.21 $1.85 $2.71 $2.00 $2.00 $2.00 $3.00 $2.80 $2.95 $2.86 $2.60 $2.65 $2.51 $2.56 2022 Preliminary Valuation of SIRE Common Units SIRE Financial Projections vs. Sensitivity Case #1 & Case #3 EBITDA Attributable to SIRE DCF / LP Unit % Gross Margin ($ in millions, except per unit amounts) Source: SIRE Financial Projections, SIRE management SIRE Financial Projections Sensitivity Case #1 Sensitivity Case #3 14 1 3
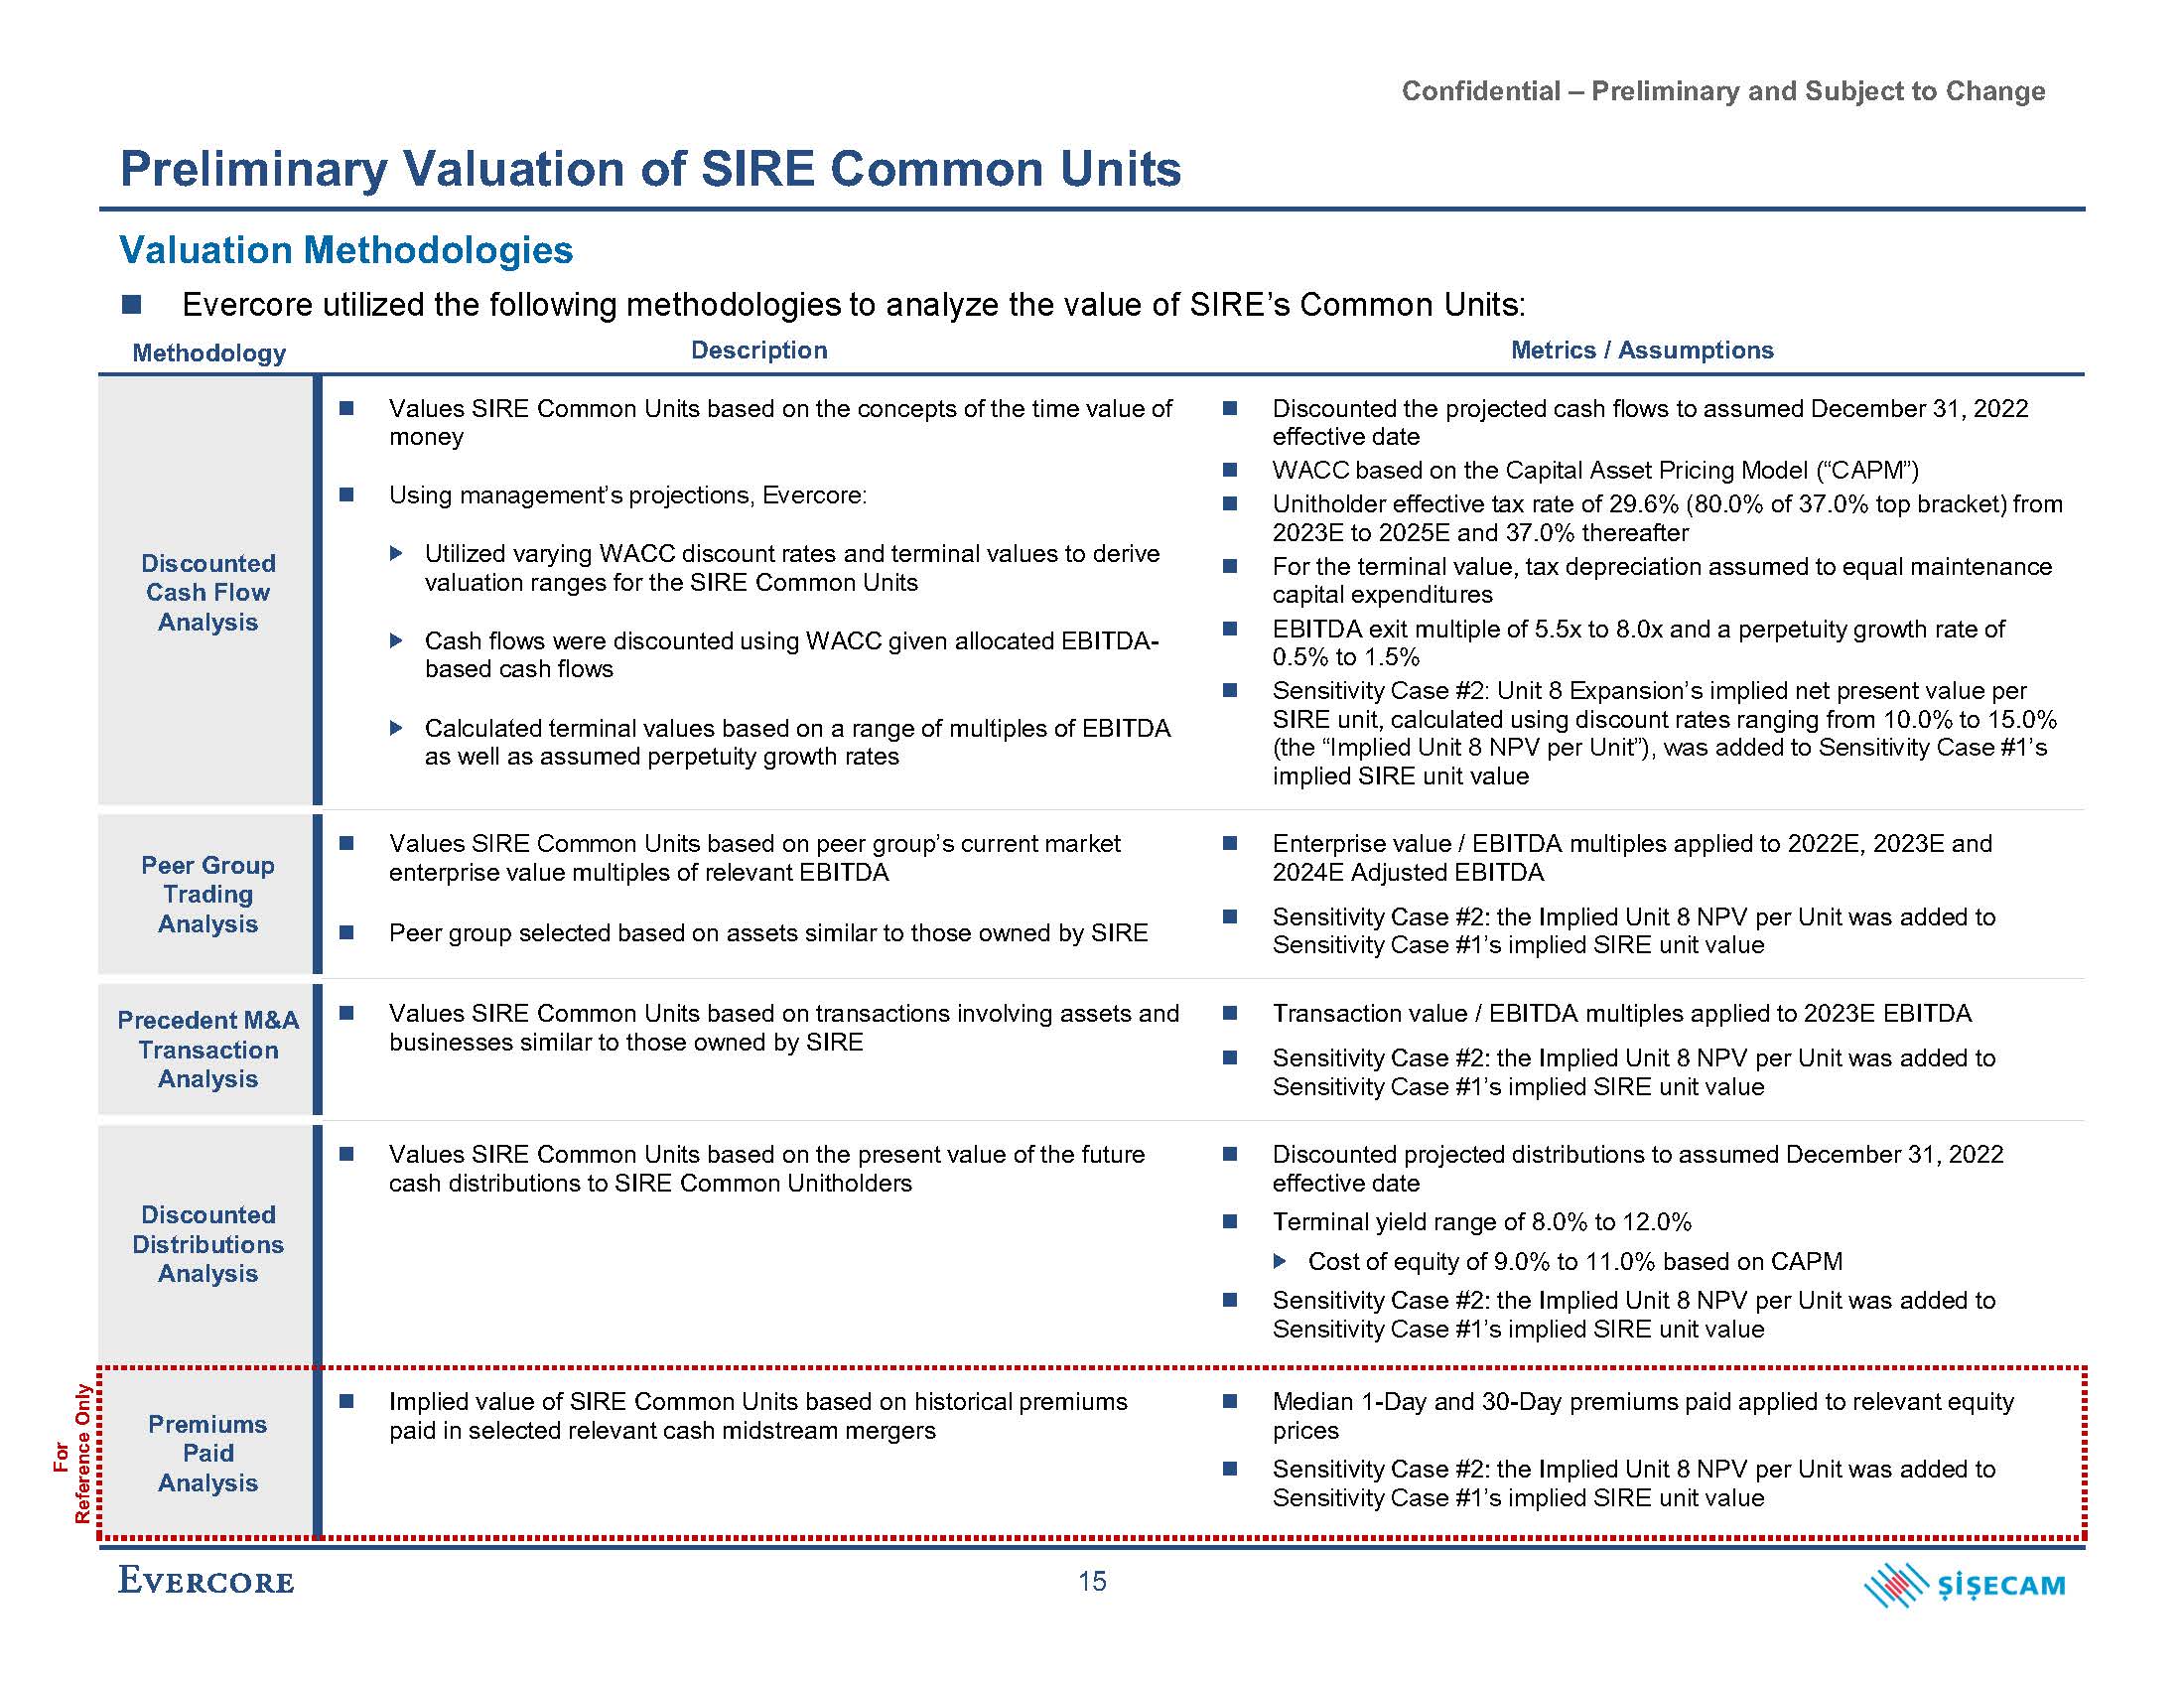
Confidential – Preliminary and Subject to Change Methodology Description Metrics / Assumptions Discounted Cash Flow Analysis Values SIRE Common Units based on the concepts of the time value of money Using management’s projections, Evercore: Utilized varying WACC discount rates and terminal values to derive valuation ranges for the SIRE Common Units Cash flows were discounted using WACC given allocated EBITDA- based cash flows Calculated terminal values based on a range of multiples of EBITDA as well as assumed perpetuity growth rates Discounted the projected cash flows to assumed December 31, 2022 effective date WACC based on the Capital Asset Pricing Model (“CAPM”) Unitholder effective tax rate of 29.6% (80.0% of 37.0% top bracket) from 2023E to 2025E and 37.0% thereafter For the terminal value, tax depreciation assumed to equal maintenance capital expenditures EBITDA exit multiple of 5.5x to 8.0x and a perpetuity growth rate of 0.5% to 1.5% Sensitivity Case #2: Unit 8 Expansion’s implied net present value per SIRE unit, calculated using discount rates ranging from 10.0% to 15.0% (the “Implied Unit 8 NPV per Unit”), was added to Sensitivity Case #1’s implied SIRE unit value Peer Group Trading Analysis Values SIRE Common Units based on peer group’s current market enterprise value multiples of relevant EBITDA Peer group selected based on assets similar to those owned by SIRE Enterprise value / EBITDA multiples applied to 2022E, 2023E and 2024E Adjusted EBITDA Sensitivity Case #2: the Implied Unit 8 NPV per Unit was added to Sensitivity Case #1’s implied SIRE unit value Precedent M&A Transaction Analysis Values SIRE Common Units based on transactions involving assets and businesses similar to those owned by SIRE Transaction value / EBITDA multiples applied to 2023E EBITDA Sensitivity Case #2: the Implied Unit 8 NPV per Unit was added to Sensitivity Case #1’s implied SIRE unit value Discounted Distributions Analysis Values SIRE Common Units based on the present value of the future cash distributions to SIRE Common Unitholders Discounted projected distributions to assumed December 31, 2022 effective date Terminal yield range of 8.0% to 12.0% Cost of equity of 9.0% to 11.0% based on CAPM Sensitivity Case #2: the Implied Unit 8 NPV per Unit was added to Sensitivity Case #1’s implied SIRE unit value Premiums Paid Analysis Implied value of SIRE Common Units based on historical premiums paid in selected relevant cash midstream mergers Median 1-Day and 30-Day premiums paid applied to relevant equity prices Sensitivity Case #2: the Implied Unit 8 NPV per Unit was added to Sensitivity Case #1’s implied SIRE unit value 15 Preliminary Valuation of SIRE Common Units Valuation Methodologies Evercore utilized the following methodologies to analyze the value of SIRE’s Common Units: For Reference Only
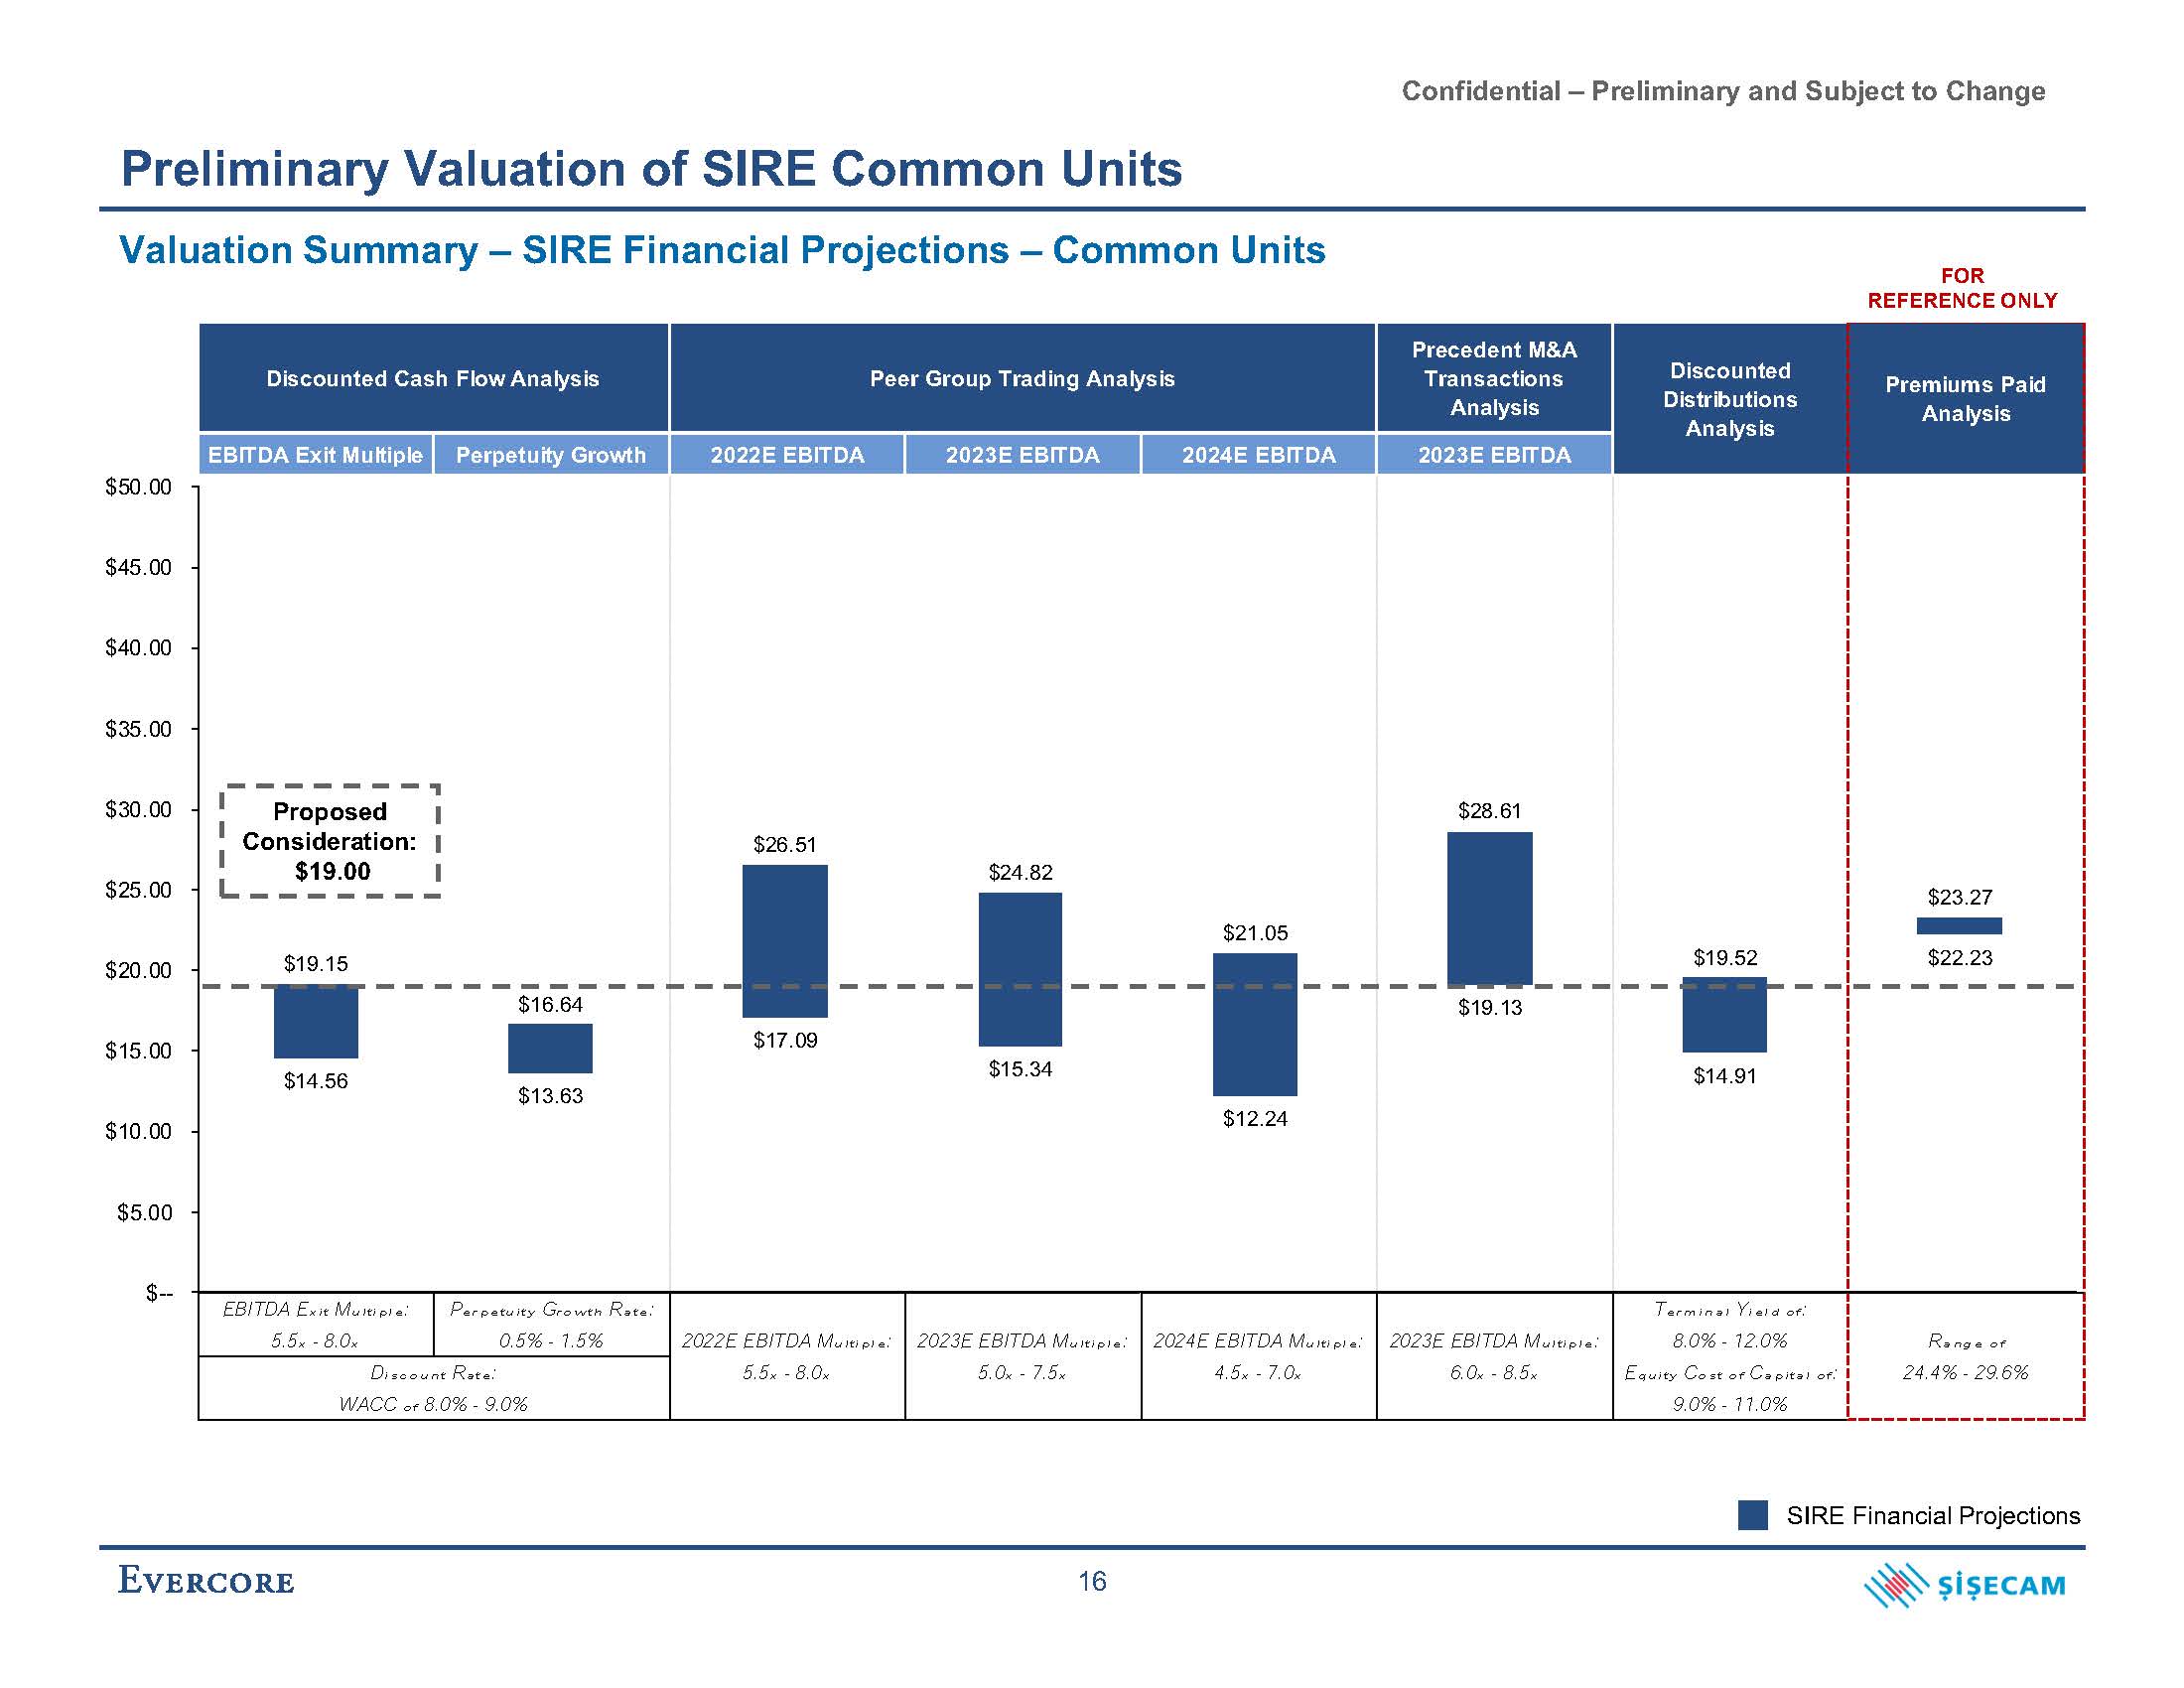
Confidential – Preliminary and Subject to Change Discounted Cash Flow Analysis Peer Group Trading Analysis Precedent M&A Transactions Analysis EBITDA Exit Multiple Perpetuity Growth 2022E EBITDA 2023E EBITDA 2024E EBITDA 2023E EBITDA EBITDA Exit Multiple: 5.5x - 8.0x Perpetuity Growth Rate: 0.5% - 1.5% 2022E EBITDA Multiple: 5.5x - 8.0x 2023E EBITDA Multiple: 5.0x - 7.5x 2024E EBITDA Multiple: 4.5x - 7.0x 2023E EBITDA Multiple: 6.0x - 8.5x Range of 24.4% - 29.6% Discount Rate: WACC of 8.0% - 9.0% Terminal Yield of: 8.0% - 12.0% Equity Cost of Capital of: 9.0% - 11.0% Discounted Distributions Analysis Premiums Paid Analysis $14.56 $13.63 $17.09 $15.34 $12.24 $19.13 $14.91 $22.23 $19.15 $16.64 $26.51 $24.82 $21.05 $28.61 $19.52 $23.27 $-- $5.00 $10.00 $15.00 $20.00 $25.00 $30.00 $50.00 $45.00 $40.00 $35.00 Preliminary Valuation of SIRE Common Units Valuation Summary – SIRE Financial Projections – Common Units Proposed Consideration: $19.00 FOR REFERENCE ONLY SIRE Financial Projections 16
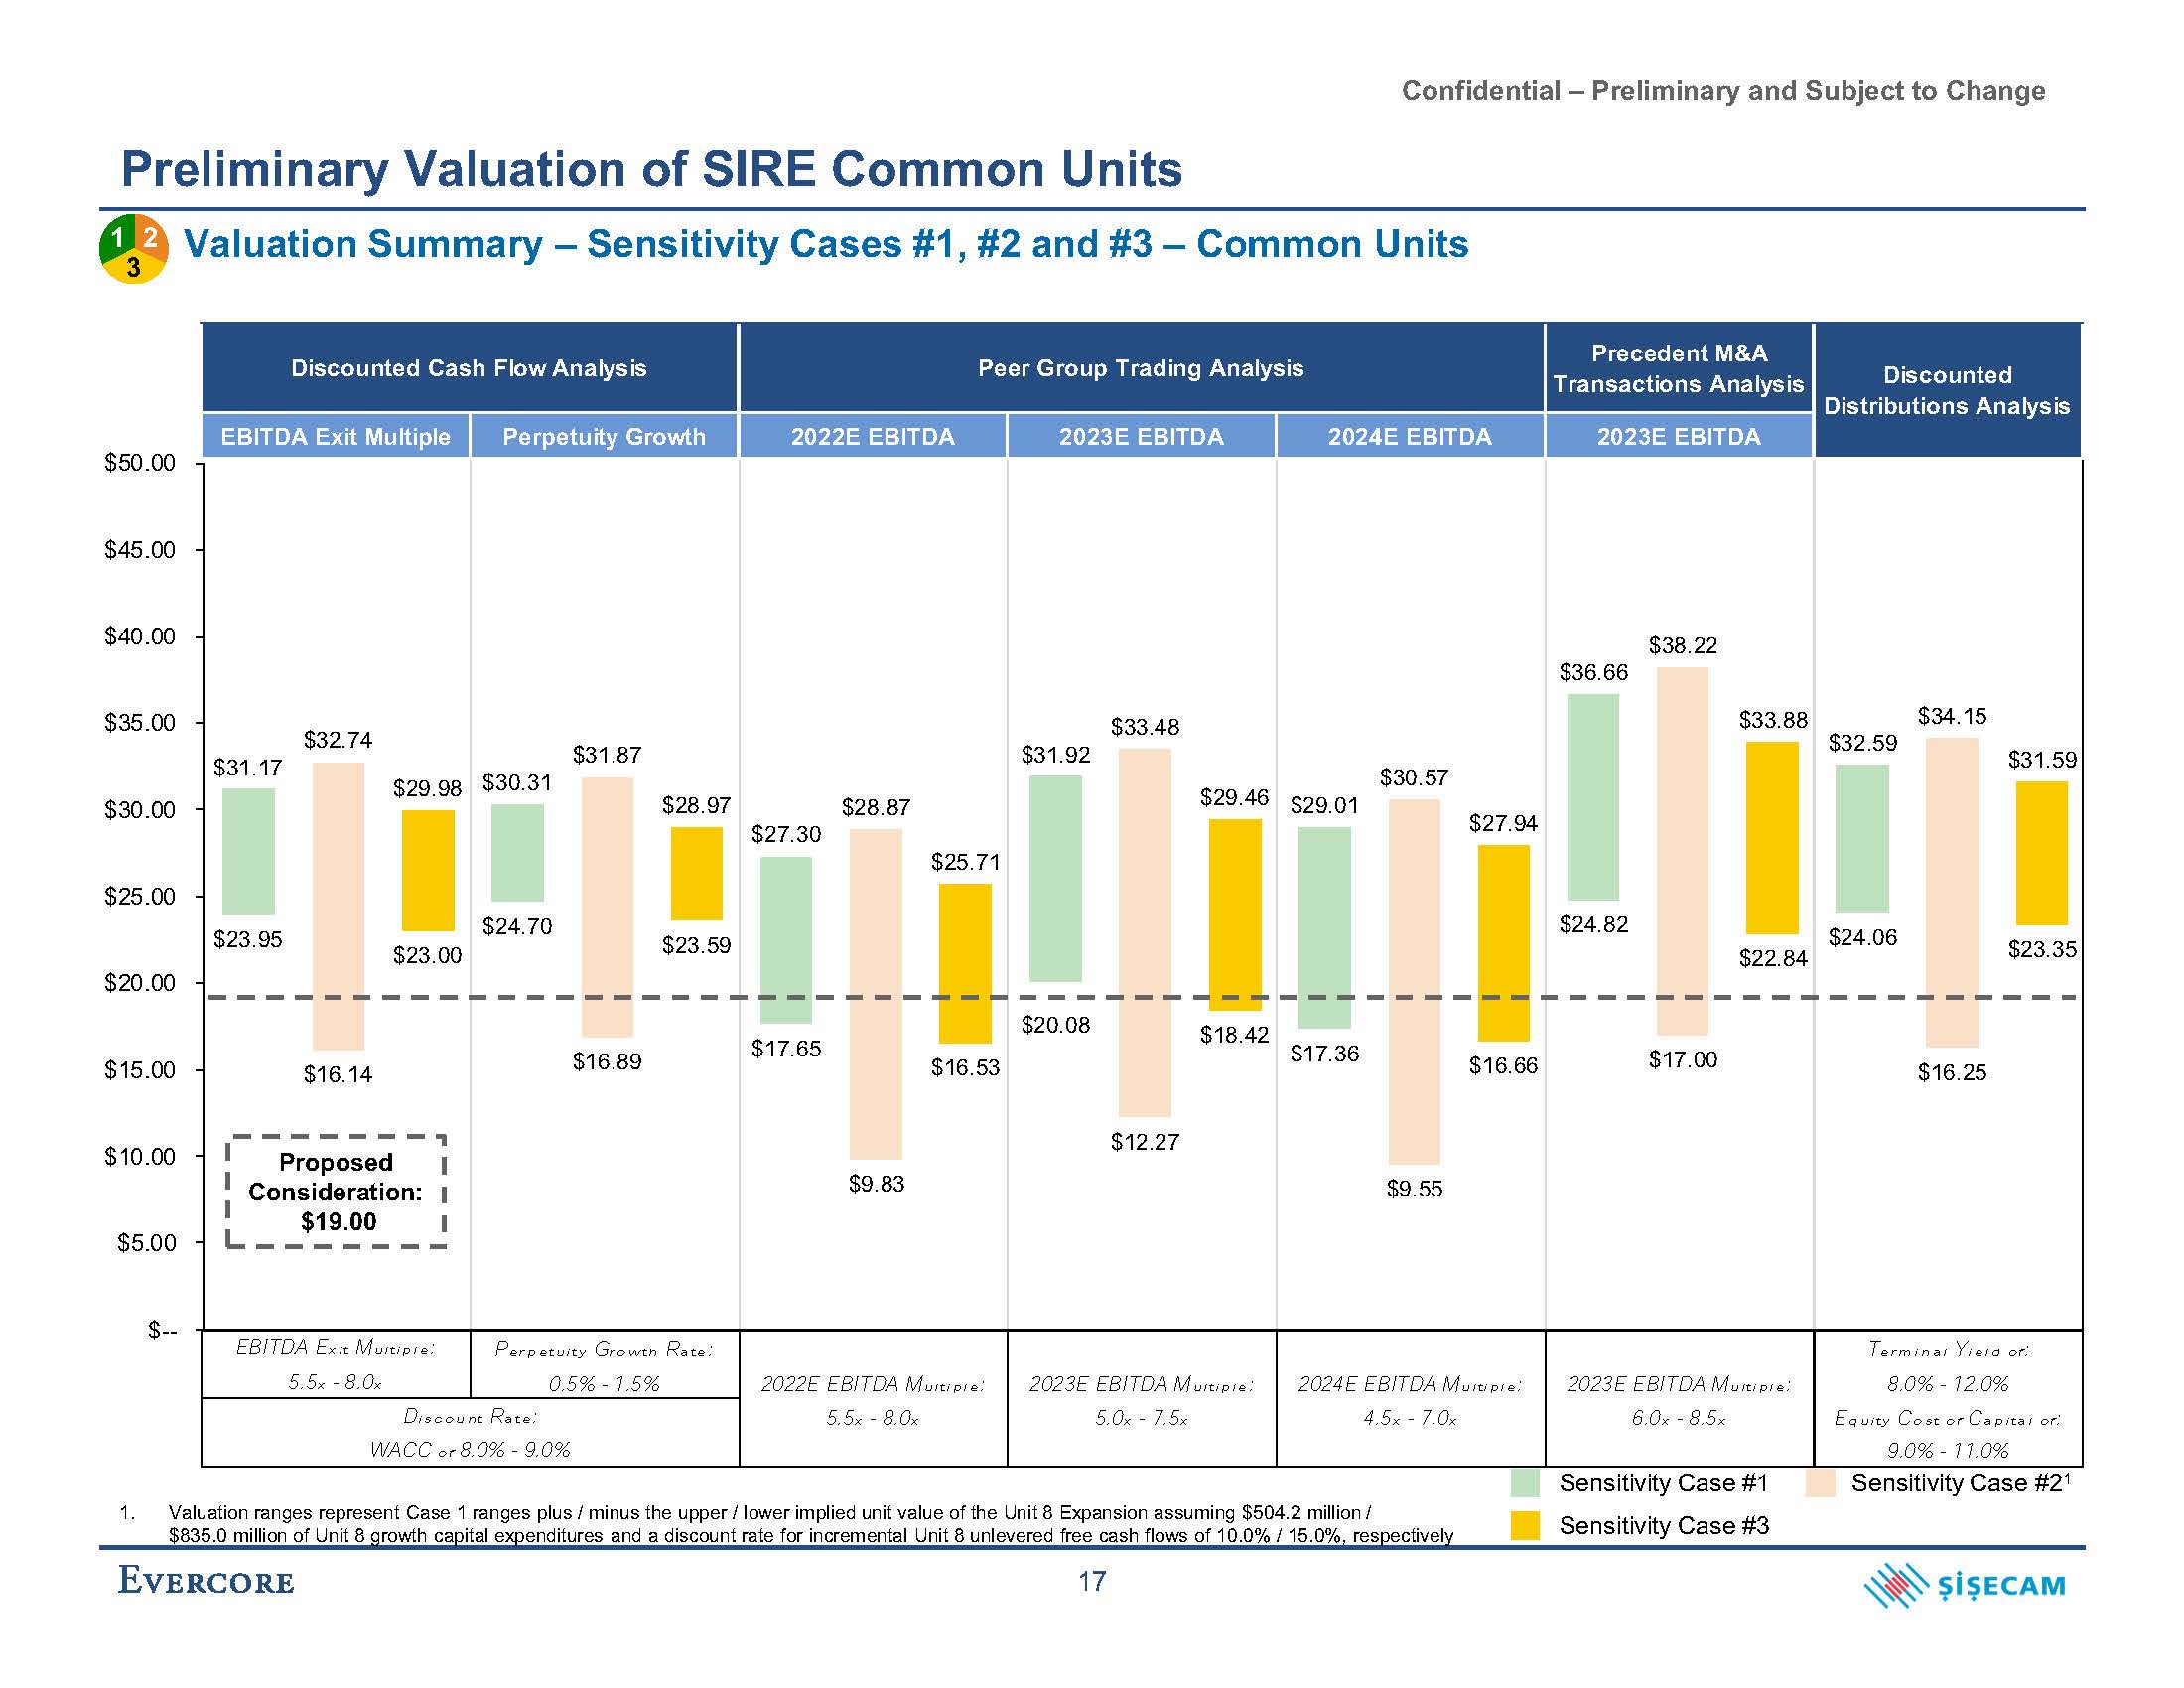
Confidential – Preliminary and Subject to Change Peer Group Trading Analysis Precedent M&A Transactions Analysis Discounted Cash Flow Analysis EBITDA Exit Multiple Perpetuity Growth 2022E EBITDA 2023E EBITDA 2024E EBITDA 2023E EBITDA EBITDA Exit Multiple: 5.5x - 8.0x Perpetuity Growth Rate: 0.5% - 1.5% 2022E EBITDA Multiple: 5.5x - 8.0x 2023E EBITDA Multiple: 5.0x - 7.5x 2024E EBITDA Multiple: 4.5x - 7.0x 2023E EBITDA Multiple: 6.0x - 8.5x Discount Rate: WACC of 8.0% - 9.0% Terminal Yield of: 8.0% - 12.0% Equity Cost of Capital of: 9.0% - 11.0% Discounted Distributions Analysis $23.95 $16.14 $23.00 $24.70 $16.89 $23.59 $17.65 $9.83 $16.53 $20.08 $12.27 $18.42 $17.36 $9.55 $16.66 $24.82 $17.00 $22.84 $24.06 $16.25 $23.35 $31.17 $32.74 $29.98 $30.31 $31.87 $28.97 $27.30 $28.87 $25.71 $31.92 $33.48 $29.46 $29.01 $30.57 $27.94 $36.66 $38.22 $33.88 $32.59 $34.15 $31.59 $-- $5.00 $10.00 $15.00 $20.00 $25.00 $30.00 $35.00 $40.00 $50.00 $45.00 1. Valuation ranges represent Case 1 ranges plus / minus the upper / lower implied unit value of the Unit 8 Expansion assuming $504.2 million / $835.0 million of Unit 8 growth capital expenditures and a discount rate for incremental Unit 8 unlevered free cash flows of 10.0% / 15.0%, respectively Preliminary Valuation of SIRE Common Units Valuation Summary – Sensitivity Cases #1, #2 and #3 – Common Units Proposed Consideration: $19.00 Sensitivity Case #1 Sensitivity Case #21 1 2 3 Sensitivity Case #3 17
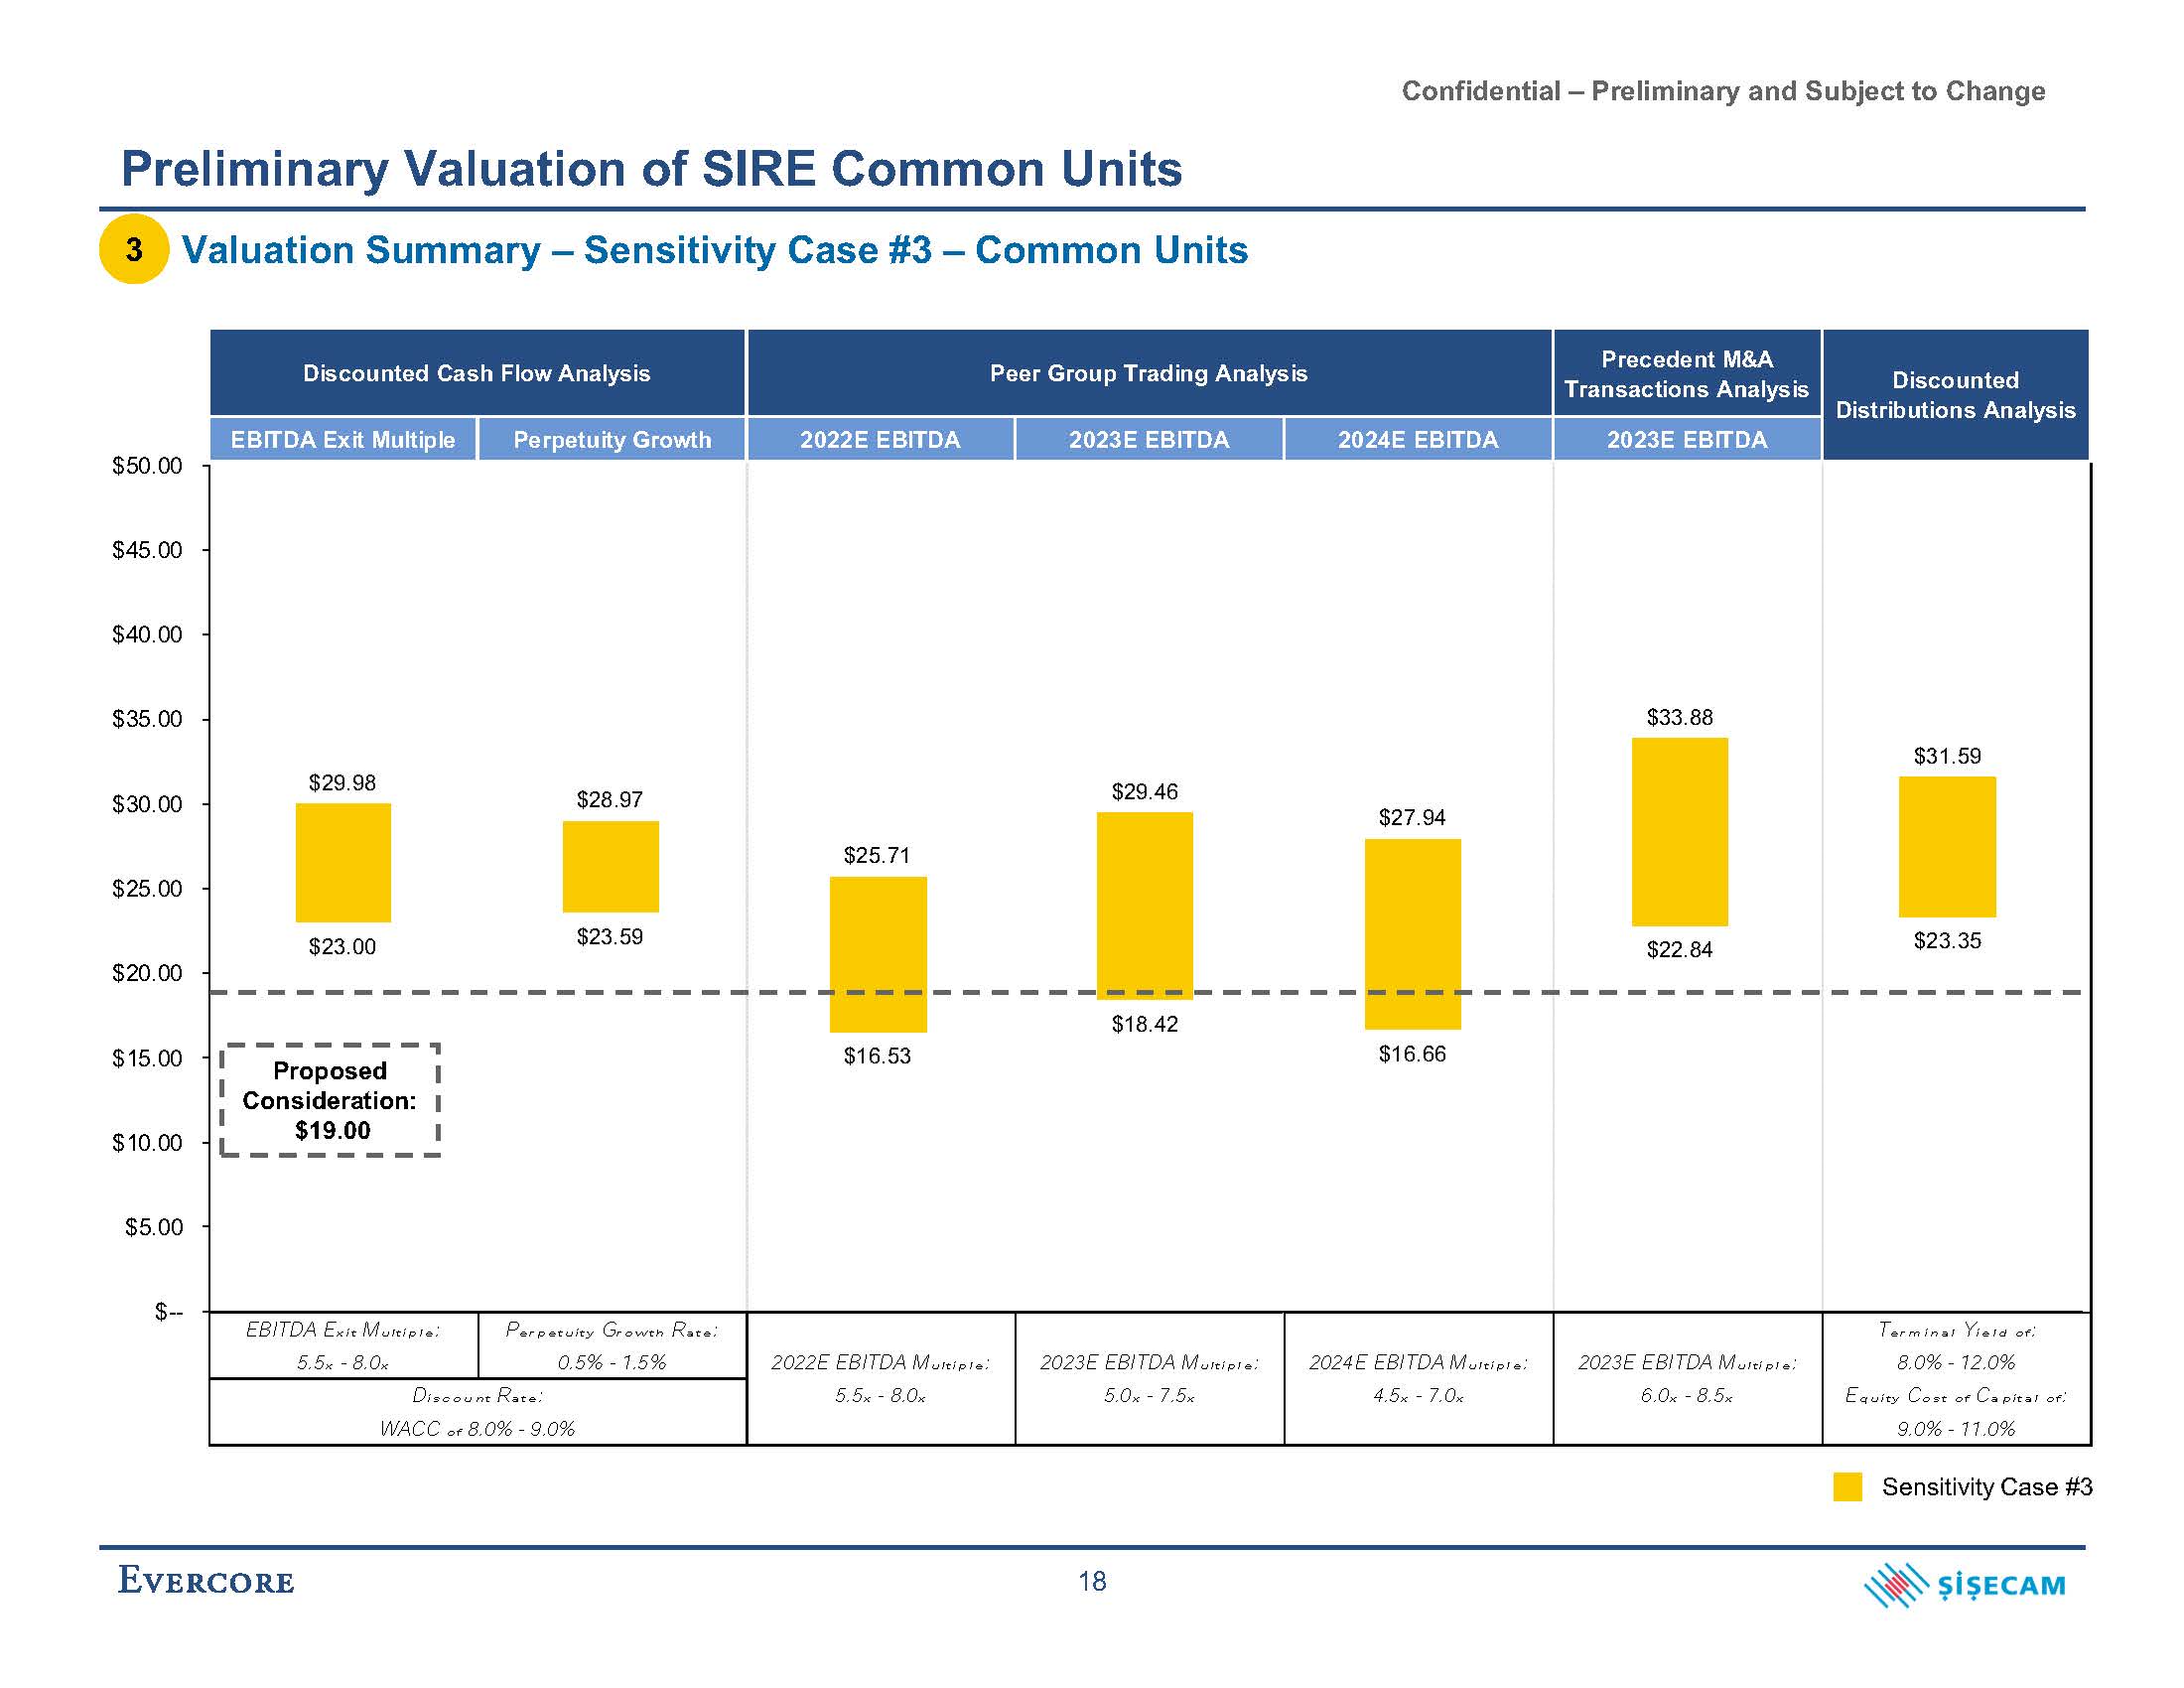
Confidential – Preliminary and Subject to Change Peer Group Trading Analysis Precedent M&A Transactions Analysis Discounted Cash Flow Analysis EBITDA Exit Multiple Perpetuity Growth 2022E EBITDA 2023E EBITDA 2024E EBITDA 2023E EBITDA EBITDA Exit Multiple: 5.5x - 8.0x Perpetuity Growth Rate: 0.5% - 1.5% 2022E EBITDA Multiple: 5.5x - 8.0x 2023E EBITDA Multiple: 5.0x - 7.5x 2024E EBITDA Multiple: 4.5x - 7.0x 2023E EBITDA Multiple: 6.0x - 8.5x Discount Rate: WACC of 8.0% - 9.0% Terminal Yield of: 8.0% - 12.0% Equity Cost of Capital of: 9.0% - 11.0% Discounted Distributions Analysis $23.00 $23.59 $16.53 $18.42 $16.66 $22.84 $23.35 $29.98 $28.97 $25.71 $29.46 $27.94 $33.88 $31.59 $-- $5.00 $10.00 $15.00 $20.00 $25.00 $30.00 $35.00 $50.00 $45.00 $40.00 Preliminary Valuation of SIRE Common Units •3 Valuation Summary – Sensitivity Case #3 – Common Units Proposed Consideration: $19.00 Sensitivity Case #3 18
Confidential – Preliminary and Subject to Change Appendix
Confidential – Preliminary and Subject to Change A. Weighted Average Cost of Capital Analysis
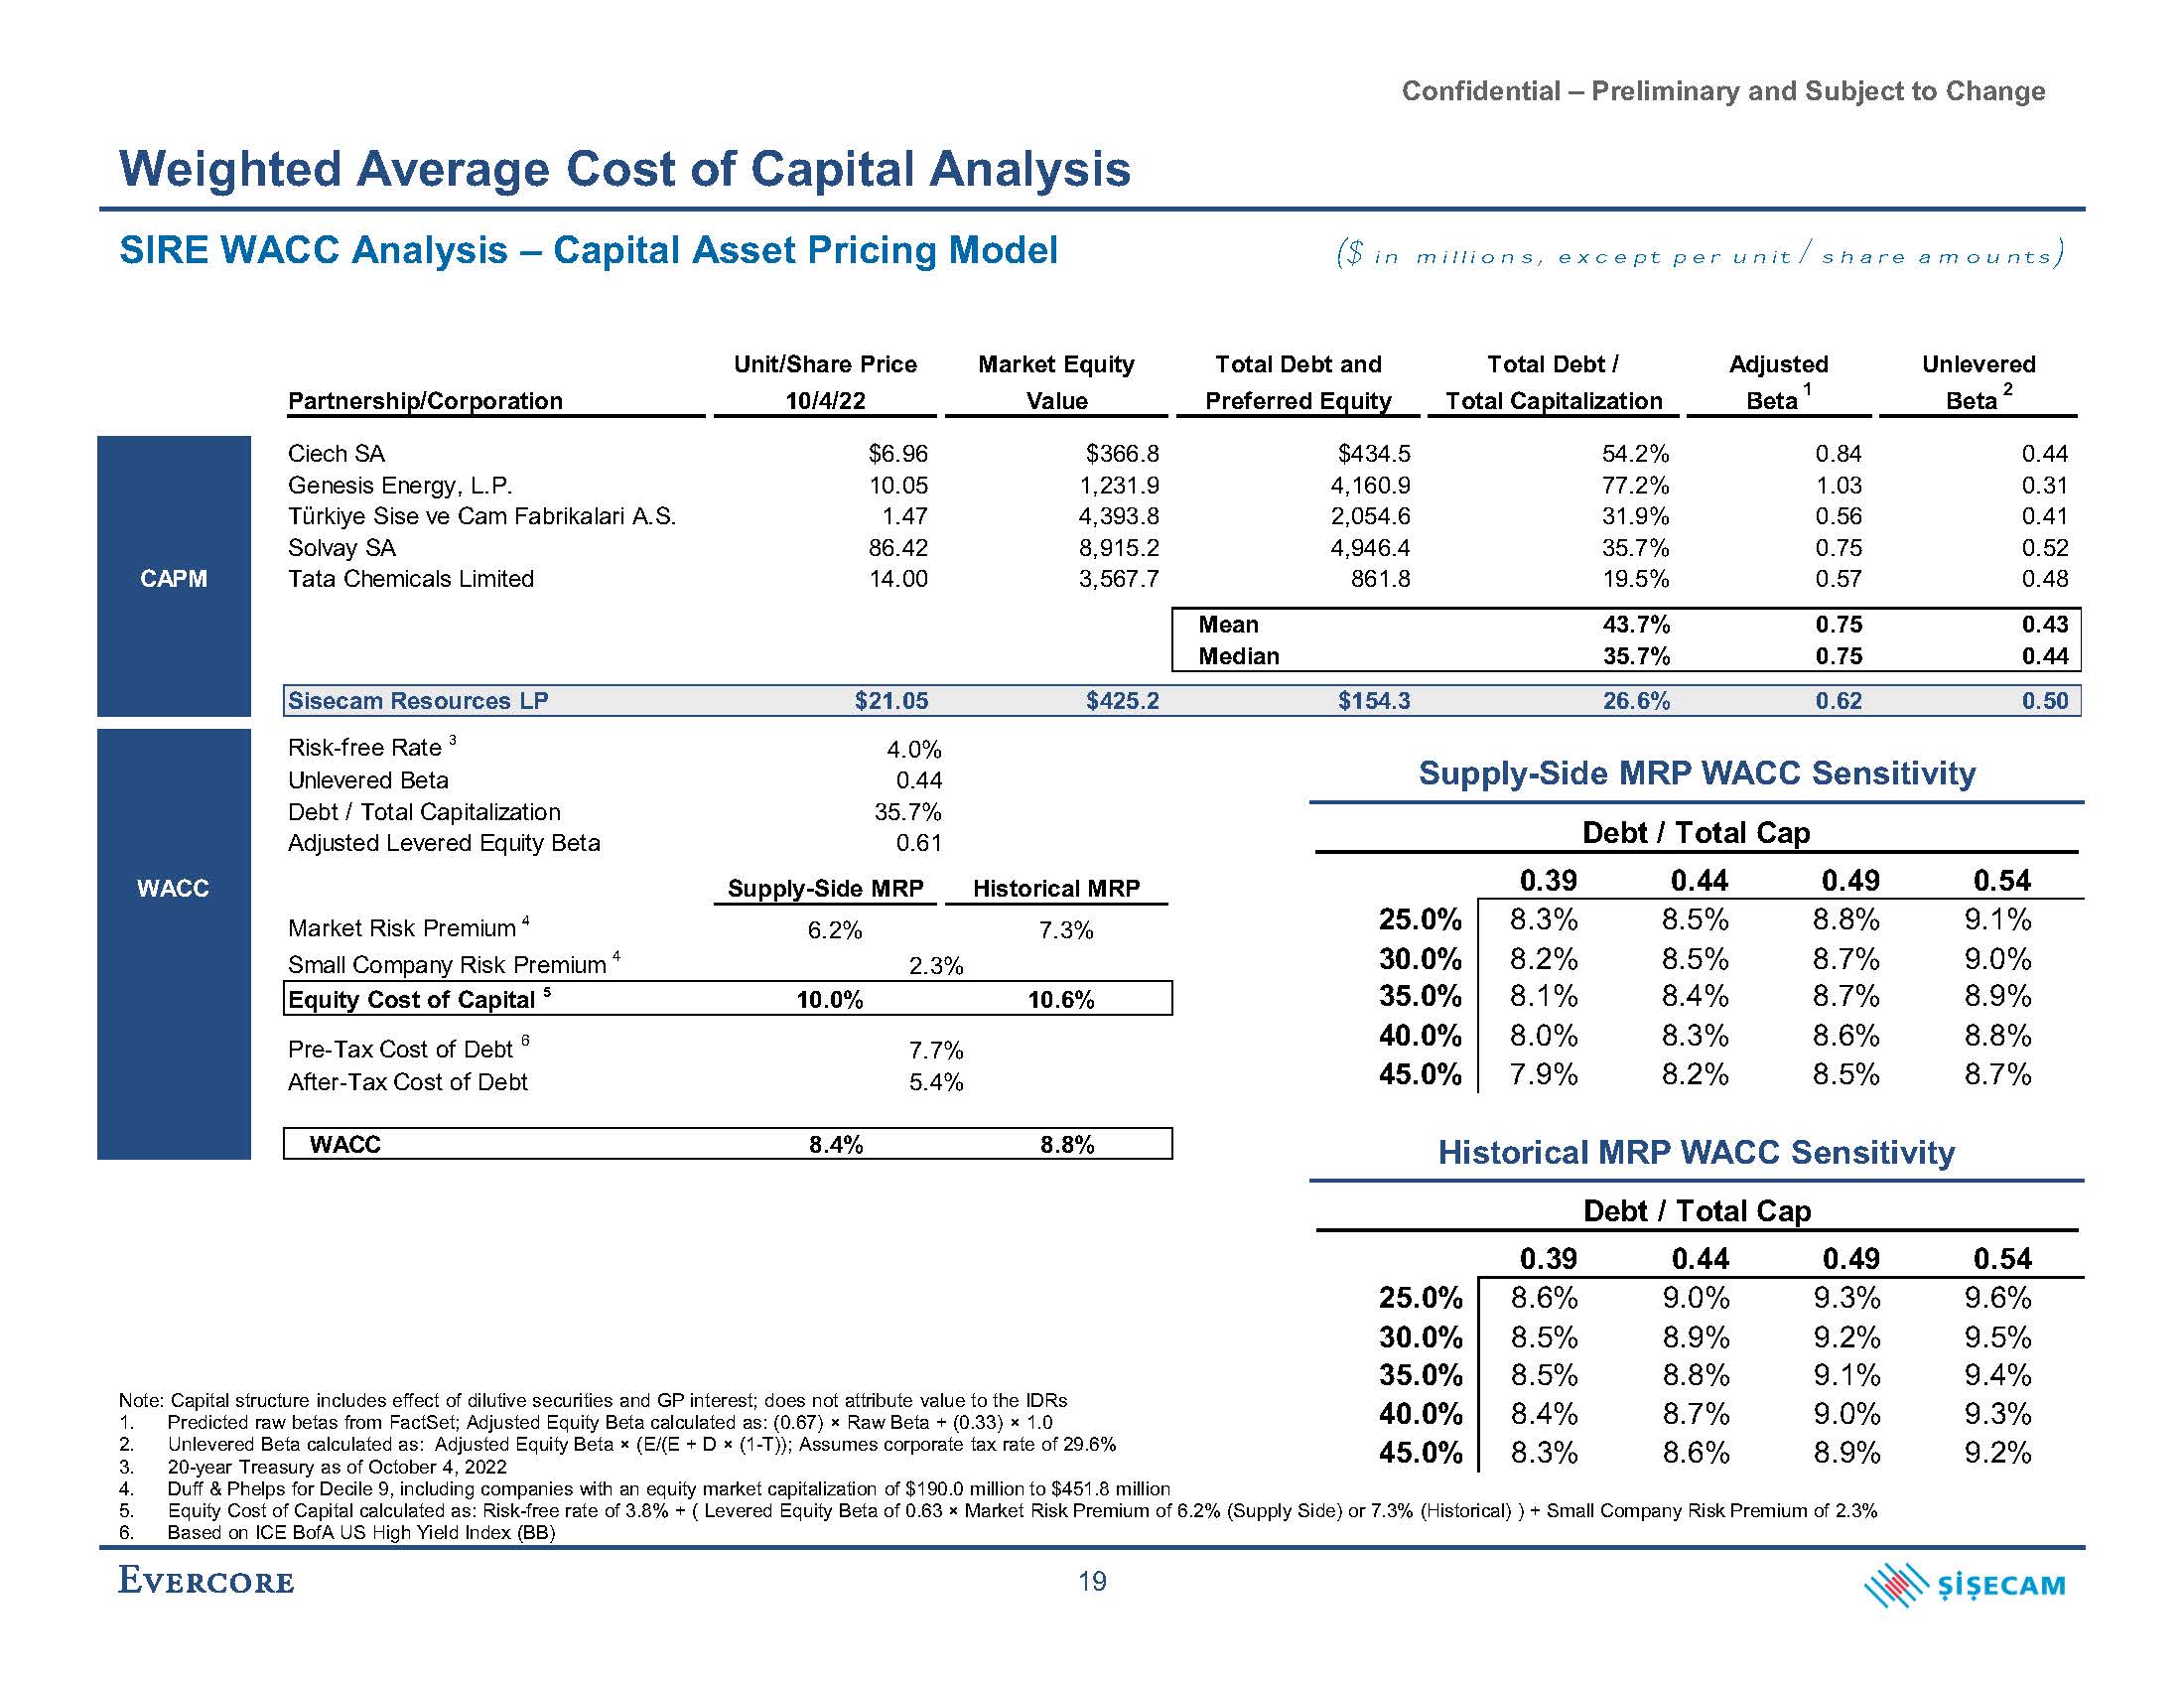
Confidential – Preliminary and Subject to Change Unit/Share Price Market Equity Total Debt and Total Debt / Adjusted Unlevered Partnership/Corporation 10/4/22 Value Preferred Equity Total Capitalization Beta 1 B Risk-free Rate 3 Unlevered Beta Debt / Total Capitalization Adjusted Levered Equity Beta WACC Sup 0.39 0.44 0.49 0.54 Market Risk Premium 4 25.0% 8.3% 8.5% 8.8% 9.1% Small Company Risk Premi 30.0% 8.2% 8.5% 8.7% 9.0% Equity Cost of Cap 35.0% 8.1% 8.4% 8.7% 8.9% Pre-Tax 4.0% 0.44 35.7% Ciech SA $6.96 $366.8 $434.5 54.2% 0 Genesis Energy, L.P. 10.05 1,231.9 4,160.9 77.2% Türkiye Sise ve Cam Fabrikalari A.S. 1.47 4,393.8 2,054.6 31.9% Solvay SA 86.42 8,915.2 4,946.4 CAPM Tata Chemicals Limited 14.00 3,567.7 861.8 Mean Median Sisecam Resources LP $21.05 $425.2 Weighted Average Cost of Capital Analysis SIRE WACC Analysis – Capital Asset Pricing Model ($ in millions, except per unit / share amounts) Note: Capital structure includes effect of dilutive securities and GP interest; does not attribute value to the IDRs Predicted raw betas from FactSet; Adjusted Equity Beta calculated as: (0.67) × Raw Beta + (0.33) × 1.0 Unlevered Beta calculated as: Adjusted Equity Beta × (E/(E + D × (1-T)); Assumes corporate tax rate of 29.6% 20-year Treasury as of October 4, 2022 Duff & Phelps for Decile 9, including companies with an equity market capitalization of $190.0 million to $451.8 million Equity Cost of Capital calculated as: Risk-free rate of 3.8% + ( Levered Equity Beta of 0.63 × Market Risk Premium of 6.2% (Supply Side) or 7.3% (Historical) ) + Small Company Risk Premium of 2.3% Based on ICE BofA US High Yield Index (BB) Supply-Side MRP WACC Sensitivity Historical MRP WACC Sensitivity Debt / Total Cap 0.39 0.44 0.49 0.54 Debt / Total Cap 40.0% 8.0% 8.3% 8.6% 8.8% 45.0% 7.9% 8.2% 8.5% 8.7% 25.0% 8.6% 9.0% 9.3% 9.6% 30.0% 8.5% 8.9% 9.2% 9.5% 35.0% 8.5% 8.8% 9.1% 9.4% 40.0% 8.4% 8.7% 9.0% 9.3% 45.0% 8.3% 8.6% 8.9% 9.2% 19
Confidential – Preliminary and Subject to Change B. Preliminary Valuation Detail – SIRE Financial Projections
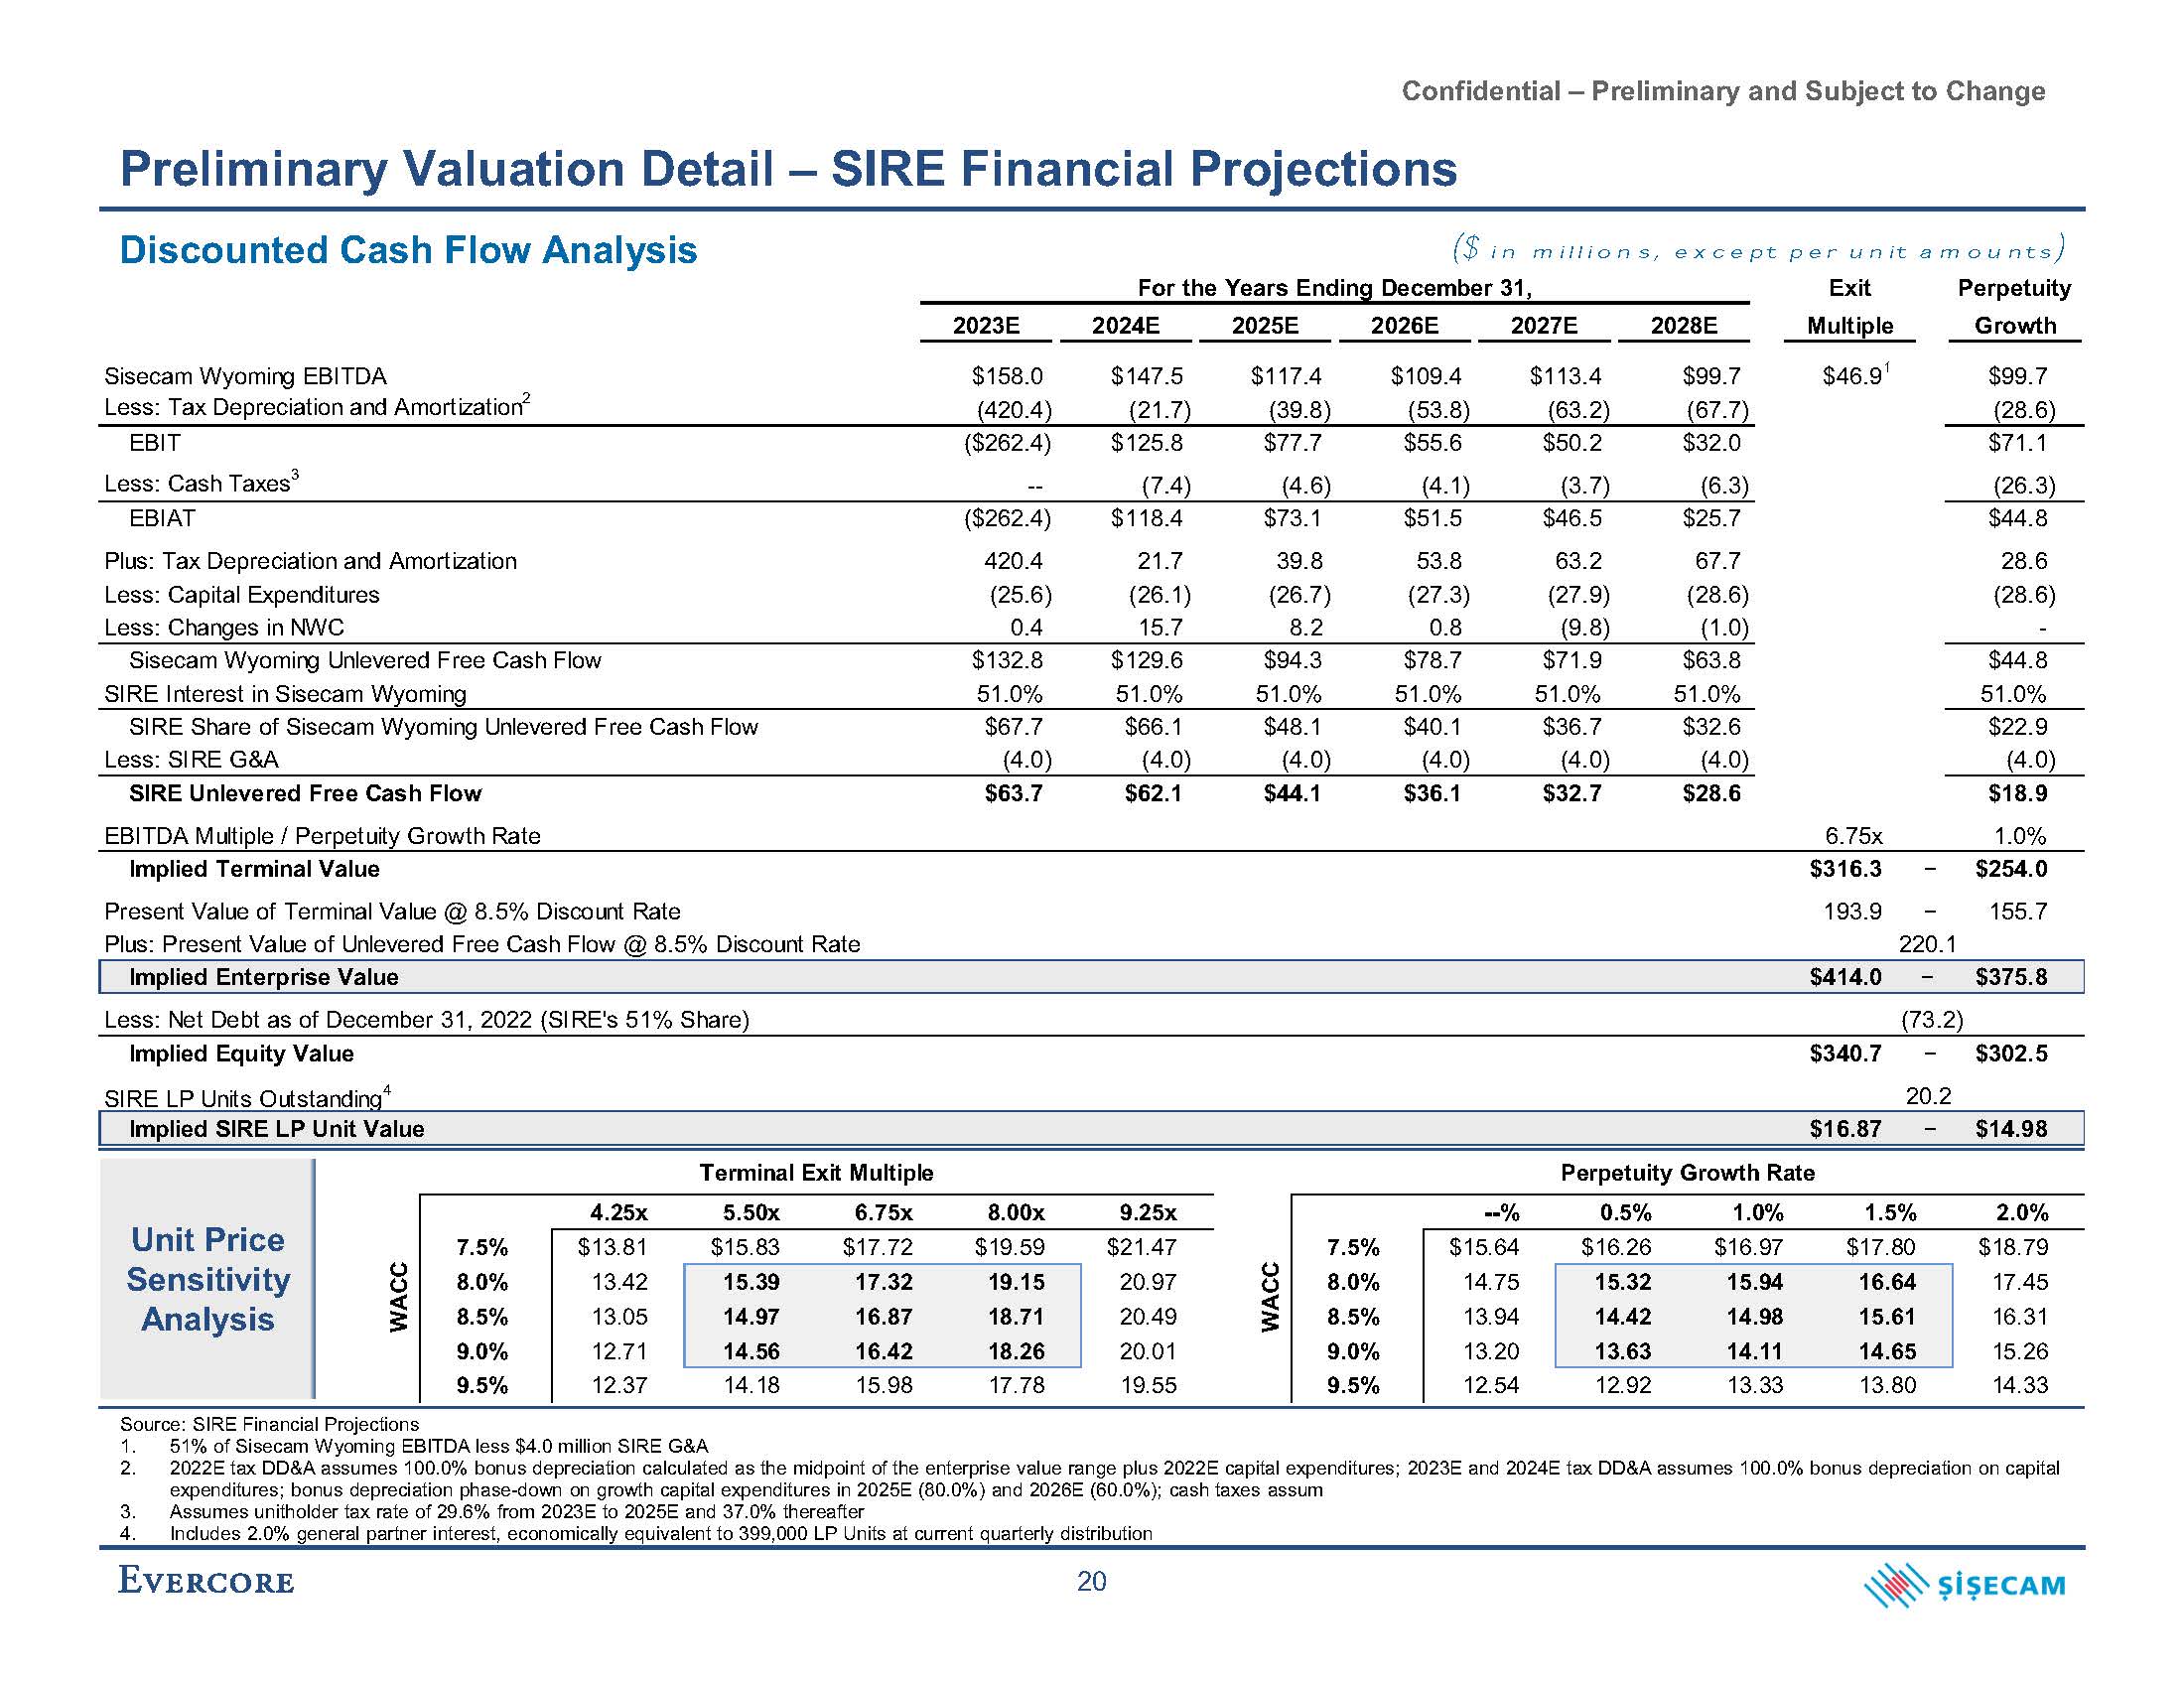
Confidential – Preliminary and Subject to Change Source: SIRE Financial Projections 51% of Sisecam Wyoming EBITDA less $4.0 million SIRE G&A 2022E tax DD&A assumes 100.0% bonus depreciation calculated as the midpoint of the enterprise value range plus 2022E capital expenditures; 2023E and 2024E tax DD&A assumes 100.0% bonus depreciation on capital expenditures; bonus depreciation phase-down on growth capital expenditures in 2025E (80.0%) and 2026E (60.0%); cash taxes assum Assumes unitholder tax rate of 29.6% from 2023E to 2025E and 37.0% thereafter Includes 2.0% general partner interest, economically equivalent to 399,000 LP Units at current quarterly distribution For the Years Ending December 31, 2023E 2024E 2025E 2026E 2027E 2028E Perpetuity Growth Exit Multiple $46.91 Sisecam Wyoming EBITDA Less: Tax Depreciation and Amortization2 $158.0 (420.4) $147.5 (21.7) $117.4 (39.8) $109.4 (53.8) $113.4 (63.2) $99.7 (67.7) $99.7 (28.6) EBIT Less: Cash Taxes3 ($262.4) -- $125.8 (7.4) $77.7 (4.6) $55.6 (4.1) $50.2 (3.7) $32.0 (6.3) $71.1 (26.3) $44.8 28.6 (28.6) EBIAT Plus: Tax Depreciation and Amortization Less: Capital Expenditures Less: Changes in NWC ($262.4) 420.4 (25.6) 0.4 $118.4 21.7 (26.1) 15.7 $73.1 39.8 (26.7) 8.2 $51.5 53.8 (27.3) 0.8 $46.5 63.2 (27.9) (9.8) $25.7 67.7 (28.6) (1.0) - Sisecam Wyoming Unlevered Free Cash Flow SIRE Interest in Sisecam Wyoming $132.8 51.0% $129.6 51.0% $94.3 51.0% $78.7 51.0% $71.9 51.0% $63.8 51.0% $44.8 51.0% SIRE Share of Sisecam Wyoming Unlevered Free Cash Flow Less: SIRE G&A $67.7 (4.0) $66.1 (4.0) $48.1 (4.0) $40.1 (4.0) $36.7 (4.0) $32.6 (4.0) $22.9 (4.0) $63.7 $62.1 $44.1 $36.1 $32.7 $28.6 SIRE Unlevered Free Cash Flow EBITDA Multiple / Perpetuity Growth Rate 6.75x $18.9 1.0% $316.3 193.9 Implied Terminal Value Present Value of Terminal Value @ 8.5% Discount Rate Plus: Present Value of Unlevered Free Cash Flow @ 8.5% Discount Rate − $254.0 − 155.7 220.1 Implied Enterprise Value $414.0 − $375.8 Less: Net Debt as of December 31, 2022 (SIRE's 51% Share) (73.2) $340.7 Implied Equity Value SIRE LP Units Outstanding4 − $302.5 20.2 Implied SIRE LP Unit Value $16.87 − $14.98 Discounted Cash Flow Analysis Preliminary Valuation Detail – SIRE Financial Projections 4.25x 8.00x 9.25x --% 1.5% 2.0% Terminal Exit Multiple 5.50x 6.75x $15.83 $17.72 $19.59 Perpetuity Growth Rate 0.5% 1.0% $16.26 $16.97 $17.80 15.39 14.97 14.56 17.32 16.87 16.42 19.15 18.71 18.26 15.32 14.42 13.63 15.94 14.98 14.11 16.64 15.61 14.65 7.5% 8.0% 8.5% 9.0% 9.5% $13.81 13.42 13.05 12.71 12.37 14.18 15.98 17.78 $21.47 20.97 20.49 20.01 19.55 7.5% 8.0% 8.5% 9.0% 9.5% $15.64 14.75 13.94 13.20 12.54 12.92 13.33 13.80 $18.79 17.45 16.31 15.26 14.33 WACC WACC Unit Price Sensitivity Analysis ($ in millions, except per unit amounts)
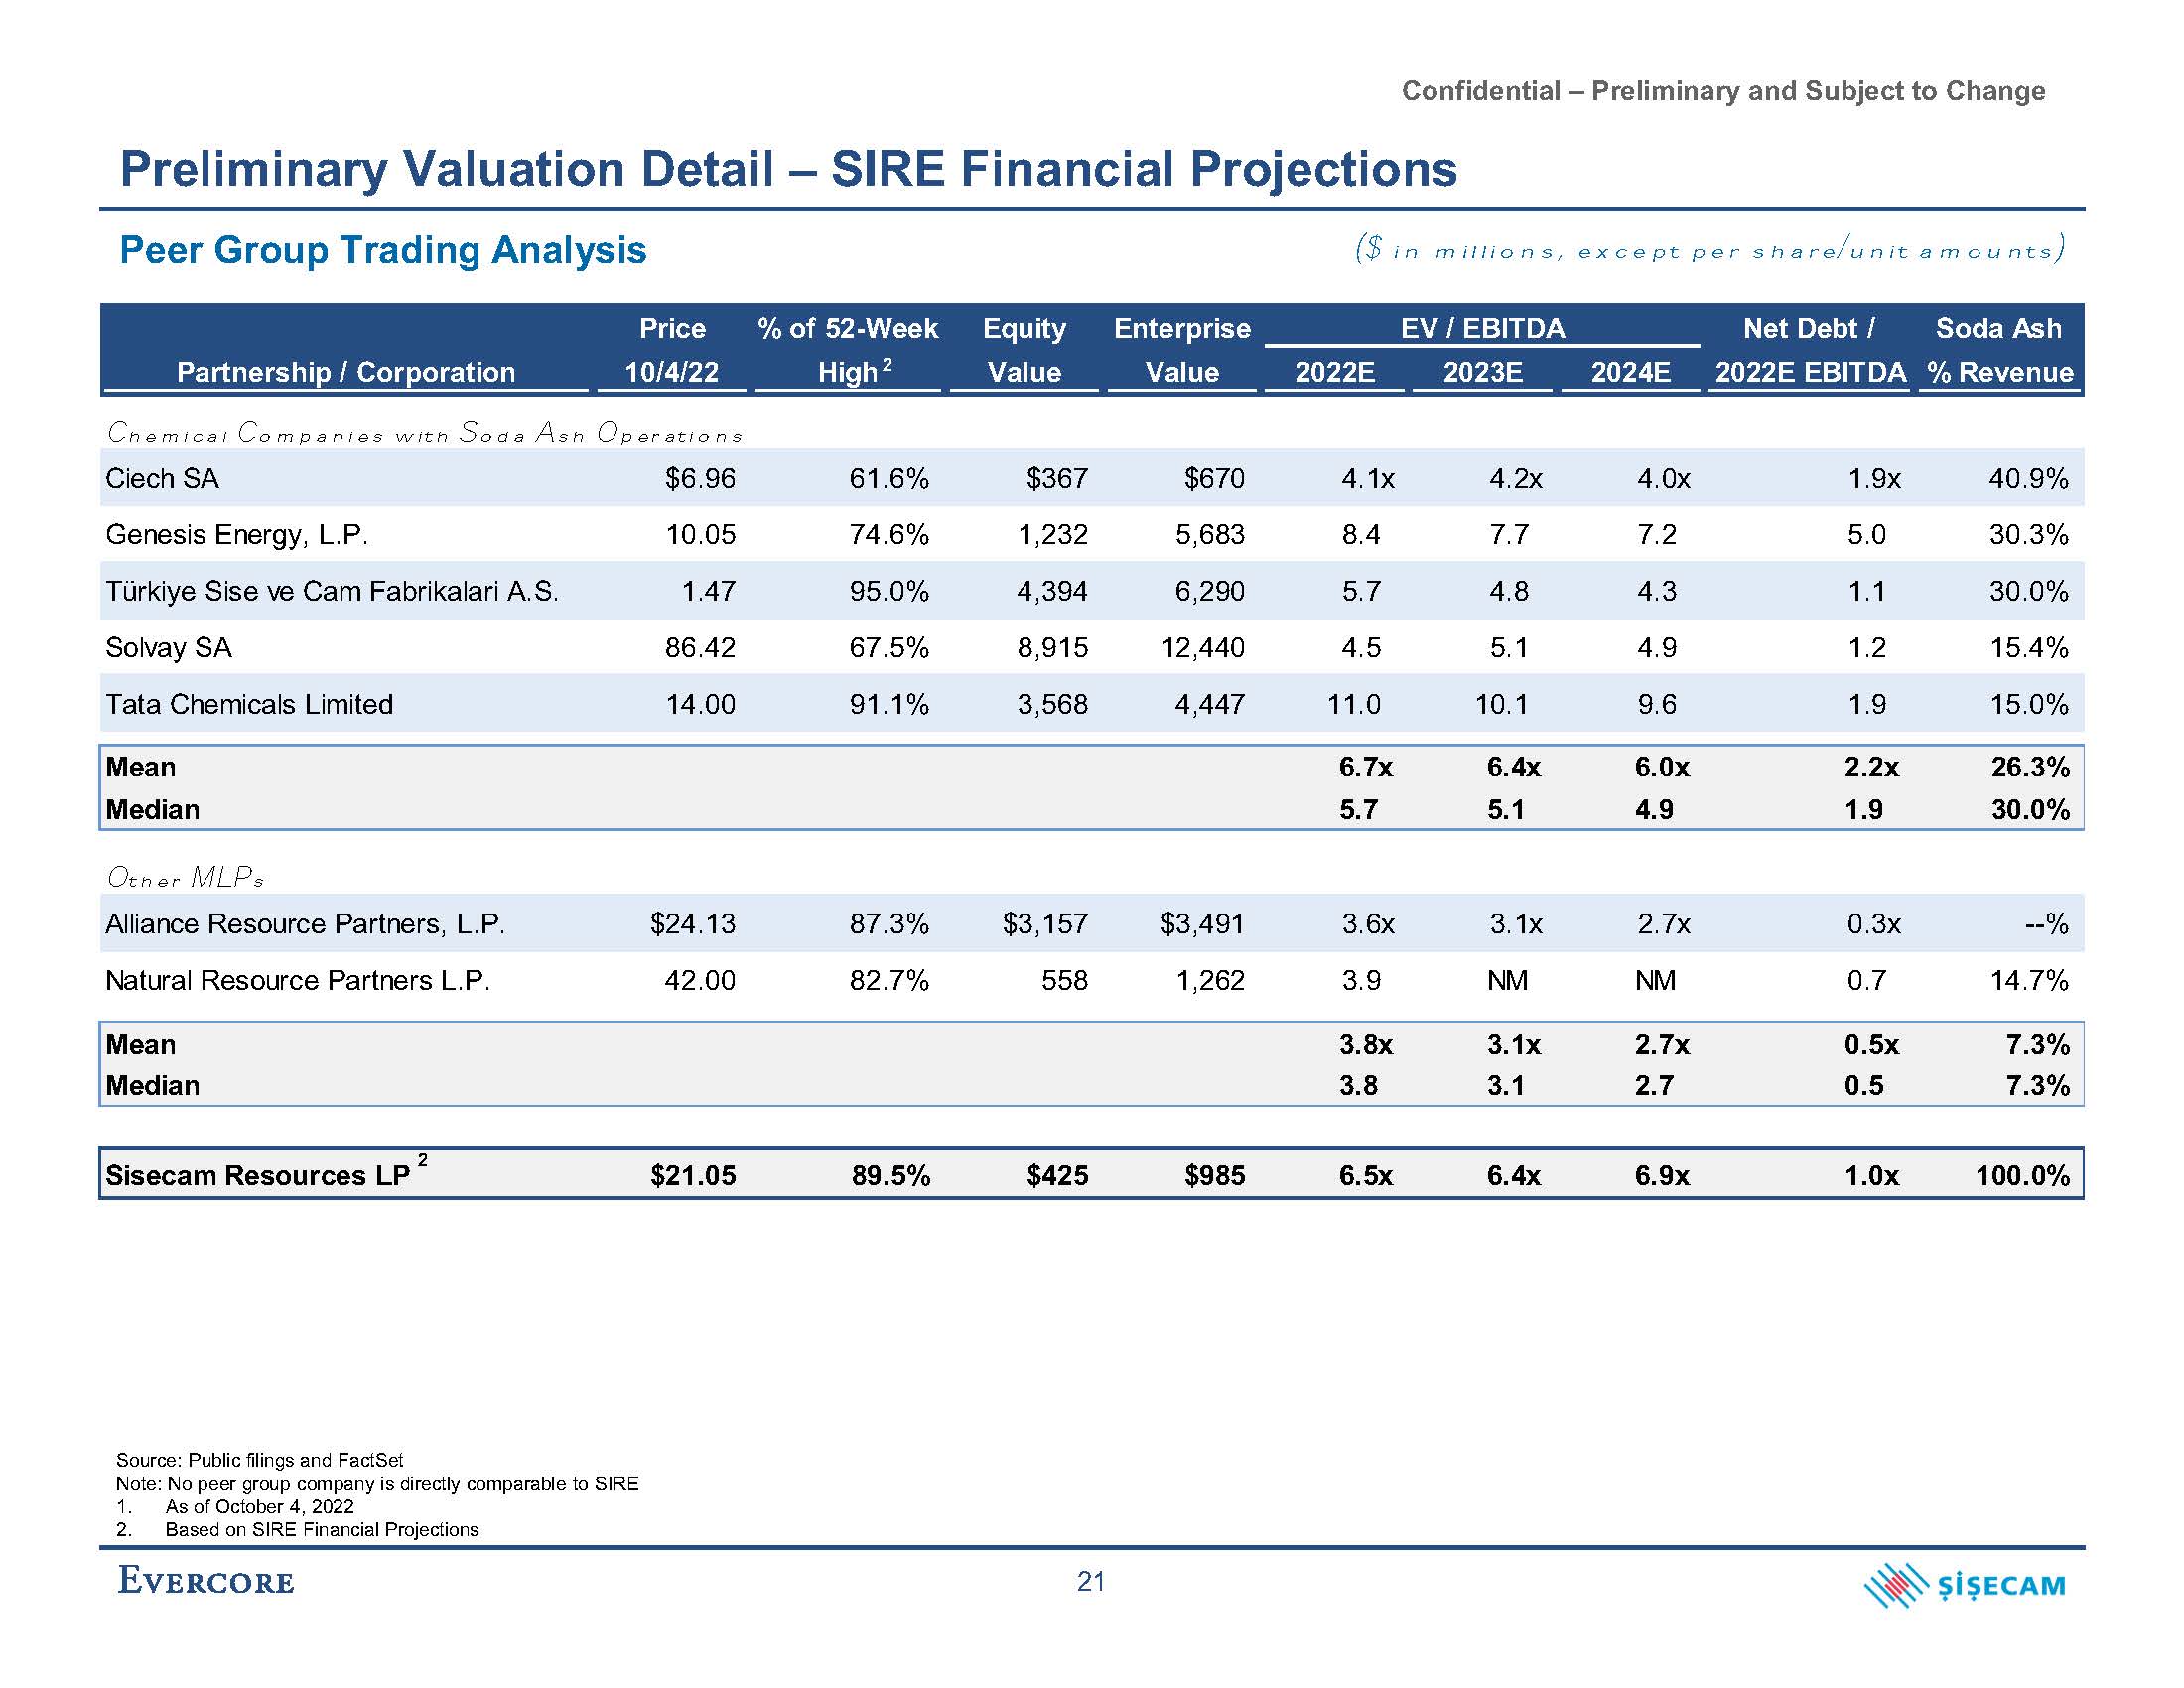
Confidential – Preliminary and Subject to Change Preliminary Valuation Detail – SIRE Financial Projections Peer Group Trading Analysis Source: Public filings and FactSet Note: No peer group company is directly comparable to SIRE 1. As of October 4, 2022 1 ($ in millions, except per share/unit amounts) Equity Enterprise EV / EBITDA Net Debt / Soda Ash Value Value 2022E 2023E 2024E 2022E EBITDA % Revenue 2. Based on SIRE Financial Projections 21 Price % of 52-Week Partnership / Corporation 10/4/22 High 2 Chemical Companies with Soda Ash Operations Ciech SA $6.96 61.6% $367 $670 4.1x 4.2x 4.0x 1.9x 40.9% Genesis Energy, L.P. 10.05 74.6% 1,232 5,683 8.4 7.7 7.2 5.0 30.3% Türkiye Sise ve Cam Fabrikalari A.S. 1.47 95.0% 4,394 6,290 5.7 4.8 4.3 1.1 30.0% Solvay SA 86.42 67.5% 8,915 12,440 4.5 5.1 4.9 1.2 15.4% Tata Chemicals Limited 14.00 91.1% 3,568 4,447 11.0 10.1 9.6 1.9 15.0% Mean 6.7x 6.4x 6.0x 2.2x 26.3% Median 5.7 5.1 4.9 1.9 30.0% Other MLPs Alliance Resource Partners, L.P. $24.13 87.3% $3,157 $3,491 3.6x 3.1x 2.7x 0.3x --% Natural Resource Partners L.P. 42.00 82.7% 558 1,262 3.9 NM NM 0.7 14.7% Mean 3.8x 3.1x 2.7x 0.5x 7.3% Median 3.8 3.1 2.7 0.5 7.3% Sisecam Resources LP 2 $21.05 89.5% $425 $985 6.5x 6.4x 6.9x 1.0x 100.0%
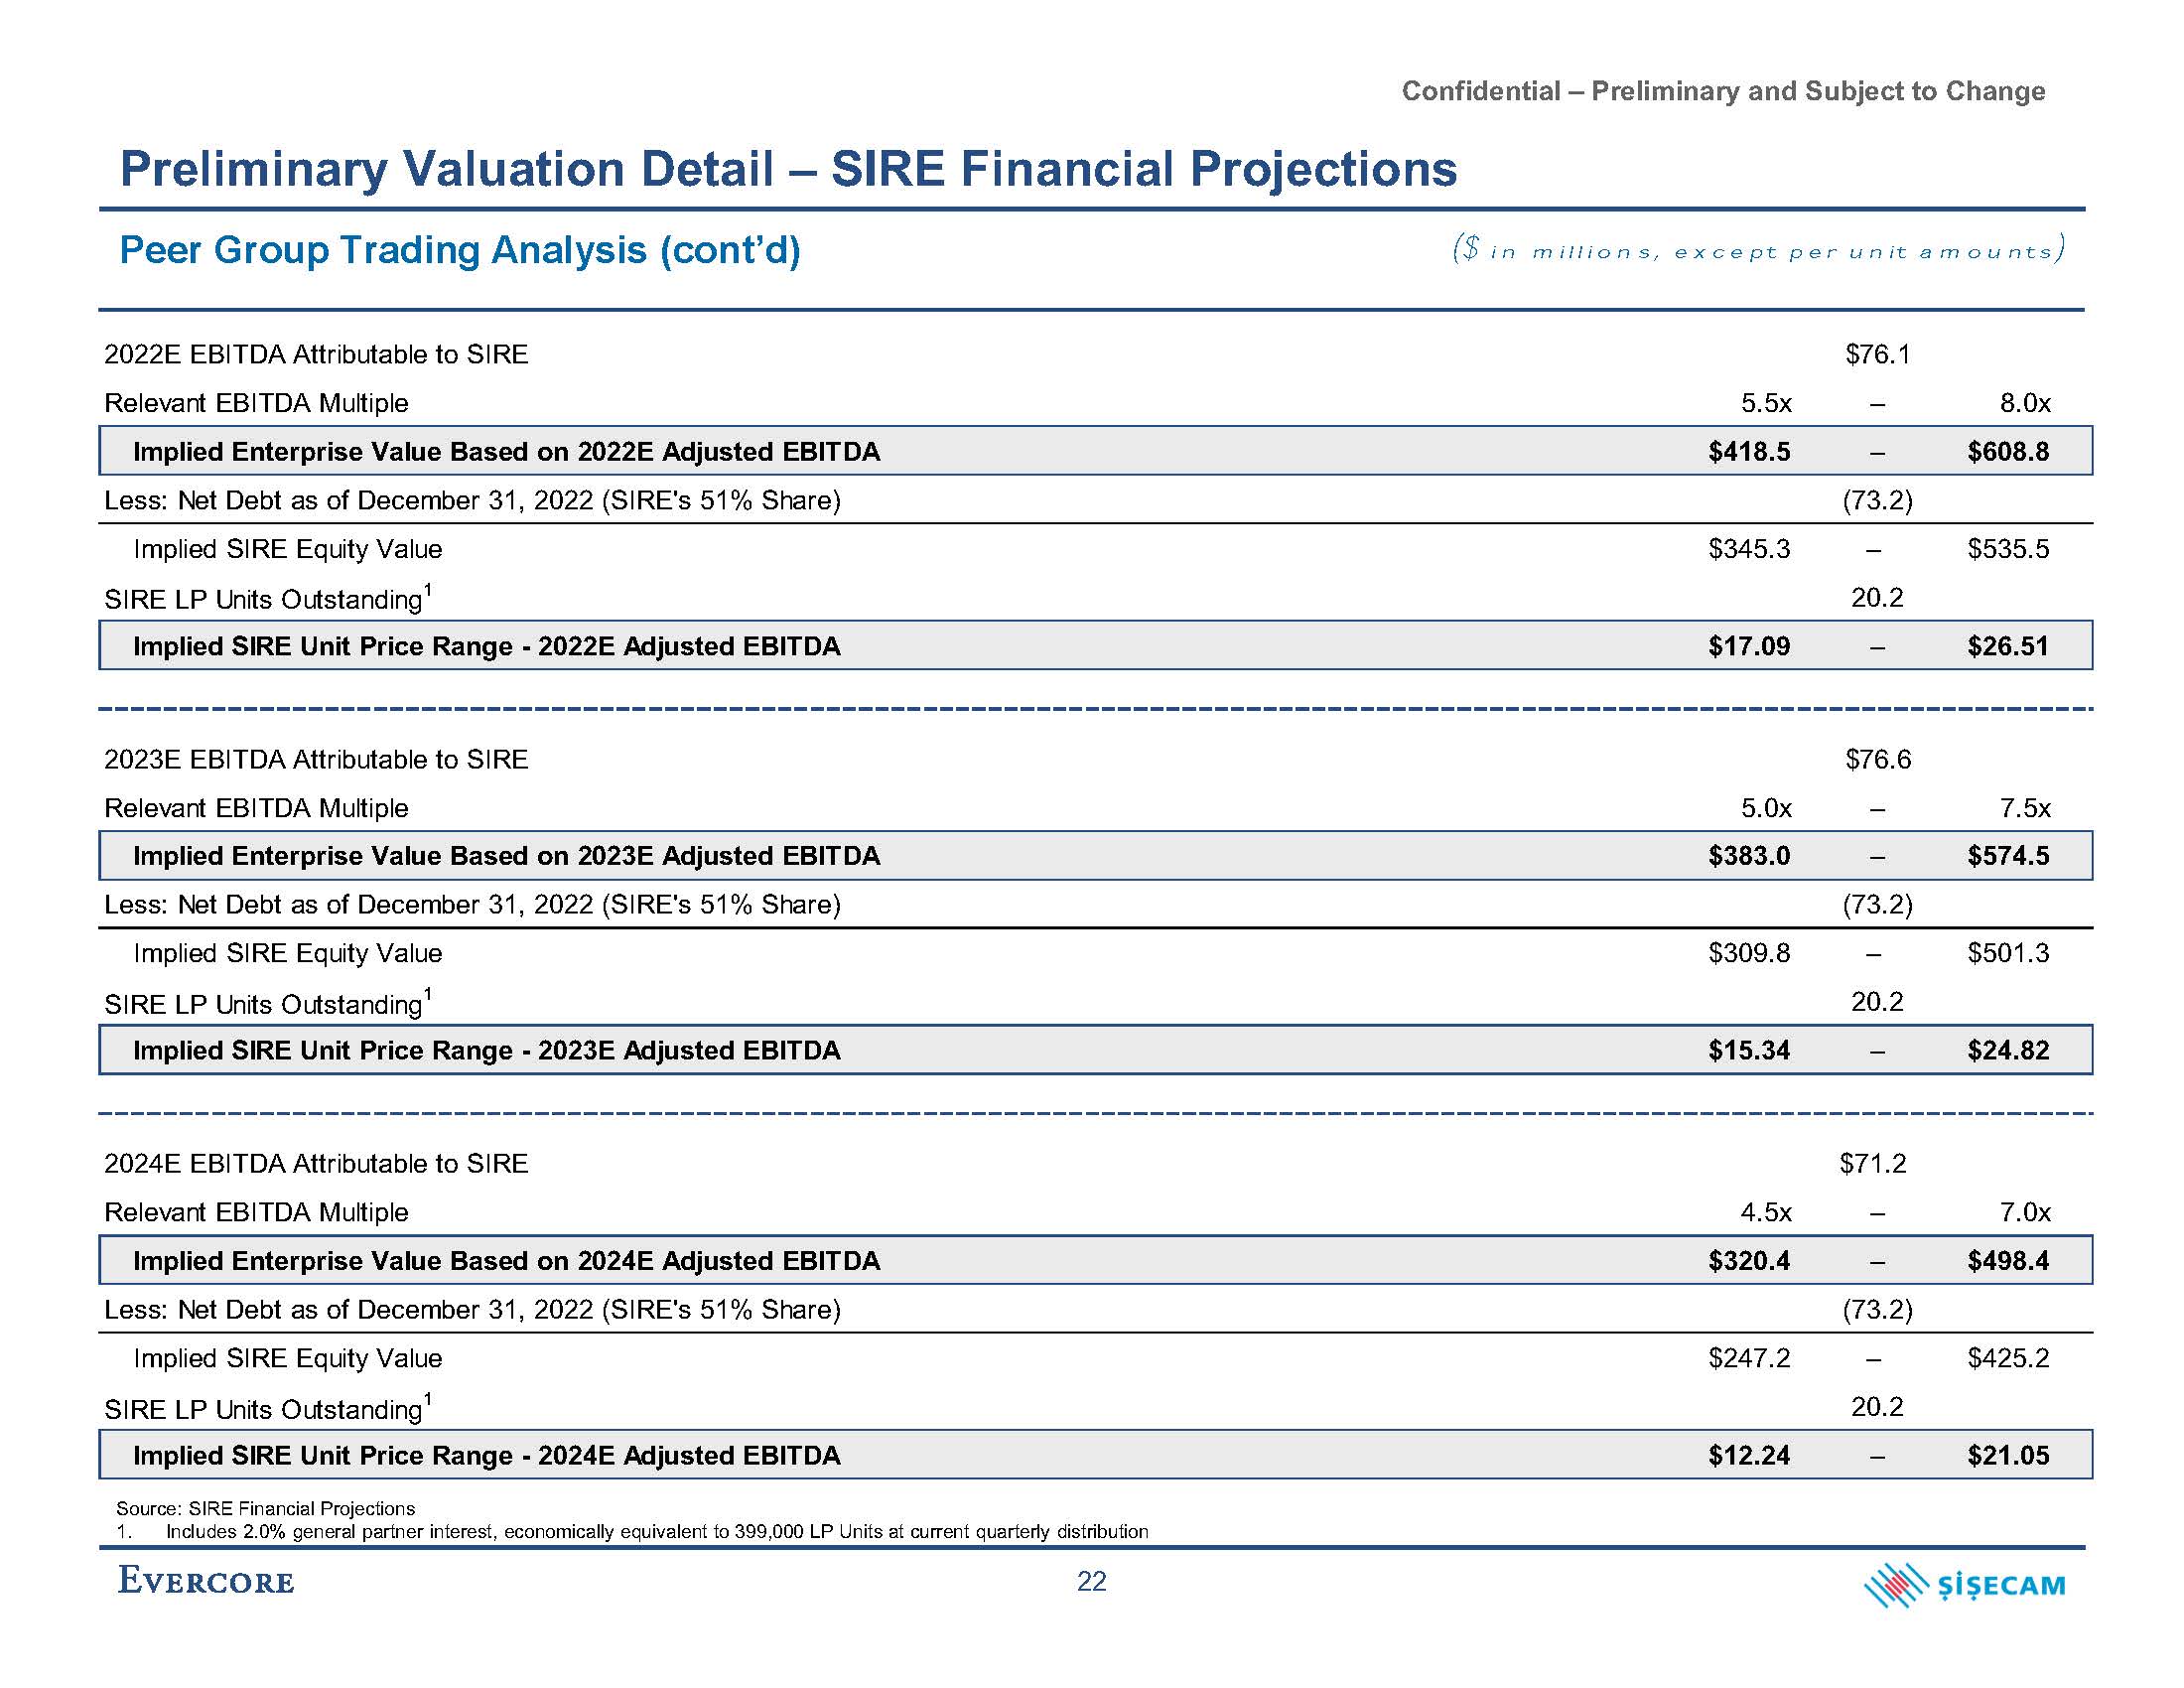
Confidential – Preliminary and Subject to Change Preliminary Valuation Detail – SIRE Financial Projections Peer Group Trading Analysis (cont’d) ($ in millions, except per unit amounts) 2022E EBITDA Attributable to SIRE Relevant EBITDA Multiple 5.5x $76.1 – 8.0x Implied Enterprise Value Based on 2022E Adjusted EBITDA $418.5 – $608.8 Less: Net Debt as of December 31, 2022 (SIRE's 51% Share) (73.2) Implied SIRE Equity Value SIRE LP Units Outstanding1 $345.3 – 20.2 $535.5 Implied SIRE Unit Price Range - 2022E Adjusted EBITDA $17.09 – $26.51 2023E EBITDA Attributable to SIRE Relevant EBITDA Multiple 5.0x $76.6 – 7.5x Implied Enterprise Value Based on 2023E Adjusted EBITDA $383.0 – $574.5 Less: Net Debt as of December 31, 2022 (SIRE's 51% Share) (73.2) Implied SIRE Equity Value SIRE LP Units Outstanding1 $309.8 – 20.2 $501.3 Implied SIRE Unit Price Range - 2023E Adjusted EBITDA $15.34 – $24.82 2024E EBITDA Attributable to SIRE Relevant EBITDA Multiple 4.5x $71.2 – 7.0x Implied Enterprise Value Based on 2024E Adjusted EBITDA $320.4 – $498.4 Less: Net Debt as of December 31, 2022 (SIRE's 51% Share) (73.2) Implied SIRE Equity Value SIRE LP Units Outstanding1 $247.2 – 20.2 $425.2 Implied SIRE Unit Price Range - 2024E Adjusted EBITDA $12.24 – $21.05 Source: SIRE Financial Projections 1. Includes 2.0% general partner interest, economically equivalent to 399,000 LP Units at current quarterly distribution 22
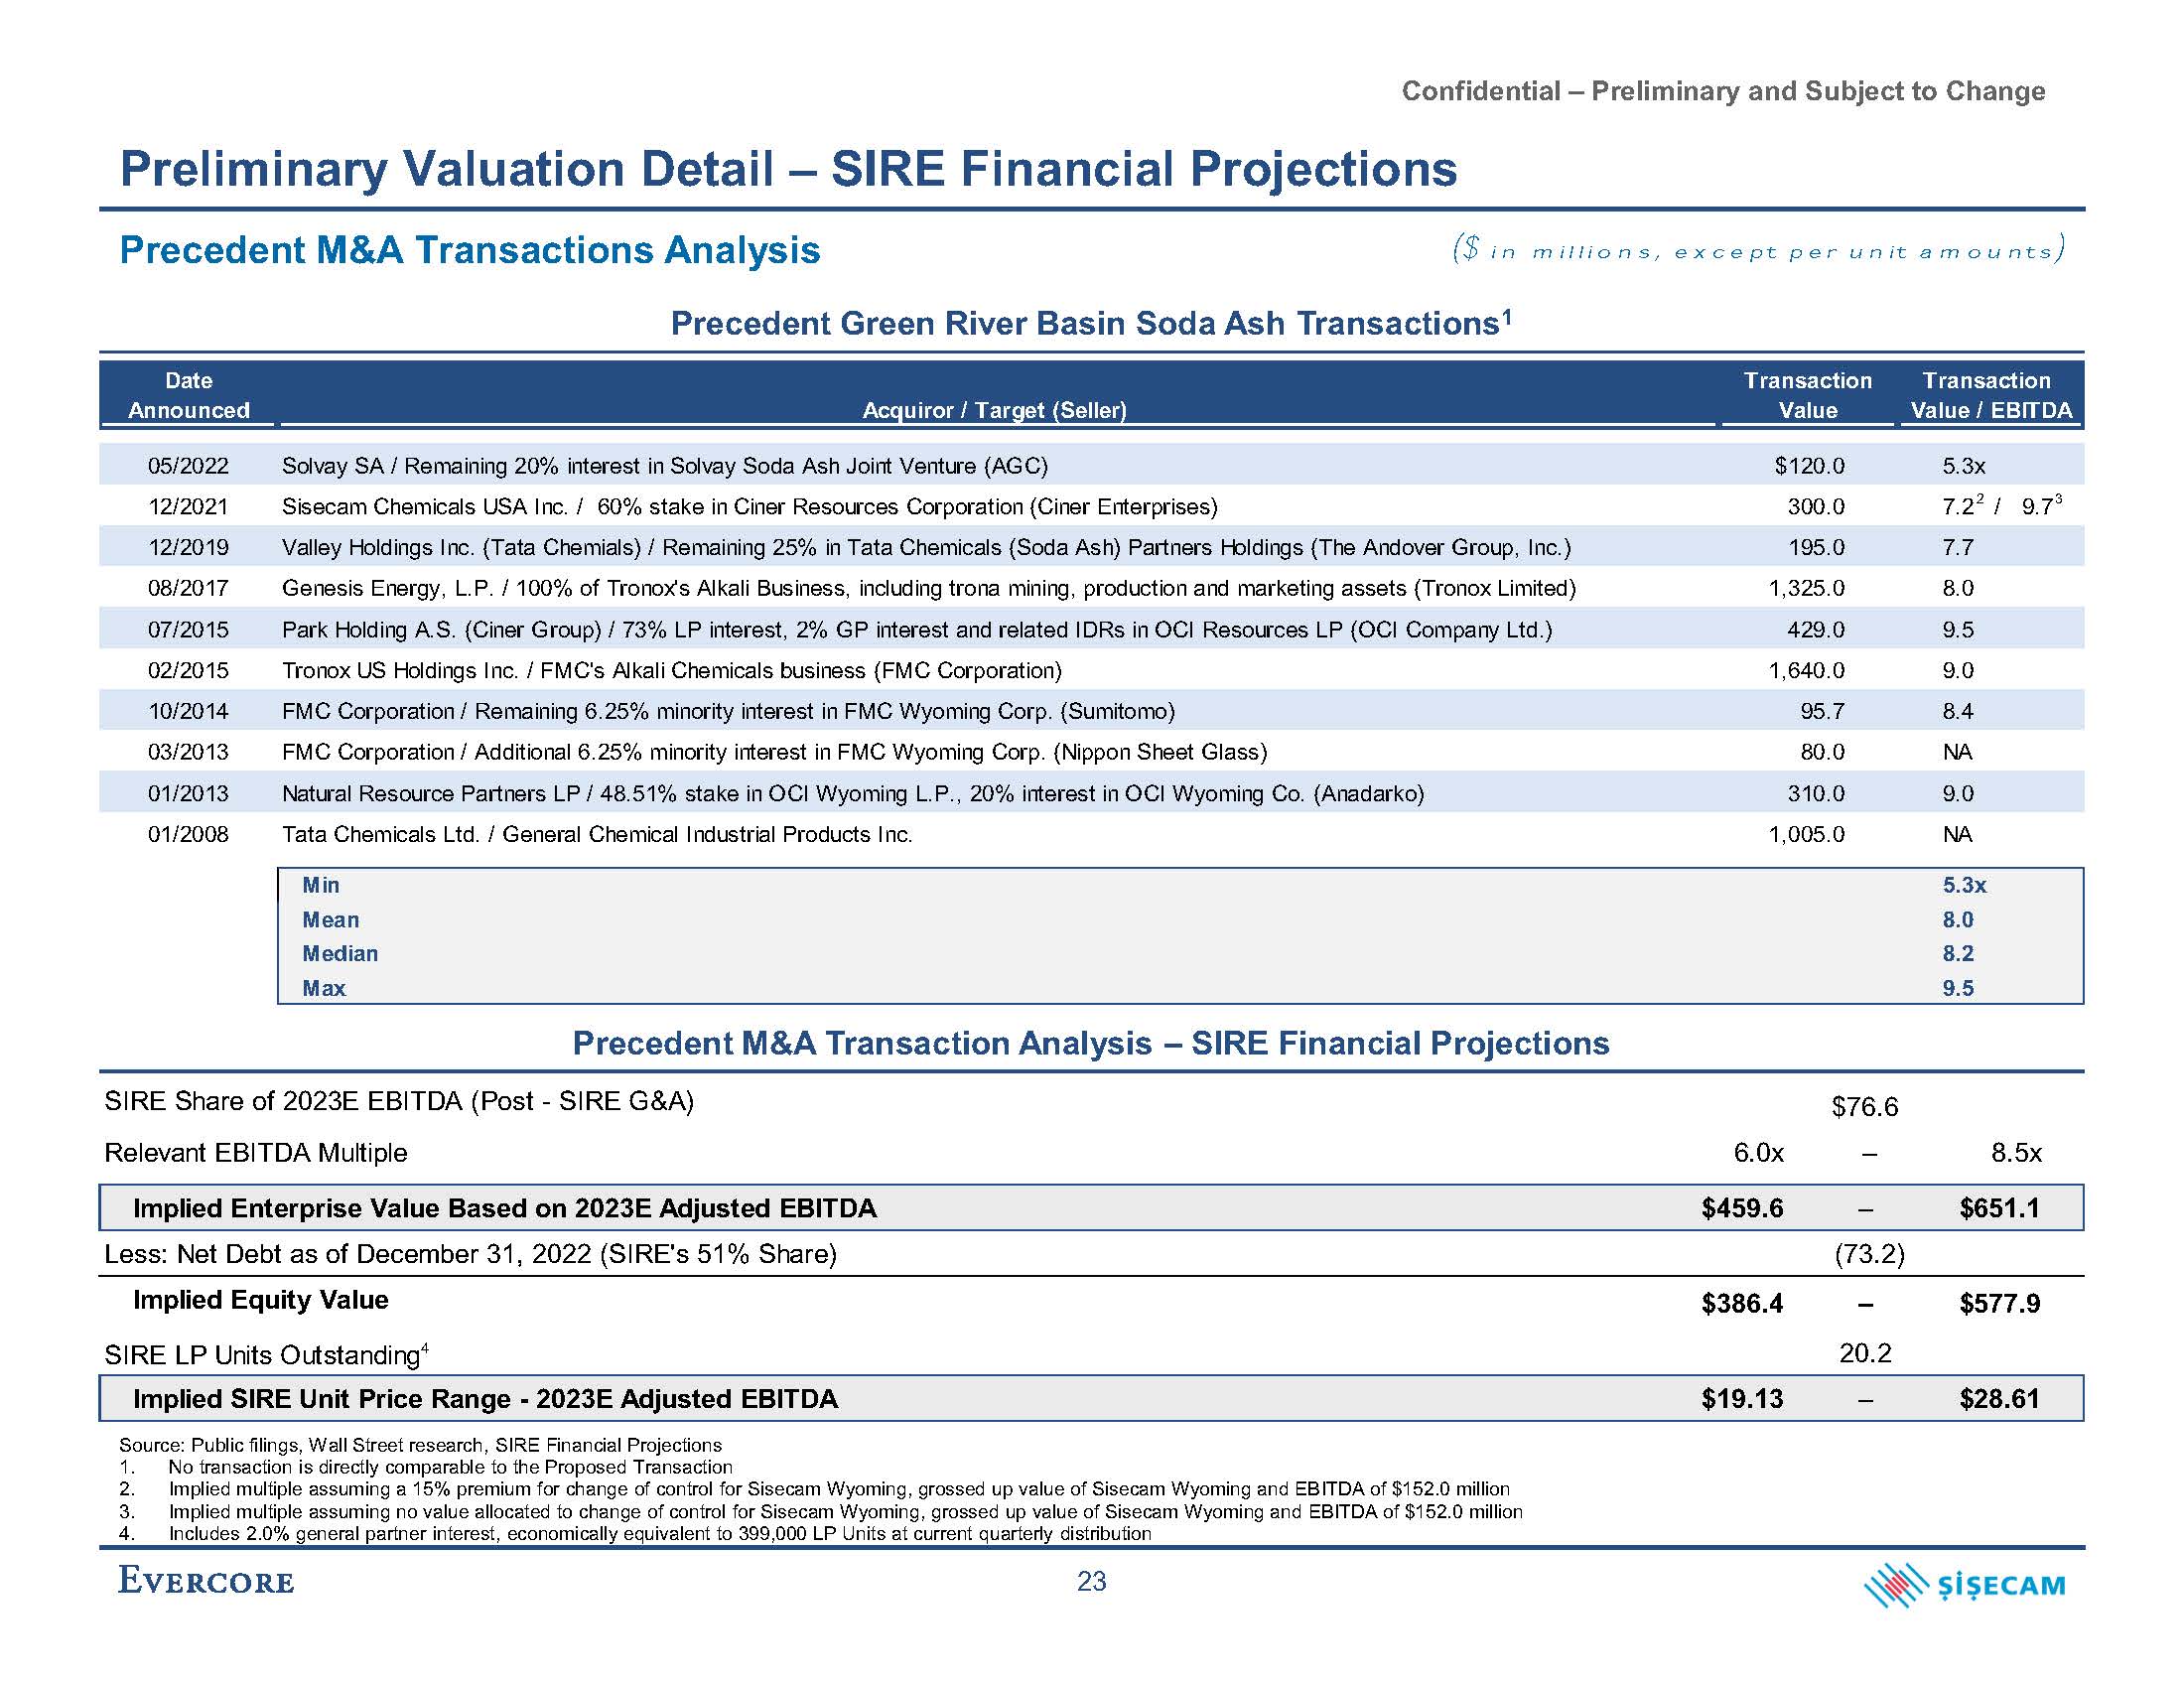
Confidential – Preliminary and Subject to Change Precedent Green River Basin Soda Ash Transactions1 Date Announced Acquiror / Target (Seller) Transaction Value Transaction Value / EBITDA 05/2022 Solvay SA / Remaining 20% interest in Solvay Soda Ash Joint Venture (AGC) $120.0 5.3x 12/2021 Sisecam Chemicals USA Inc. / 60% stake in Ciner Resources Corporation (Ciner Enterprises) 300.0 7.2 2 / 9.73 12/2019 Valley Holdings Inc. (Tata Chemials) / Remaining 25% in Tata Chemicals (Soda Ash) Partners Holdings (The Andover Group, Inc.) 195.0 7.7 08/2017 Genesis Energy, L.P. / 100% of Tronox's Alkali Business, including trona mining, production and marketing assets (Tronox Limited) 1,325.0 8.0 07/2015 Park Holding A.S. (Ciner Group) / 73% LP interest, 2% GP interest and related IDRs in OCI Resources LP (OCI Company Ltd.) 429.0 9.5 02/2015 Tronox US Holdings Inc. / FMC's Alkali Chemicals business (FMC Corporation) 1,640.0 9.0 10/2014 FMC Corporation / Remaining 6.25% minority interest in FMC Wyoming Corp. (Sumitomo) 95.7 8.4 03/2013 FMC Corporation / Additional 6.25% minority interest in FMC Wyoming Corp. (Nippon Sheet Glass) 80.0 NA 01/2013 Natural Resource Partners LP / 48.51% stake in OCI Wyoming L.P., 20% interest in OCI Wyoming Co. (Anadarko) 310.0 9.0 01/2008 Tata Chemicals Ltd. / General Chemical Industrial Products Inc. 1,005.0 NA Min 5.3x Mean 8.0 Median 8.2 Max 9.5 Precedent M&A Transaction Analysis – SIRE Financial Projections SIRE Share of 2023E EBITDA (Post - SIRE G&A) $76.6 Relevant EBITDA Multiple 6.0x – 8.5x Implied Enterprise Value Based on 2023E Adjusted EBITDA $459.6 – $651.1 Less: Net Debt as of December 31, 2022 (SIRE's 51% Share) (73.2) Implied Equity Value $386.4 – $577.9 SIRE LP Units Outstanding4 20.2 Implied SIRE Unit Price Range - 2023E Adjusted EBITDA $19.13 – $28.61 4. Includes 2.0% general partner interest, economically equivalent to 399,000 LP Units at current quarterly distribution 23 Source: Public filings, Wall Street research, SIRE Financial Projections No transaction is directly comparable to the Proposed Transaction Implied multiple assuming a 15% premium for change of control for Sisecam Wyoming, grossed up value of Sisecam Wyoming and EBITDA of $152.0 million Implied multiple assuming no value allocated to change of control for Sisecam Wyoming, grossed up value of Sisecam Wyoming and EBITDA of $152.0 million Preliminary Valuation Detail – SIRE Financial Projections Precedent M&A Transactions Analysis ($ in millions, except per unit amounts)
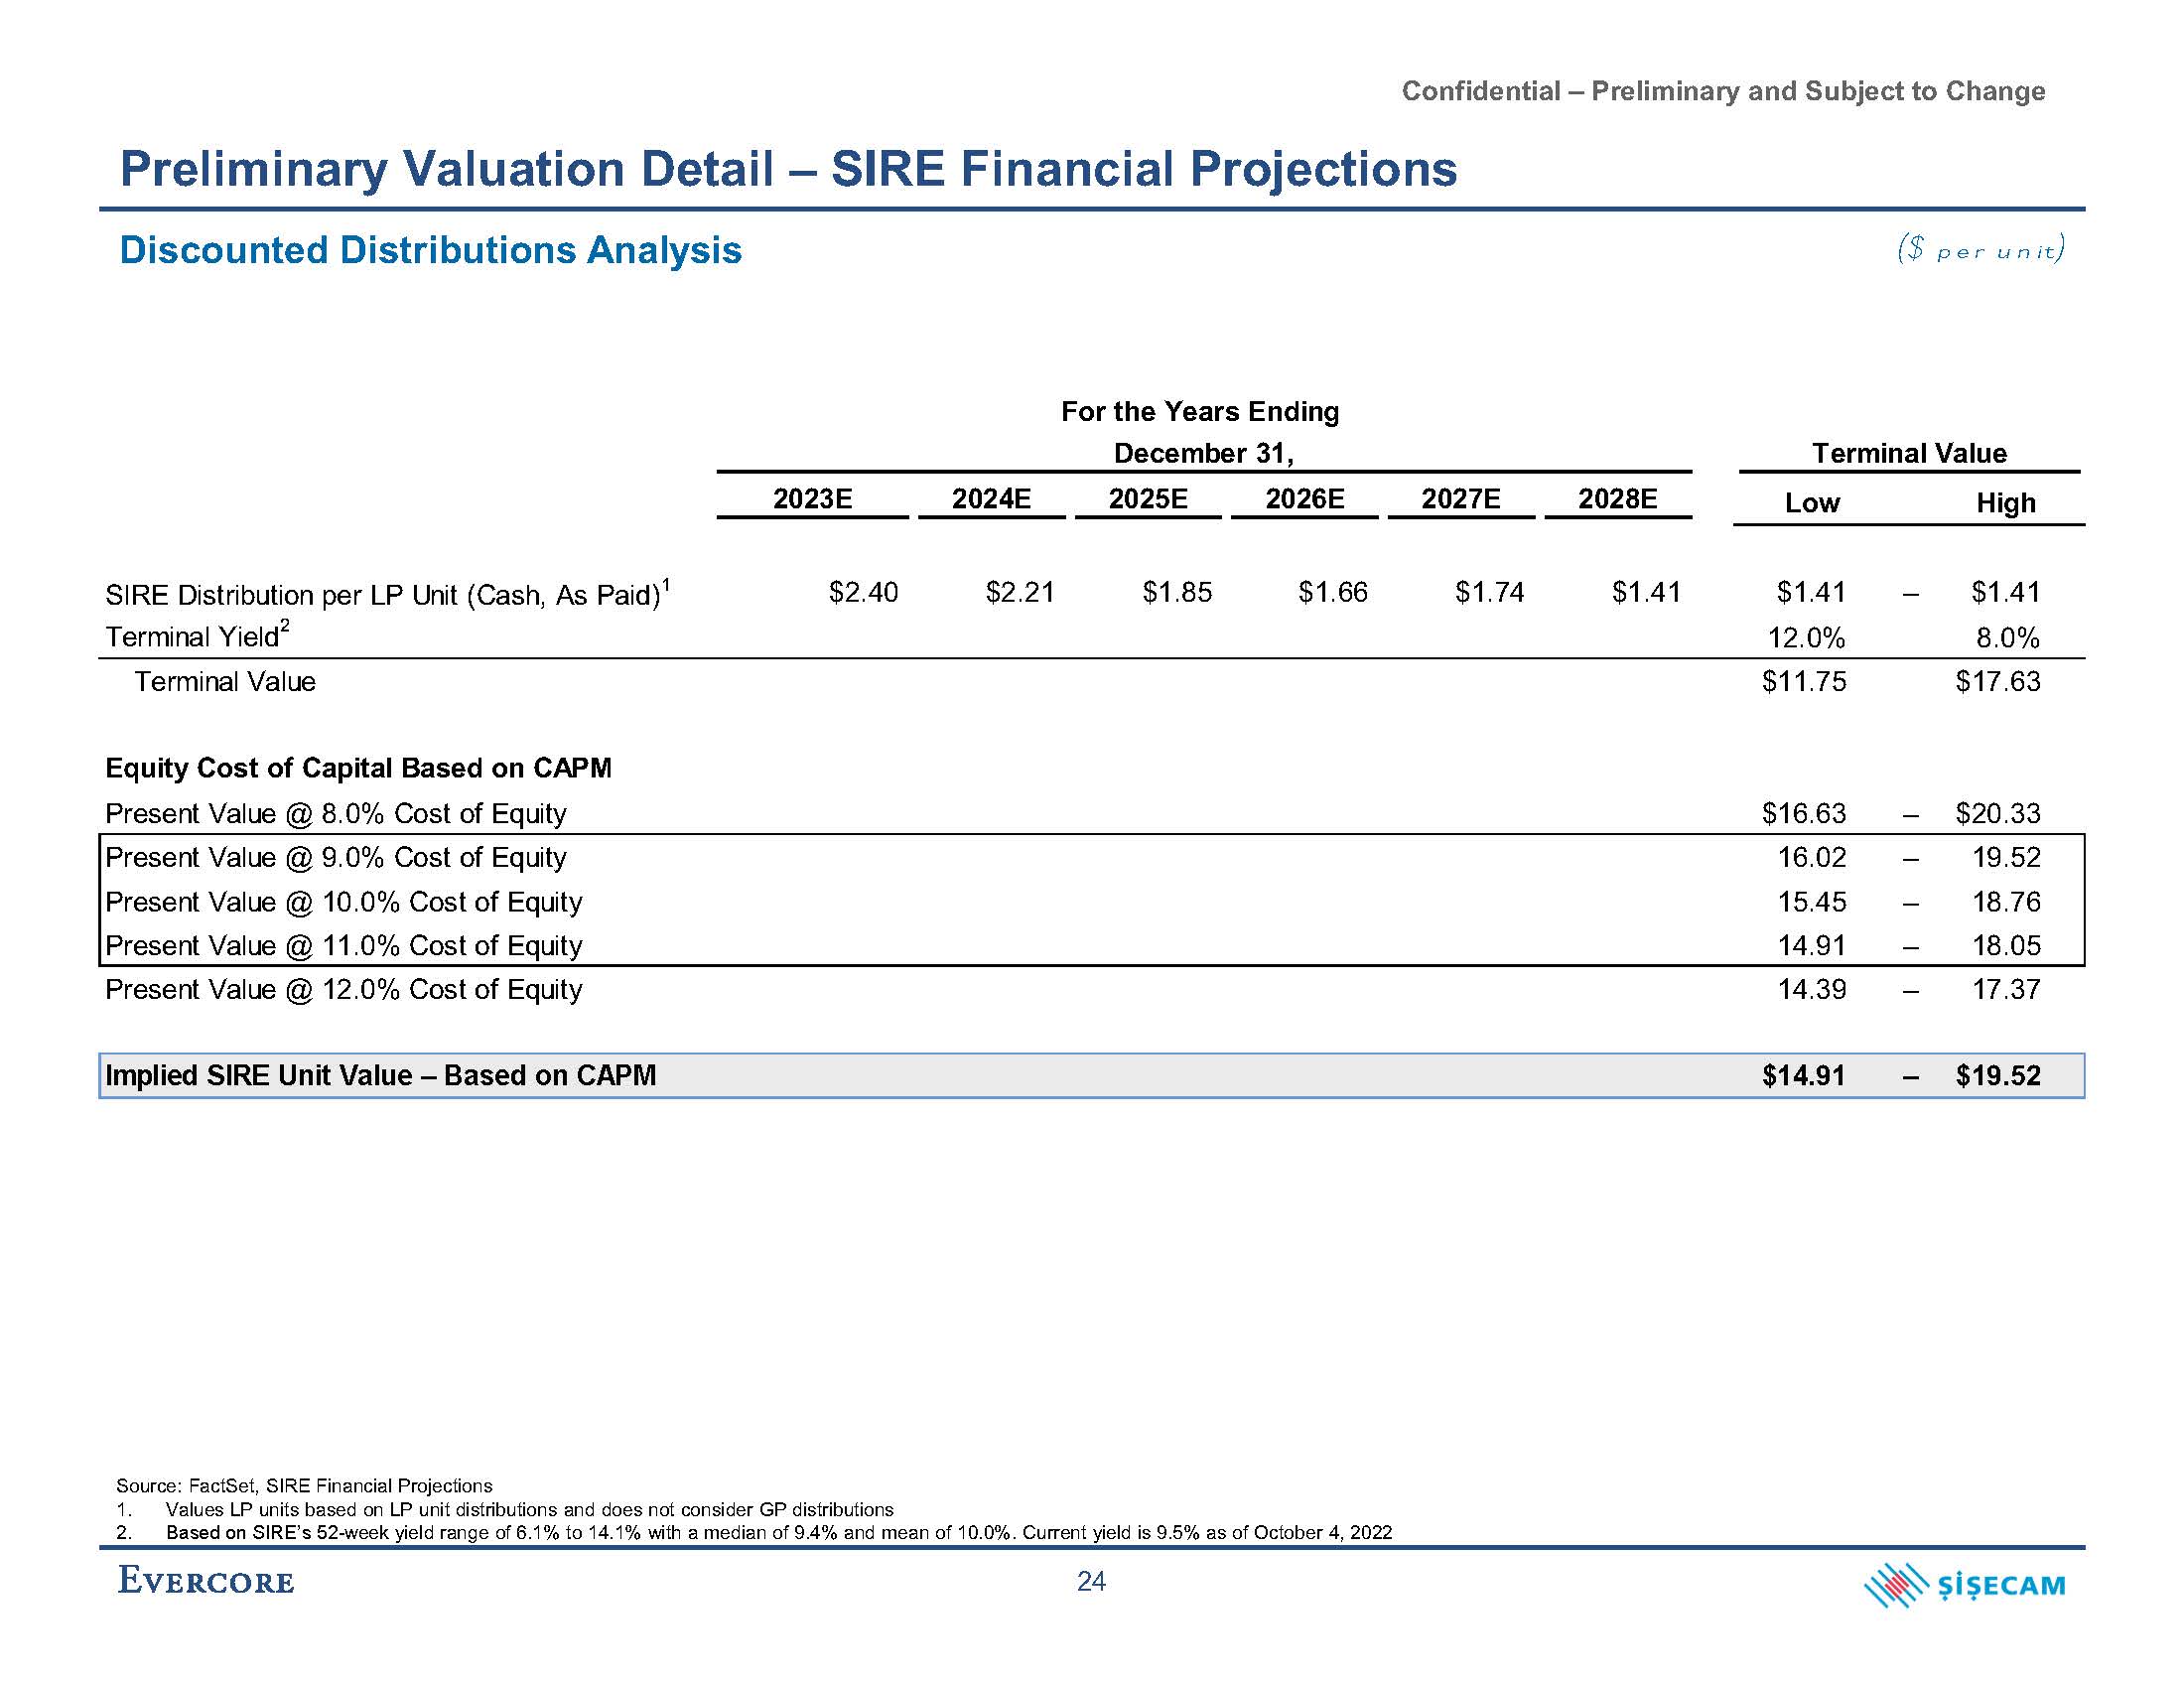
Confidential – Preliminary and Subject to Change Preliminary Valuation Detail – SIRE Financial Projections Discounted Distributions Analysis SIRE Distribution per LP Unit (Cash, As Paid)1 $2.40 $2.21 $1.85 $1.66 $1.74 $1.41 $1.41 – $1.41 Terminal Yield2 12.0% 8.0% Terminal Value $11.75 $17.63 Equity Cost of Capital Based on CAPM Present Value @ 8.0% Cost of Equity $16.63 – $20.33 Present Value @ 9.0% Cost of Equity 16.02 – 19.52 Present Value @ 10.0% Cost of Equity 15.45 – 18.76 Present Value @ 11.0% Cost of Equity 14.91 – 18.05 Present Value @ 12.0% Cost of Equity 14.39 – 17.37 Implied SIRE Unit Value – Based on CAPM $14.91 – $19.52 For the Years Ending December 31, 2023E 2024E 2025E 2026E 2027E 2028E Terminal Value Low High ($ per unit) 2. Based on SIRE’s 52-week yield range of 6.1% to 14.1% with a median of 9.4% and mean of 10.0%. Current yield is 9.5% as of October 4, 2022 24 Source: FactSet, SIRE Financial Projections 1. Values LP units based on LP unit distributions and does not consider GP distributions
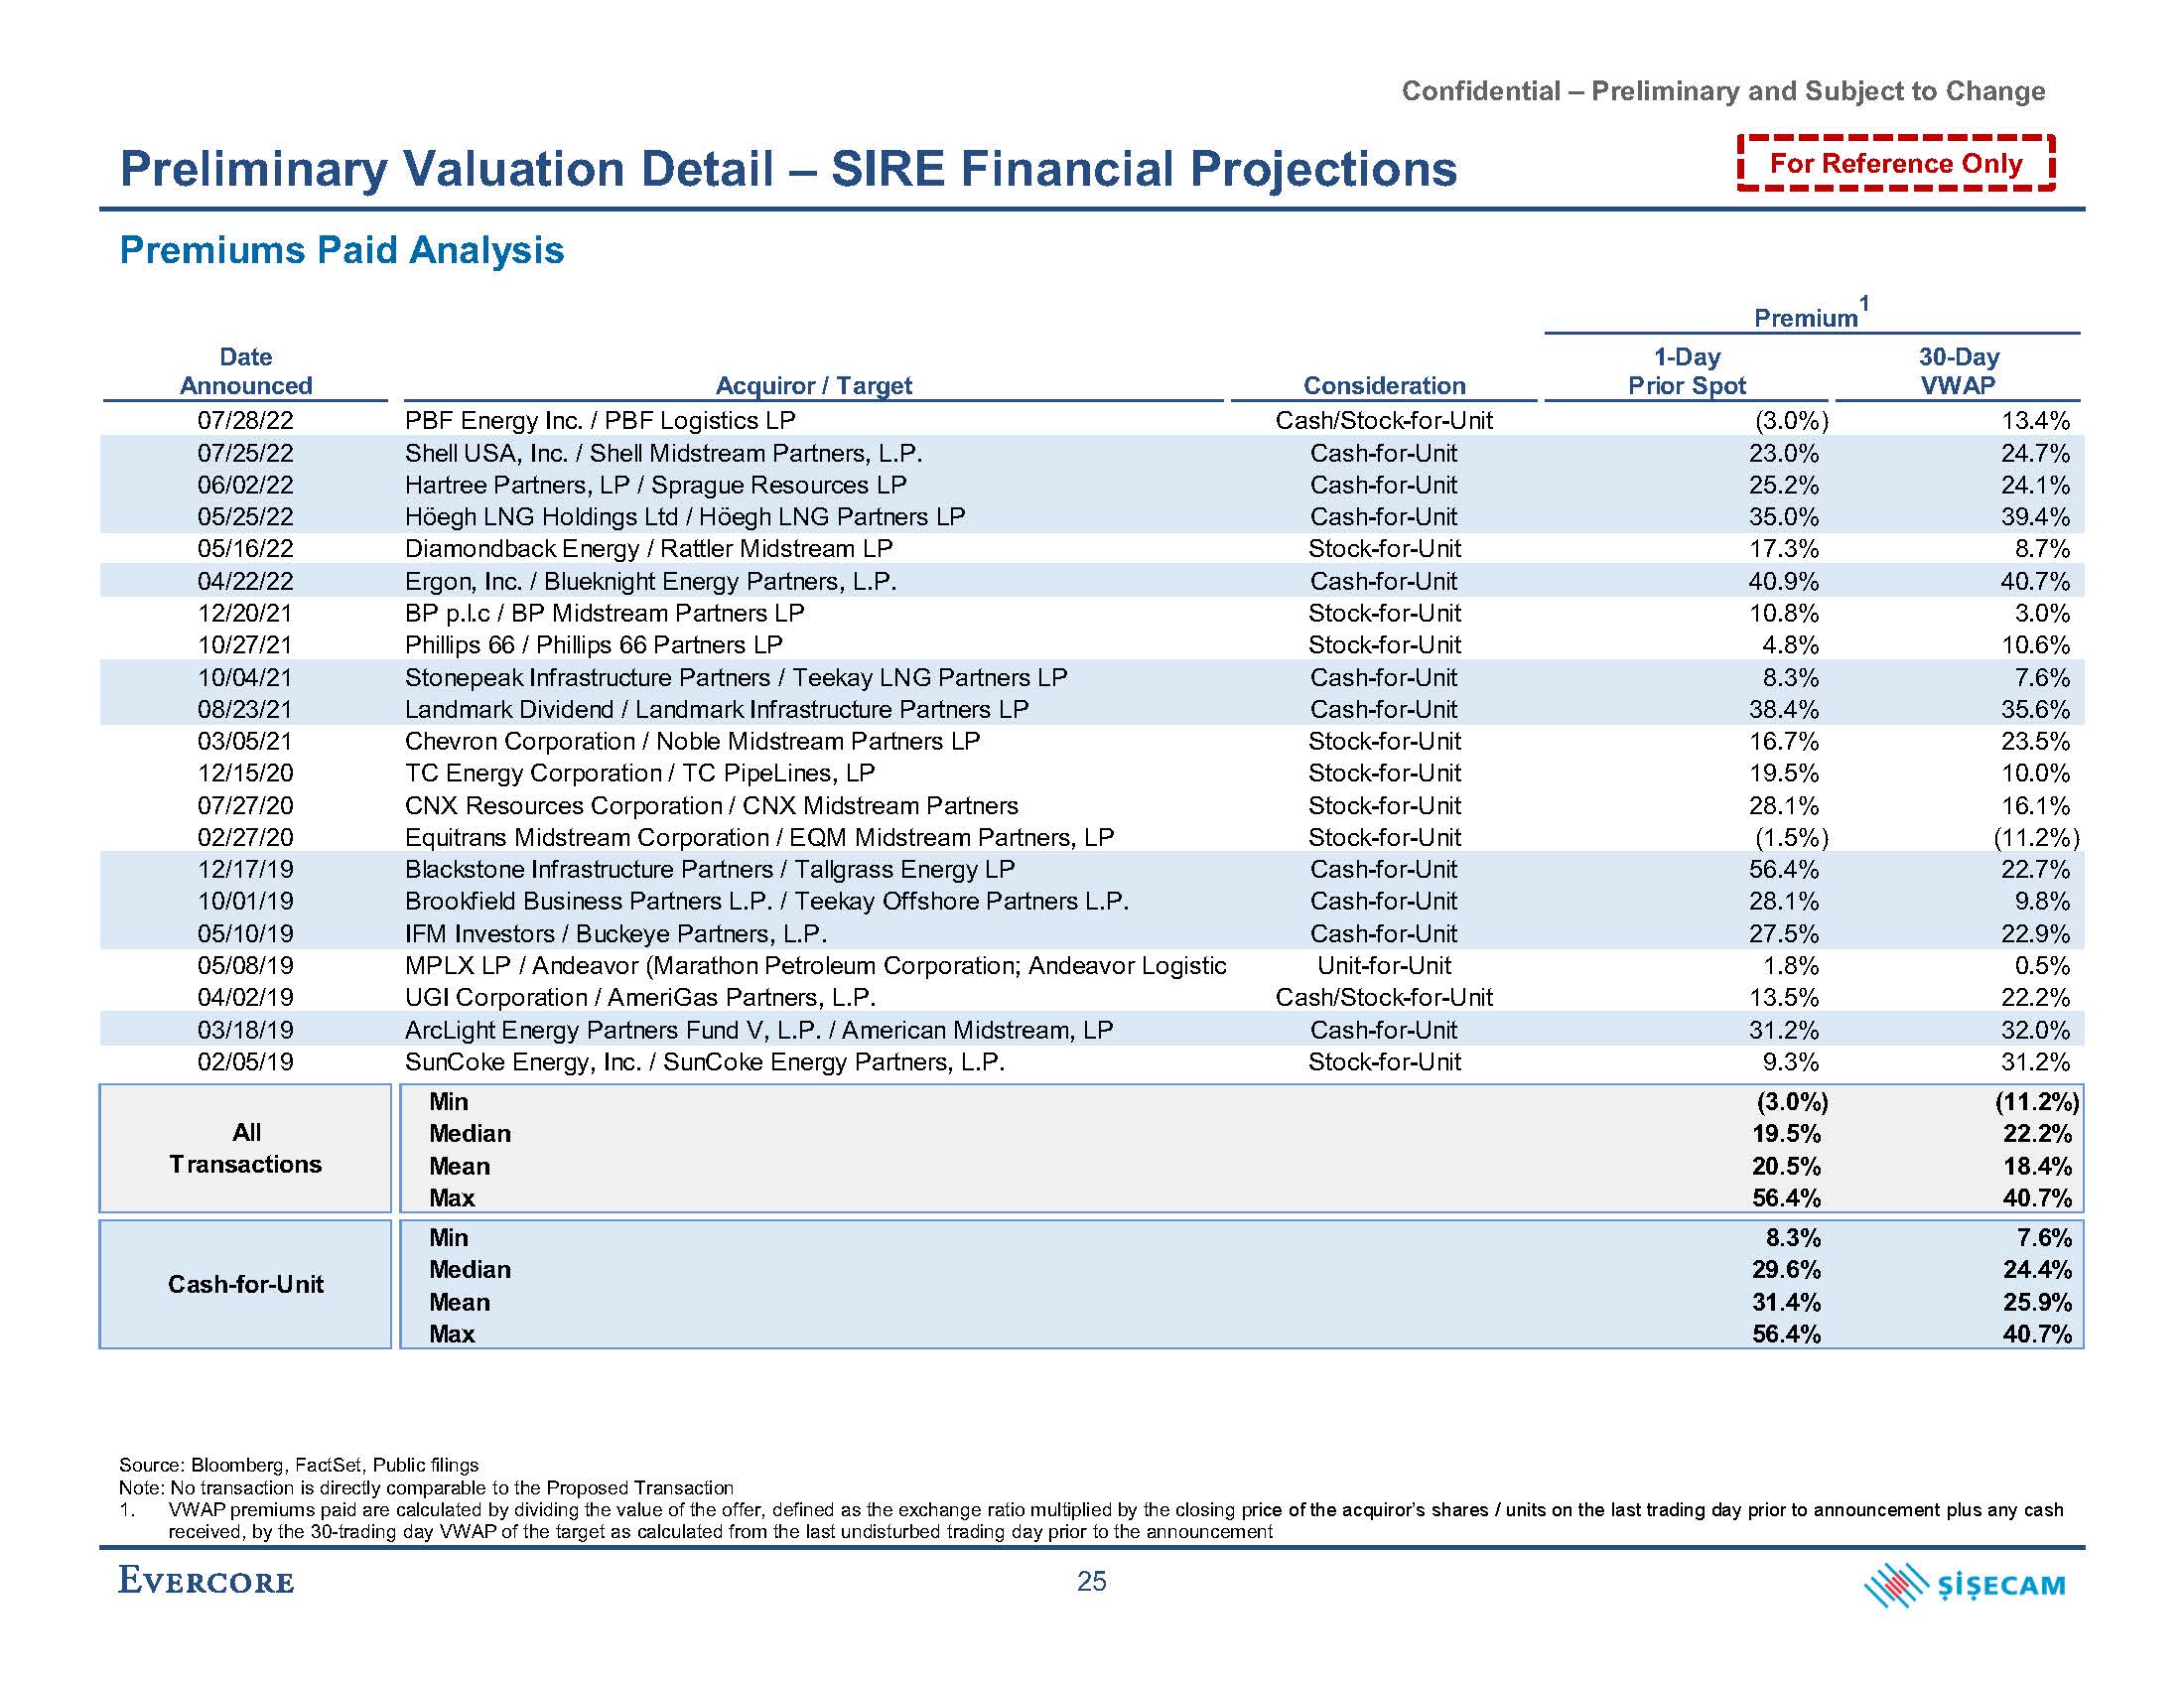
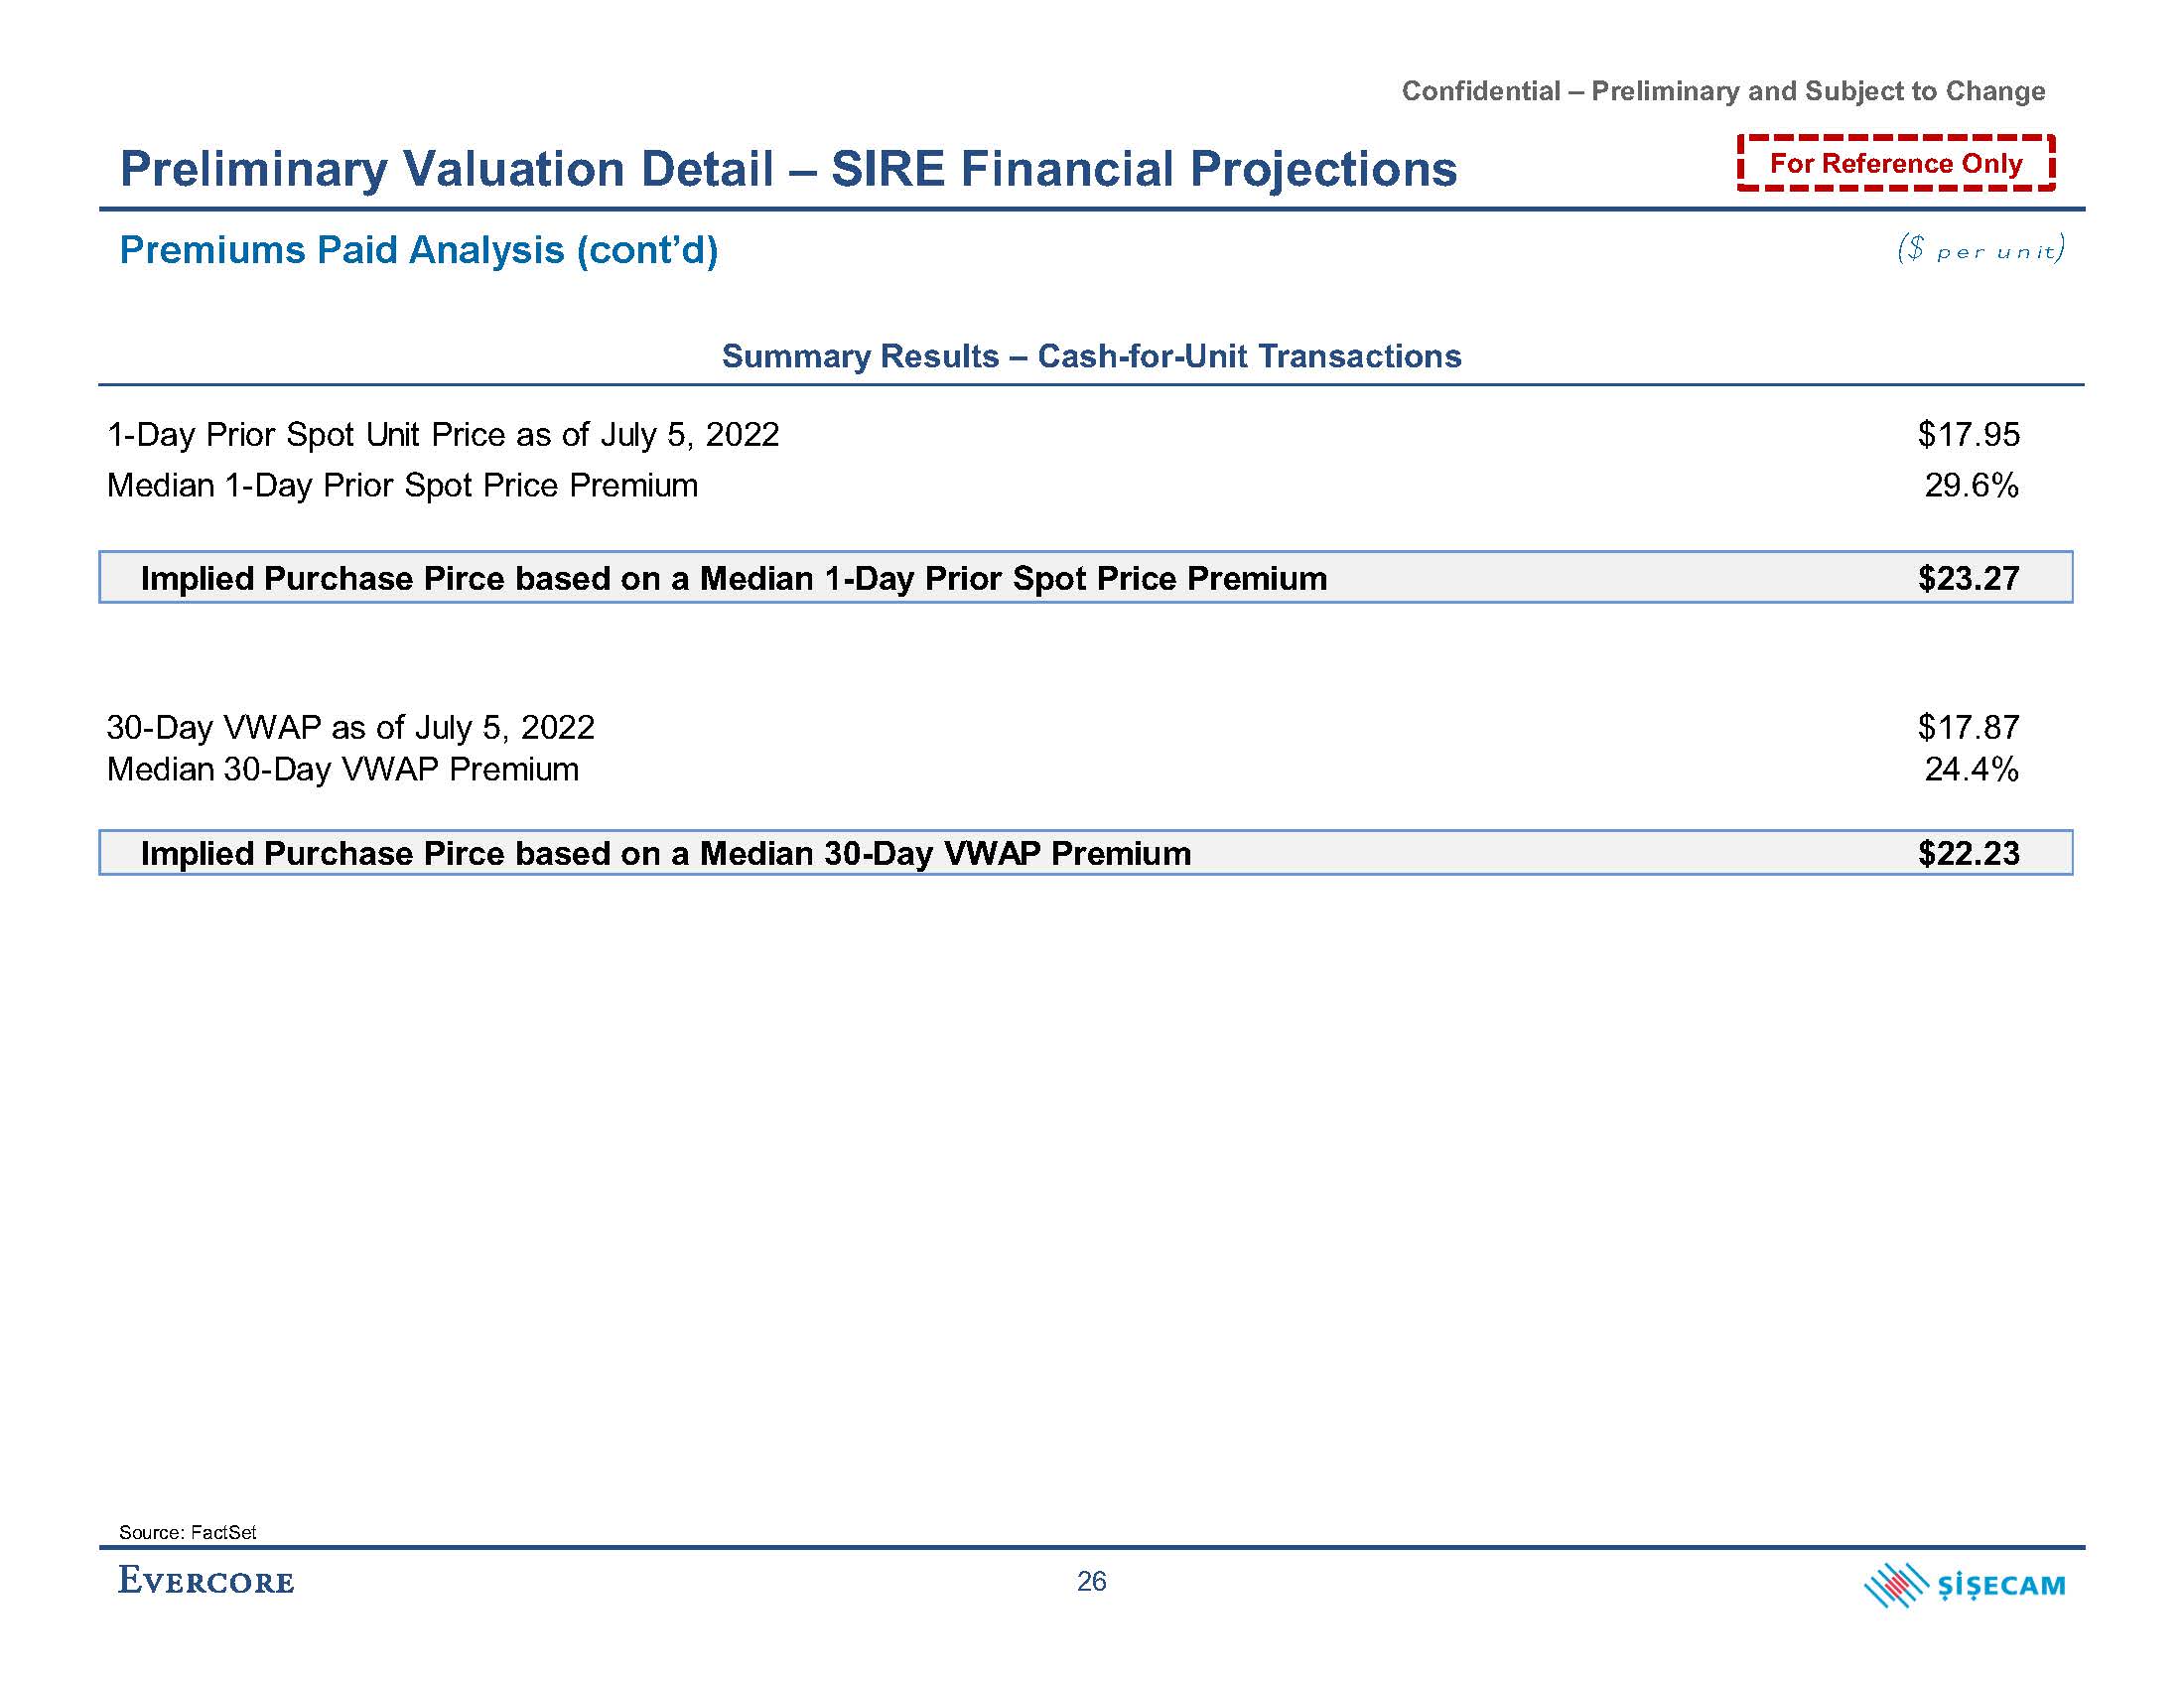
Confidential – Preliminary and Subject to Change Premiums Paid Analysis 1 Premium Date Announced Acquiror / Target Consideration 1-Day Prior Spot 30-Day VWAP 07/28/22 PBF Energy Inc. / PBF Logistics LP Cash/Stock-for-Unit (3.0%) 13.4% 07/25/22 Shell USA, Inc. / Shell Midstream Partners, L.P. Cash-for-Unit 23.0% 24.7% 06/02/22 Hartree Partners, LP / Sprague Resources LP Cash-for-Unit 25.2% 24.1% 05/25/22 Höegh LNG Holdings Ltd / Höegh LNG Partners LP Cash-for-Unit 35.0% 39.4% 05/16/22 Diamondback Energy / Rattler Midstream LP Stock-for-Unit 17.3% 8.7% 04/22/22 Ergon, Inc. / Blueknight Energy Partners, L.P. Cash-for-Unit 40.9% 40.7% 12/20/21 BP p.l.c / BP Midstream Partners LP Stock-for-Unit 10.8% 3.0% 10/27/21 Phillips 66 / Phillips 66 Partners LP Stock-for-Unit 4.8% 10.6% 10/04/21 Stonepeak Infrastructure Partners / Teekay LNG Partners LP Cash-for-Unit 8.3% 7.6% 08/23/21 Landmark Dividend / Landmark Infrastructure Partners LP Cash-for-Unit 38.4% 35.6% 03/05/21 Chevron Corporation / Noble Midstream Partners LP Stock-for-Unit 16.7% 23.5% 12/15/20 TC Energy Corporation / TC PipeLines, LP Stock-for-Unit 19.5% 10.0% 07/27/20 CNX Resources Corporation / CNX Midstream Partners Stock-for-Unit 28.1% 16.1% 02/27/20 Equitrans Midstream Corporation / EQM Midstream Partners, LP Stock-for-Unit (1.5%) (11.2%) 12/17/19 Blackstone Infrastructure Partners / Tallgrass Energy LP Cash-for-Unit 56.4% 22.7% 10/01/19 Brookfield Business Partners L.P. / Teekay Offshore Partners L.P. Cash-for-Unit 28.1% 9.8% 05/10/19 IFM Investors / Buckeye Partners, L.P. Cash-for-Unit 27.5% 22.9% 05/08/19 MPLX LP / Andeavor (Marathon Petroleum Corporation; Andeavor Logistic Unit-for-Unit 1.8% 0.5% 04/02/19 UGI Corporation / AmeriGas Partners, L.P. Cash/Stock-for-Unit 13.5% 22.2% 03/18/19 ArcLight Energy Partners Fund V, L.P. / American Midstream, LP Cash-for-Unit 31.2% 32.0% 02/05/19 SunCoke Energy, Inc. / SunCoke Energy Partners, L.P. Stock-for-Unit 9.3% 31.2% Preliminary Valuation Detail – SIRE Financial Projections received, by the 30-trading day VWAP of the target as calculated from the last undisturbed trading day prior to the announcement 25 For Reference Only Source: Bloomberg, FactSet, Public filings Note: No transaction is directly comparable to the Proposed Transaction 1. VWAP premiums paid are calculated by dividing the value of the offer, defined as the exchange ratio multiplied by the closing price of the acquiror’s shares / units on the last trading day prior to announcement plus any cash Min (3.0%) (11.2%) All Median 19.5% 22.2% Transactions Mean 20.5% 18.4% Max 56.4% 40.7% Min 8.3% 7.6% Cash-for-Unit Median Mean 29.6% 31.4% 24.4% 25.9% Max 56.4% 40.7%
Confidential – Preliminary and Subject to Change Preliminary Valuation Detail – SIRE Financial Projections Premiums Paid Analysis (cont’d) Summary Results – Cash-for-Unit Transactions Source: FactSet 26 For Reference Only ($ per unit)
Confidential – Preliminary and Subject to Change C. Financial Projections and Preliminary Valuation Detail – Sensitivity Case #1
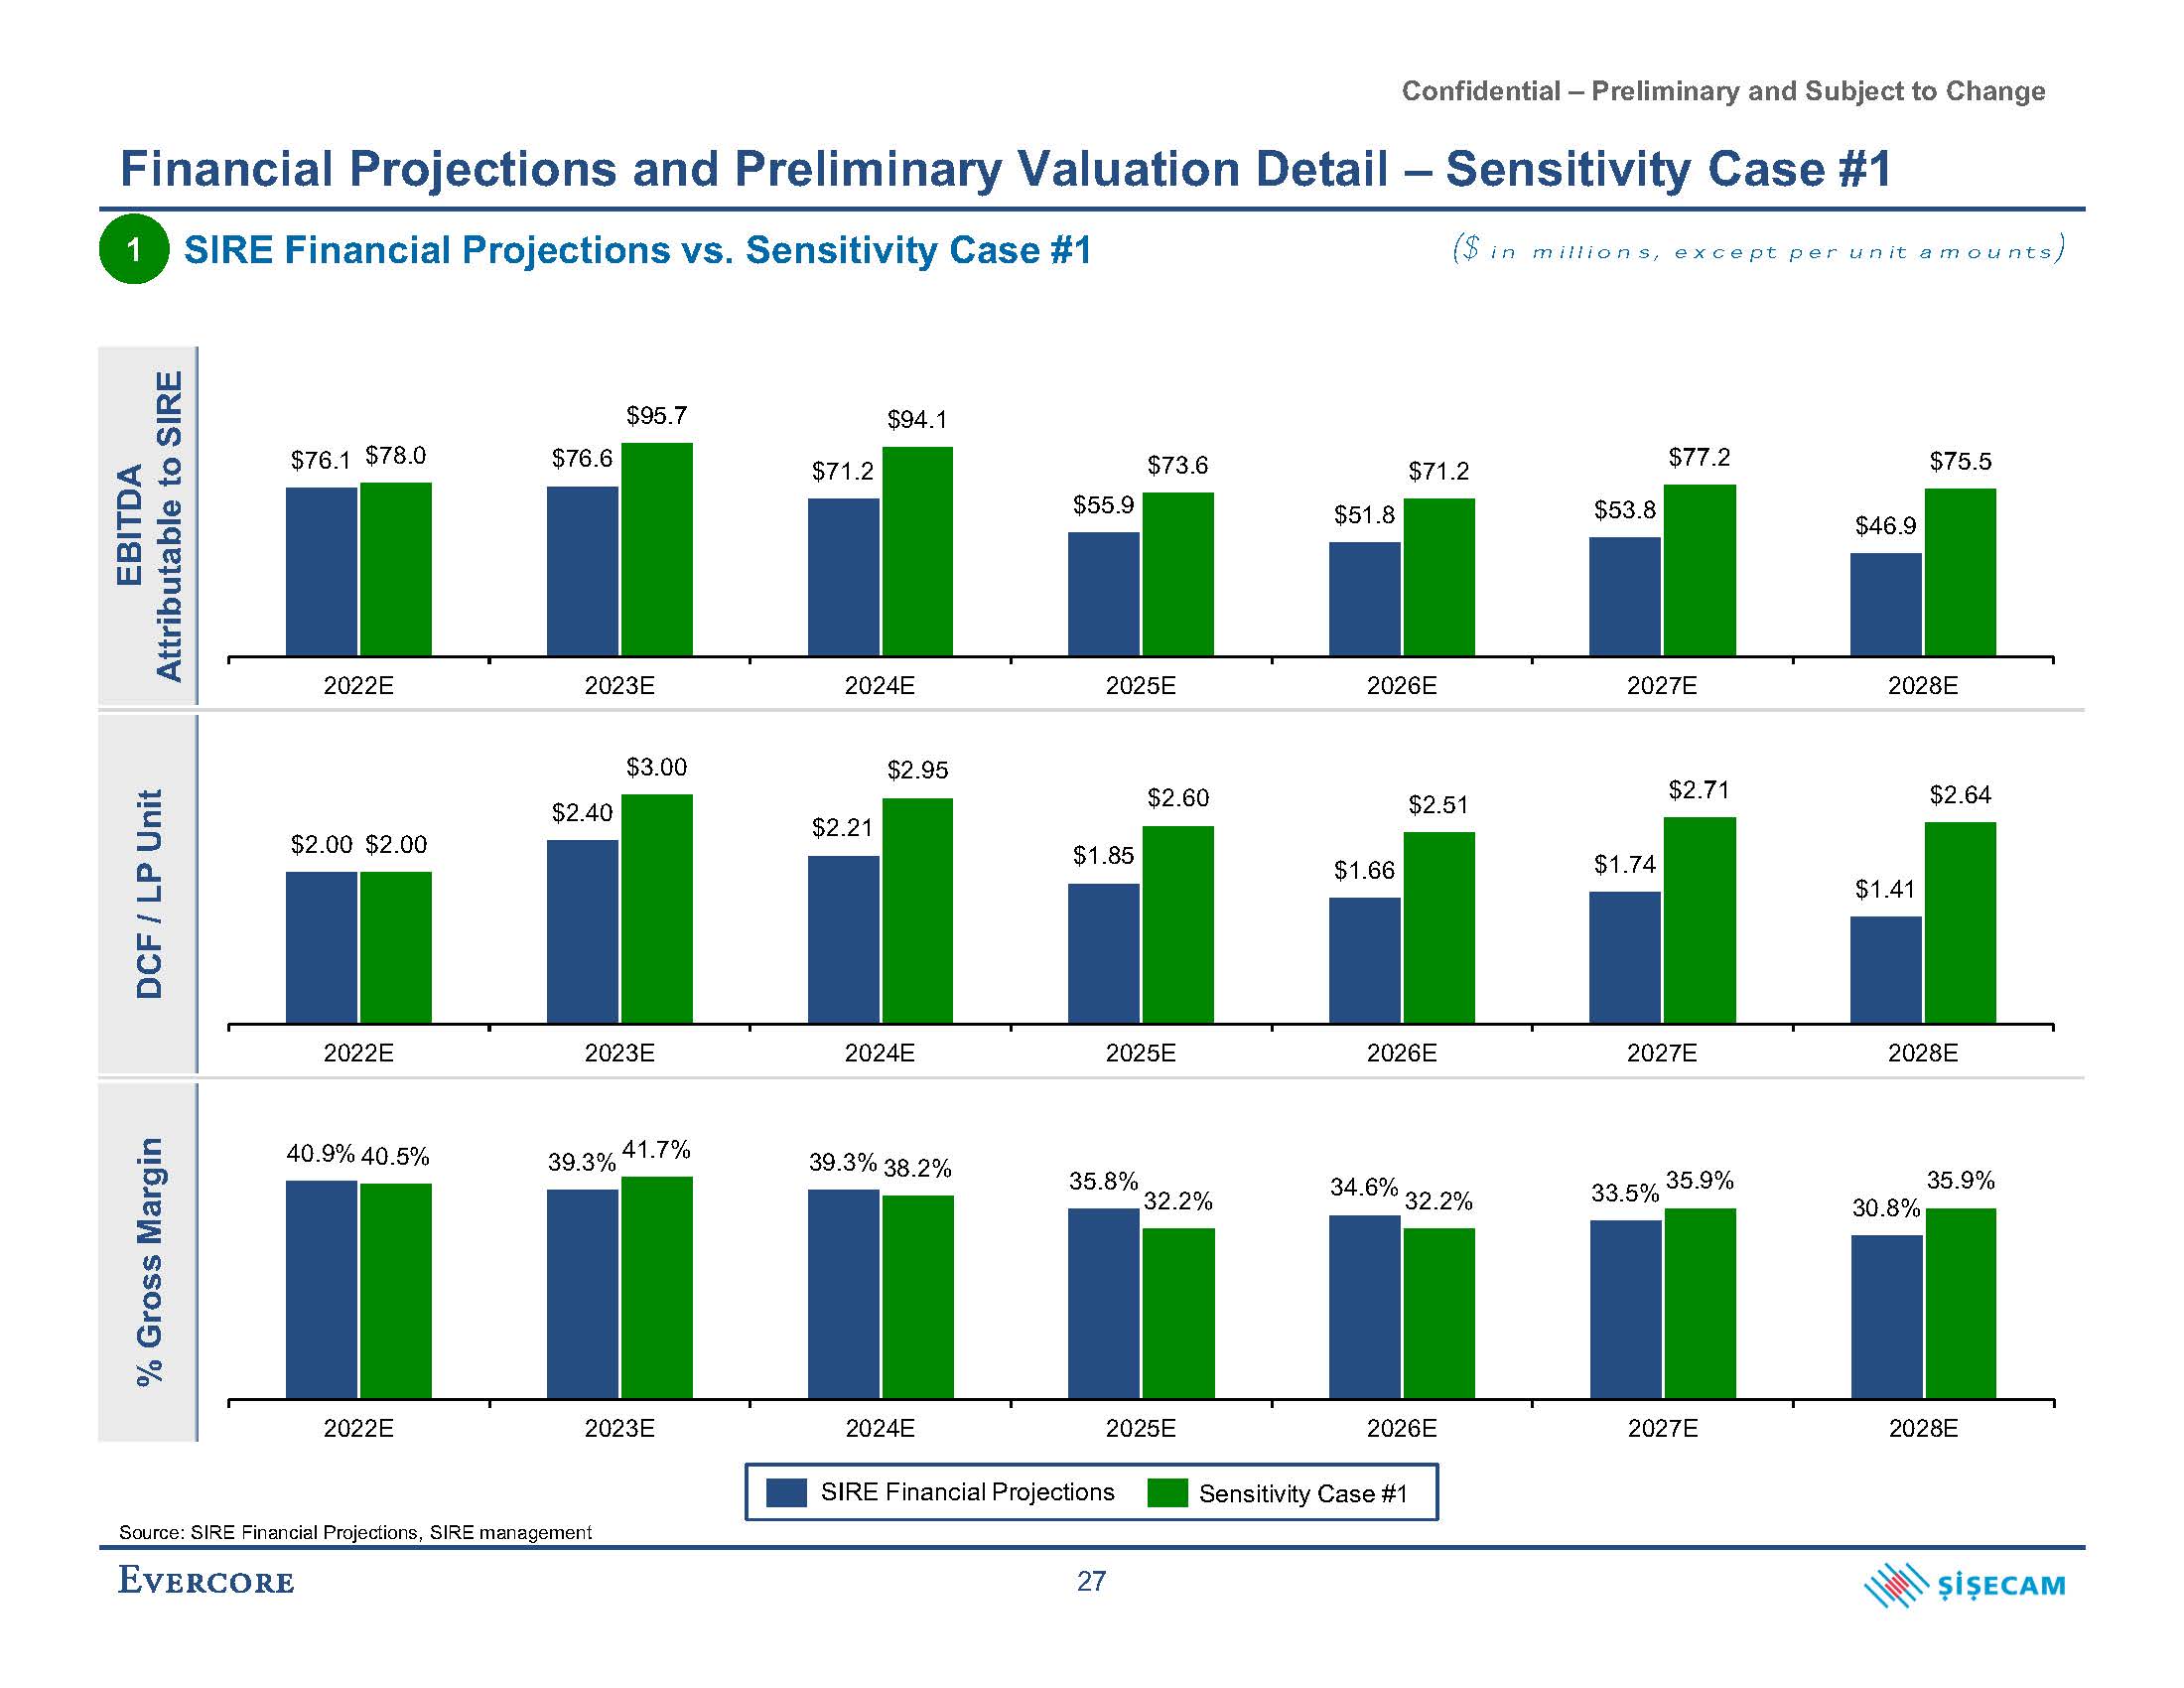
Confidential – Preliminary and Subject to Change 30.8% 40.9% 40.5% 39.3% 41.7% 39.3% 38.2% 35.8% 32.2% 34.6% 32.2% 33.5% 35.9% 35.9% 2022E 2023E 2024E 2025E 2026E 2027E 2028E $2.40 $2.21 $1.85 $1.66 $1.74 $1.41 $2.00 $2.00 $3.00 $2.95 $2.60 $2.51 $2.71 $2.64 2022E 2023E 2024E 2025E 2026E 2027E 2028E $76.6 $71.2 $55.9 $51.8 $53.8 $46.9 $76.1 $78.0 $95.7 $94.1 $73.6 $71.2 $77.2 $75.5 2022E 2023E 2024E 2025E 2026E 2027E 2028E Financial Projections and Preliminary Valuation Detail – Sensitivity Case #1 SIRE Financial Projections vs. Sensitivity Case #1 SIRE Financial Projections Sensitivity Case #1 EBITDA Attributable to SIRE DCF / LP Unit % Gross Margin 1 Source: SIRE Financial Projections, SIRE management 27 ($ in millions, except per unit amounts)
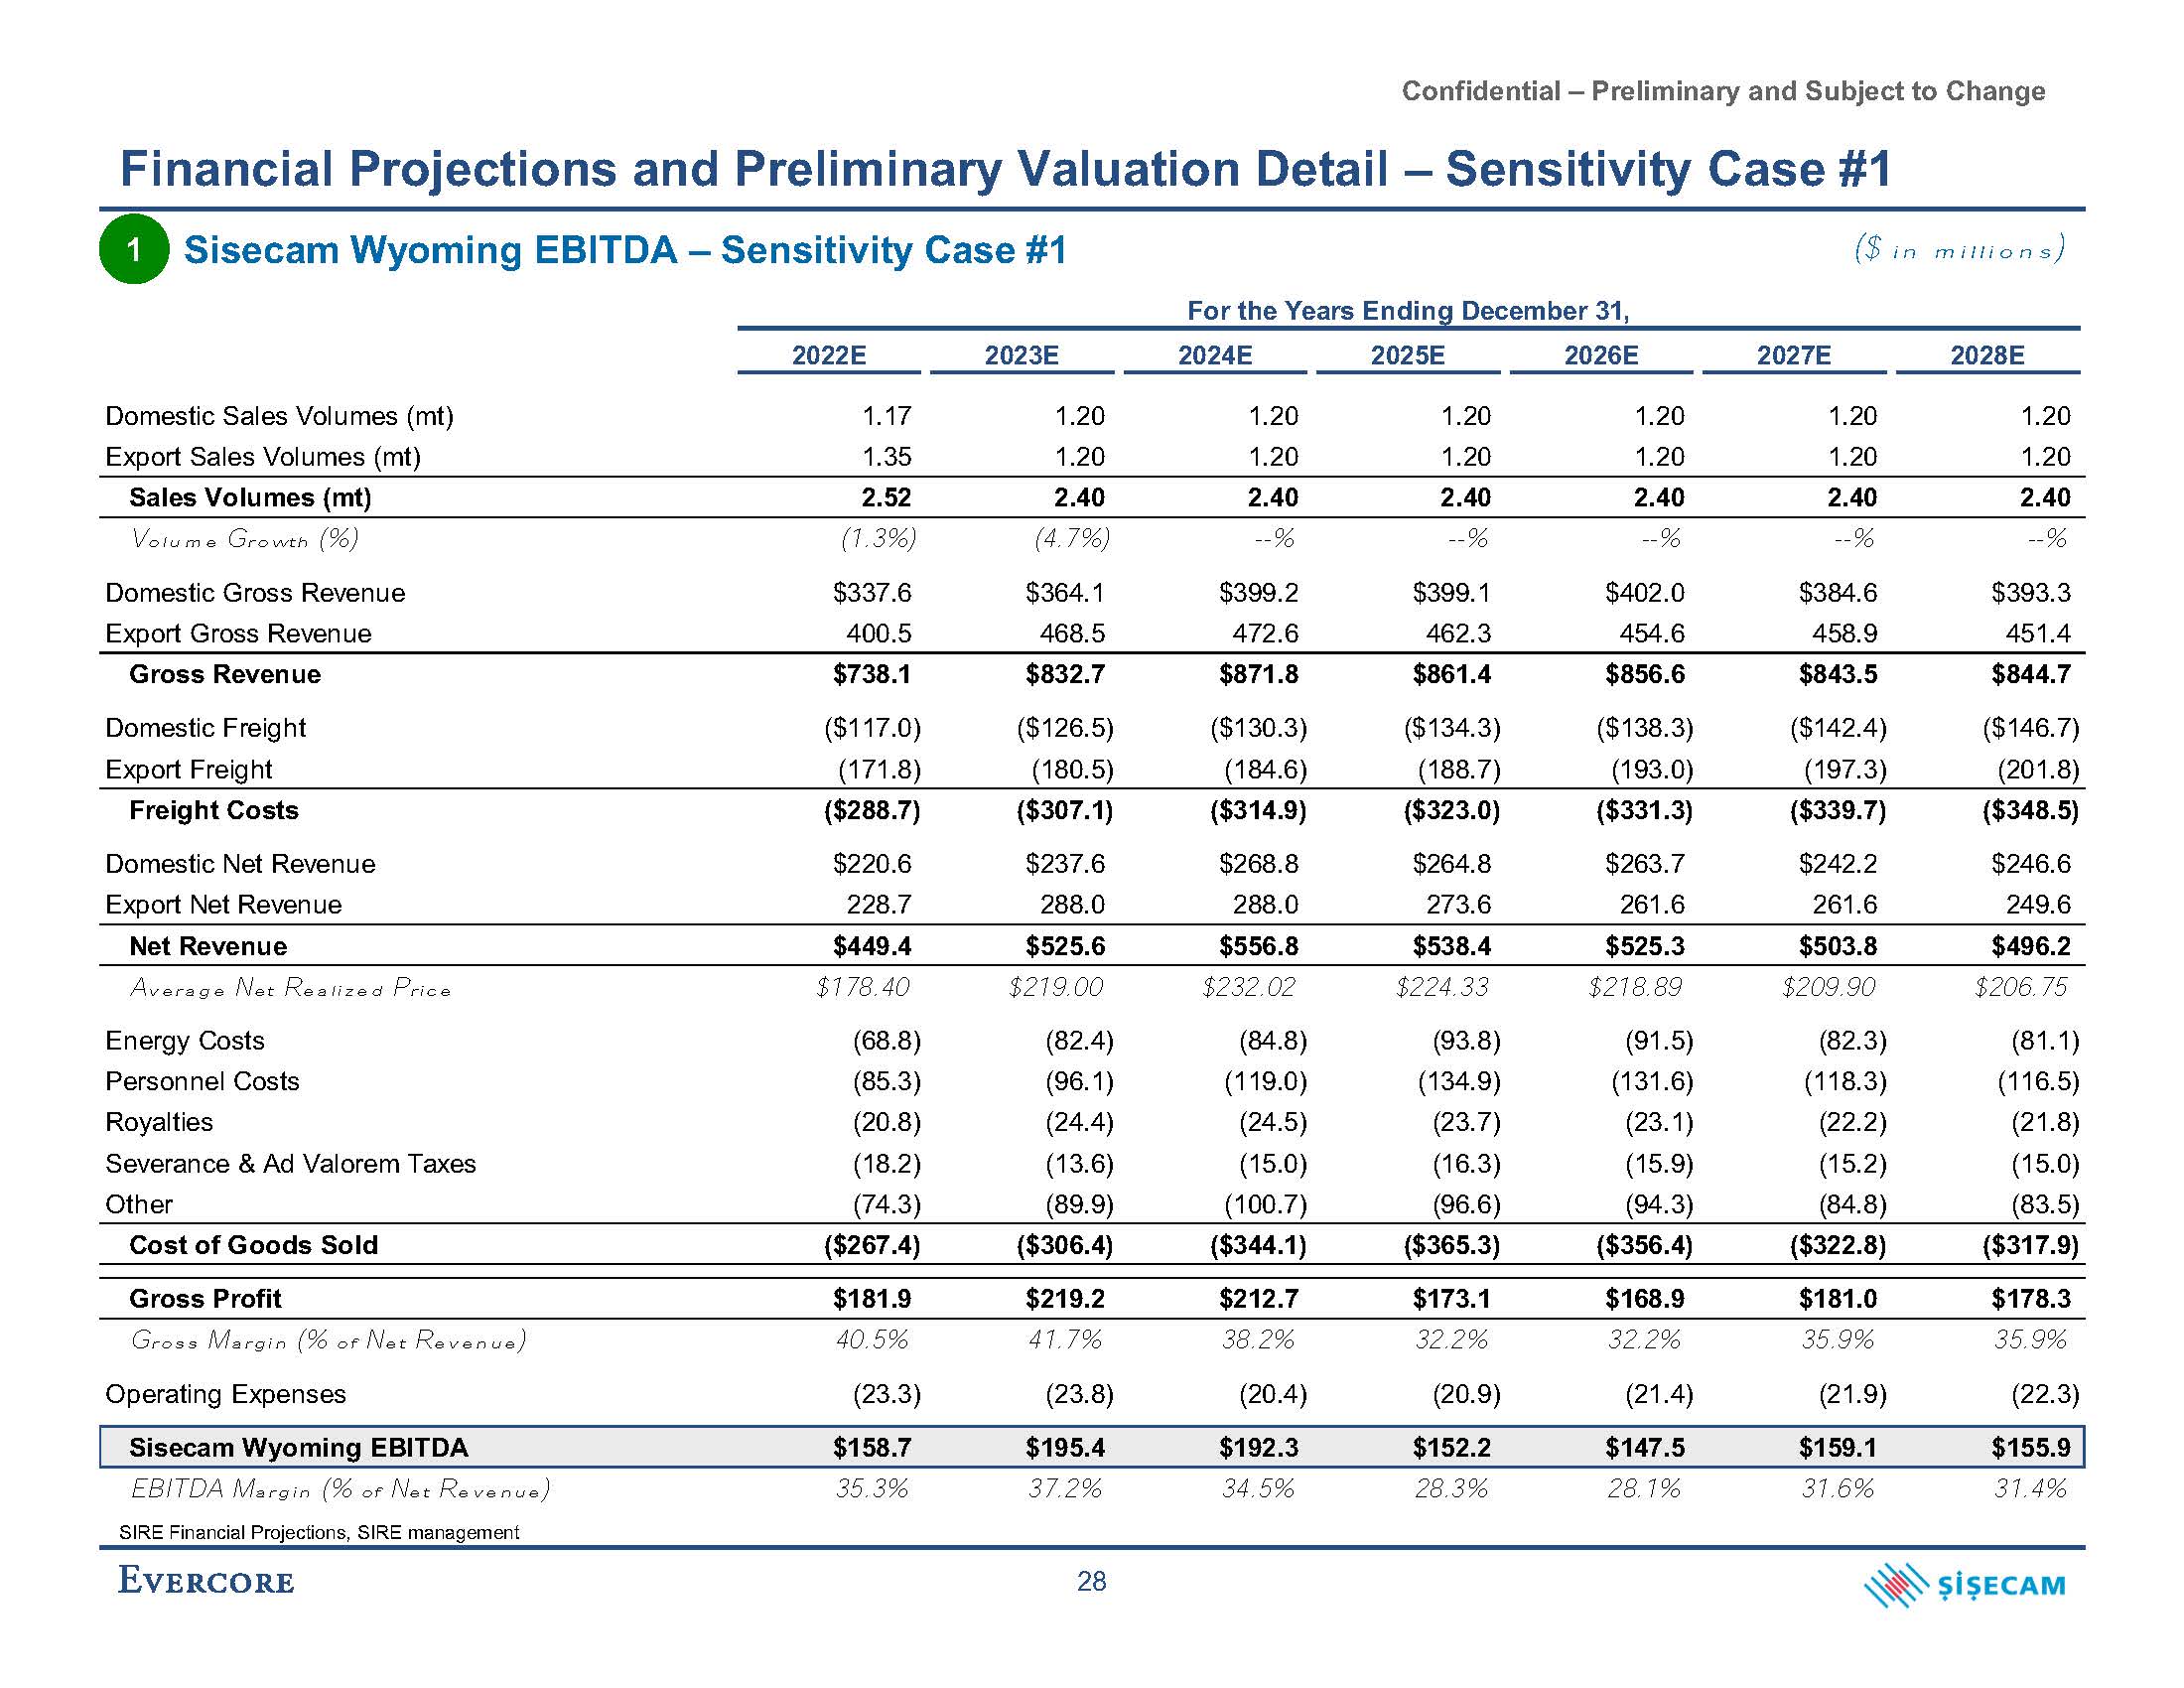
Confidential – Preliminary and Subject to Change Financial Projections and Preliminary Valuation Detail – Sensitivity Case #1 SIRE Financial Projections, SIRE management 28 Sisecam Wyoming EBITDA – Sensitivity Case #1 2022E 2023E 2024E 2025E 2026E 2027E 2028E Domestic Sales Volumes (mt) 1.17 1.20 1.20 1.20 1.20 1.20 1.20 Export Sales Volumes (mt) 1.35 1.20 1.20 1.20 1.20 1.20 1.20 Sales Volumes (mt) 2.52 2.40 2.40 2.40 2.40 2.40 2.40 Volume Growth (%) (1.3%) (4.7%) --% --% --% --% --% Domestic Gross Revenue $337.6 $364.1 $399.2 $399.1 $402.0 $384.6 $393.3 Export Gross Revenue 400.5 468.5 472.6 462.3 454.6 458.9 451.4 Gross Revenue $738.1 $832.7 $871.8 $861.4 $856.6 $843.5 $844.7 Domestic Freight ($117.0) ($126.5) ($130.3) ($134.3) ($138.3) ($142.4) ($146.7) Export Freight (171.8) (180.5) (184.6) (188.7) (193.0) (197.3) (201.8) Freight Costs ($288.7) ($307.1) ($314.9) ($323.0) ($331.3) ($339.7) ($348.5) Domestic Net Revenue $220.6 $237.6 $268.8 $264.8 $263.7 $242.2 $246.6 Export Net Revenue 228.7 288.0 288.0 273.6 261.6 261.6 249.6 Net Revenue $449.4 $525.6 $556.8 $538.4 $525.3 $503.8 $496.2 Average Net Realized Price $178.40 $219.00 $232.02 $224.33 $218.89 $209.90 $206.75 Energy Costs (68.8) (82.4) (84.8) (93.8) (91.5) (82.3) (81.1) Personnel Costs (85.3) (96.1) (119.0) (134.9) (131.6) (118.3) (116.5) Royalties (20.8) (24.4) (24.5) (23.7) (23.1) (22.2) (21.8) Severance & Ad Valorem Taxes (18.2) (13.6) (15.0) (16.3) (15.9) (15.2) (15.0) Other (74.3) (89.9) (100.7) (96.6) (94.3) (84.8) (83.5) Cost of Goods Sold ($267.4) ($306.4) ($344.1) ($365.3) ($356.4) ($322.8) ($317.9) Gross Profit $181.9 $219.2 $212.7 $173.1 $168.9 $181.0 $178.3 Gross Margin (% of Net Revenue) 40.5% 41.7% 38.2% 32.2% 32.2% 35.9% 35.9% Operating Expenses (23.3) (23.8) (20.4) (20.9) (21.4) (21.9) (22.3) Sisecam Wyoming EBITDA $158.7 $195.4 $192.3 $152.2 $147.5 $159.1 $155.9 EBITDA Margin (% of Net Revenue) 35.3% 37.2% 34.5% 28.3% 28.1% 31.6% 31.4% For the Years Ending December 31, ($ in millions) 1
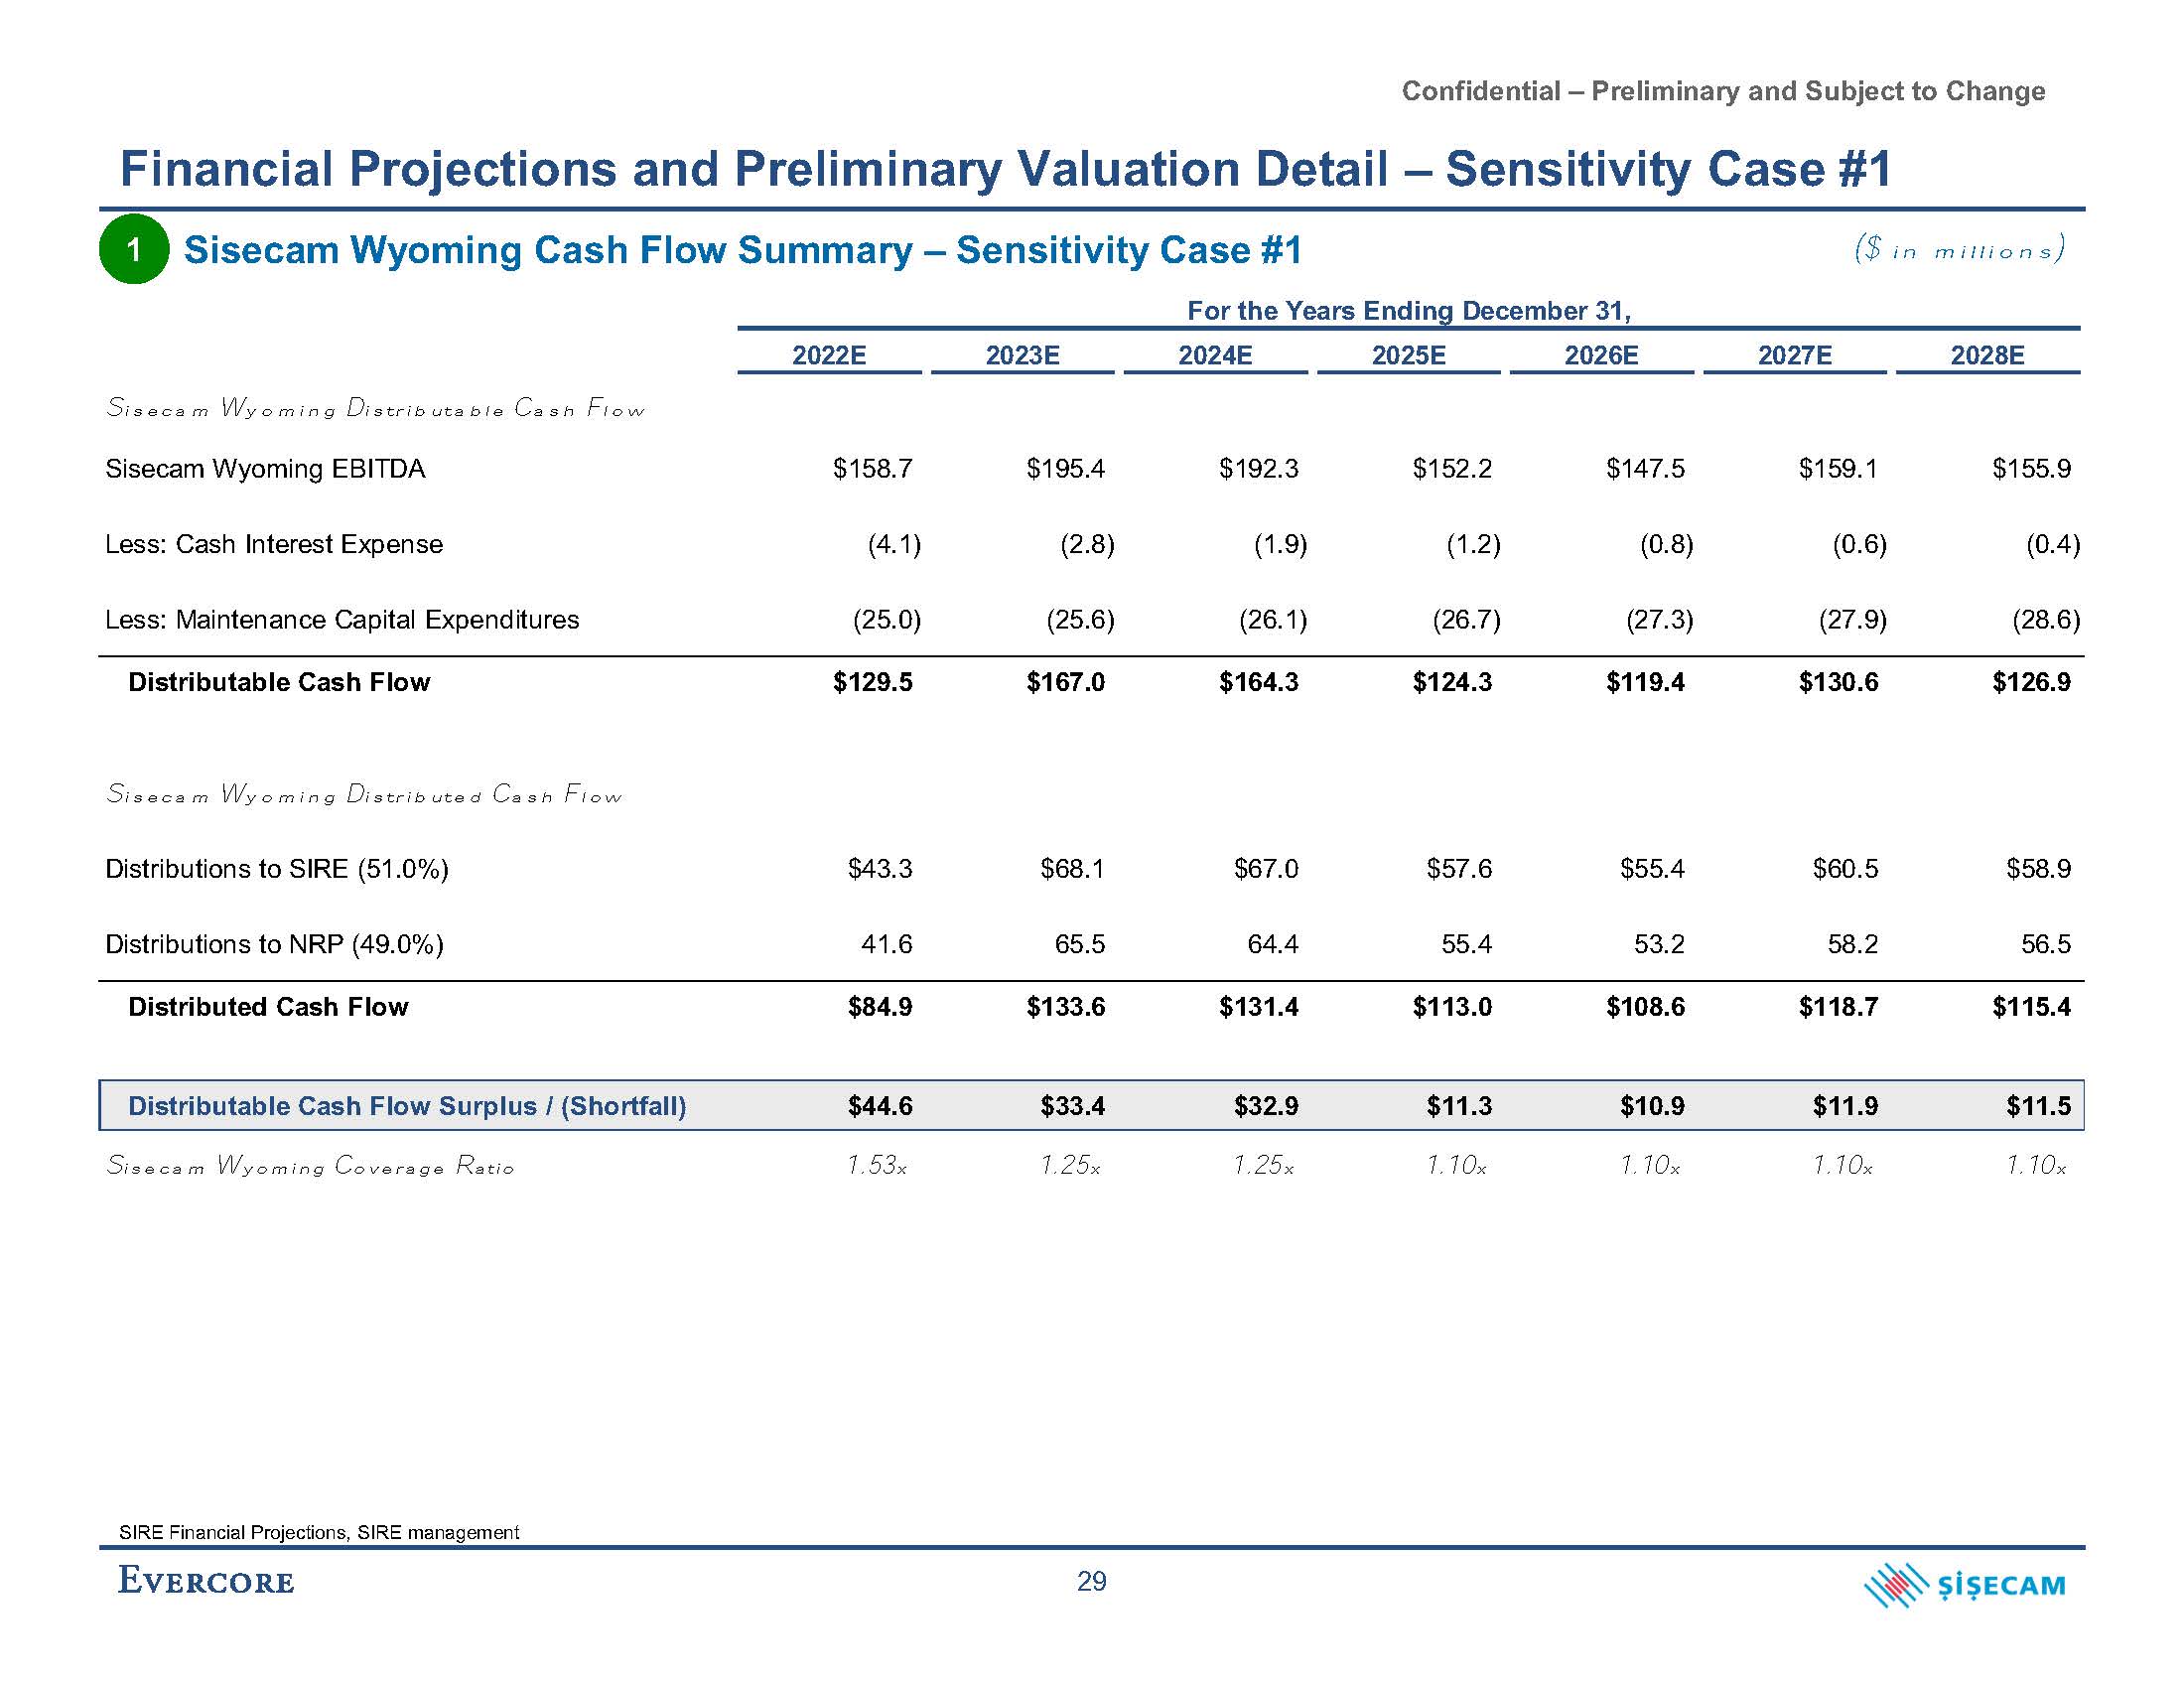
Confidential – Preliminary and Subject to Change Financial Projections and Preliminary Valuation Detail – Sensitivity Case #1 Sisecam Wyoming EBITDA $158.7 $195.4 $192.3 $152.2 $147.5 $159.1 $155.9 Less: Cash Interest Expense (4.1) (2.8) (1.9) (1.2) (0.8) (0.6) (0.4) Less: Maintenance Capital Expenditures (25.0) (25.6) (26.1) (26.7) (27.3) (27.9) (28.6) Distributable Cash Flow $129.5 $167.0 $164.3 $124.3 $119.4 $130.6 $126.9 Sisecam Wyoming Distributed Cash Flow Distributions to SIRE (51.0%) $43.3 $68.1 $67.0 $57.6 $55.4 $60.5 $58.9 Distributions to NRP (49.0%) 41.6 65.5 64.4 55.4 53.2 58.2 56.5 Distributed Cash Flow $84.9 $133.6 $131.4 $113.0 $108.6 $118.7 $115.4 Distributable Cash Flow Surplus / (Shortfall) $44.6 $33.4 $32.9 $11.3 $10.9 $11.9 $11.5 Sisecam Wyoming Coverage Ratio 1.53x 1.25x 1.25x 1.10x 1.10x 1.10x 1.10x Sisecam Wyoming Cash Flow Summary – Sensitivity Case #1 For the Years Ending December 31, 2022E 2023E 2024E 2025E 2026E 2027E 2028E Sisecam Wyoming Distributable Cash Flow SIRE Financial Projections, SIRE management 29 ($ in millions) 1
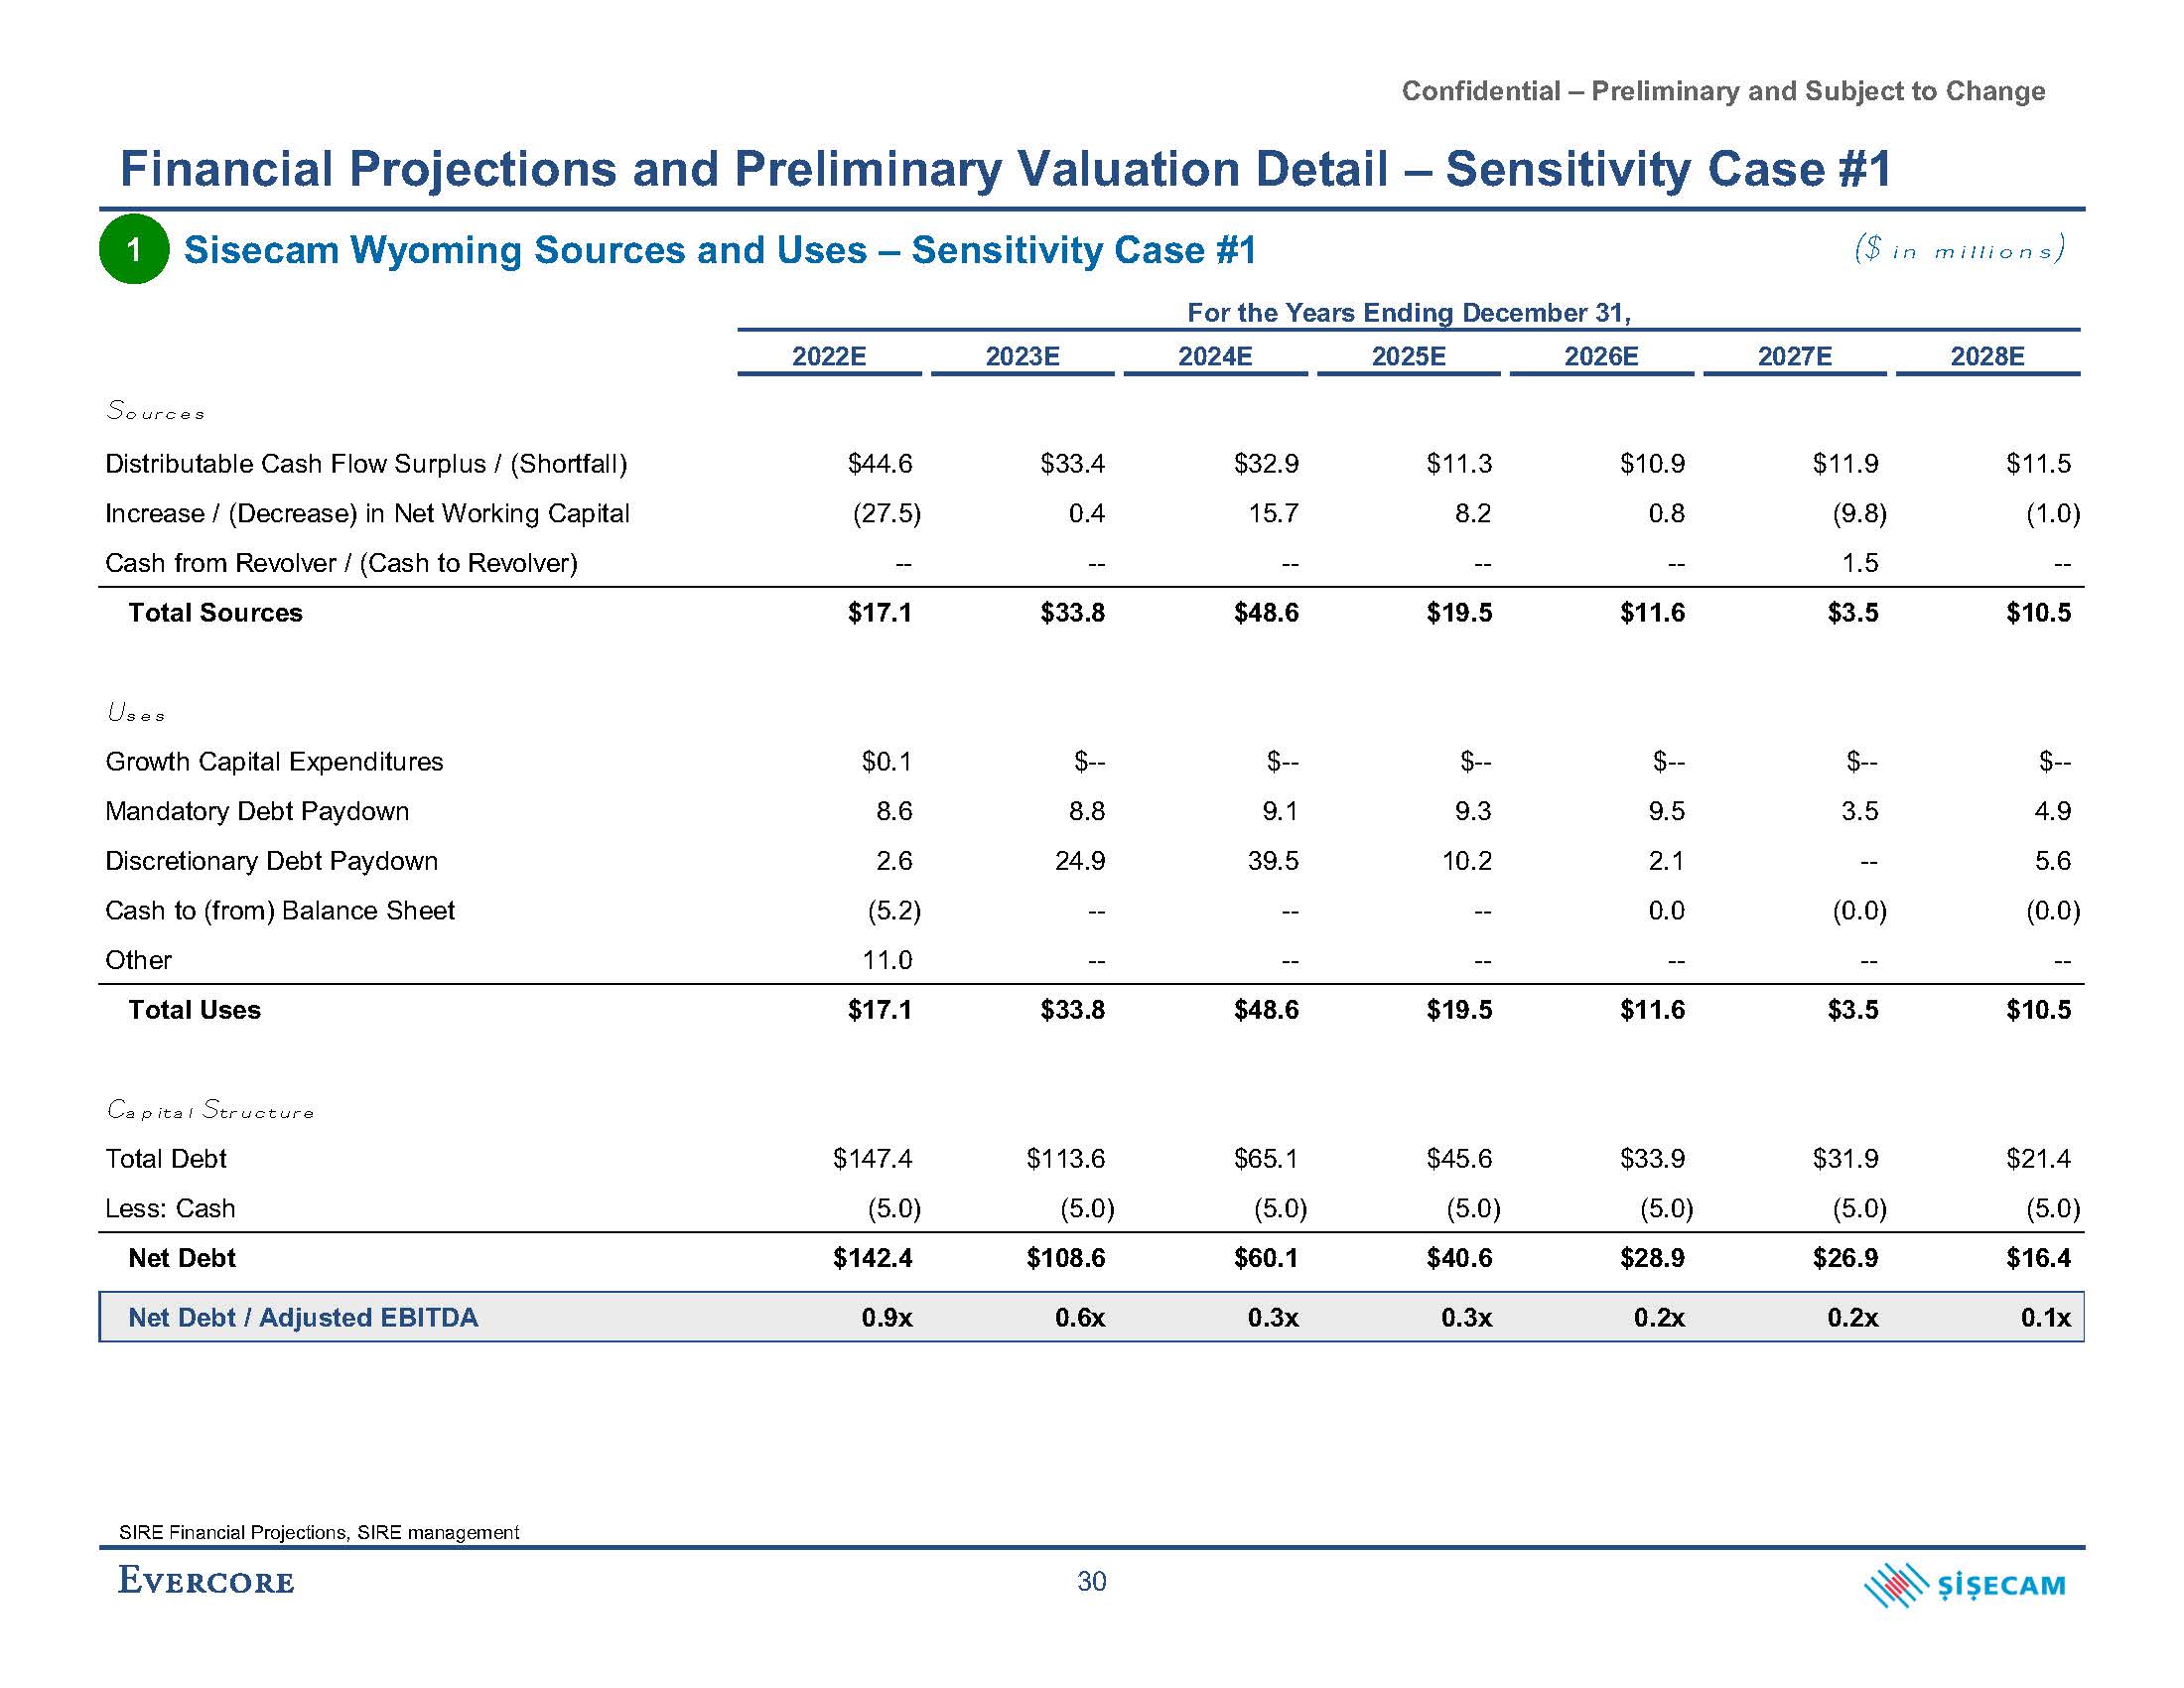
Confidential – Preliminary and Subject to Change Financial Projections and Preliminary Valuation Detail – Sensitivity Case #1 Sisecam Wyoming Sources and Uses – Sensitivity Case #1 For the Years Ending December 31, 2022E 2023E 2024E 2025E 2026E 2027E 20 Sources Distributable Cash Flow Surplus / (Shortfall) $44.6 $33.4 $32.9 $11.3 $10.9 Increase / (Decrease) in Net Working Capital (27.5) Cash from Revolver / (Cash to Revolver) -- 0.4 -- 15.7 -- 8.2 -- 0. Total Sources $17.1 $33.8 $48.6 $19.5 Uses Growth Capital Expenditures $0.1 $-- Mandatory Debt Paydown 8.6 8.8 Discretionary Debt Paydown 2.6 Cash to (from) Balance Sheet Other (5.2) Total Uses Capital Structure Total Debt Less: Cash Net Debt N ($ in millions) SIRE Financial Projections, SIRE management 30 1
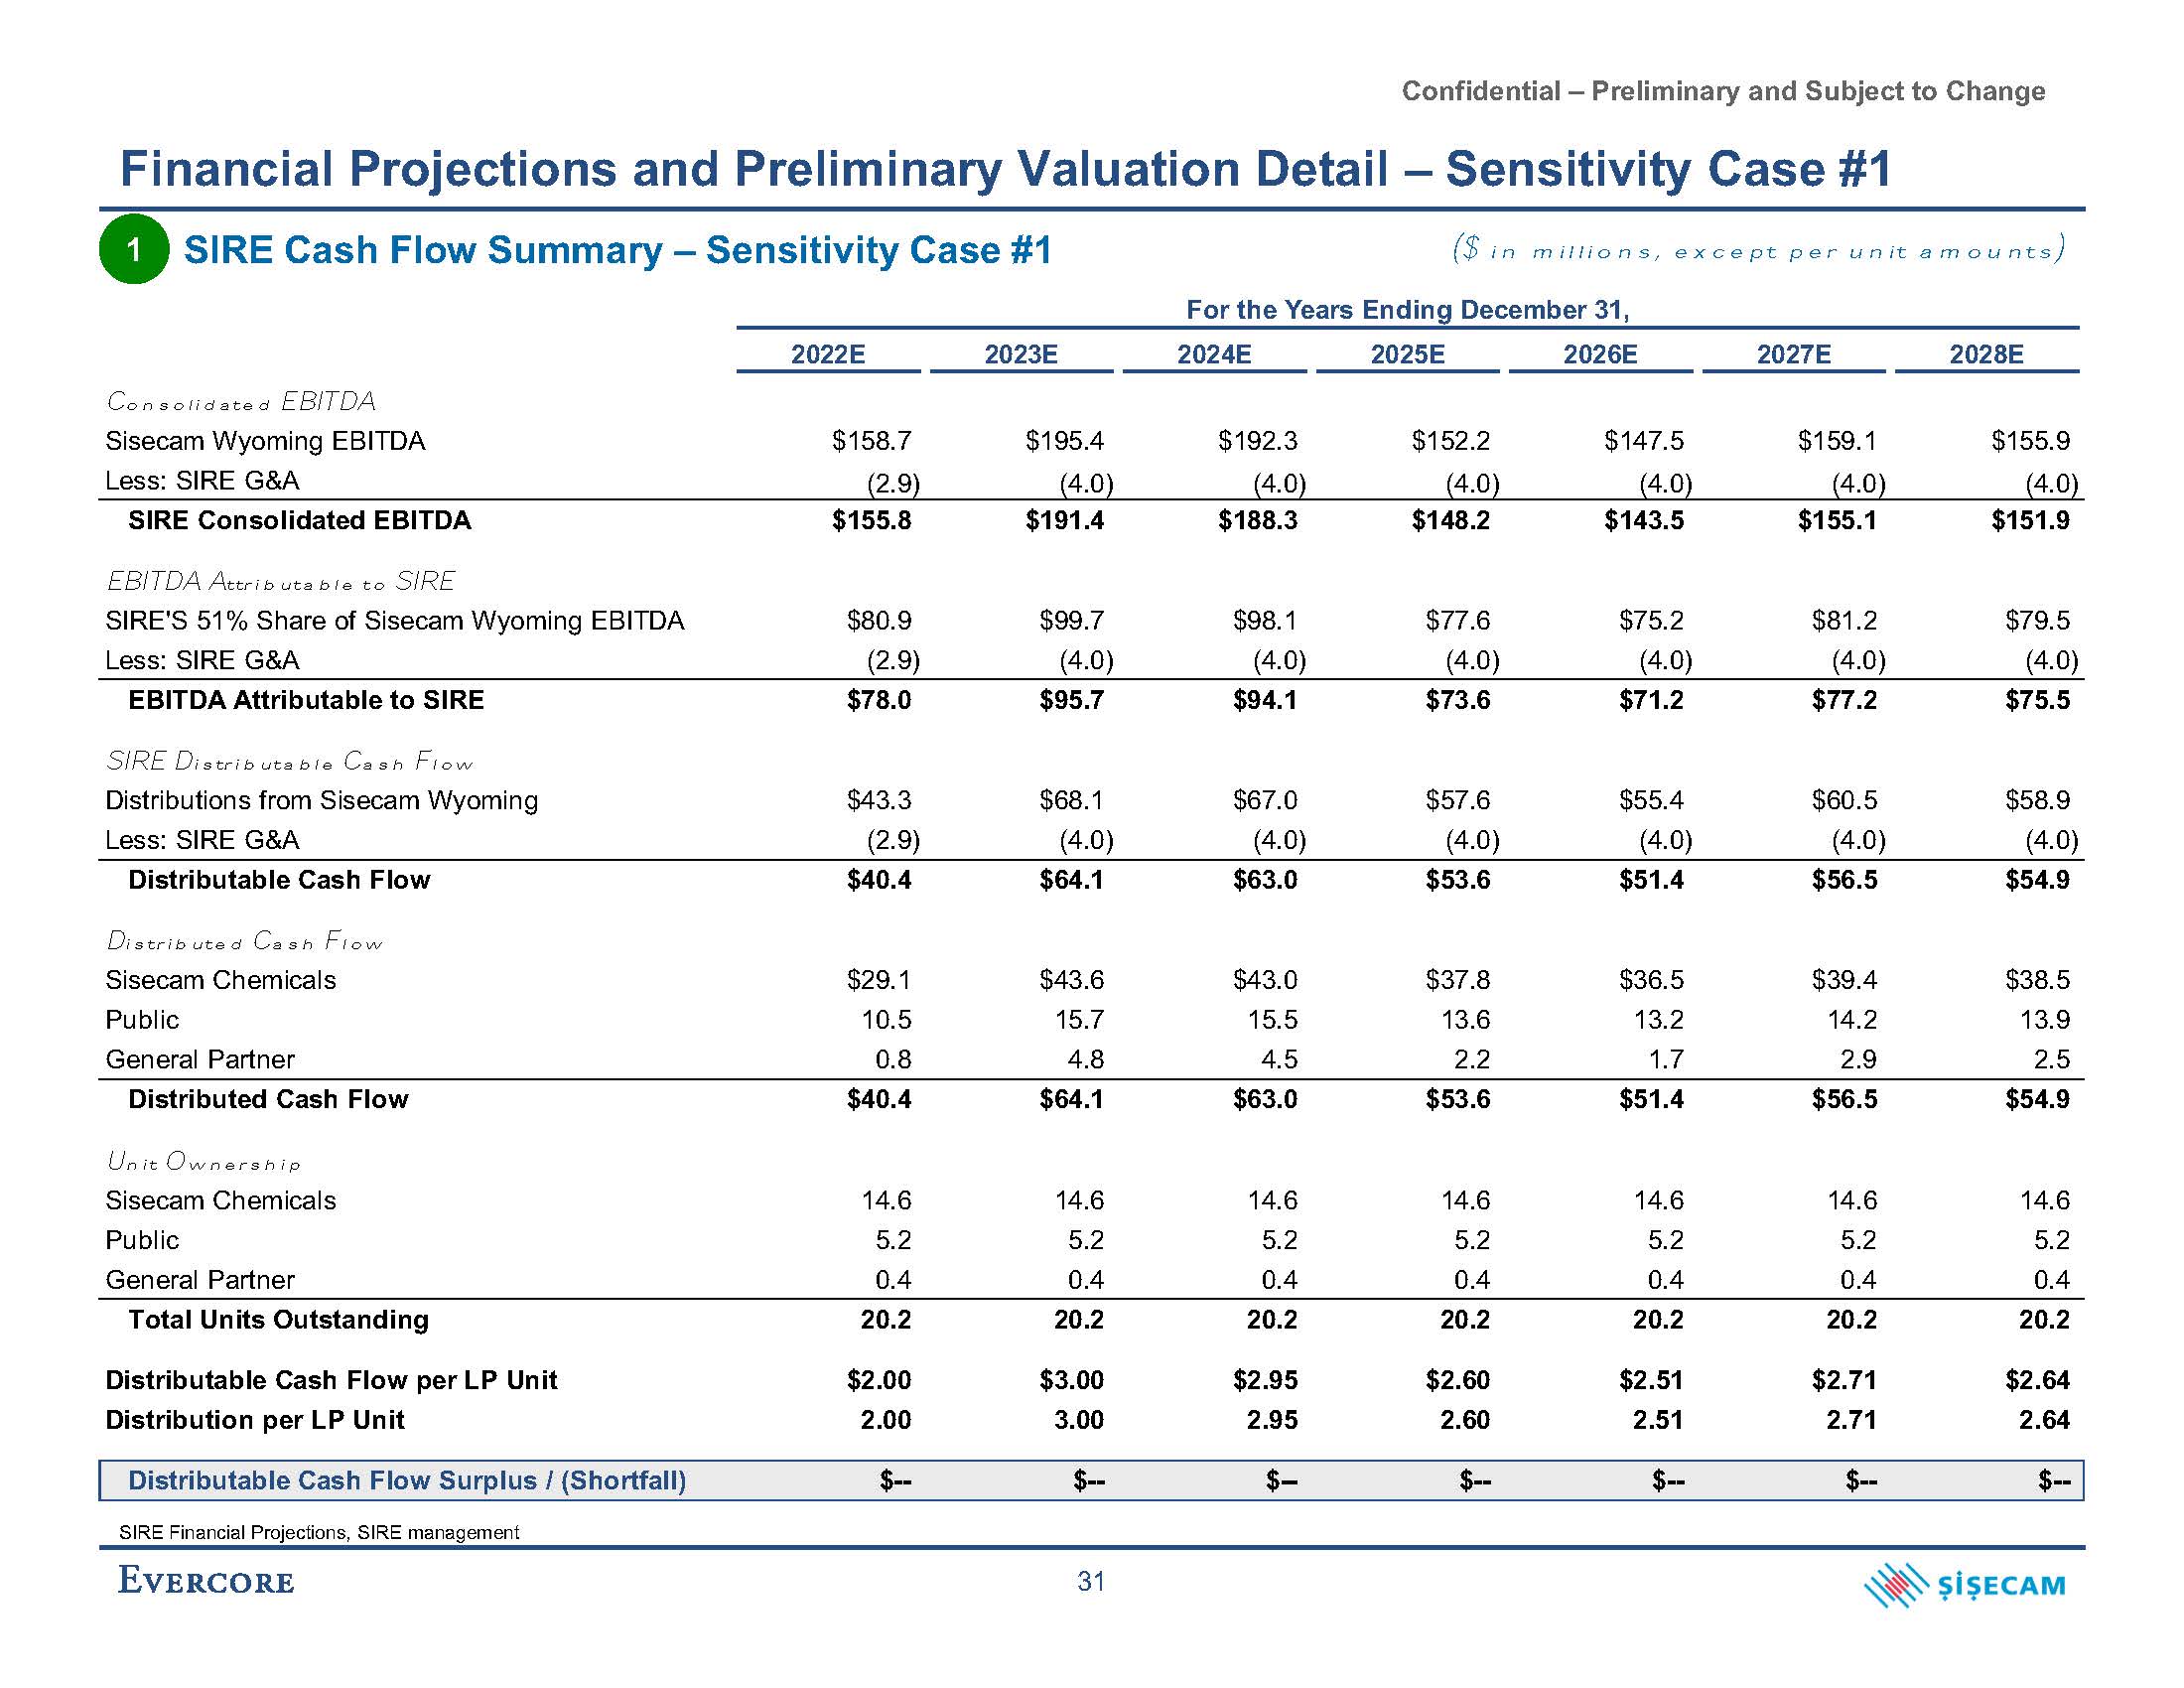
Confidential – Preliminary and Subject to Change Financial Projections and Preliminary Valuation Detail – Sensitivity Case #1 SIRE Financial Projections, SIRE management 31 SIRE Cash Flow Summary – Sensitivity Case #1 2022E 2023E 2024E 2025E 2026E 2027E 2028E Consolidated EBITDA Sisecam Wyoming EBITDA $158.7 $195.4 $192.3 $152.2 $147.5 $159.1 $155.9 Less: SIRE G&A (2.9) (4.0) (4.0) (4.0) (4.0) (4.0) (4.0) SIRE Consolidated EBITDA $155.8 $191.4 $188.3 $148.2 $143.5 $155.1 $151.9 EBITDA Attributable to SIRE SIRE'S 51% Share of Sisecam Wyoming EBITDA $80.9 $99.7 $98.1 $77.6 $75.2 $81.2 $79.5 Less: SIRE G&A (2.9) (4.0) (4.0) (4.0) (4.0) (4.0) (4.0) EBITDA Attributable to SIRE $78.0 $95.7 $94.1 $73.6 $71.2 $77.2 $75.5 SIRE Distributable Cash Flow Distributions from Sisecam Wyoming $43.3 $68.1 $67.0 $57.6 $55.4 $60.5 $58.9 Less: SIRE G&A (2.9) (4.0) (4.0) (4.0) (4.0) (4.0) (4.0) Distributable Cash Flow $40.4 $64.1 $63.0 $53.6 $51.4 $56.5 $54.9 Distributed Cash Flow Sisecam Chemicals $29.1 $43.6 $43.0 $37.8 $36.5 $39.4 $38.5 Public 10.5 15.7 15.5 13.6 13.2 14.2 13.9 General Partner 0.8 4.8 4.5 2.2 1.7 2.9 2.5 Distributed Cash Flow $40.4 $64.1 $63.0 $53.6 $51.4 $56.5 $54.9 Unit Ownership Sisecam Chemicals 14.6 14.6 14.6 14.6 14.6 14.6 14.6 Public 5.2 5.2 5.2 5.2 5.2 5.2 5.2 General Partner 0.4 0.4 0.4 0.4 0.4 0.4 0.4 Total Units Outstanding 20.2 20.2 20.2 20.2 20.2 20.2 20.2 Distributable Cash Flow per LP Unit $2.00 $3.00 $2.95 $2.60 $2.51 $2.71 $2.64 Distribution per LP Unit 2.00 3.00 2.95 2.60 2.51 2.71 2.64 Distributable Cash Flow Surplus / (Shortfall) $-- $-- $-- $-- $-- $-- $-- ($ in millions, except per unit amounts) For the Years Ending December 31, 1

Confidential – Preliminary and Subject to Change 4.25x Terminal Exit Multiple 5.50x 6.75x 8.00x 9.25x --% Perpetuity Growth Rate 0.5% 1.0% 1.5% 2.0% $25.83 $28.86 $31.89 $29.51 $30.91 $32.54 25.28 24.60 23.95 28.23 27.61 26.92 31.17 30.48 29.80 27.76 26.20 24.70 28.94 27.23 25.63 30.31 28.39 26.69 7.5% 8.0% 8.5% 9.0% 9.5% $22.78 22.14 21.54 20.97 20.43 23.33 26.22 29.11 $34.92 34.12 33.34 32.59 31.85 7.5% 8.0% 8.5% 9.0% 9.5% $28.30 26.72 25.24 23.87 22.65 23.37 24.18 25.09 $34.47 31.90 29.72 27.84 26.12 WACC WACC For the Years Ending December 31, 2023E 2024E 2025E 2026E 2027E 2028E Perpetuity Growth Exit Multiple $75.51 Sisecam Wyoming EBITDA Less: Tax Depreciation and Amortization2 $195.4 (652.0) $192.3 (21.7) $152.2 (39.8) $147.5 (53.8) $159.1 (63.2) $155.9 (67.7) $155.9 (28.6) EBIT Less: Cash Taxes3 ($456.6) -- $170.6 (10.1) $112.5 (6.7) $93.8 (6.9) $96.0 (7.1) $88.3 (6.5) $127.4 (47.1) $80.2 28.6 (28.6) EBIAT Plus: Tax Depreciation and Amortization Less: Capital Expenditures Less: Changes in NWC ($456.6) 652.0 (25.6) 0.4 $160.5 21.7 (26.1) 15.7 $105.8 39.8 (26.7) 8.2 $86.9 53.8 (27.3) 0.8 $88.9 63.2 (27.9) (9.8) $81.7 67.7 (28.6) (1.0) - Sisecam Wyoming Unlevered Free Cash Flow SIRE Interest in Sisecam Wyoming $170.2 51.0% $171.8 51.0% $127.0 51.0% $114.0 51.0% $114.3 51.0% $119.8 51.0% $80.2 51.0% SIRE Share of Sisecam Wyoming Unlevered Free Cash Flow Less: SIRE G&A $86.8 (4.0) $87.6 (4.0) $64.8 (4.0) $58.2 (4.0) $58.3 (4.0) $61.1 (4.0) $40.9 (4.0) $82.8 $83.6 $60.8 $54.2 $54.3 $57.1 SIRE Unlevered Free Cash Flow EBITDA Multiple / Perpetuity Growth Rate 6.75x $36.9 1.0% $497.3 304.8 Implied Terminal Value Present Value of Terminal Value @ 8.5% Discount Rate Plus: Present Value of Unlevered Free Cash Flow @ 8.5% Discount Rate $509.8 − 312.5 − 317.8 Implied Enterprise Value $630.3 − $622.6 Less: Net Debt as of December 31, 2022 (SIRE's 51% Share) (72.6) $550.0 Implied Equity Value SIRE LP Units Outstanding4 $557.7 − 20.2 Implied SIRE LP Unit Value $27.61 − $27.23 Financial Projections and Preliminary Valuation Detail – Sensitivity Case #1 Unit Price Sensitivity Analysis 4. Includes 2.0% general partner interest, economically equivalent to 399,000 LP Units at current quarterly distribution 32 Source: SIRE Financial Projections, SIRE management 51% of Sisecam Wyoming EBITDA less $4.0 million SIRE G&A 2022E tax DD&A assumes 100.0% bonus depreciation calculated as the midpoint of the enterprise value range plus 2022E capital expenditures; 2023E and 2024E tax DD&A assumes 100.0% bonus depreciation on capital expenditures; bonus depreciation phase-down on growth capital expenditures in 2025E (80.0%) and 2026E (60.0%) Assumes unitholder tax rate of 29.6% from 2023E to 2025E and 37.0% thereafter Discounted Cash Flow Analysis – Sensitivity Case #1 ($ in millions, except per unit amounts) 1
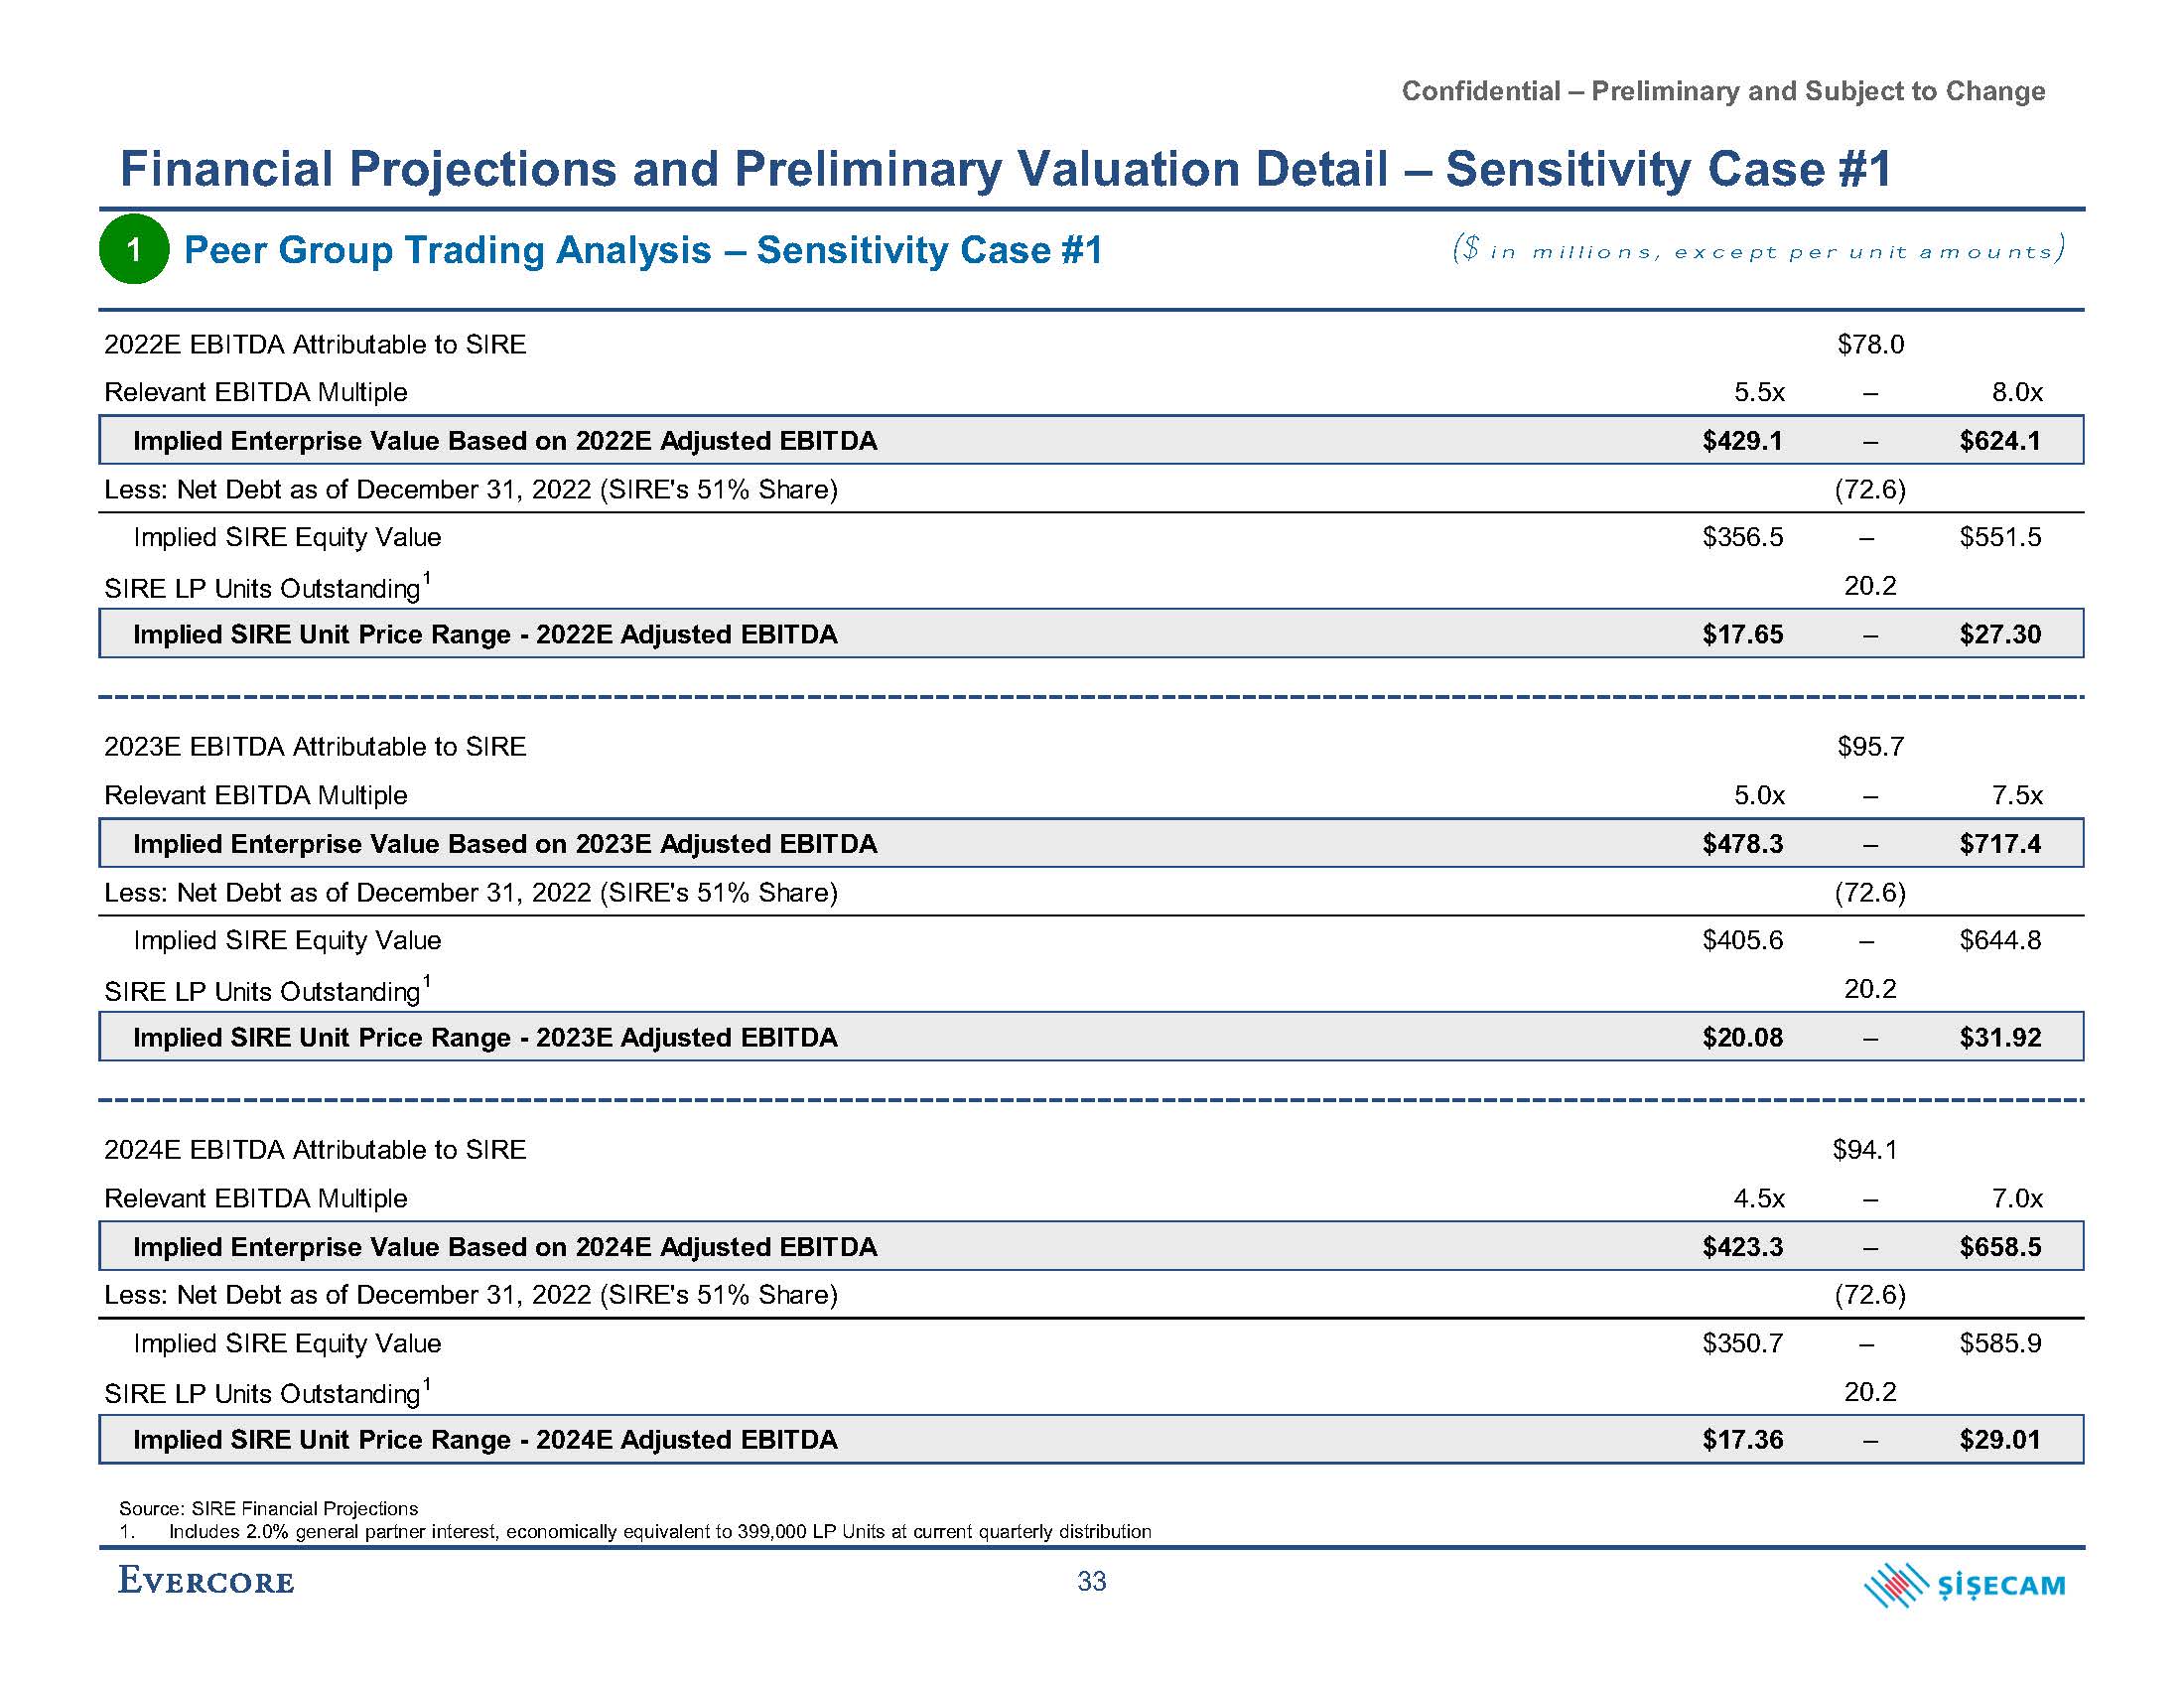
Confidential – Preliminary and Subject to Change Financial Projections and Preliminary Valuation Detail – Sensitivity Case #1 Peer Group Trading Analysis – Sensitivity Case #1 2022E EBITDA Attributable to SIRE Relevant EBITDA Multiple 5.5x $78.0 – 8.0x Implied Enterprise Value Based on 2022E Adjusted EBITDA $429.1 – $624.1 Less: Net Debt as of December 31, 2022 (SIRE's 51% Share) (72.6) Implied SIRE Equity Value SIRE LP Units Outstanding1 $356.5 – 20.2 $551.5 Implied SIRE Unit Price Range - 2022E Adjusted EBITDA $17.65 – $27.30 2023E EBITDA Attributable to SIRE Relevant EBITDA Multiple 5.0x $95.7 – 7.5x Implied Enterprise Value Based on 2023E Adjusted EBITDA $478.3 – $717.4 Less: Net Debt as of December 31, 2022 (SIRE's 51% Share) (72.6) Implied SIRE Equity Value SIRE LP Units Outstanding1 $405.6 – 20.2 $644.8 Implied SIRE Unit Price Range - 2023E Adjusted EBITDA $20.08 – $31.92 2024E EBITDA Attributable to SIRE Relevant EBITDA Multiple 4.5x $94.1 – 7.0x Implied Enterprise Value Based on 2024E Adjusted EBITDA $423.3 – $658.5 Less: Net Debt as of December 31, 2022 (SIRE's 51% Share) (72.6) Implied SIRE Equity Value SIRE LP Units Outstanding1 $350.7 – 20.2 $585.9 Implied SIRE Unit Price Range - 2024E Adjusted EBITDA $17.36 – $29.01 ($ in millions, except per unit amounts) Source: SIRE Financial Projections 1. Includes 2.0% general partner interest, economically equivalent to 399,000 LP Units at current quarterly distribution 33 1
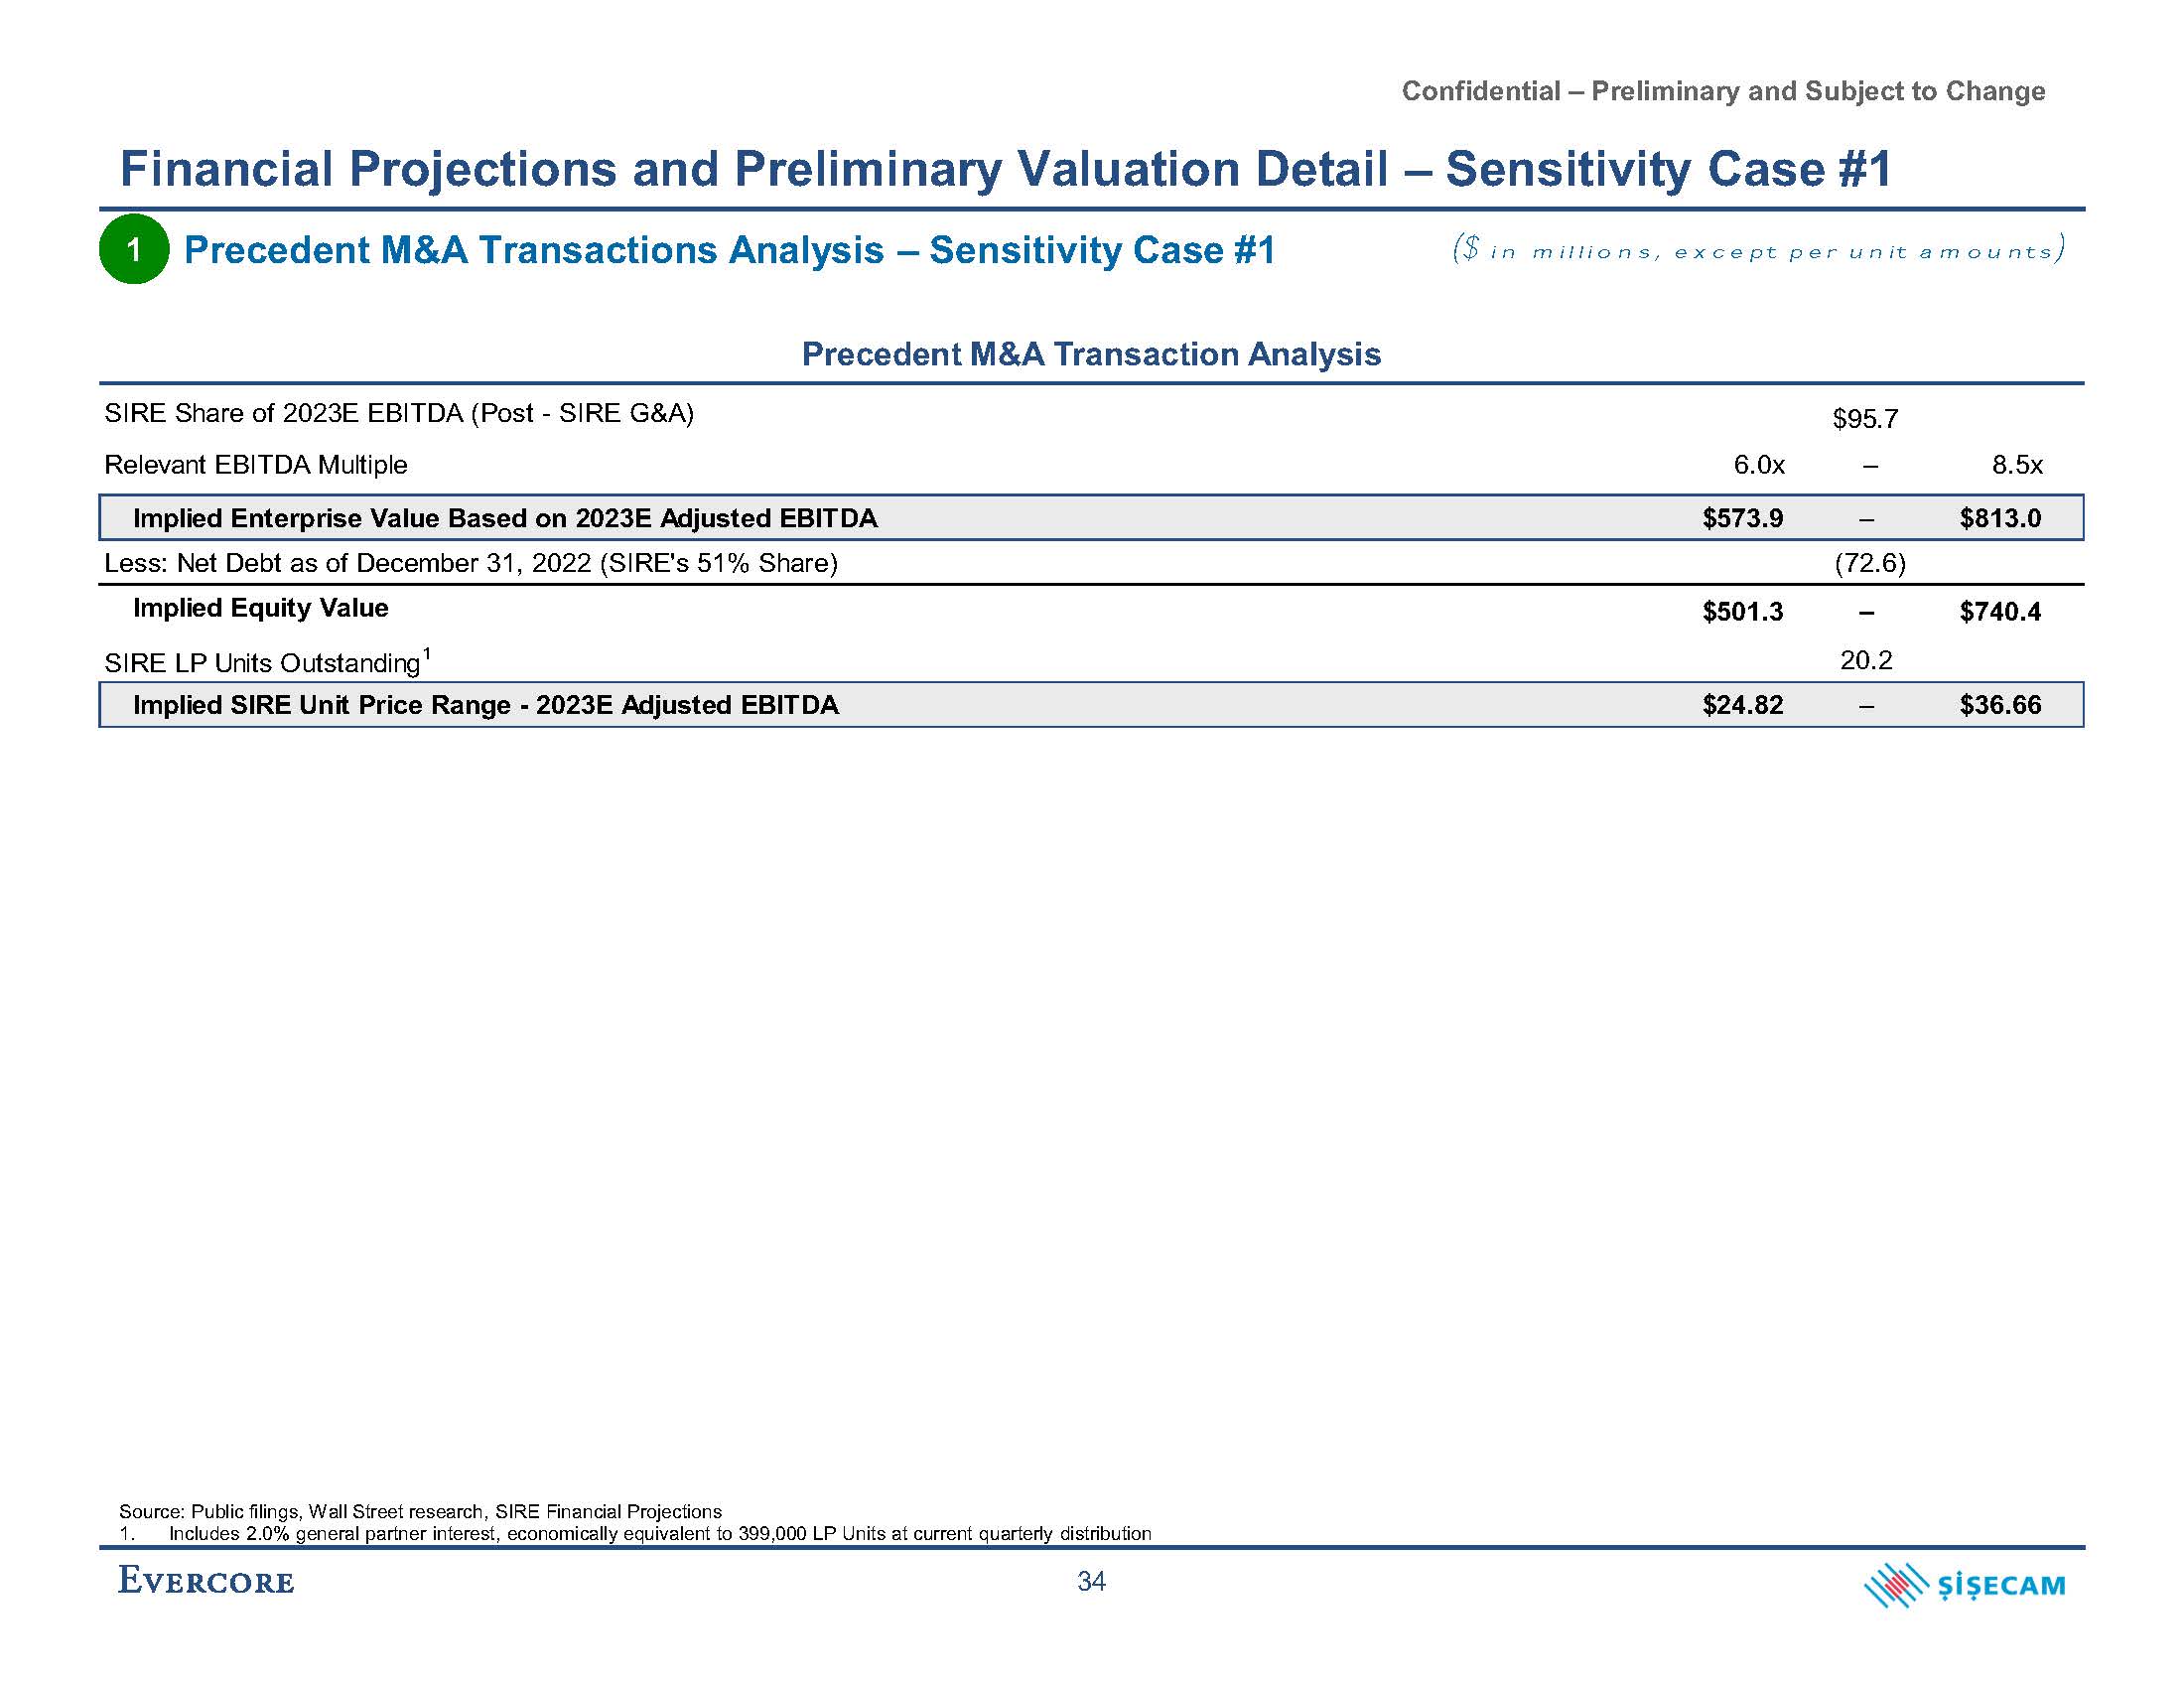
Confidential – Preliminary and Subject to Change Source: Public filings, Wall Street research, SIRE Financial Projections 1. Includes 2.0% general partner interest, economically equivalent to 399,000 LP Units at current quarterly distribution Financial Projections and Preliminary Valuation Detail – Sensitivity Case #1 Precedent M&A Transactions Analysis – Sensitivity Case #1 Precedent M&A Transaction Analysis 34 ($ in millions, except per unit amounts) 1
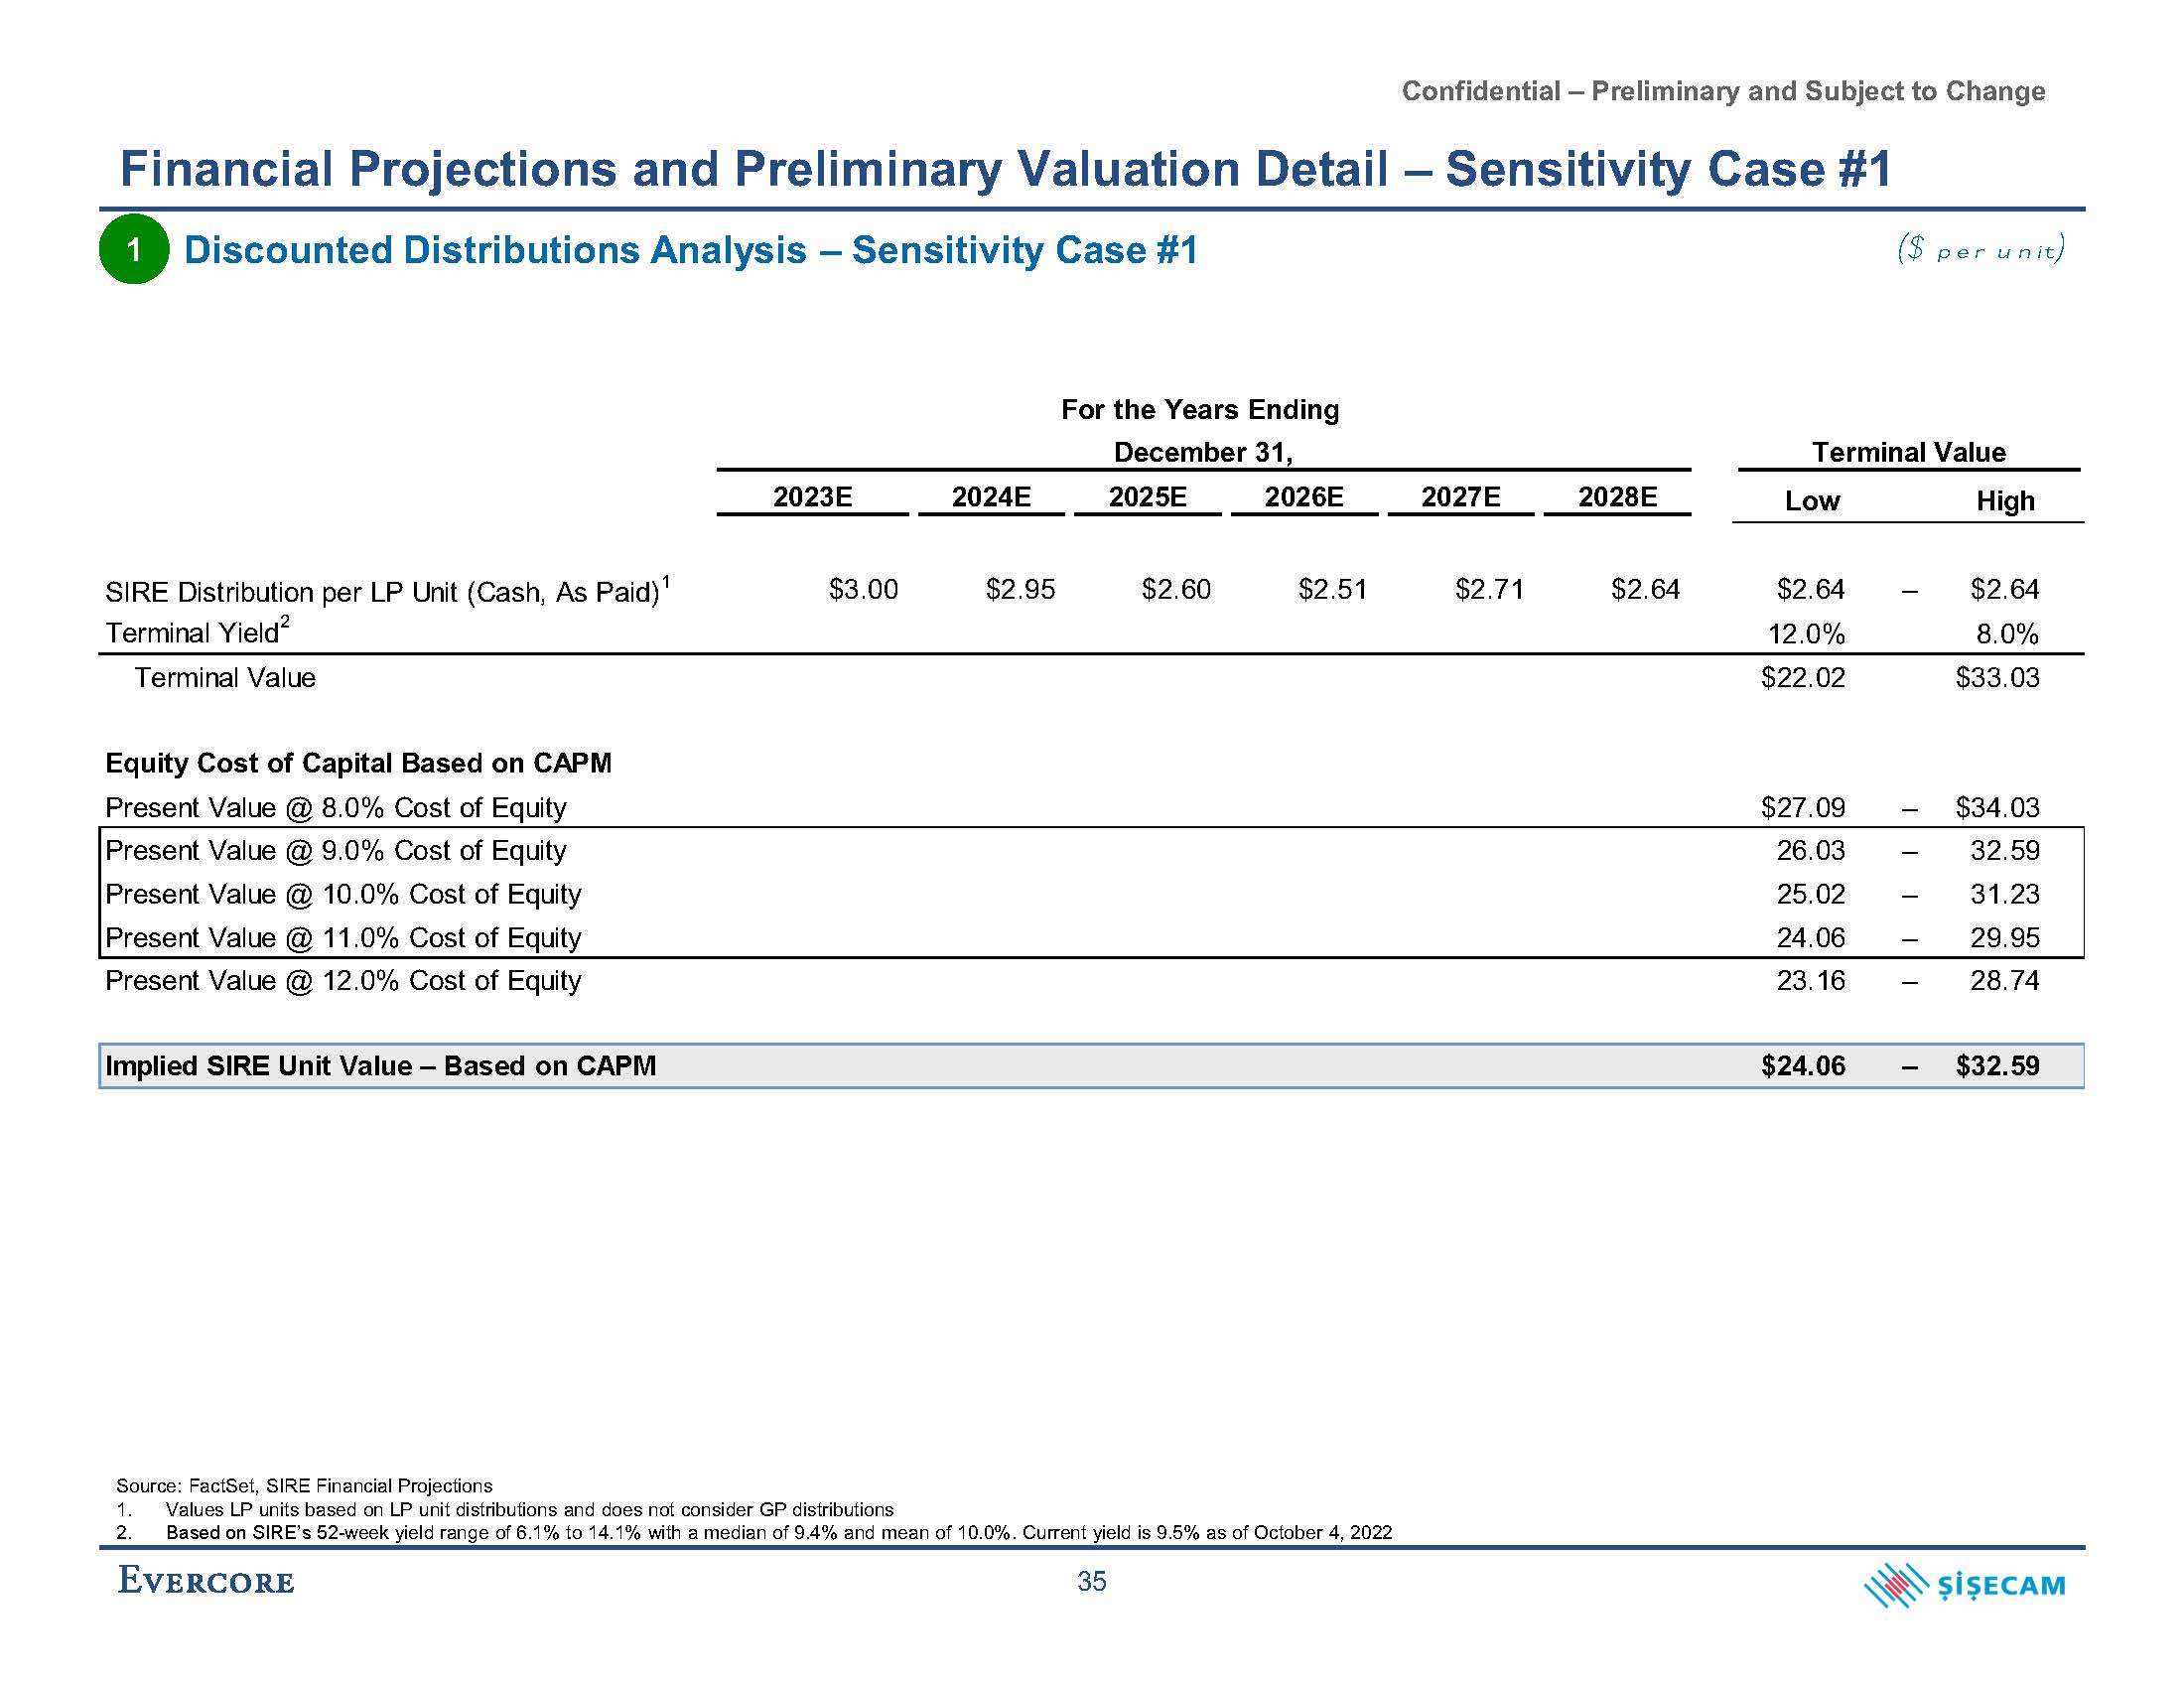
Confidential – Preliminary and Subject to Change Financial Projections and Preliminary Valuation Detail – Sensitivity Case #1 Discounted Distributions Analysis – Sensitivity Case #1 ($ per unit) SIRE Distribution per LP Unit (Cash, As Paid)1 $3.00 $2.95 $2.60 $2.51 $2.71 $2.64 $2.64 – $2.64 Terminal Yield2 12.0% 8.0% Terminal Value $22.02 $33.03 Equity Cost of Capital Based on CAPM Present Value @ 8.0% Cost of Equity $27.09 – $34.03 Present Value @ 9.0% Cost of Equity 26.03 – 32.59 Present Value @ 10.0% Cost of Equity 25.02 – 31.23 Present Value @ 11.0% Cost of Equity 24.06 – 29.95 Present Value @ 12.0% Cost of Equity 23.16 – 28.74 Implied SIRE Unit Value – Based on CAPM $24.06 – $32.59 For the Years Ending December 31, 2023E 2024E 2025E 2026E 2027E 2028E Terminal Value Low High Source: FactSet, SIRE Financial Projections Values LP units based on LP unit distributions and does not consider GP distributions Based on SIRE’s 52-week yield range of 6.1% to 14.1% with a median of 9.4% and mean of 10.0%. Current yield is 9.5% as of October 4, 2022 35 1
Confidential – Preliminary and Subject to Change D. Sensitivity Case #2 – Illustrative Unit 8 Expansion Economics
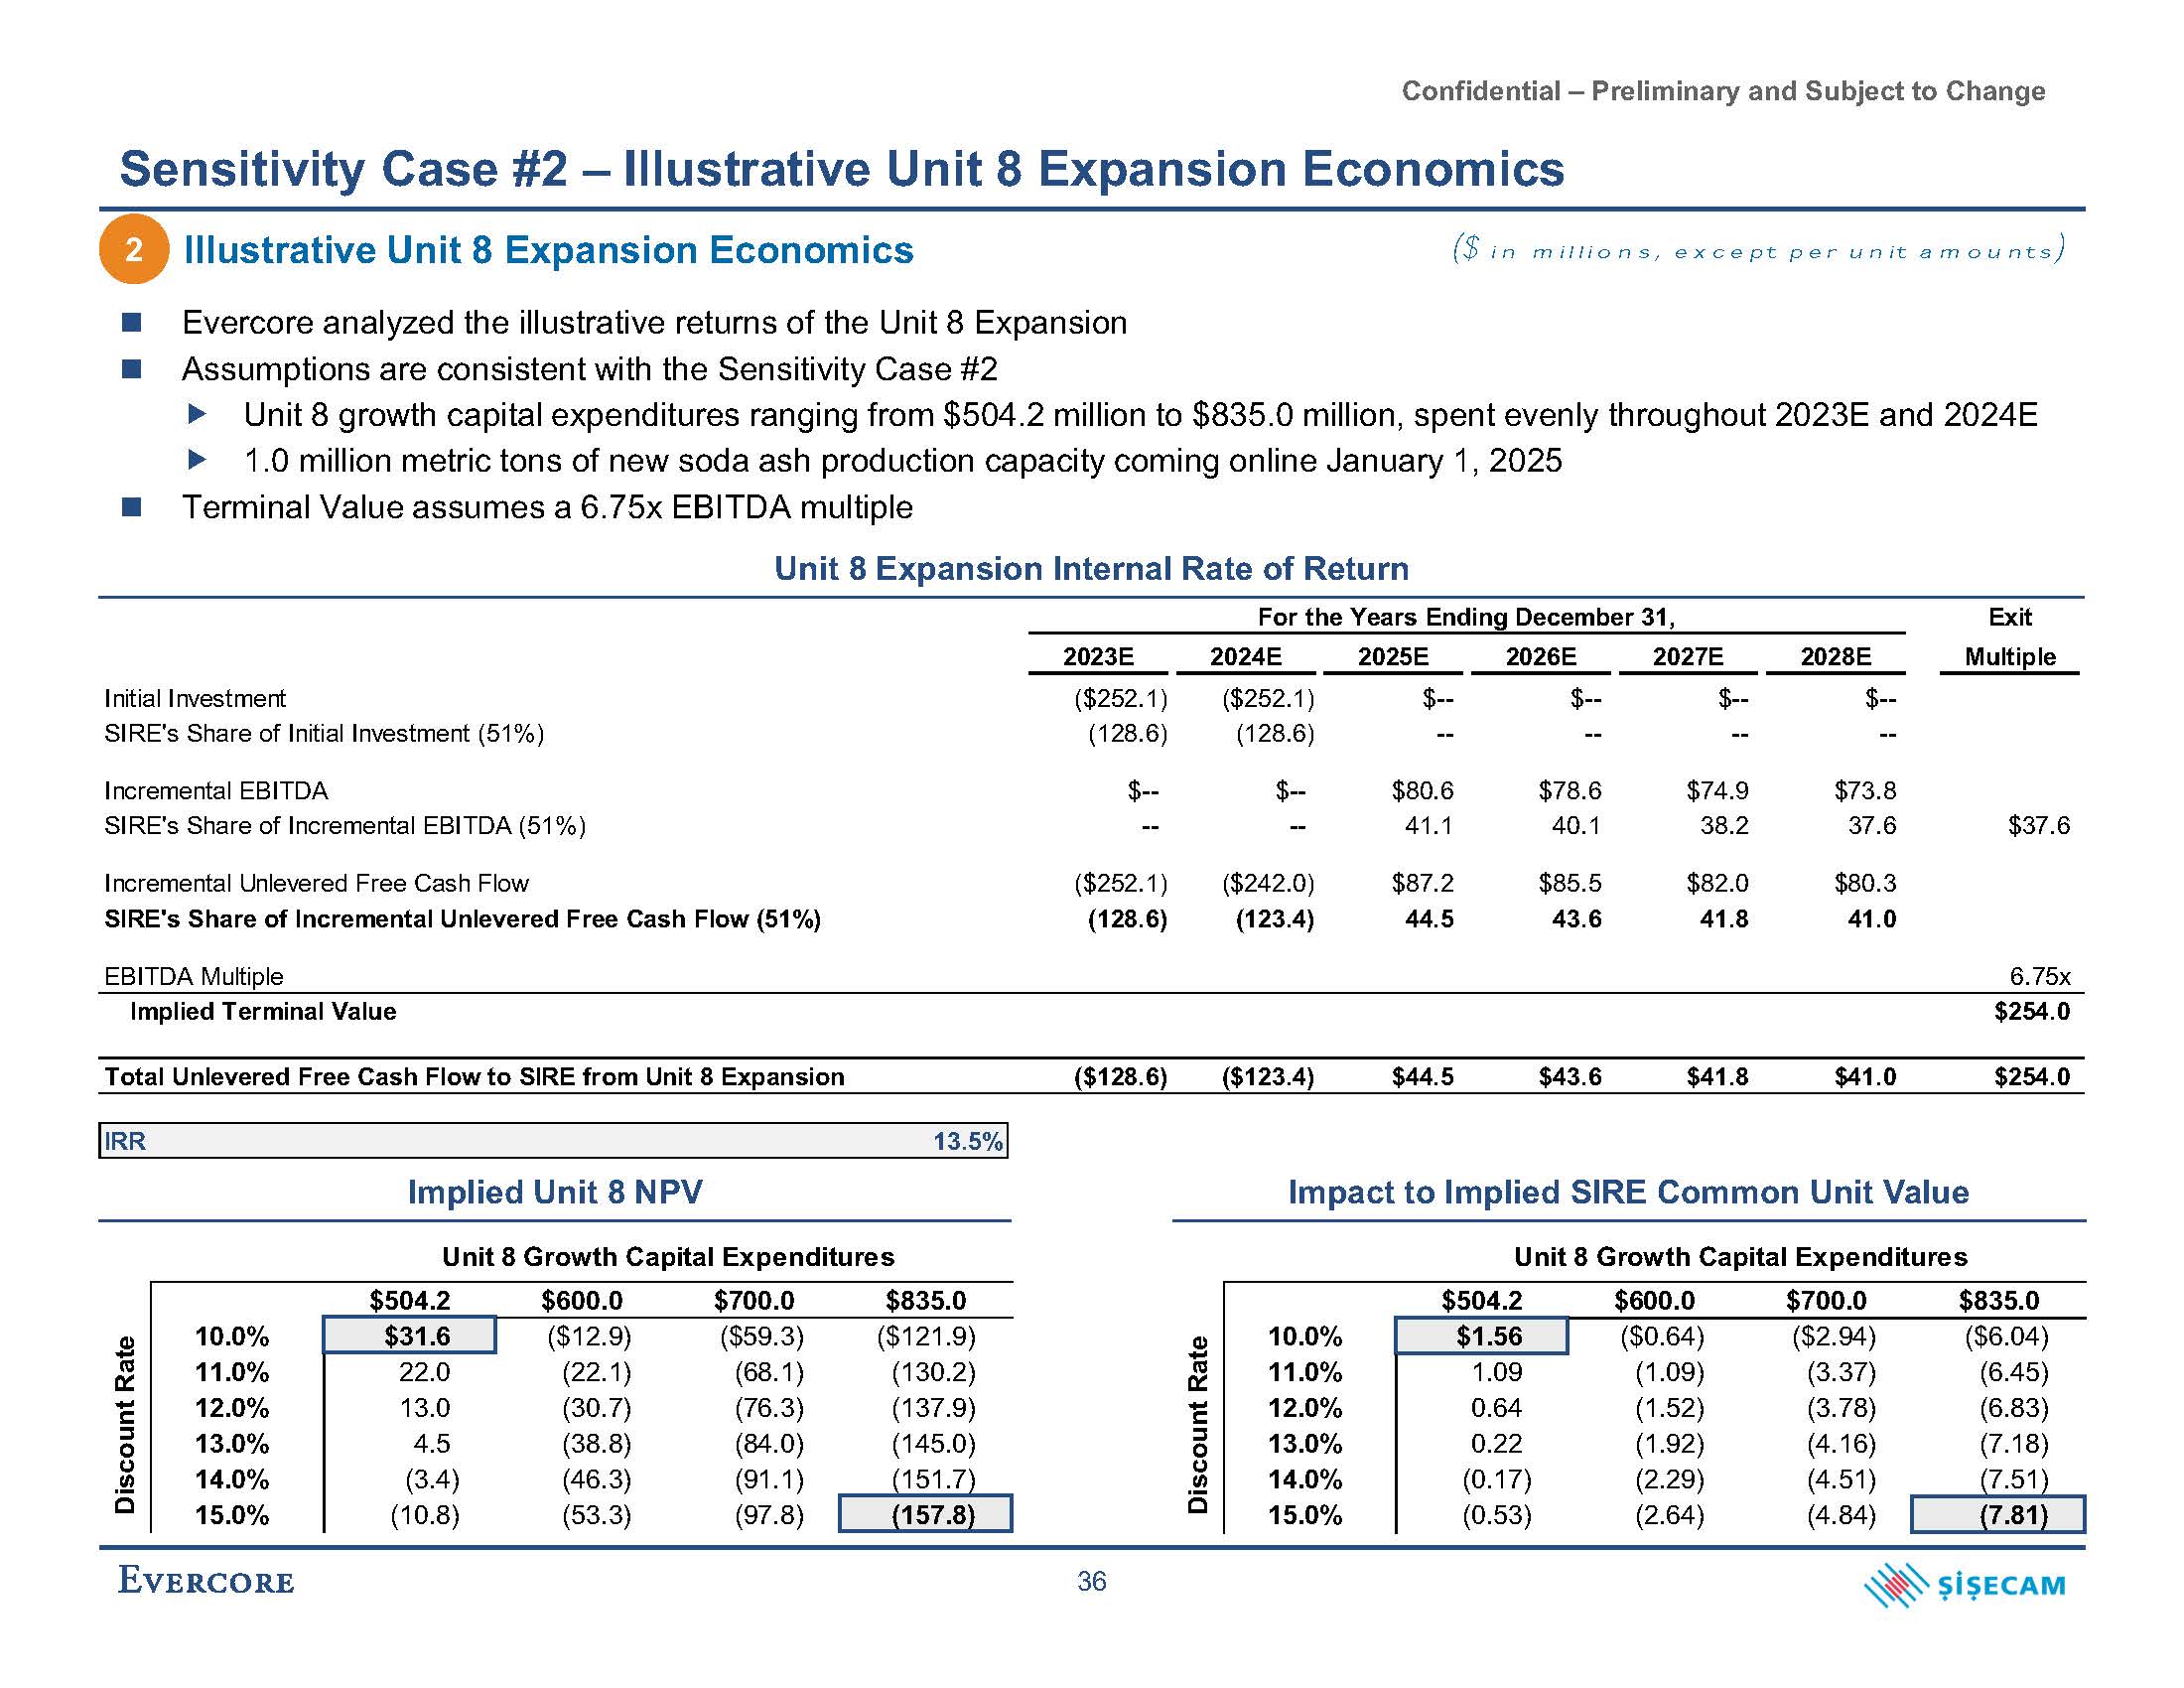
Confidential – Preliminary and Subject to Change Sensitivity Case #2 – Illustrative Unit 8 Expansion Economics Illustrative Unit 8 Expansion Economics Evercore analyzed the illustrative returns of the Unit 8 Expansion Assumptions are consistent with the Sensitivity Case #2 2 ($ in millions, except per unit amounts) Initial Investment ($252.1) ($252.1) $-- $-- $-- $-- SIRE's Share of Initial Investment (51%) (128.6) (128.6) -- -- -- -- Incremental EBITDA $-- $-- $80.6 $78.6 $74.9 $73.8 SIRE's Share of Incremental EBITDA (51%) -- -- 41.1 40.1 38.2 37.6 $37.6 Incremental Unlevered Free Cash Flow ($252.1) ($242.0) $87.2 $85.5 $82.0 $80.3 SIRE's Share of Incremental Unlevered Free Cash Flow (51%) (128.6) (123.4) 44.5 43.6 41.8 41.0 EBITDA Multiple 6.75x Implied Terminal Value $254.0 Total Unlevered Free Cash Flow to SIRE from Unit 8 Expansion ($128.6) ($123.4) $44.5 $43.6 $41.8 $41.0 $254.0 IRR 13.5% For the Years Ending December 31, 2023E 2024E 2025E 2026E 2027E 2028E Exit Multiple Unit 8 growth capital expenditures ranging from $504.2 million to $835.0 million, spent evenly throughout 2023E and 2024E 1.0 million metric tons of new soda ash production capacity coming online January 1, 2025 Terminal Value assumes a 6.75x EBITDA multiple Unit 8 Expansion Internal Rate of Return Implied Unit 8 NPV Impact to Implied SIRE Common Unit Value Unit 8 Growth Capital Expenditures $504.2 $600.0 $700.0 $835.0 10.0% 11.0% 12.0% 13.0% 14.0% 15.0% $31.6 ($12.9) ($59.3) ($121.9) 22.0 (22.1) (68.1) (130.2) 13.0 (30.7) (76.3) (137.9) 4.5 (38.8) (84.0) (145.0) (3.4) (46.3) (91.1) (151.7) (10.8) (53.3) (97.8) (157.8) Discount Rate Unit 8 Growth Capital Expenditures $504.2 $600.0 $700.0 $835.0 10.0% 11.0% 12.0% 13.0% 14.0% 15.0% $1.56 ($0.64) ($2.94) ($6.04) 1.09 (1.09) (3.37) (6.45) 0.64 (1.52) (3.78) (6.83) 0.22 (1.92) (4.16) (7.18) (0.17) (2.29) (4.51) (7.51) (0.53) (2.64) (4.84) (7.81) Discount Rate
Confidential – Preliminary and Subject to Change E. Financial Projections and Preliminary Valuation Detail – Sensitivity Case #3
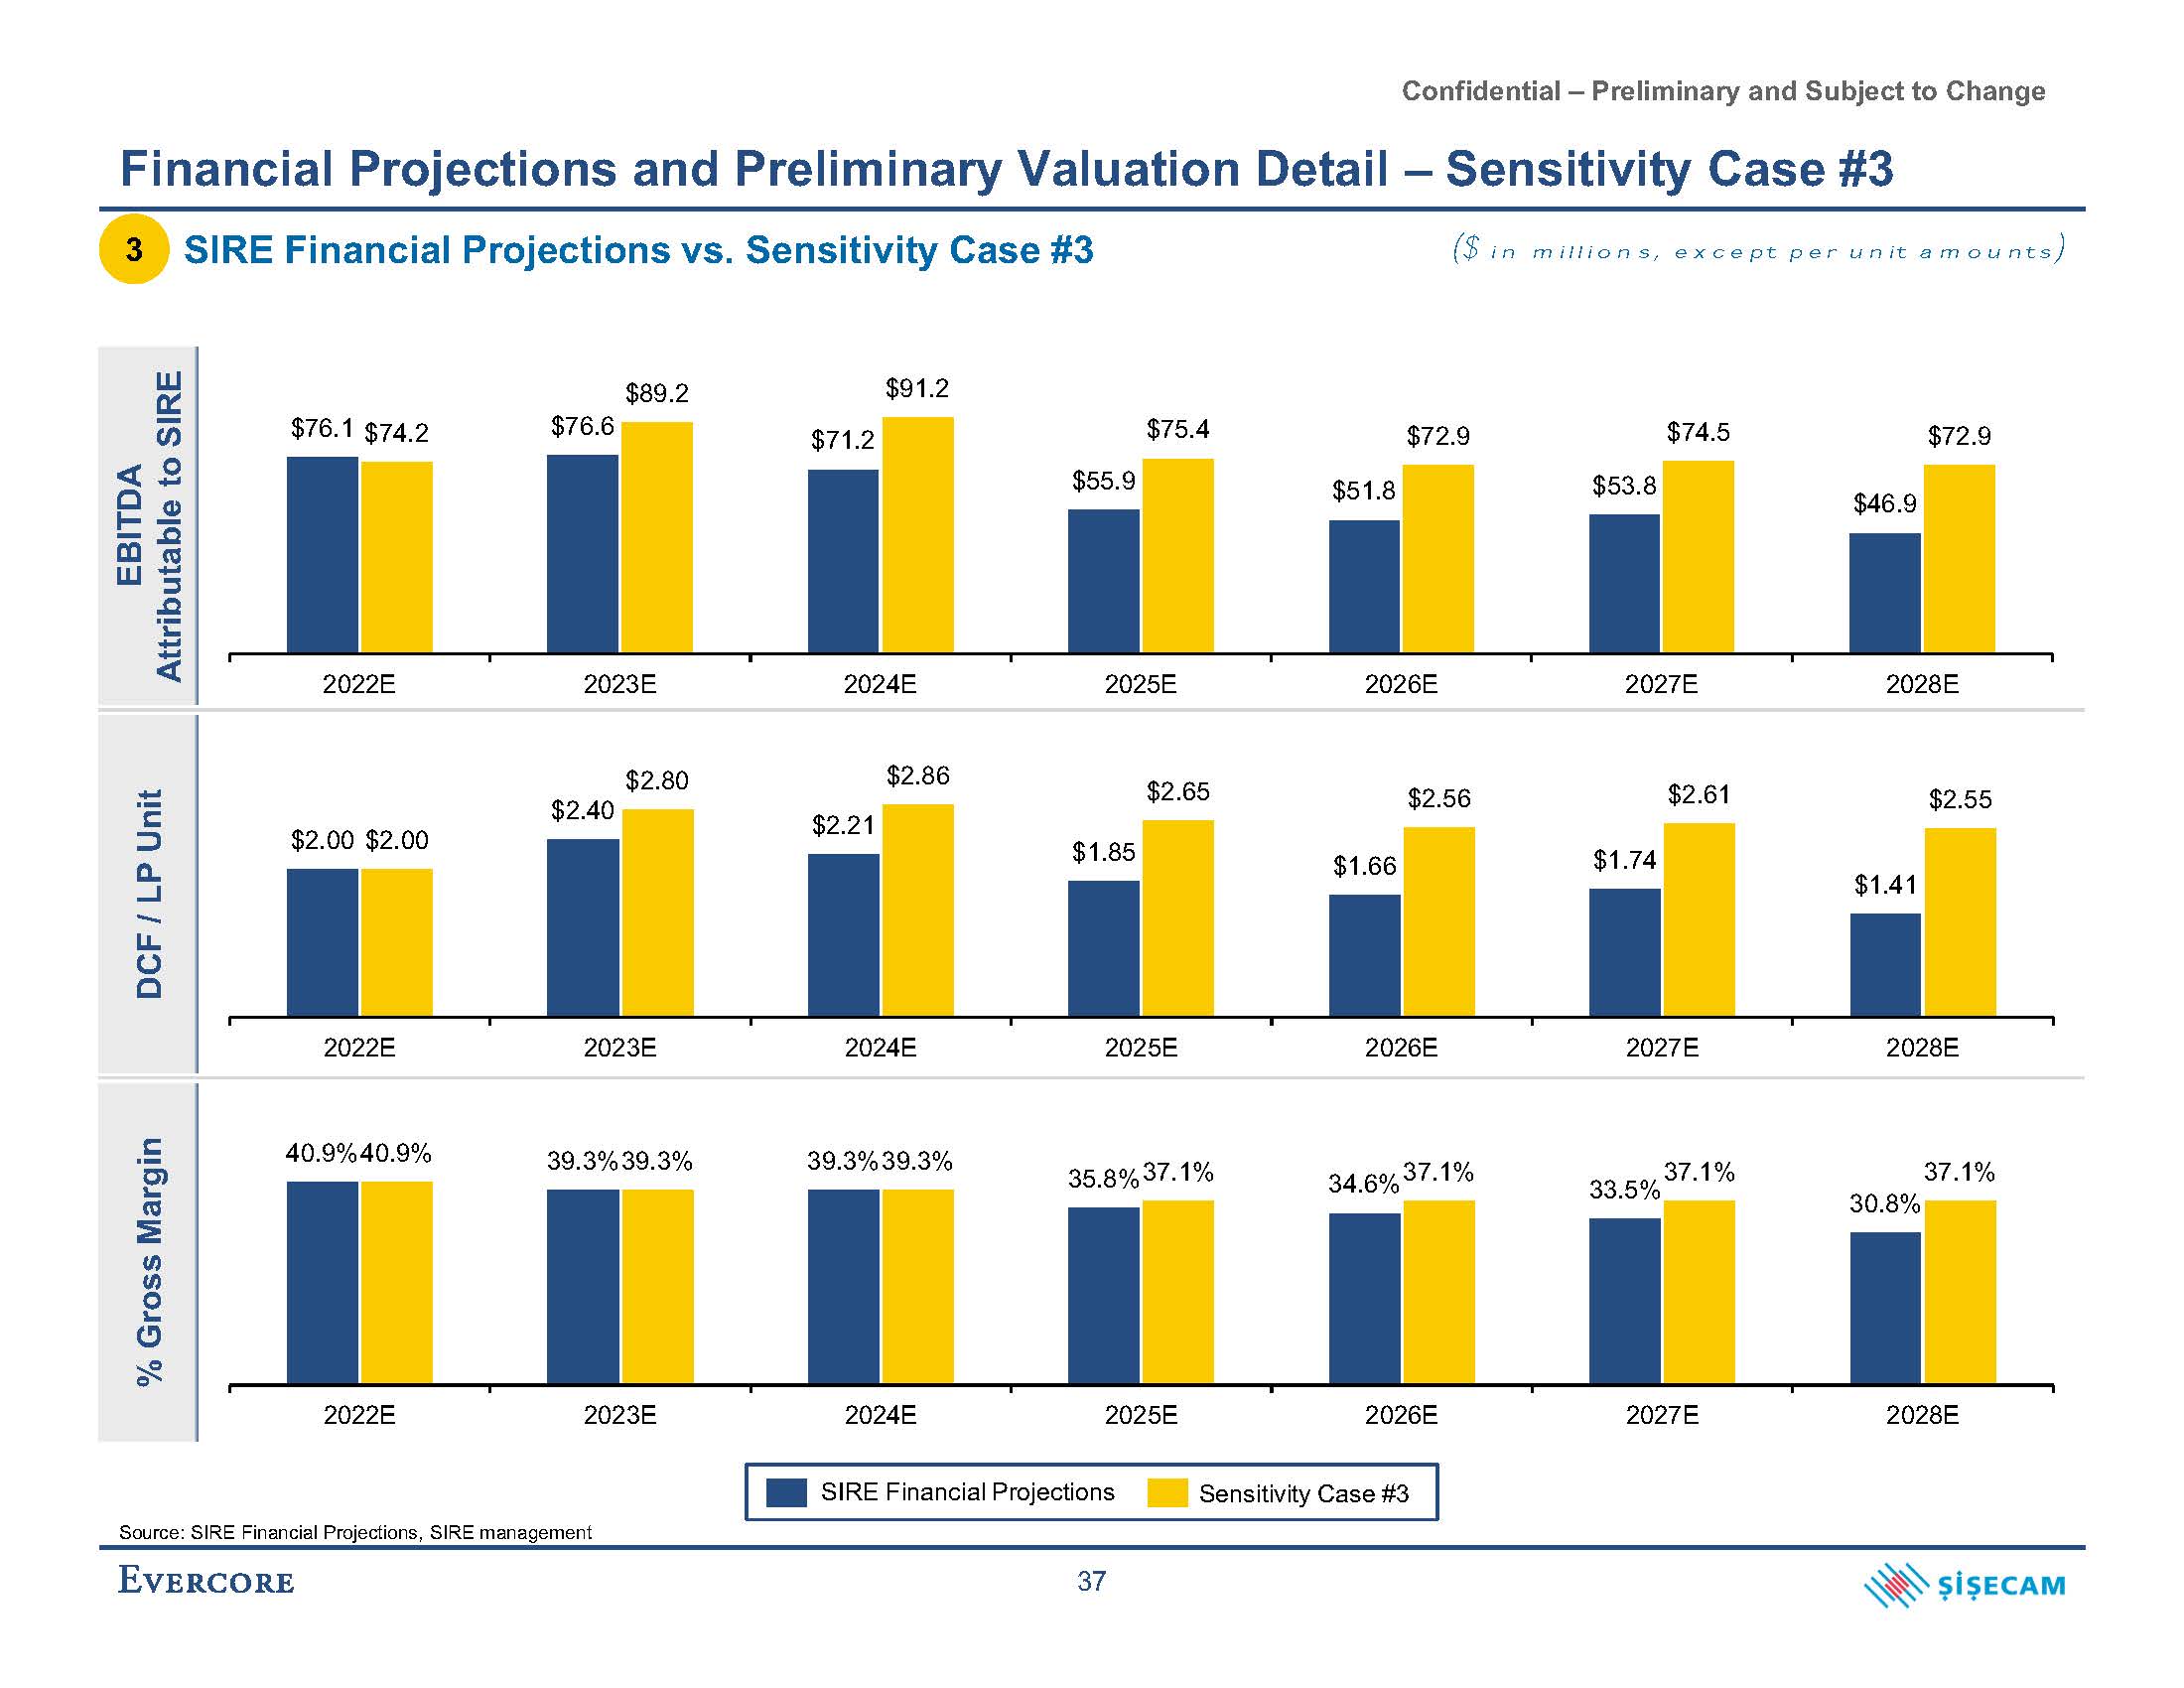
Confidential – Preliminary and Subject to Change 30.8% 40.9% 40.9% 39.3% 39.3% 39.3% 39.3% 35.8% 37.1% 34.6% 37.1% 33.5% 37.1% 37.1% 2022E 2023E 2024E 2025E 2026E 2027E 2028E $2.40 $2.21 $1.85 $1.66 $1.74 $1.41 $2.00 $2.00 $2.80 $2.86 $2.65 $2.56 $2.61 $2.55 2022E 2023E 2024E 2025E 2026E 2027E 2028E $76.6 $71.2 $55.9 $51.8 $53.8 $46.9 $76.1 $74.2 $89.2 $91.2 $75.4 $72.9 $74.5 $72.9 2022E 2023E 2024E 2025E 2026E 2027E 2028E Financial Projections and Preliminary Valuation Detail – Sensitivity Case #3 SIRE Financial Projections vs. Sensitivity Case #3 SIRE Financial Projections Sensitivity Case #3 EBITDA Attributable to SIRE DCF / LP Unit % Gross Margin ($ in millions, except per unit amounts) Source: SIRE Financial Projections, SIRE management 3
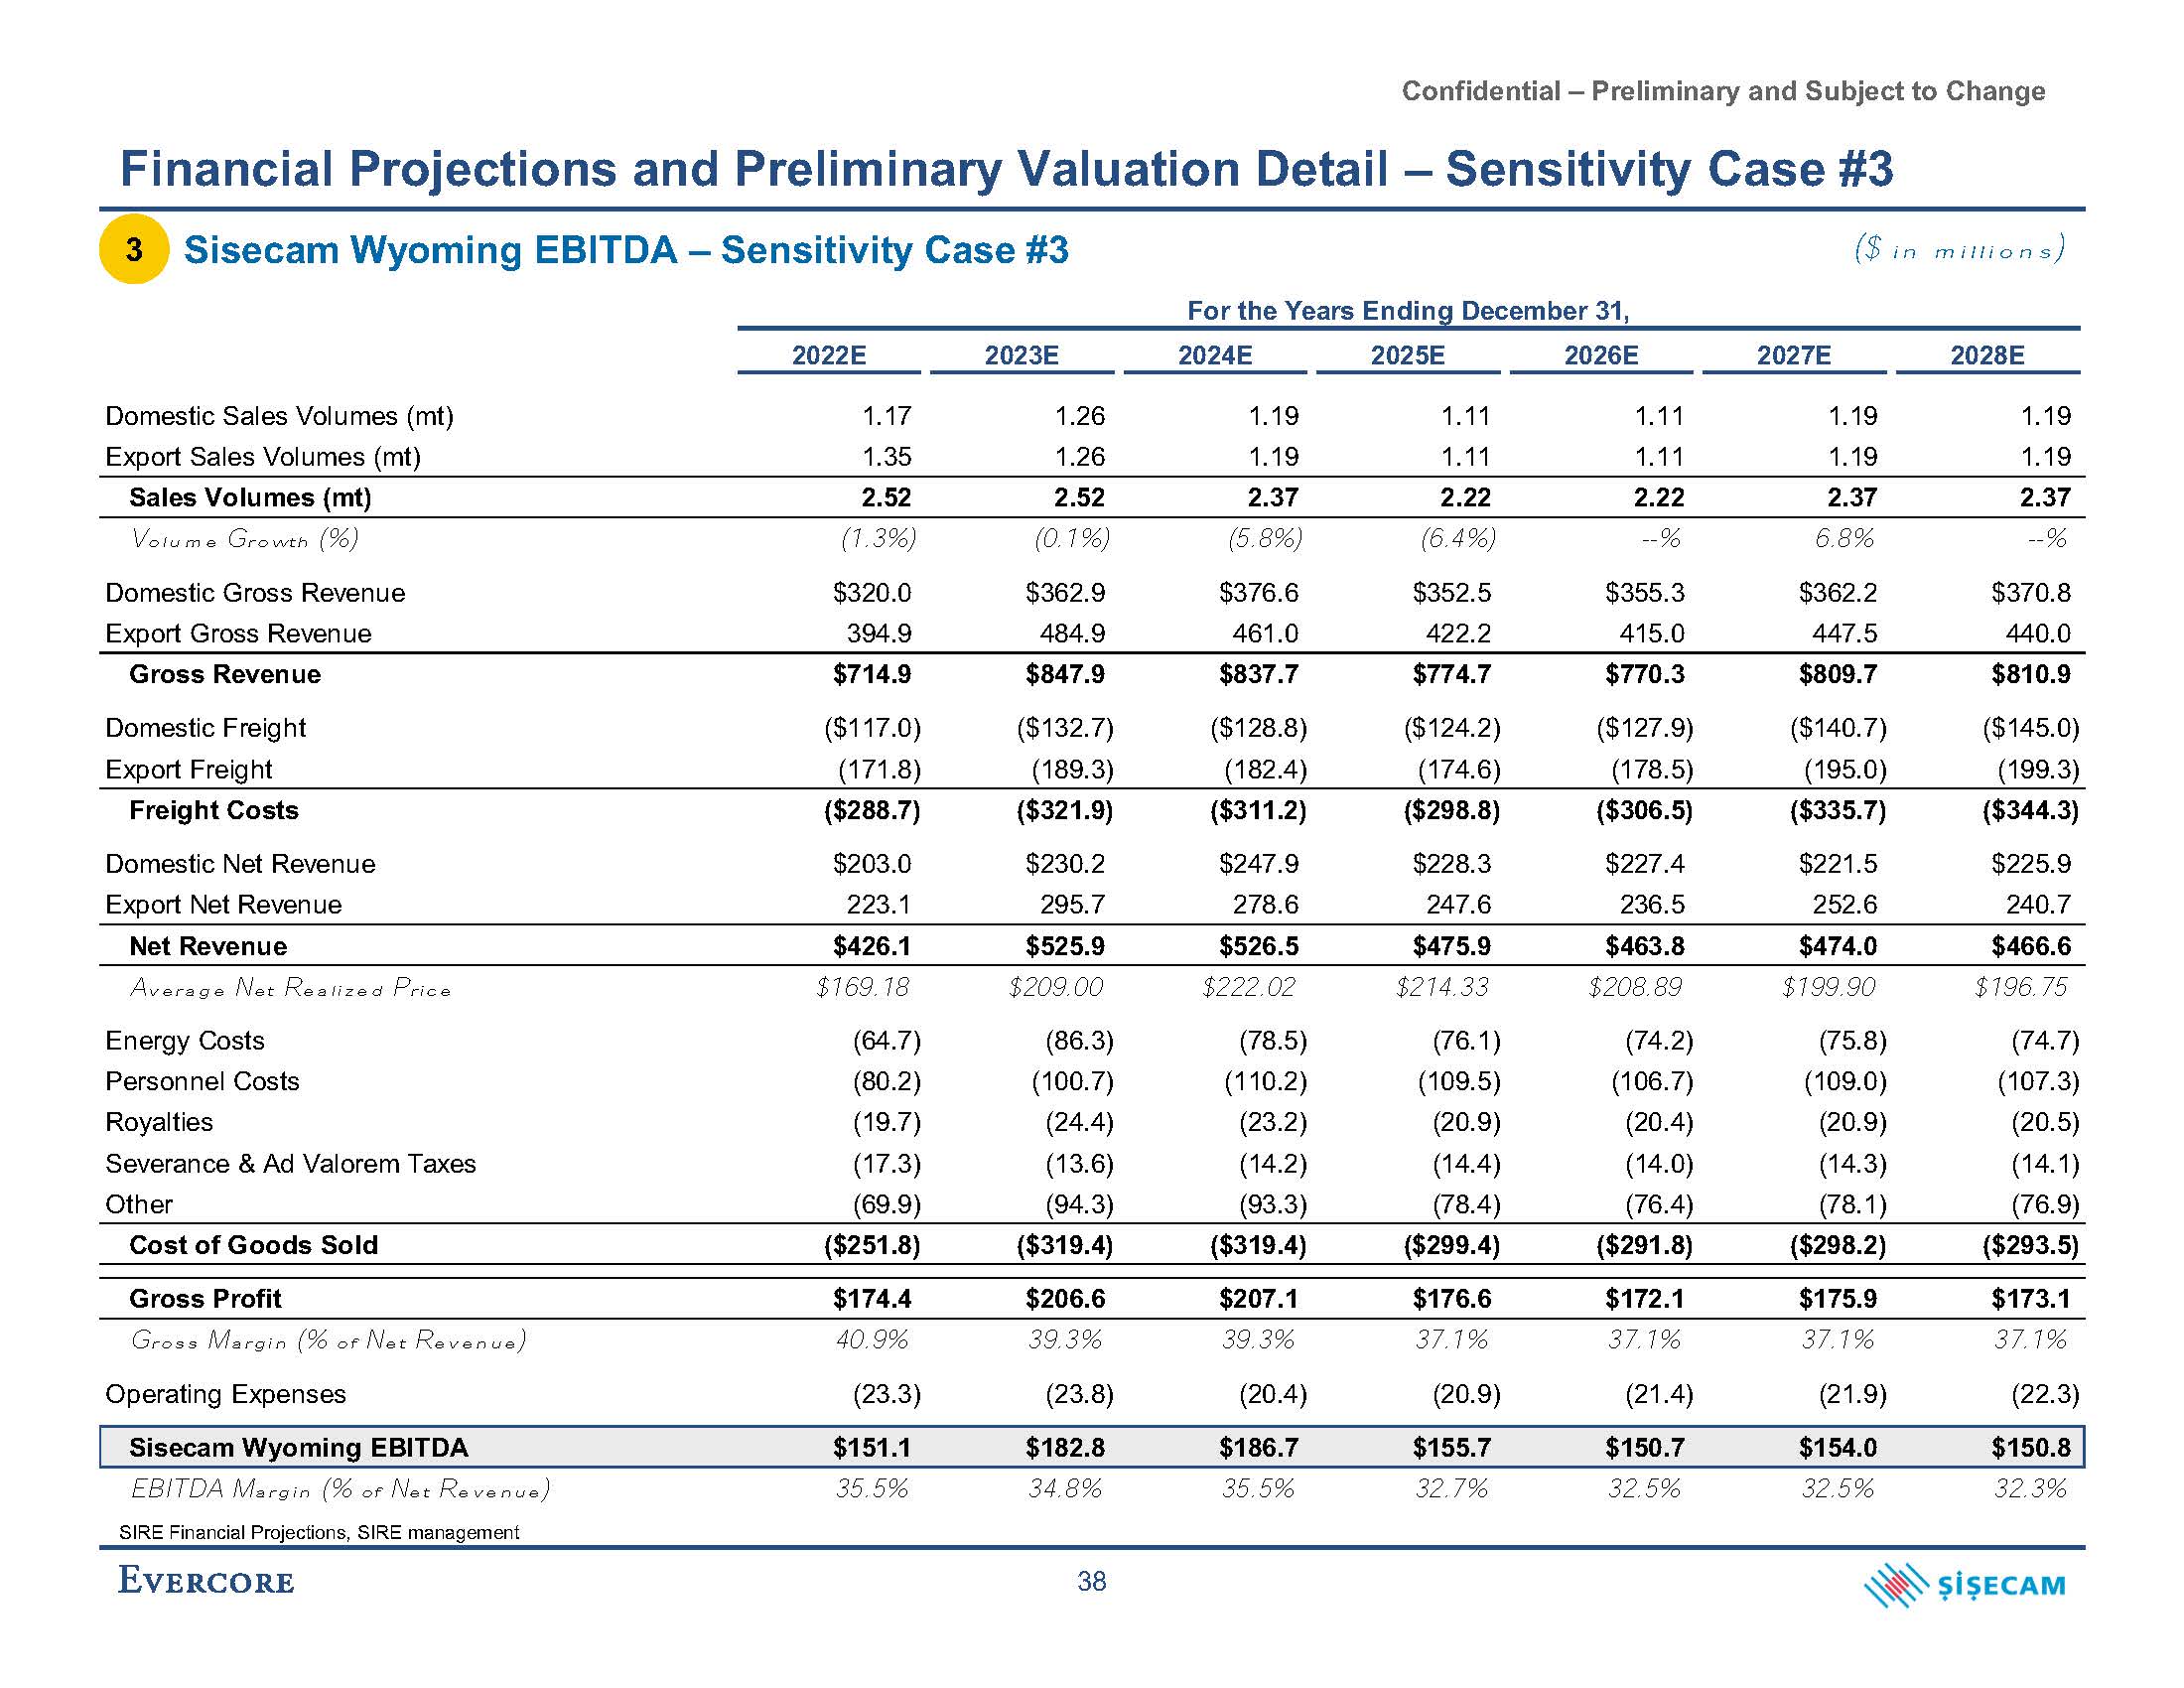
Confidential – Preliminary and Subject to Change Financial Projections and Preliminary Valuation Detail – Sensitivity Case #3 SIRE Financial Projections, SIRE management 38 Sisecam Wyoming EBITDA – Sensitivity Case #3 2022E 2023E 2024E 2025E 2026E 2027E 2028E Domestic Sales Volumes (mt) 1.17 1.26 1.19 1.11 1.11 1.19 1.19 Export Sales Volumes (mt) 1.35 1.26 1.19 1.11 1.11 1.19 1.19 Sales Volumes (mt) 2.52 2.52 2.37 2.22 2.22 2.37 2.37 Volume Growth (%) (1.3%) (0.1%) (5.8%) (6.4%) --% 6.8% --% Domestic Gross Revenue $320.0 $362.9 $376.6 $352.5 $355.3 $362.2 $370.8 Export Gross Revenue 394.9 484.9 461.0 422.2 415.0 447.5 440.0 Gross Revenue $714.9 $847.9 $837.7 $774.7 $770.3 $809.7 $810.9 Domestic Freight ($117.0) ($132.7) ($128.8) ($124.2) ($127.9) ($140.7) ($145.0) Export Freight (171.8) (189.3) (182.4) (174.6) (178.5) (195.0) (199.3) Freight Costs ($288.7) ($321.9) ($311.2) ($298.8) ($306.5) ($335.7) ($344.3) Domestic Net Revenue $203.0 $230.2 $247.9 $228.3 $227.4 $221.5 $225.9 Export Net Revenue 223.1 295.7 278.6 247.6 236.5 252.6 240.7 Net Revenue $426.1 $525.9 $526.5 $475.9 $463.8 $474.0 $466.6 Average Net Realized Price $169.18 $209.00 $222.02 $214.33 $208.89 $199.90 $196.75 Energy Costs (64.7) (86.3) (78.5) (76.1) (74.2) (75.8) (74.7) Personnel Costs (80.2) (100.7) (110.2) (109.5) (106.7) (109.0) (107.3) Royalties (19.7) (24.4) (23.2) (20.9) (20.4) (20.9) (20.5) Severance & Ad Valorem Taxes (17.3) (13.6) (14.2) (14.4) (14.0) (14.3) (14.1) Other (69.9) (94.3) (93.3) (78.4) (76.4) (78.1) (76.9) Cost of Goods Sold ($251.8) ($319.4) ($319.4) ($299.4) ($291.8) ($298.2) ($293.5) Gross Profit $174.4 $206.6 $207.1 $176.6 $172.1 $175.9 $173.1 Gross Margin (% of Net Revenue) 40.9% 39.3% 39.3% 37.1% 37.1% 37.1% 37.1% Operating Expenses (23.3) (23.8) (20.4) (20.9) (21.4) (21.9) (22.3) Sisecam Wyoming EBITDA $151.1 $182.8 $186.7 $155.7 $150.7 $154.0 $150.8 EBITDA Margin (% of Net Revenue) 35.5% 34.8% 35.5% 32.7% 32.5% 32.5% 32.3% For the Years Ending December 31, ($ in millions) 3
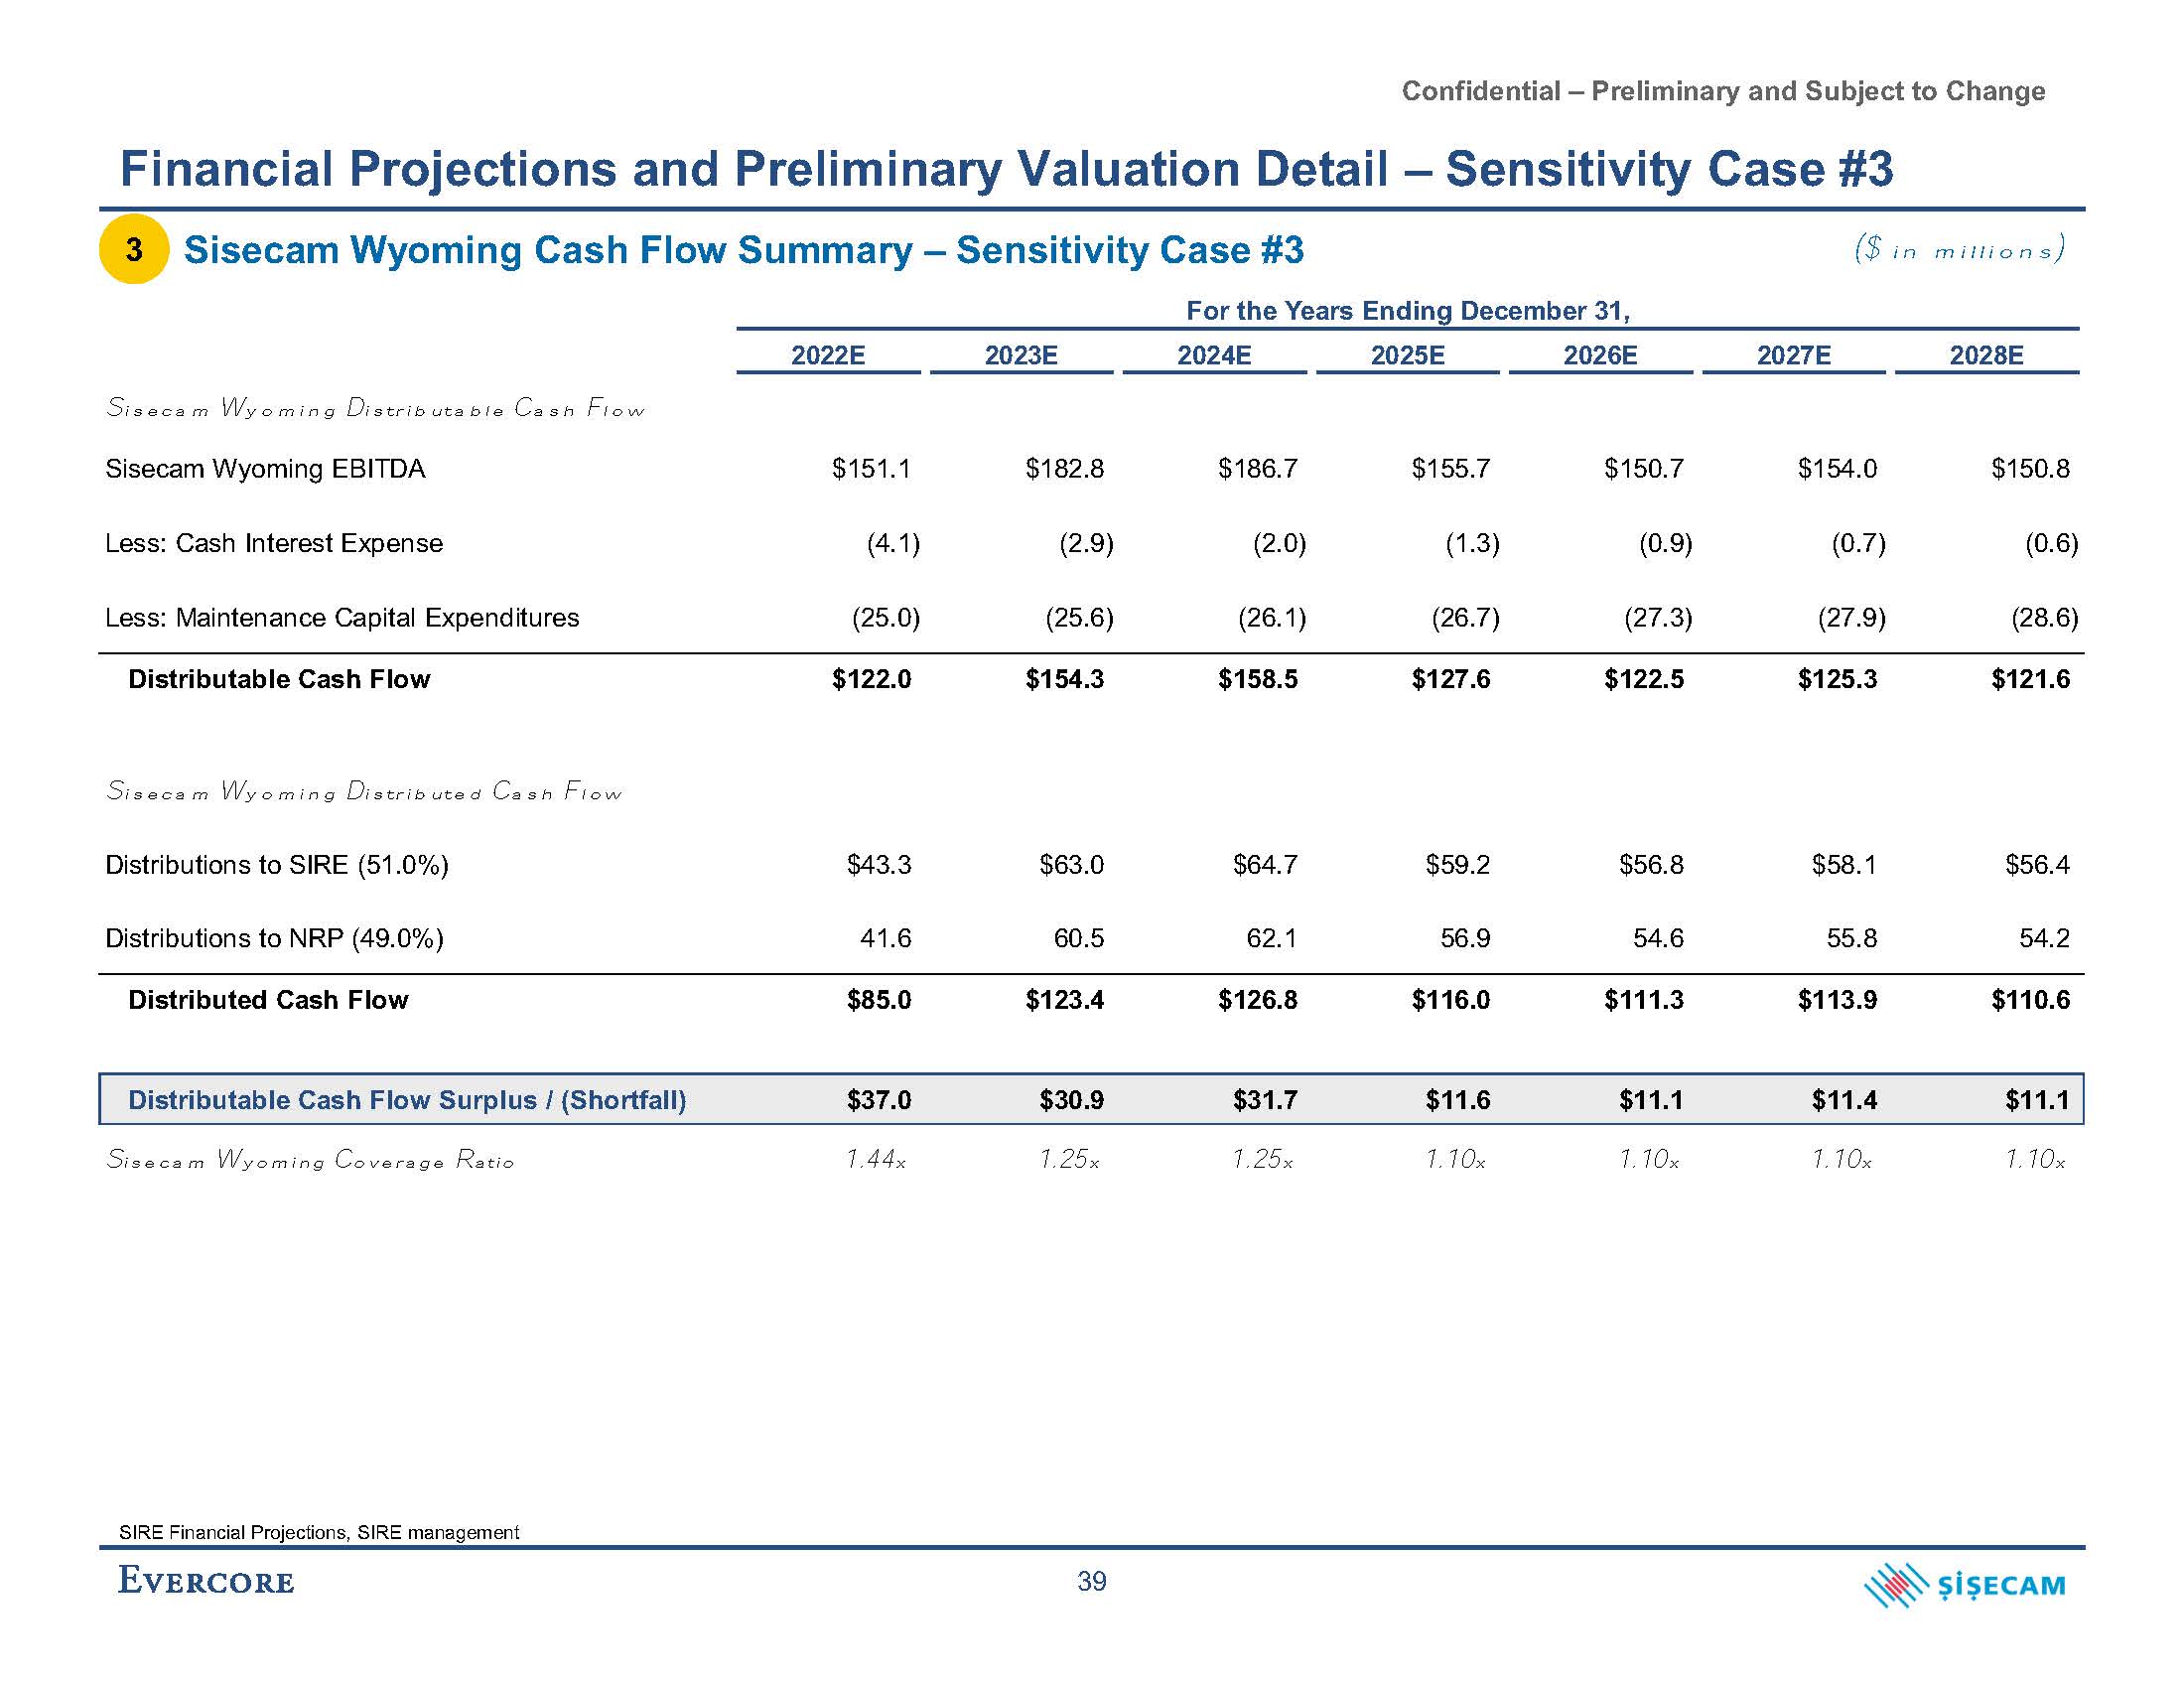
Confidential – Preliminary and Subject to Change Financial Projections and Preliminary Valuation Detail – Sensitivity Case #3 Sisecam Wyoming EBITDA $151.1 $182.8 $186.7 $155.7 $150.7 $154.0 $150.8 Less: Cash Interest Expense (4.1) (2.9) (2.0) (1.3) (0.9) (0.7) (0.6) Less: Maintenance Capital Expenditures (25.0) (25.6) (26.1) (26.7) (27.3) (27.9) (28.6) Distributable Cash Flow $122.0 $154.3 $158.5 $127.6 $122.5 $125.3 $121.6 Sisecam Wyoming Distributed Cash Flow Distributions to SIRE (51.0%) $43.3 $63.0 $64.7 $59.2 $56.8 $58.1 $56.4 Distributions to NRP (49.0%) 41.6 60.5 62.1 56.9 54.6 55.8 54.2 Distributed Cash Flow $85.0 $123.4 $126.8 $116.0 $111.3 $113.9 $110.6 Distributable Cash Flow Surplus / (Shortfall) $37.0 $30.9 $31.7 $11.6 $11.1 $11.4 $11.1 Sisecam Wyoming Coverage Ratio 1.44x 1.25x 1.25x 1.10x 1.10x 1.10x 1.10x Sisecam Wyoming Cash Flow Summary – Sensitivity Case #3 For the Years Ending December 31, 2022E 2023E 2024E 2025E 2026E 2027E 2028E Sisecam Wyoming Distributable Cash Flow SIRE Financial Projections, SIRE management 39 ($ in millions) 3
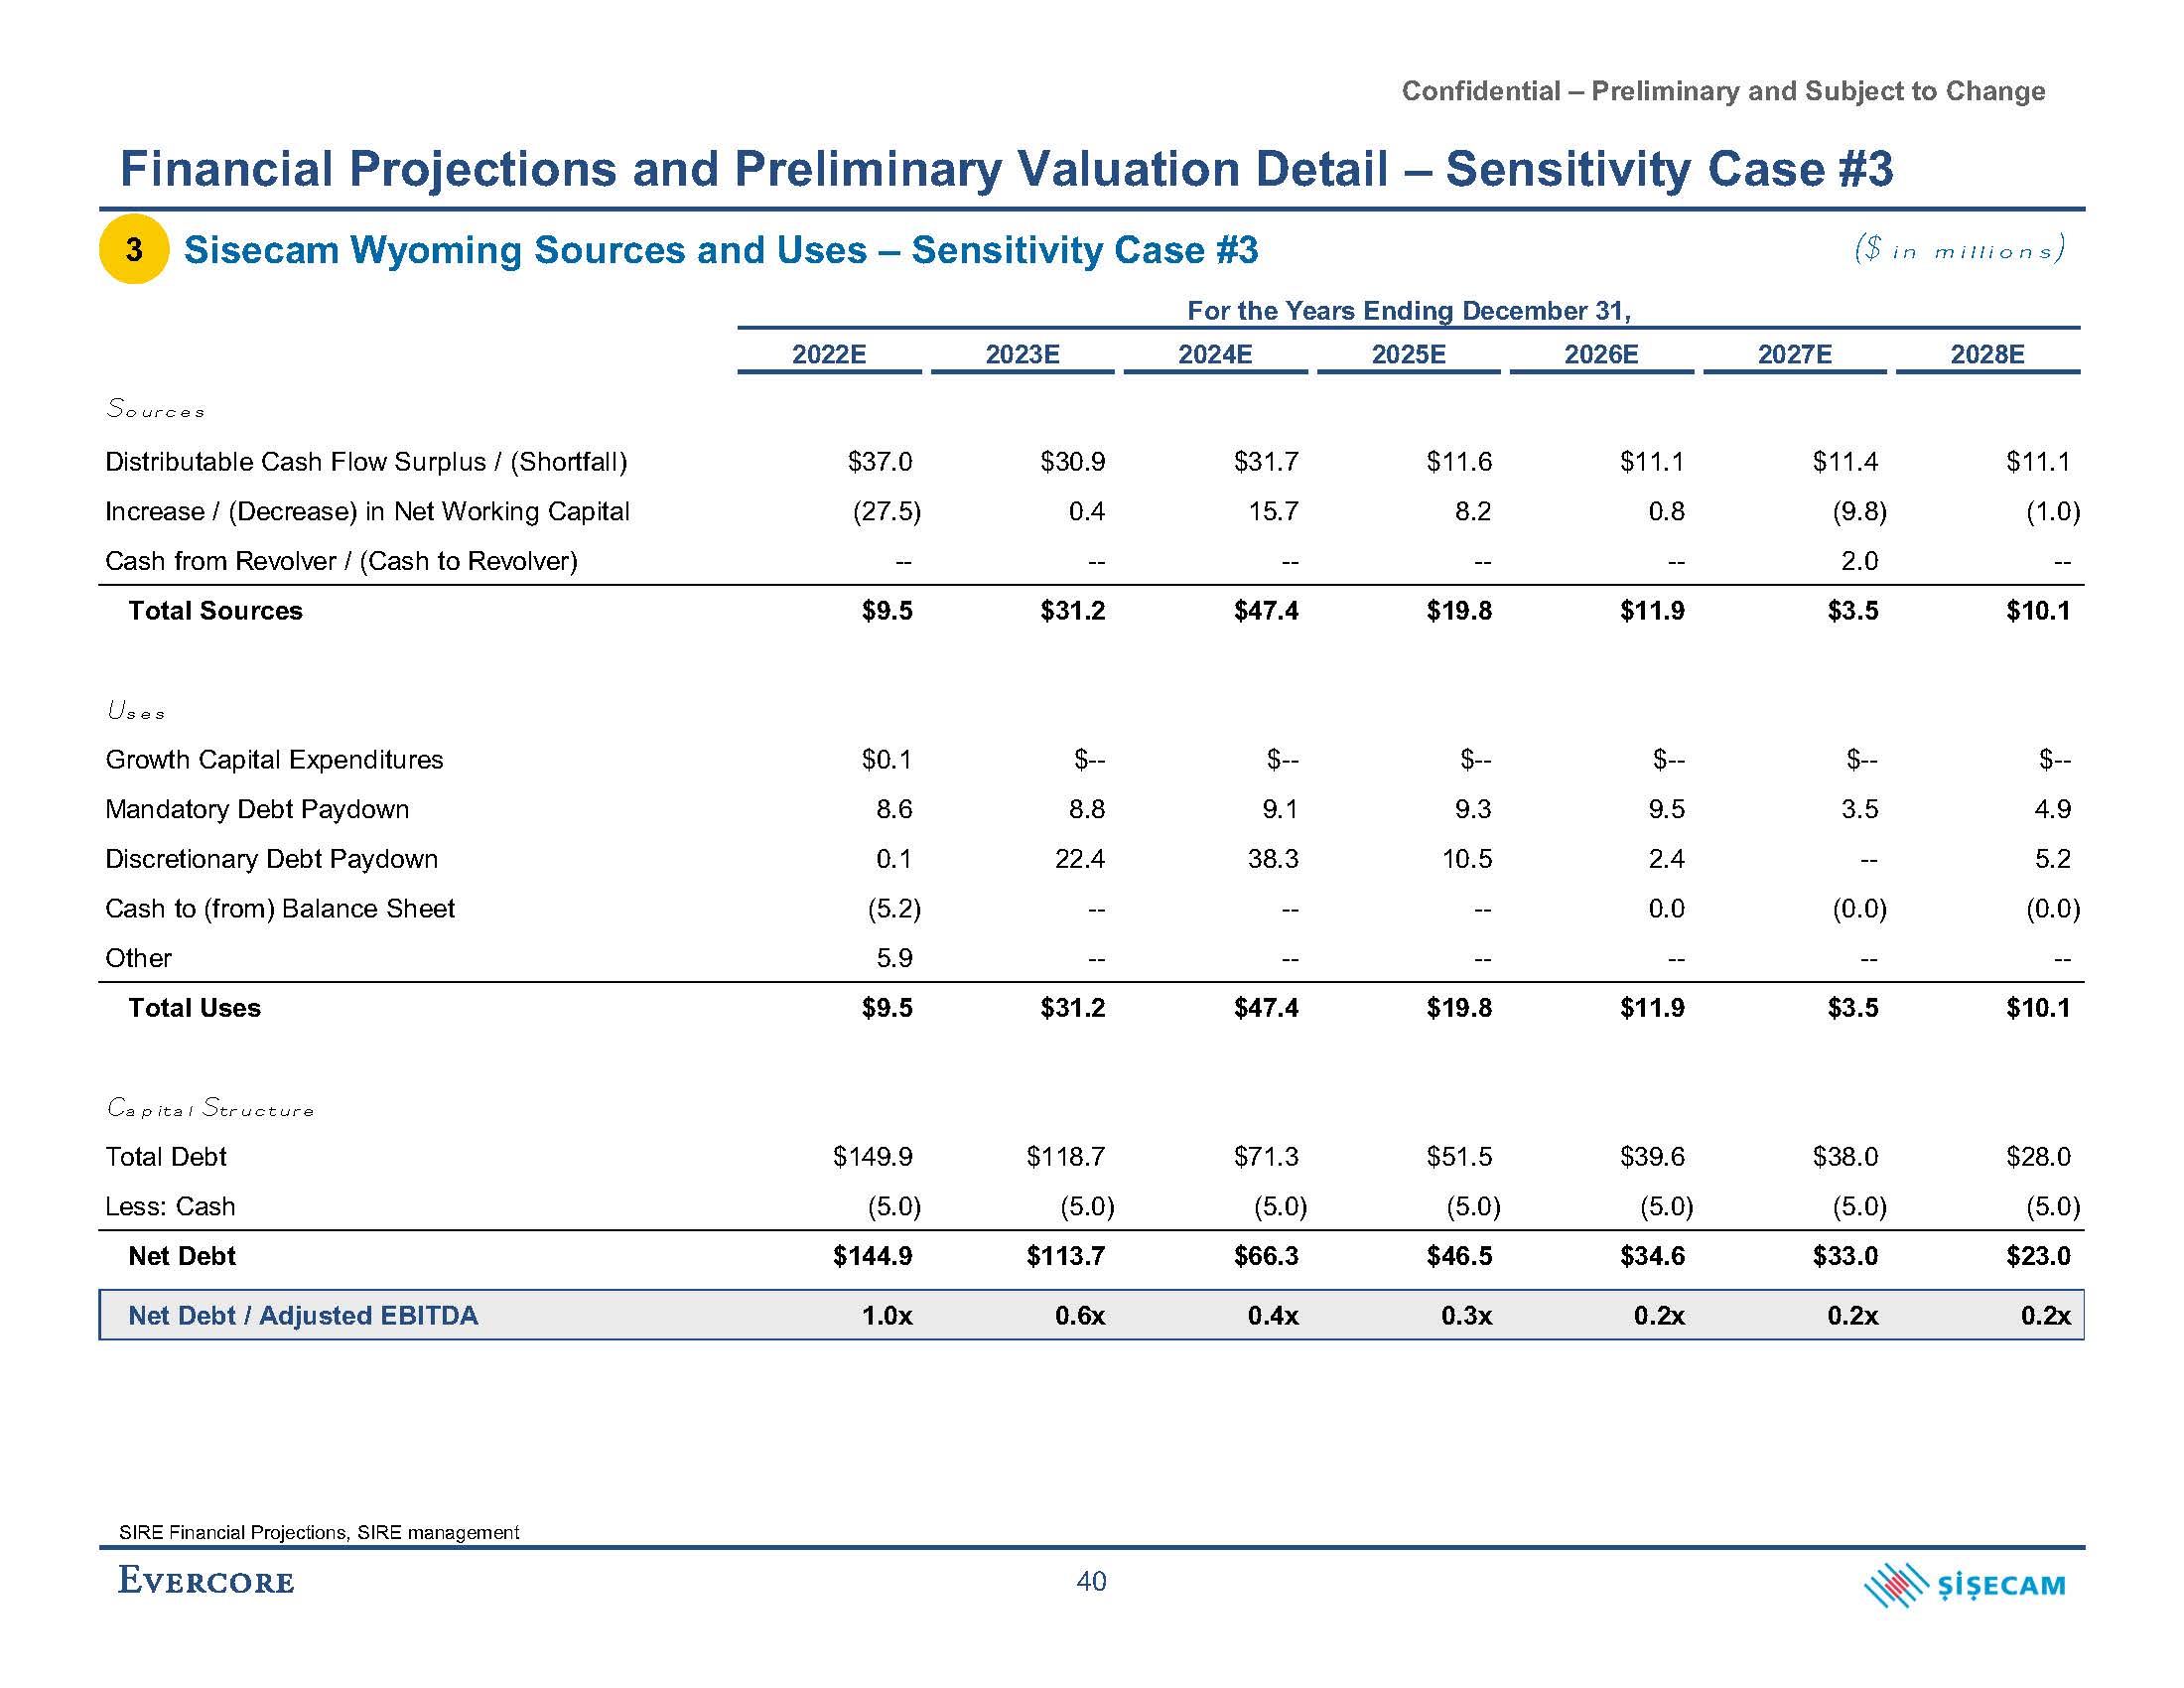
Confidential – Preliminary and Subject to Change Financial Projections and Preliminary Valuation Detail – Sensitivity Case #3 Sisecam Wyoming Sources and Uses – Sensitivity Case #3 For the Years Ending December 31, 2022E 2023E 2024E 2025E 2026E 2027E 20 Sources Distributable Cash Flow Surplus / (Shortfall) $37.0 $30.9 $31.7 $11.6 $11.1 Increase / (Decrease) in Net Working Capital (27.5) Cash from Revolver / (Cash to Revolver) -- 0.4 -- 15.7 -- 8.2 -- 0. Total Sources $9.5 $31.2 $47.4 $19.8 Uses Growth Capital Expenditures $0.1 $-- Mandatory Debt Paydown 8.6 8.8 Discretionary Debt Paydown 0.1 Cash to (from) Balance Sheet Other (5.2) Total Uses Capital Structure Total Debt Less: Cash Net Debt N ($ in millions) SIRE Financial Projections, SIRE management 40 3
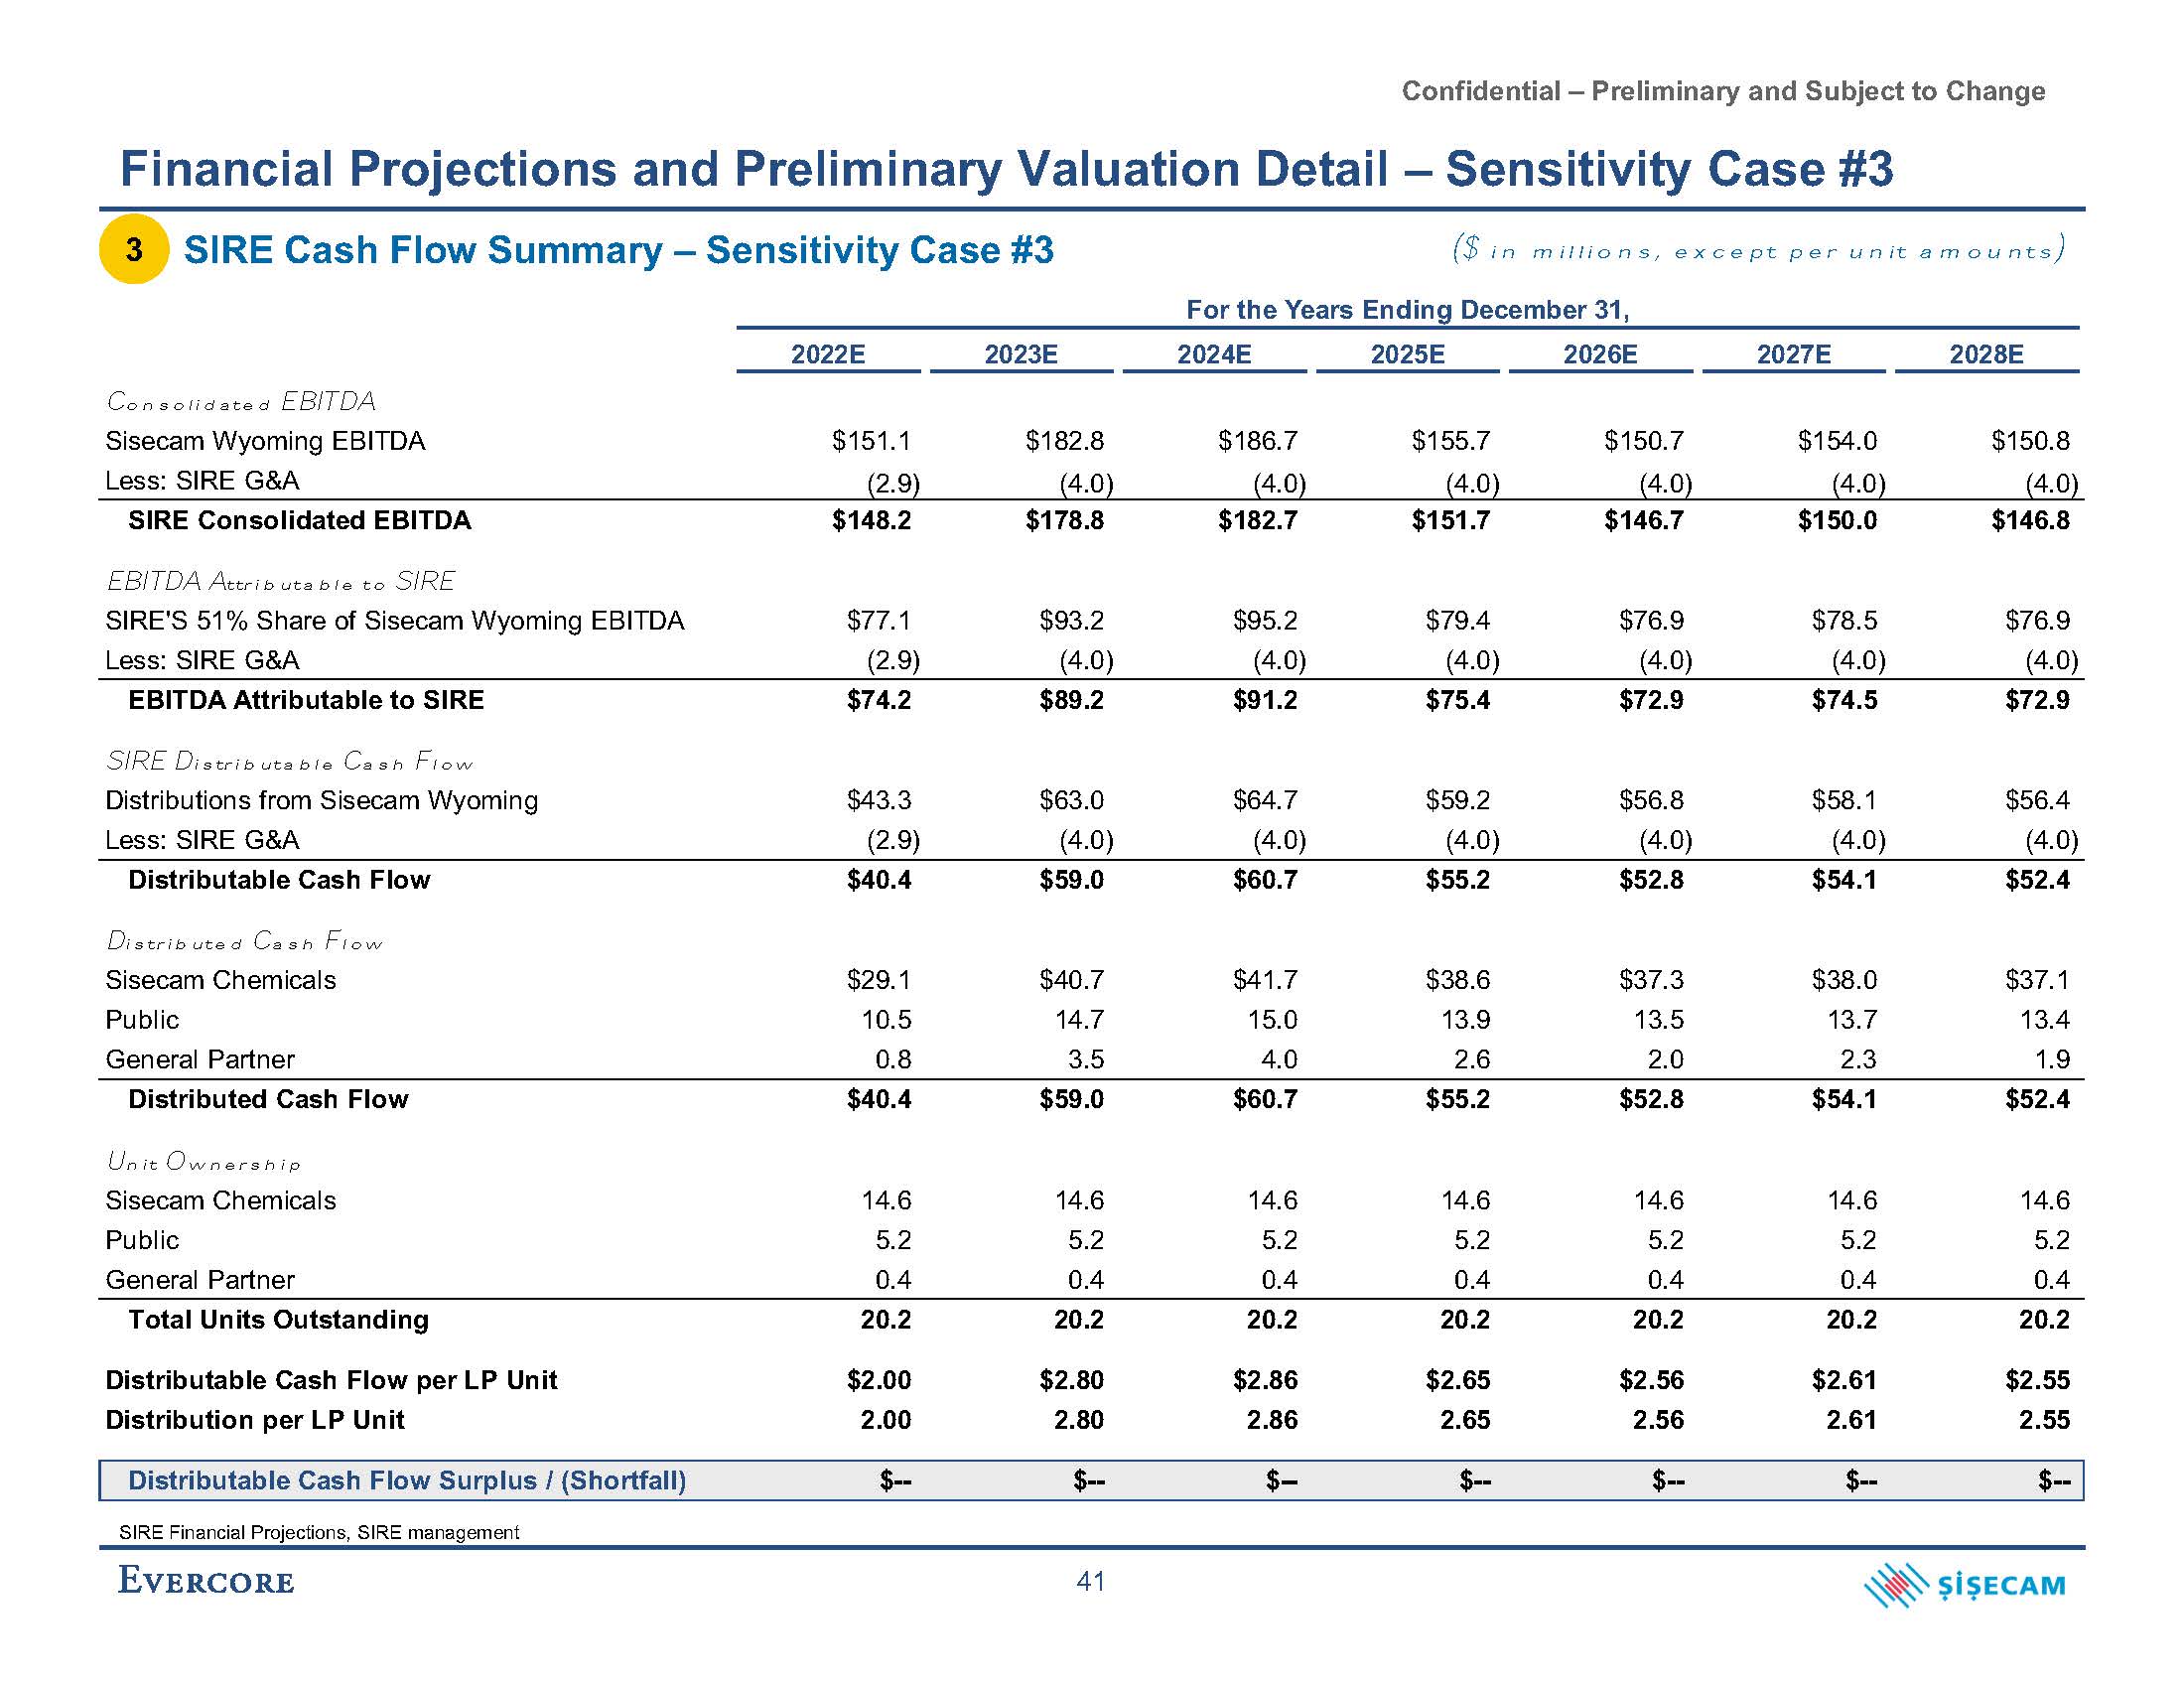
Confidential – Preliminary and Subject to Change Financial Projections and Preliminary Valuation Detail – Sensitivity Case #3 SIRE Financial Projections, SIRE management 41 SIRE Cash Flow Summary – Sensitivity Case #3 2022E 2023E 2024E 2025E 2026E 2027E 2028E Consolidated EBITDA Sisecam Wyoming EBITDA $151.1 $182.8 $186.7 $155.7 $150.7 $154.0 $150.8 Less: SIRE G&A (2.9) (4.0) (4.0) (4.0) (4.0) (4.0) (4.0) SIRE Consolidated EBITDA $148.2 $178.8 $182.7 $151.7 $146.7 $150.0 $146.8 EBITDA Attributable to SIRE SIRE'S 51% Share of Sisecam Wyoming EBITDA $77.1 $93.2 $95.2 $79.4 $76.9 $78.5 $76.9 Less: SIRE G&A (2.9) (4.0) (4.0) (4.0) (4.0) (4.0) (4.0) EBITDA Attributable to SIRE $74.2 $89.2 $91.2 $75.4 $72.9 $74.5 $72.9 SIRE Distributable Cash Flow Distributions from Sisecam Wyoming $43.3 $63.0 $64.7 $59.2 $56.8 $58.1 $56.4 Less: SIRE G&A (2.9) (4.0) (4.0) (4.0) (4.0) (4.0) (4.0) Distributable Cash Flow $40.4 $59.0 $60.7 $55.2 $52.8 $54.1 $52.4 Distributed Cash Flow Sisecam Chemicals $29.1 $40.7 $41.7 $38.6 $37.3 $38.0 $37.1 Public 10.5 14.7 15.0 13.9 13.5 13.7 13.4 General Partner 0.8 3.5 4.0 2.6 2.0 2.3 1.9 Distributed Cash Flow $40.4 $59.0 $60.7 $55.2 $52.8 $54.1 $52.4 Unit Ownership Sisecam Chemicals 14.6 14.6 14.6 14.6 14.6 14.6 14.6 Public 5.2 5.2 5.2 5.2 5.2 5.2 5.2 General Partner 0.4 0.4 0.4 0.4 0.4 0.4 0.4 Total Units Outstanding 20.2 20.2 20.2 20.2 20.2 20.2 20.2 Distributable Cash Flow per LP Unit $2.00 $2.80 $2.86 $2.65 $2.56 $2.61 $2.55 Distribution per LP Unit 2.00 2.80 2.86 2.65 2.56 2.61 2.55 Distributable Cash Flow Surplus / (Shortfall) $-- $-- $-- $-- $-- $-- $-- ($ in millions, except per unit amounts) For the Years Ending December 31, 3
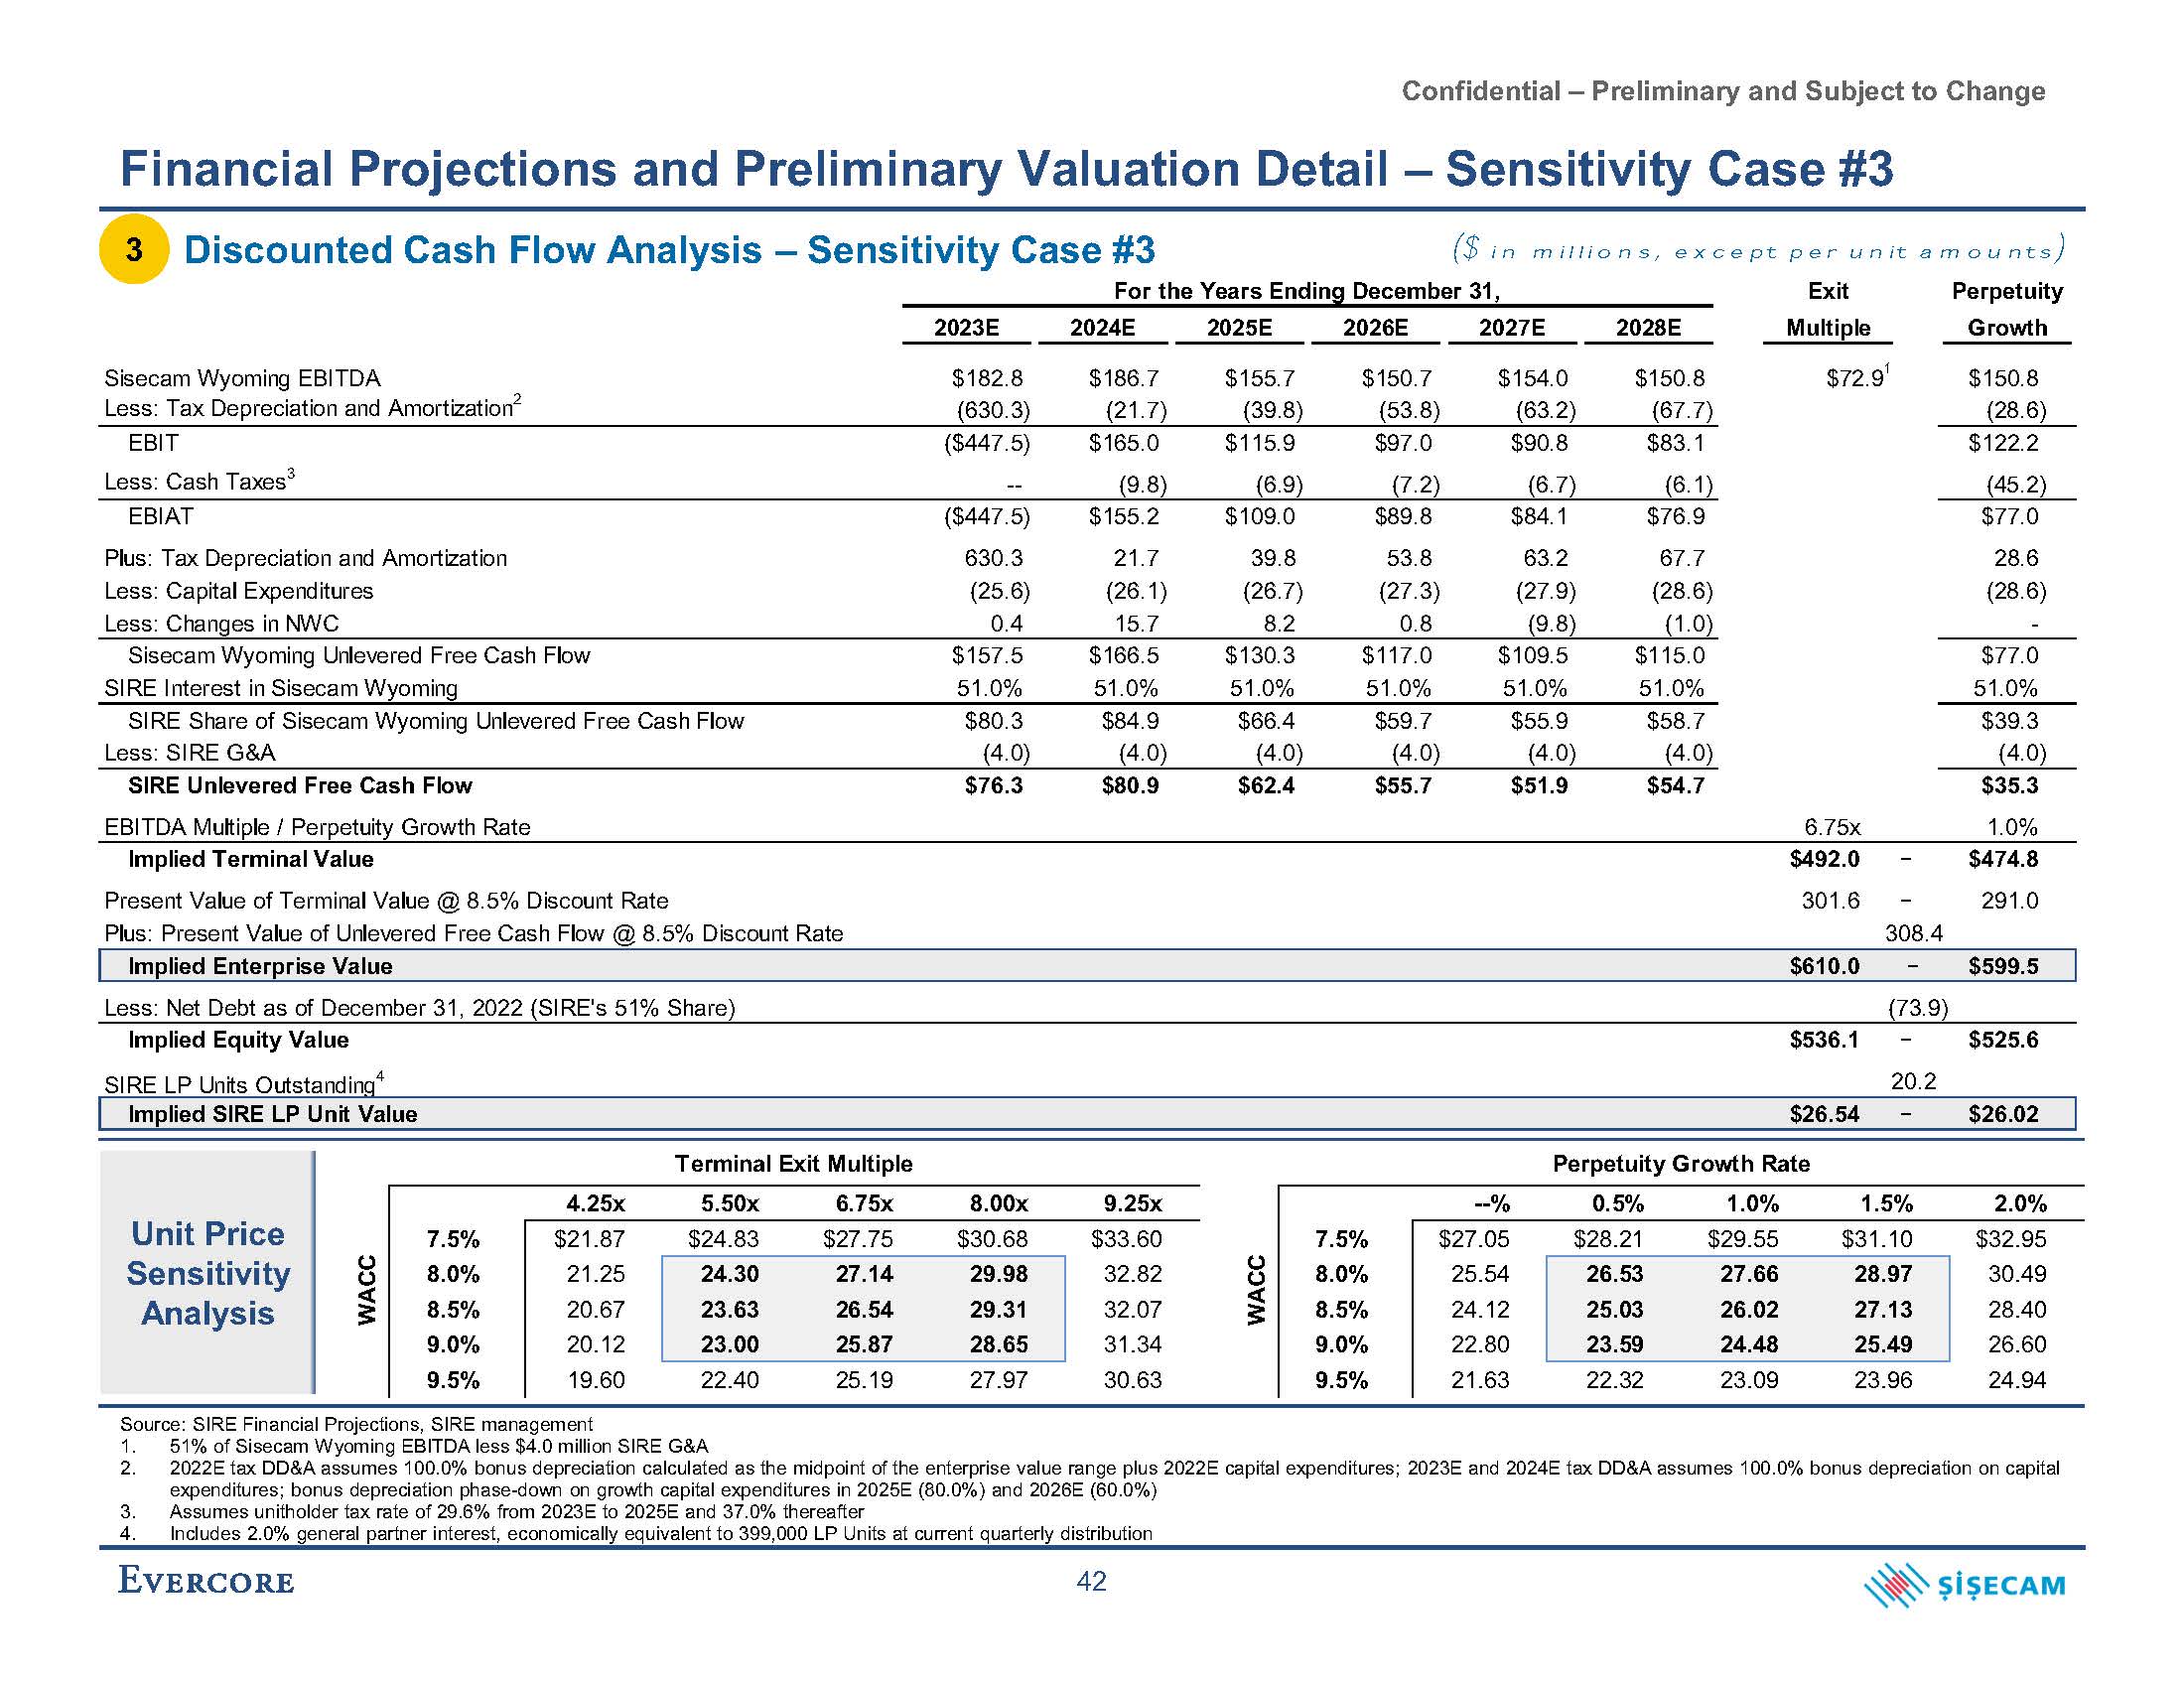
Confidential – Preliminary and Subject to Change 4.25x Terminal Exit Multiple 5.50x 6.75x 8.00x 9.25x --% Perpetuity Growth Rate 0.5% 1.0% 1.5% 2.0% $24.83 $27.75 $30.68 $28.21 $29.55 $31.10 24.30 23.63 23.00 27.14 26.54 25.87 29.98 29.31 28.65 26.53 25.03 23.59 27.66 26.02 24.48 28.97 27.13 25.49 7.5% 8.0% 8.5% 9.0% 9.5% $21.87 21.25 20.67 20.12 19.60 22.40 25.19 27.97 $33.60 32.82 32.07 31.34 30.63 7.5% 8.0% 8.5% 9.0% 9.5% $27.05 25.54 24.12 22.80 21.63 22.32 23.09 23.96 $32.95 30.49 28.40 26.60 24.94 WACC WACC For the Years Ending December 31, 2023E 2024E 2025E 2026E 2027E 2028E Perpetuity Growth Exit Multiple $72.91 Sisecam Wyoming EBITDA Less: Tax Depreciation and Amortization2 $182.8 (630.3) $186.7 (21.7) $155.7 (39.8) $150.7 (53.8) $154.0 (63.2) $150.8 (67.7) $150.8 (28.6) EBIT Less: Cash Taxes3 ($447.5) -- $165.0 (9.8) $115.9 (6.9) $97.0 (7.2) $90.8 (6.7) $83.1 (6.1) $122.2 (45.2) $77.0 28.6 (28.6) EBIAT Plus: Tax Depreciation and Amortization Less: Capital Expenditures Less: Changes in NWC ($447.5) 630.3 (25.6) 0.4 $155.2 21.7 (26.1) 15.7 $109.0 39.8 (26.7) 8.2 $89.8 53.8 (27.3) 0.8 $84.1 63.2 (27.9) (9.8) $76.9 67.7 (28.6) (1.0) - Sisecam Wyoming Unlevered Free Cash Flow SIRE Interest in Sisecam Wyoming $157.5 51.0% $166.5 51.0% $130.3 51.0% $117.0 51.0% $109.5 51.0% $115.0 51.0% $77.0 51.0% SIRE Share of Sisecam Wyoming Unlevered Free Cash Flow Less: SIRE G&A $80.3 (4.0) $84.9 (4.0) $66.4 (4.0) $59.7 (4.0) $55.9 (4.0) $58.7 (4.0) $39.3 (4.0) $76.3 $80.9 $62.4 $55.7 $51.9 $54.7 SIRE Unlevered Free Cash Flow EBITDA Multiple / Perpetuity Growth Rate 6.75x $35.3 1.0% $474.8 291.0 Implied Terminal Value Present Value of Terminal Value @ 8.5% Discount Rate Plus: Present Value of Unlevered Free Cash Flow @ 8.5% Discount Rate $492.0 − 301.6 − 308.4 Implied Enterprise Value $610.0 − $599.5 Less: Net Debt as of December 31, 2022 (SIRE's 51% Share) (73.9) $525.6 Implied Equity Value SIRE LP Units Outstanding4 $536.1 − 20.2 Implied SIRE LP Unit Value $26.54 − $26.02 Financial Projections and Preliminary Valuation Detail – Sensitivity Case #3 Unit Price Sensitivity Analysis 4. Includes 2.0% general partner interest, economically equivalent to 399,000 LP Units at current quarterly distribution 42 Source: SIRE Financial Projections, SIRE management 51% of Sisecam Wyoming EBITDA less $4.0 million SIRE G&A 2022E tax DD&A assumes 100.0% bonus depreciation calculated as the midpoint of the enterprise value range plus 2022E capital expenditures; 2023E and 2024E tax DD&A assumes 100.0% bonus depreciation on capital expenditures; bonus depreciation phase-down on growth capital expenditures in 2025E (80.0%) and 2026E (60.0%) Assumes unitholder tax rate of 29.6% from 2023E to 2025E and 37.0% thereafter Discounted Cash Flow Analysis – Sensitivity Case #3 ($ in millions, except per unit amounts) 3
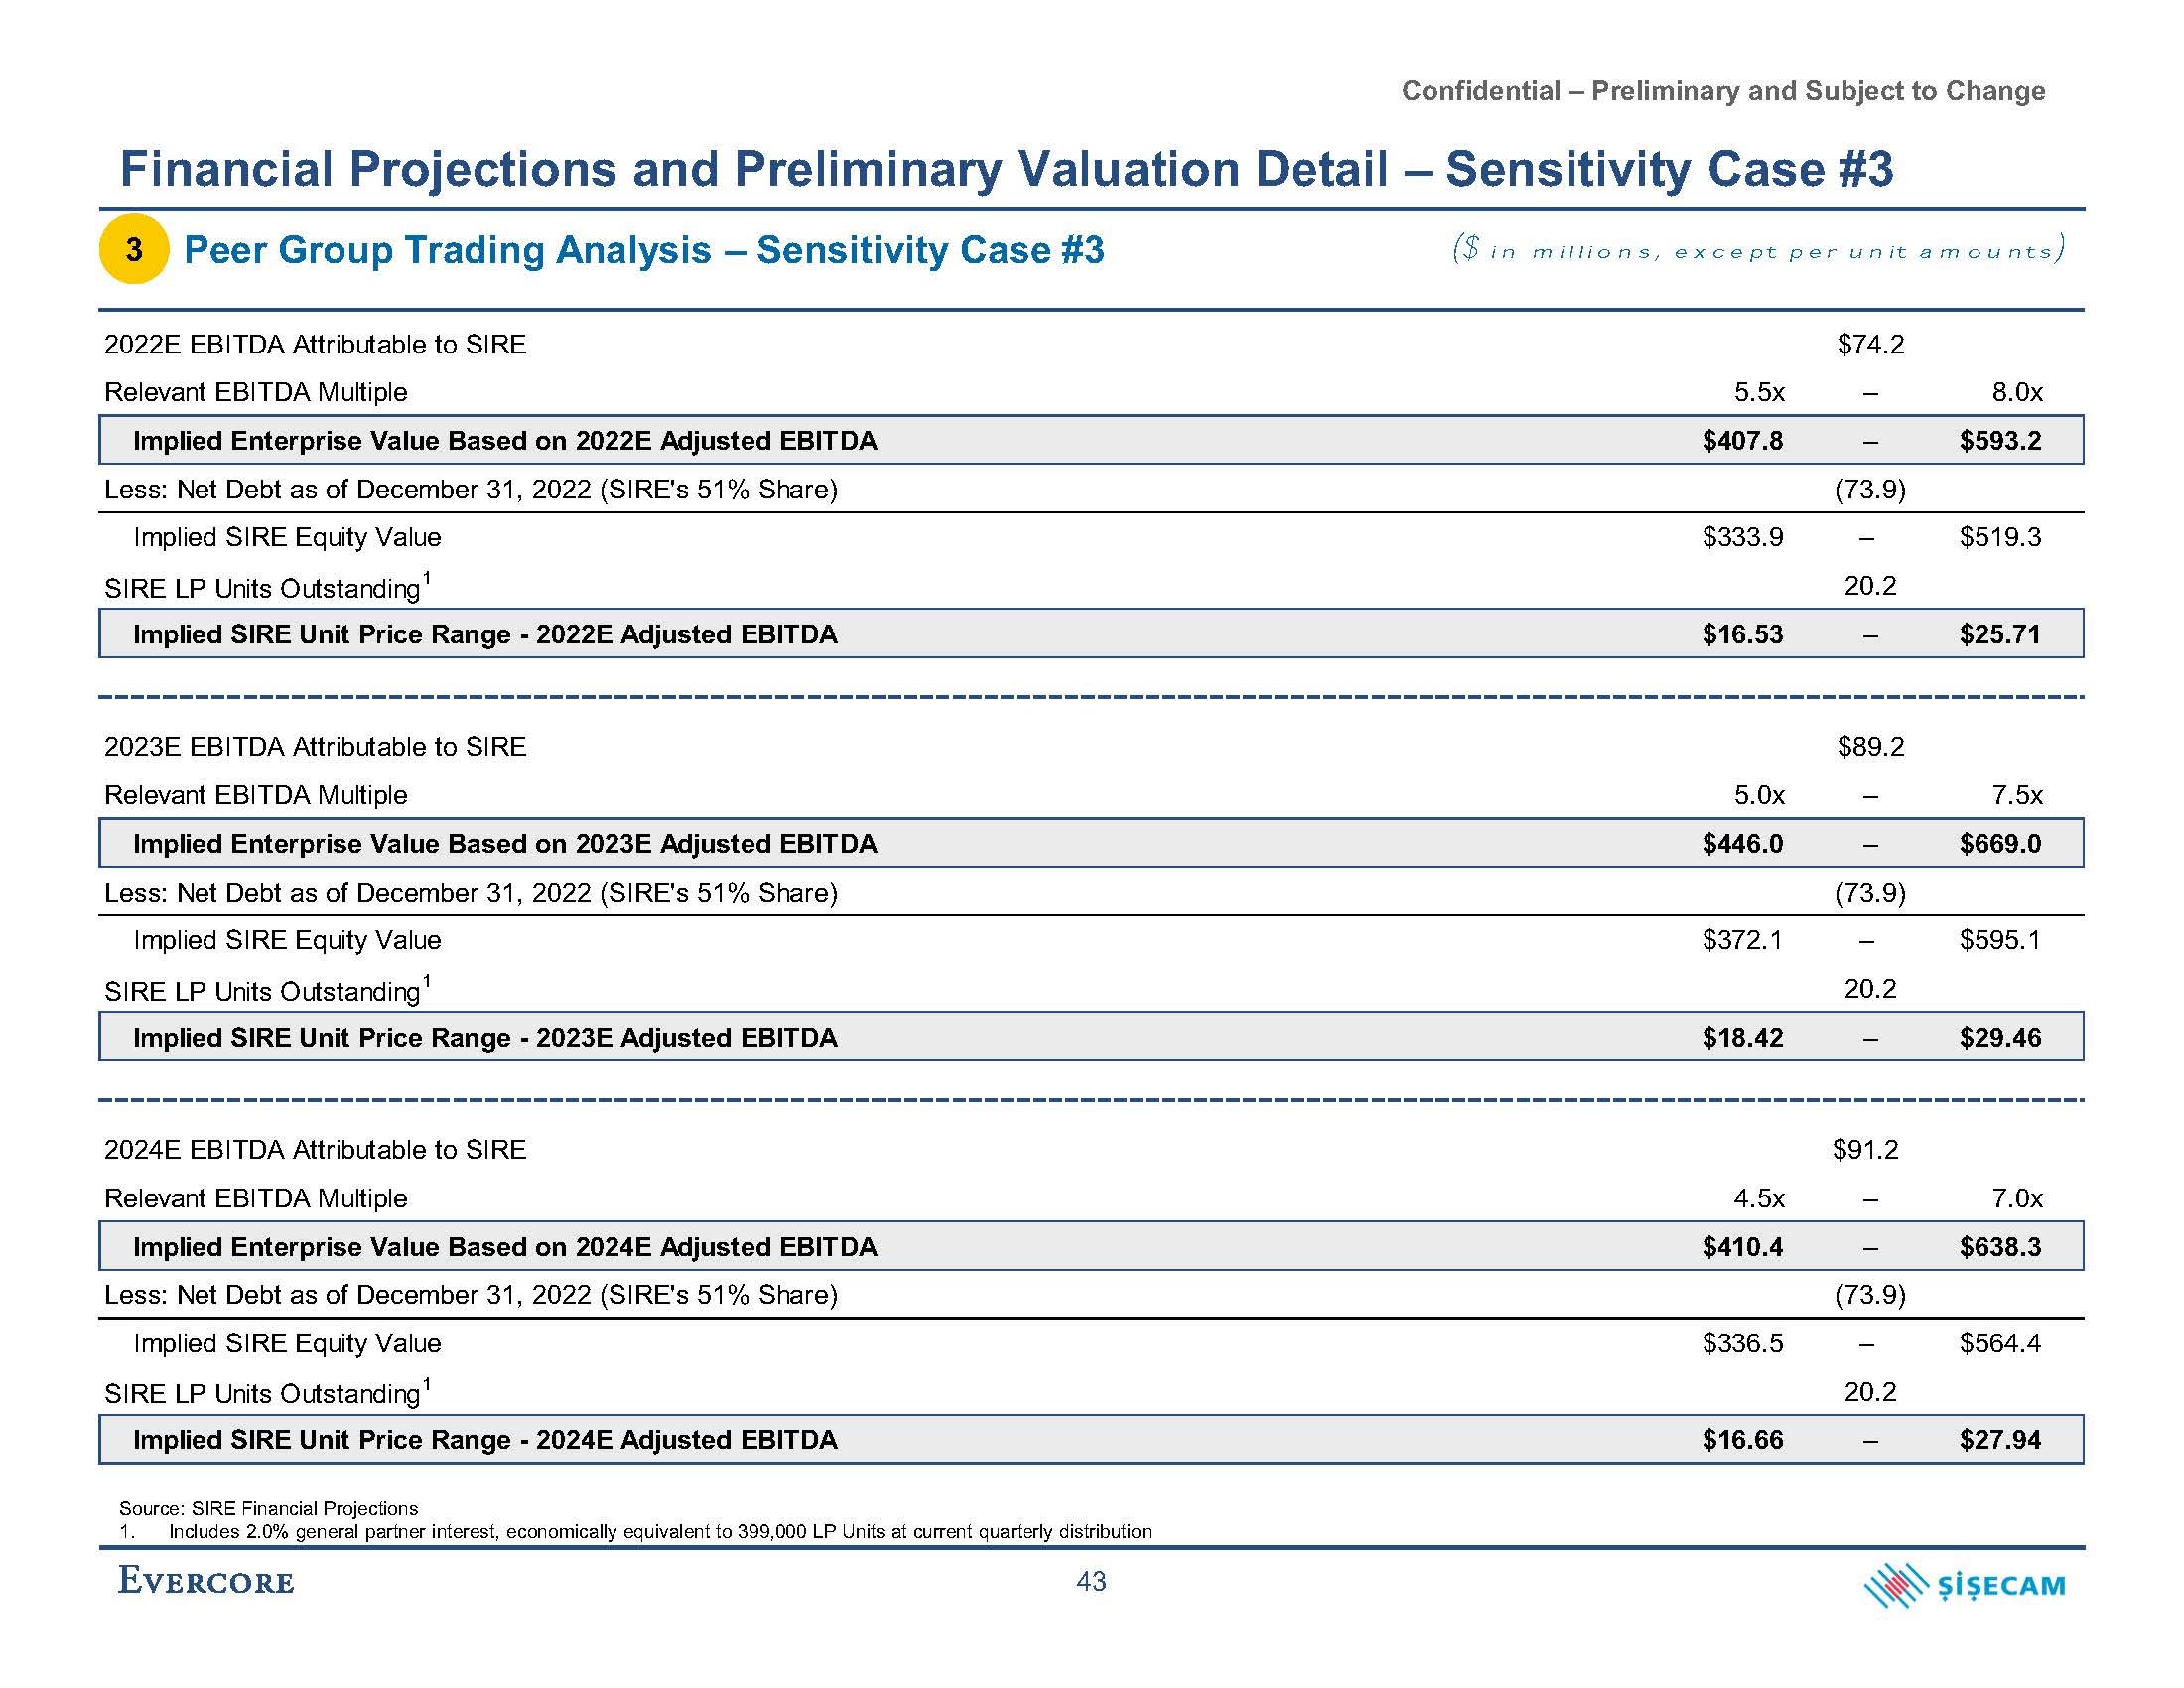
Confidential – Preliminary and Subject to Change Financial Projections and Preliminary Valuation Detail – Sensitivity Case #3 Peer Group Trading Analysis – Sensitivity Case #3 2022E EBITDA Attributable to SIRE Relevant EBITDA Multiple 5.5x $74.2 – 8.0x Implied Enterprise Value Based on 2022E Adjusted EBITDA $407.8 – $593.2 Less: Net Debt as of December 31, 2022 (SIRE's 51% Share) (73.9) Implied SIRE Equity Value SIRE LP Units Outstanding1 $333.9 – 20.2 $519.3 Implied SIRE Unit Price Range - 2022E Adjusted EBITDA $16.53 – $25.71 2023E EBITDA Attributable to SIRE Relevant EBITDA Multiple 5.0x $89.2 – 7.5x Implied Enterprise Value Based on 2023E Adjusted EBITDA $446.0 – $669.0 Less: Net Debt as of December 31, 2022 (SIRE's 51% Share) (73.9) Implied SIRE Equity Value SIRE LP Units Outstanding1 $372.1 – 20.2 $595.1 Implied SIRE Unit Price Range - 2023E Adjusted EBITDA $18.42 – $29.46 2024E EBITDA Attributable to SIRE Relevant EBITDA Multiple 4.5x $91.2 – 7.0x Implied Enterprise Value Based on 2024E Adjusted EBITDA $410.4 – $638.3 Less: Net Debt as of December 31, 2022 (SIRE's 51% Share) (73.9) Implied SIRE Equity Value SIRE LP Units Outstanding1 $336.5 – 20.2 $564.4 Implied SIRE Unit Price Range - 2024E Adjusted EBITDA $16.66 – $27.94 ($ in millions, except per unit amounts) Source: SIRE Financial Projections 1. Includes 2.0% general partner interest, economically equivalent to 399,000 LP Units at current quarterly distribution 43 3
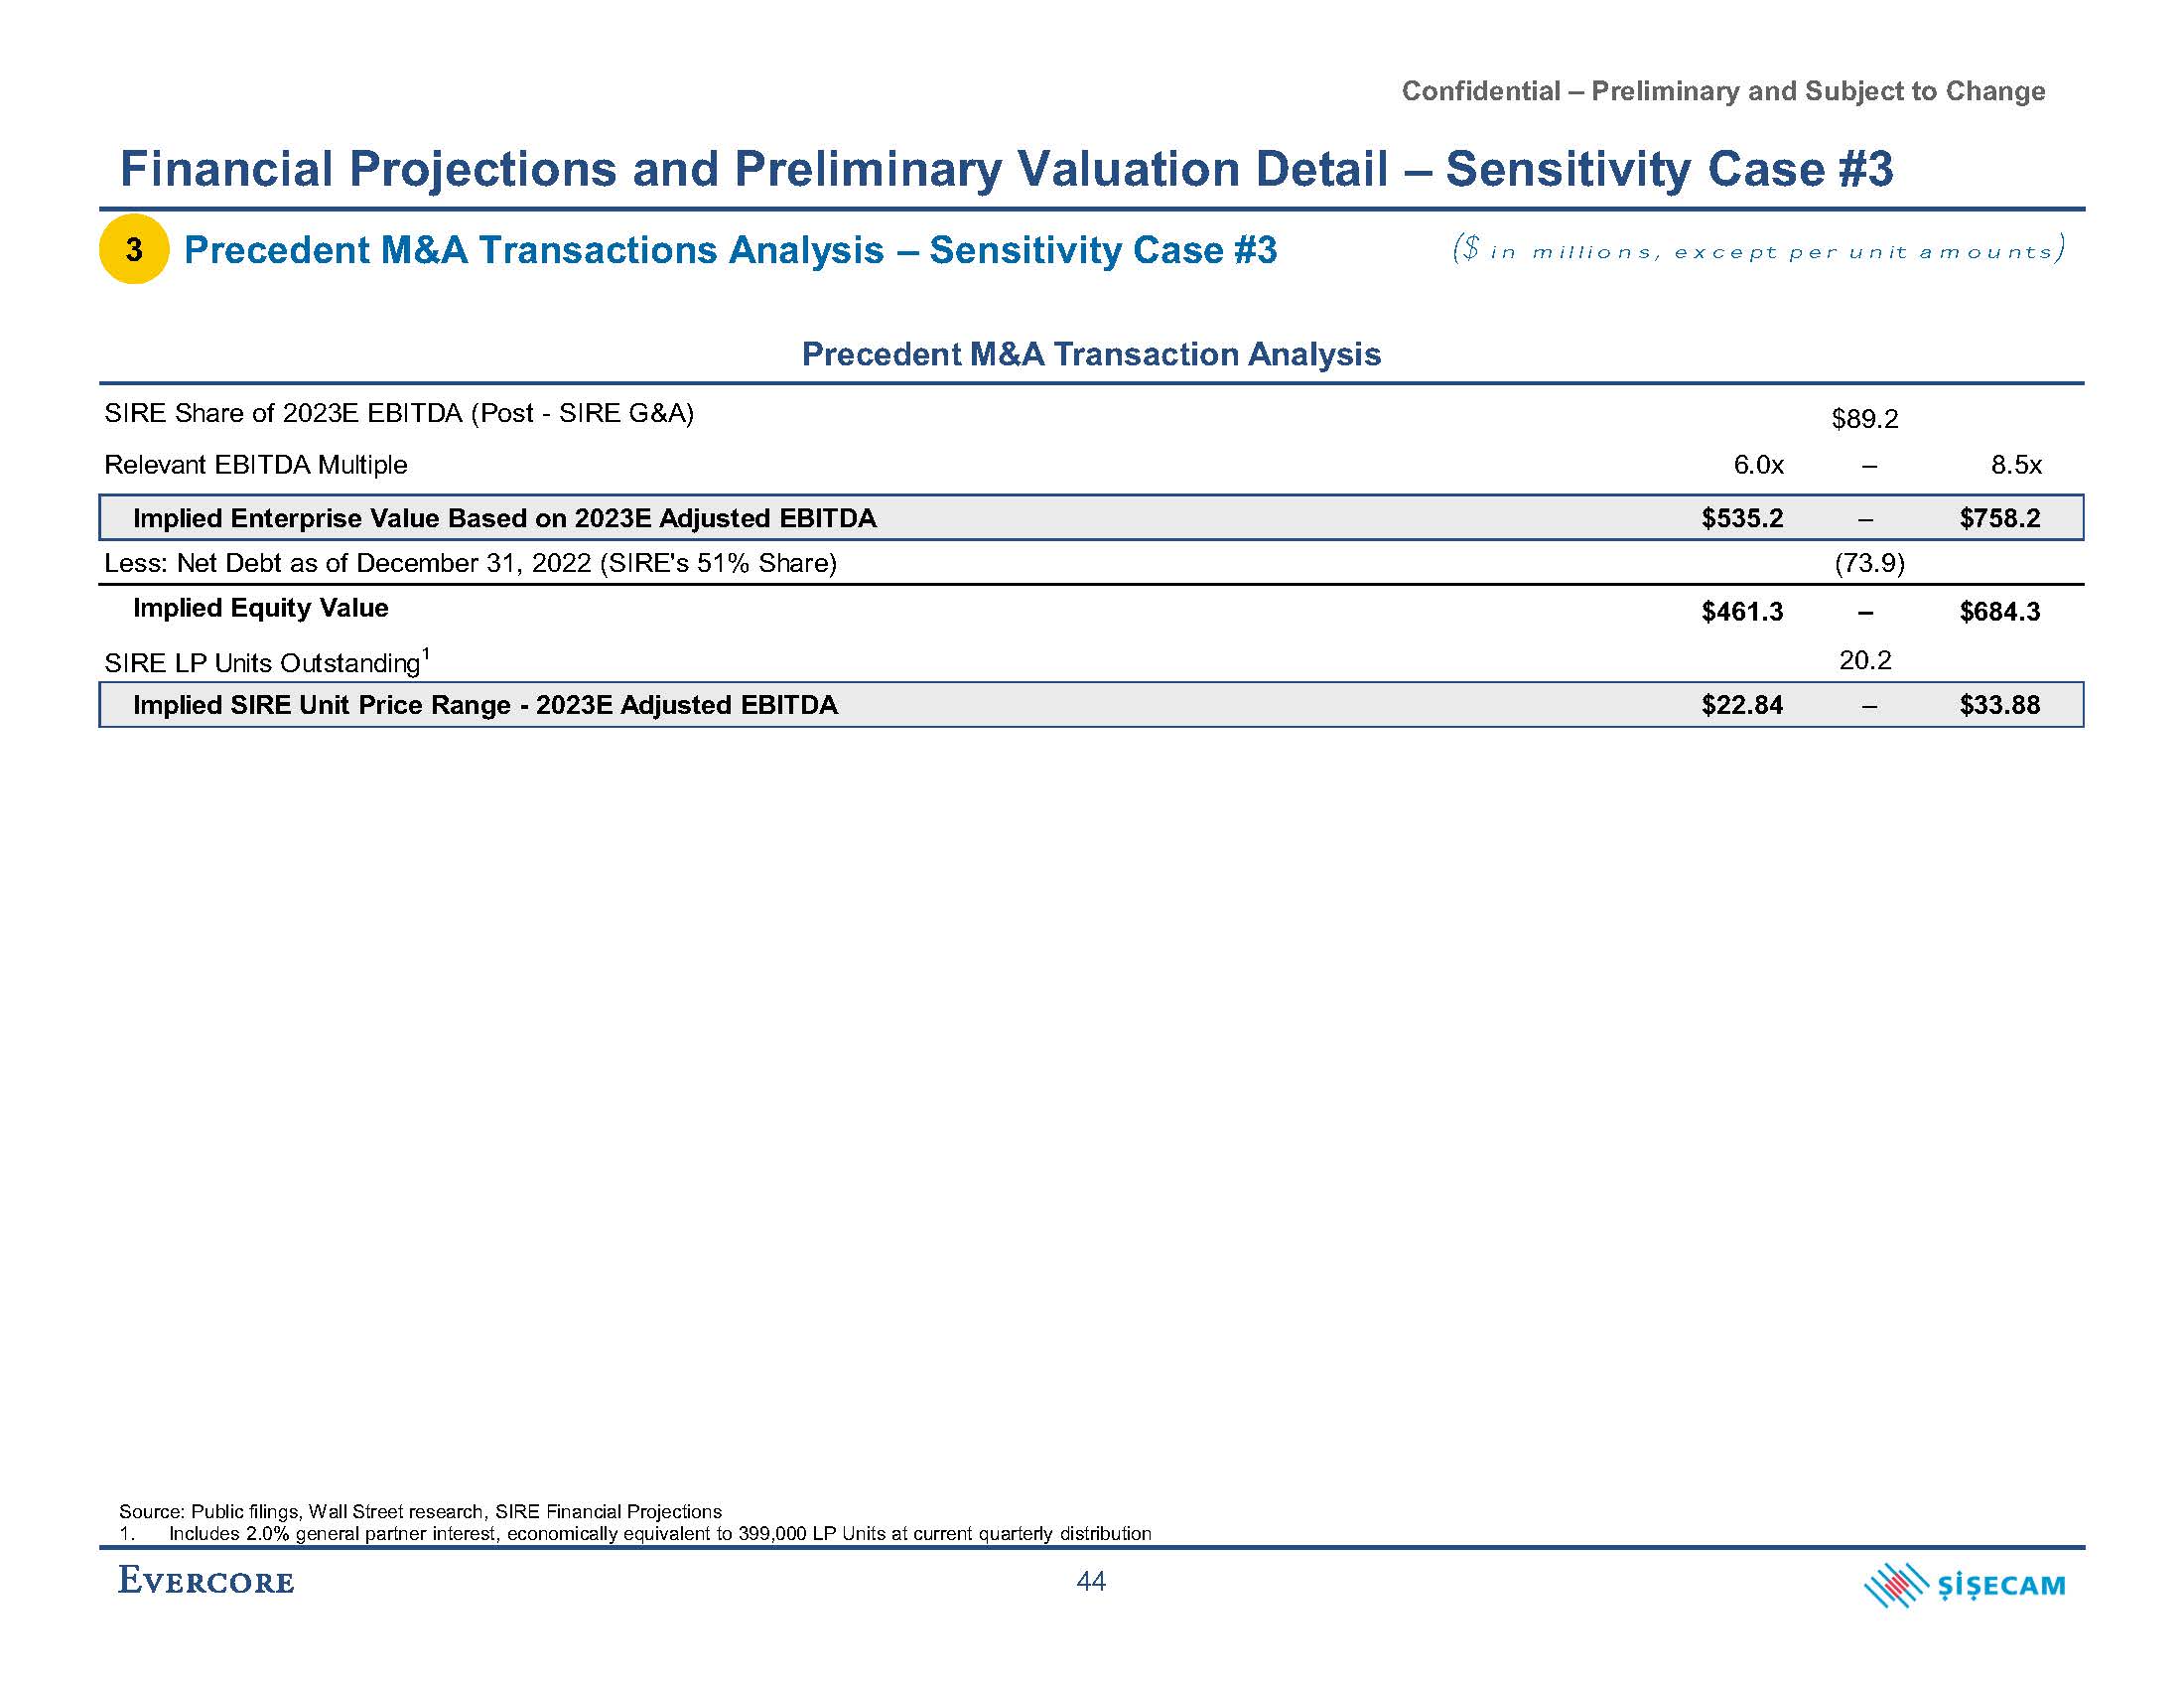
Confidential – Preliminary and Subject to Change Financial Projections and Preliminary Valuation Detail – Sensitivity Case #3 Precedent M&A Transactions Analysis – Sensitivity Case #3 Precedent M&A Transaction Analysis Source: Public filings, Wall Street research, SIRE Financial Projections 1. Includes 2.0% general partner interest, economically equivalent to 399,000 LP Units at current quarterly distribution 44 ($ in millions, except per unit amounts) 3
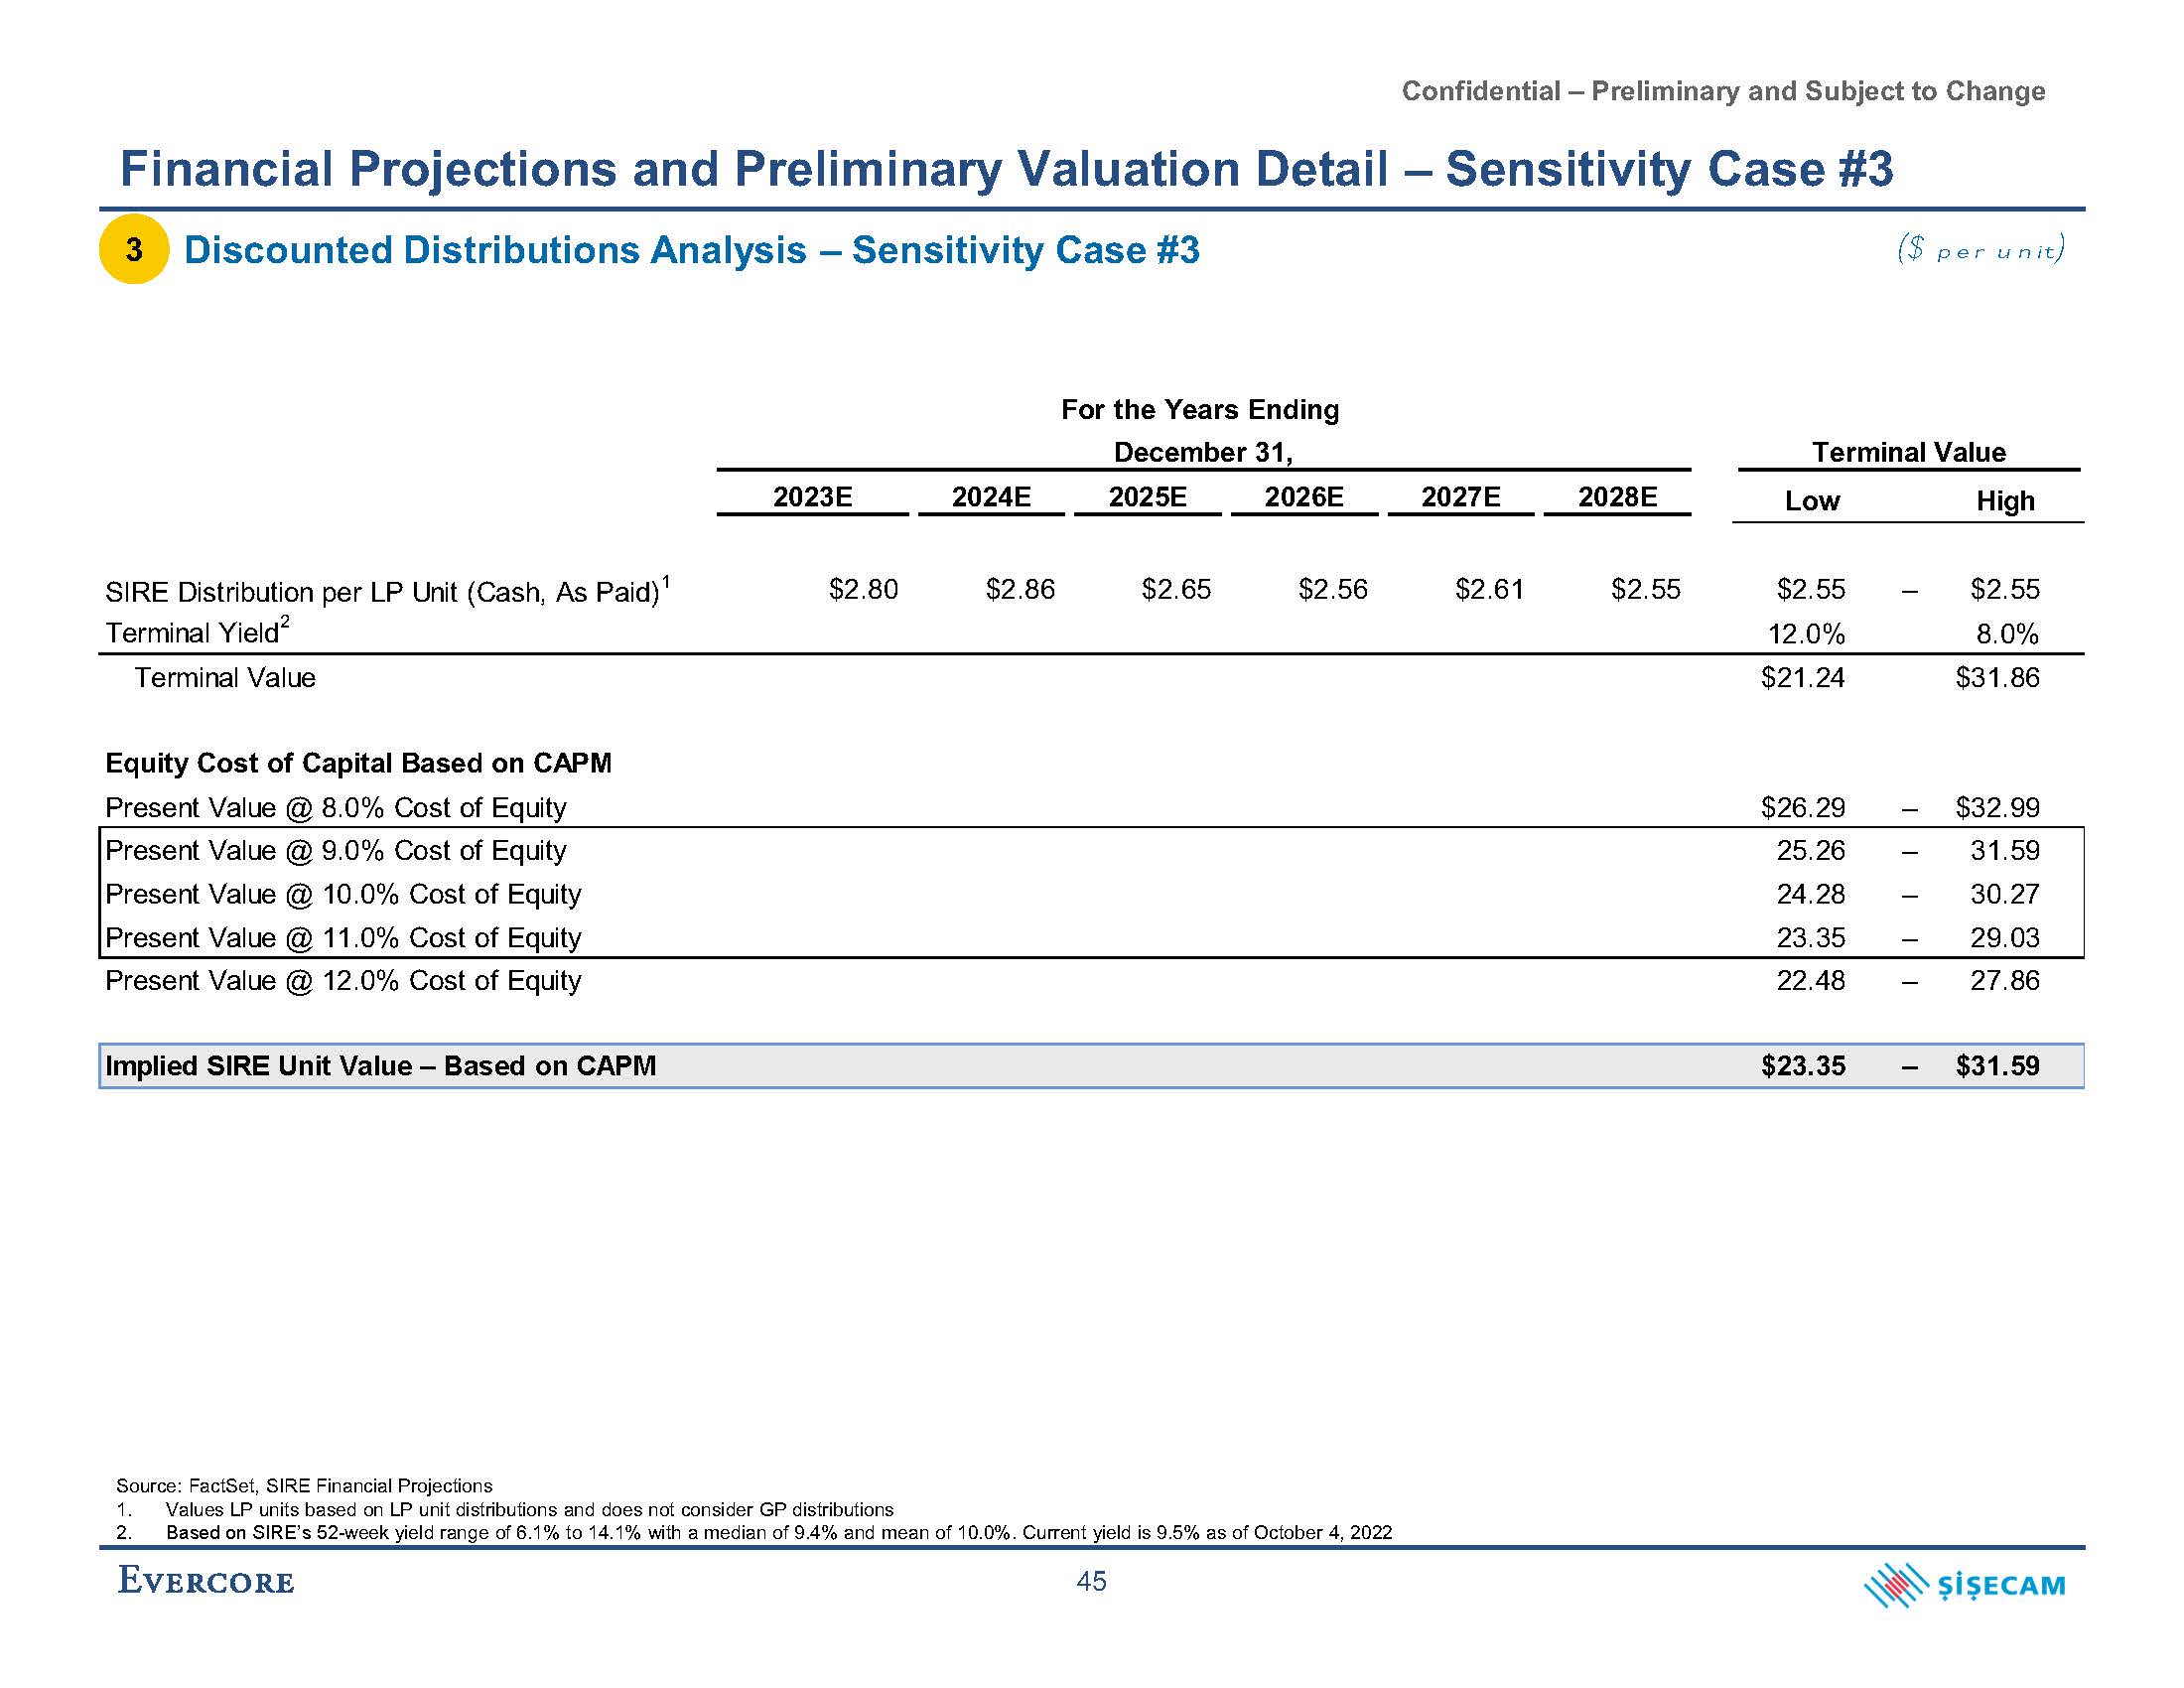
Confidential – Preliminary and Subject to Change Financial Projections and Preliminary Valuation Detail – Sensitivity Case #3 Discounted Distributions Analysis – Sensitivity Case #3 ($ per unit) SIRE Distribution per LP Unit (Cash, As Paid)1 $2.80 $2.86 $2.65 $2.56 $2.61 $2.55 $2.55 – $2.55 Terminal Yield2 12.0% 8.0% Terminal Value $21.24 $31.86 Equity Cost of Capital Based on CAPM Present Value @ 8.0% Cost of Equity $26.29 – $32.99 Present Value @ 9.0% Cost of Equity 25.26 – 31.59 Present Value @ 10.0% Cost of Equity 24.28 – 30.27 Present Value @ 11.0% Cost of Equity 23.35 – 29.03 Present Value @ 12.0% Cost of Equity 22.48 – 27.86 Implied SIRE Unit Value – Based on CAPM $23.35 – $31.59 For the Years Ending December 31, 2023E 2024E 2025E 2026E 2027E 2028E Terminal Value Low High 3 2. Based on SIRE’s 52-week yield range of 6.1% to 14.1% with a median of 9.4% and mean of 10.0%. Current yield is 9.5% as of October 4, 2022 45 Source: FactSet, SIRE Financial Projections 1. Values LP units based on LP unit distributions and does not consider GP distributions