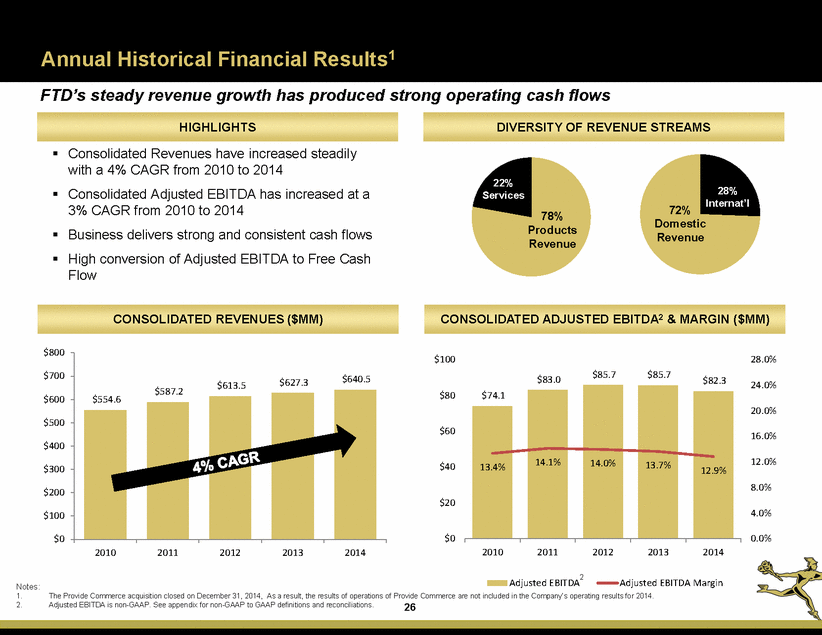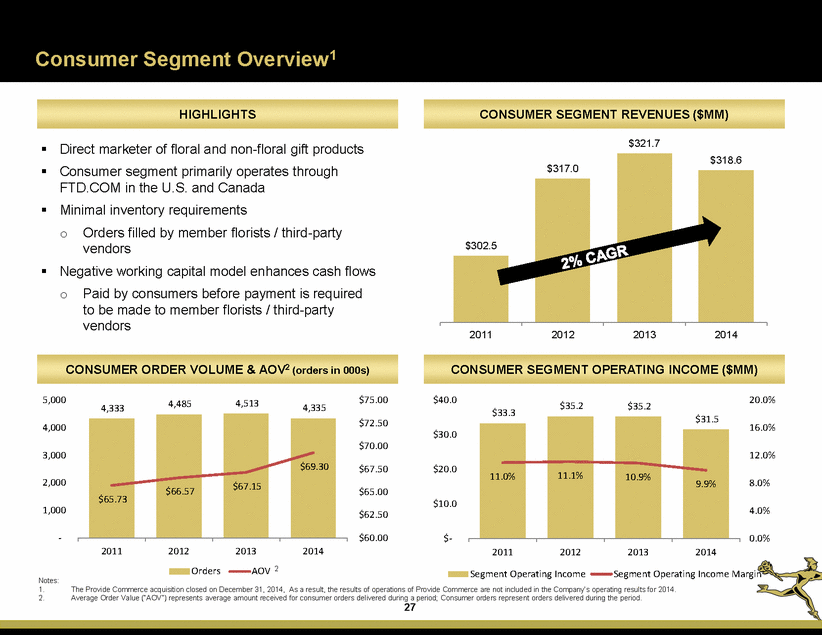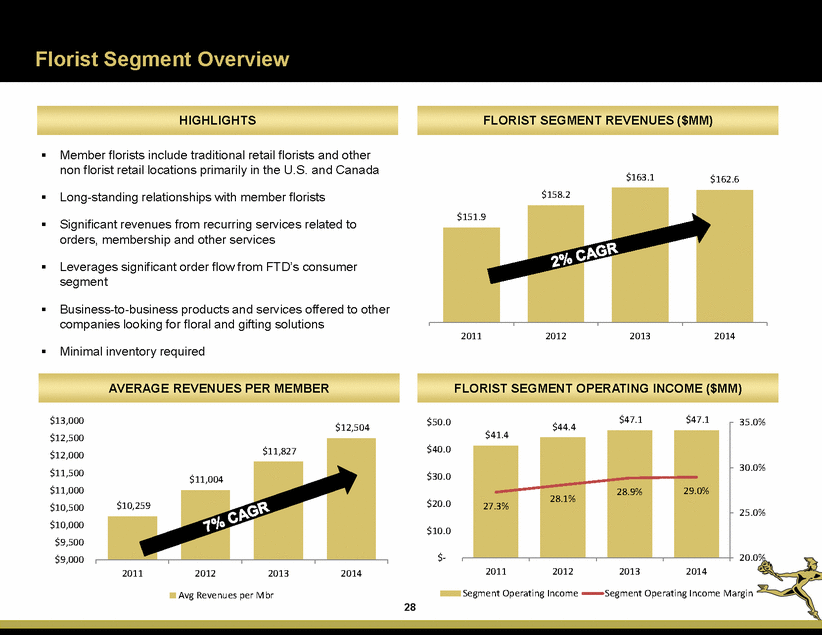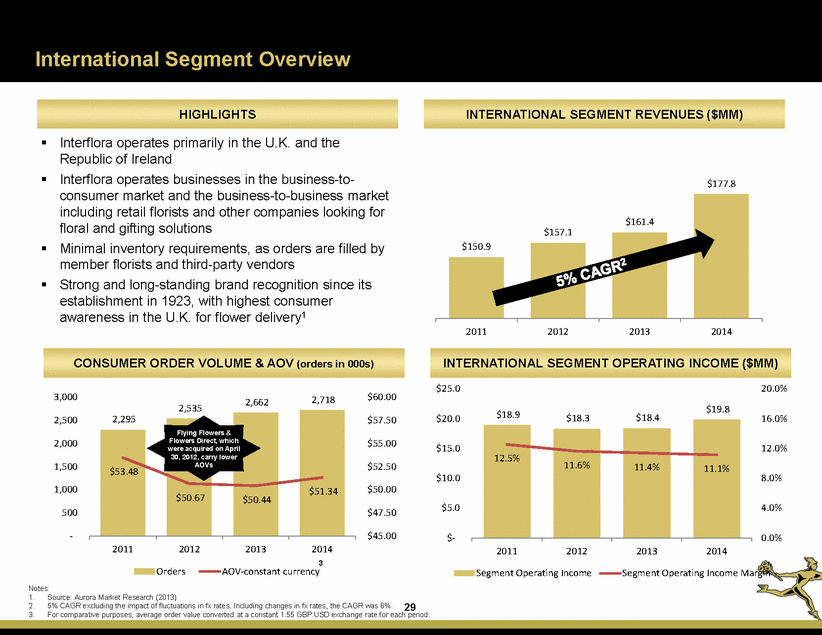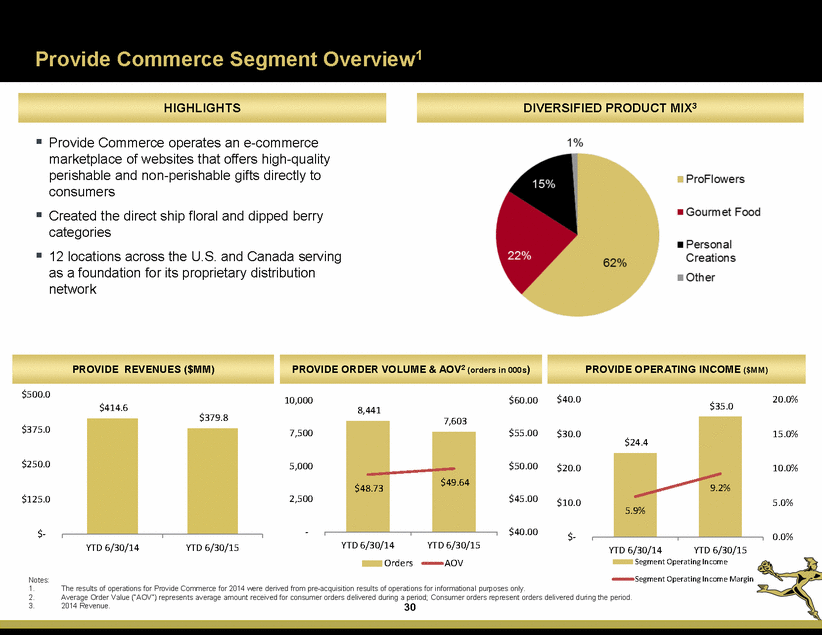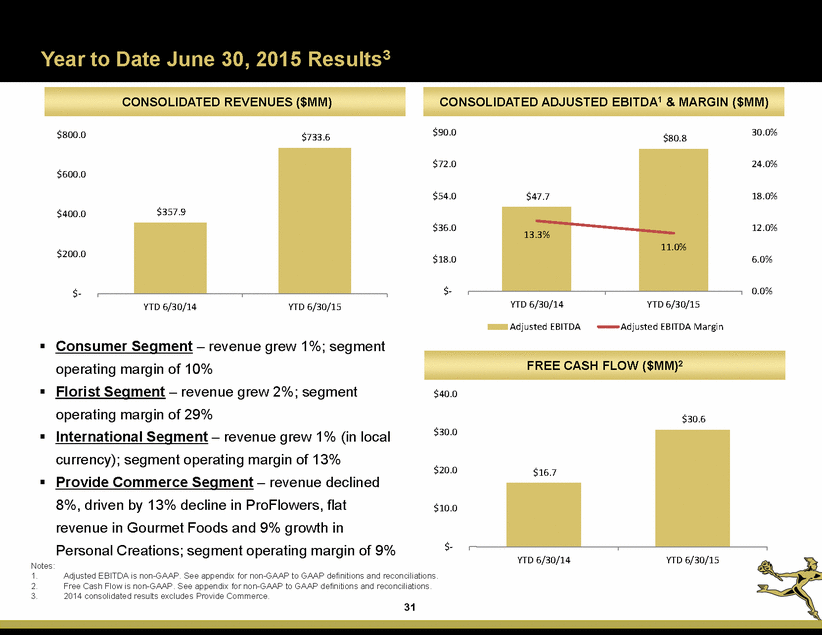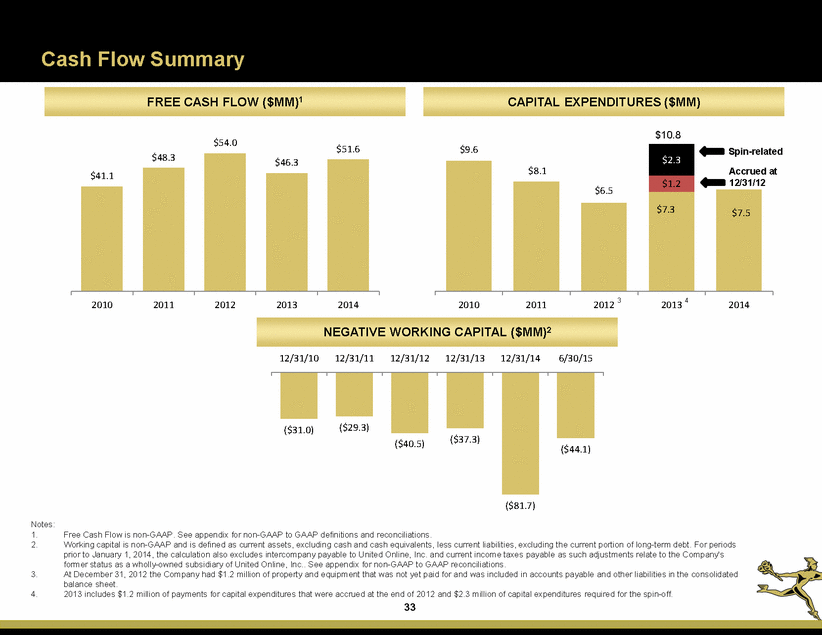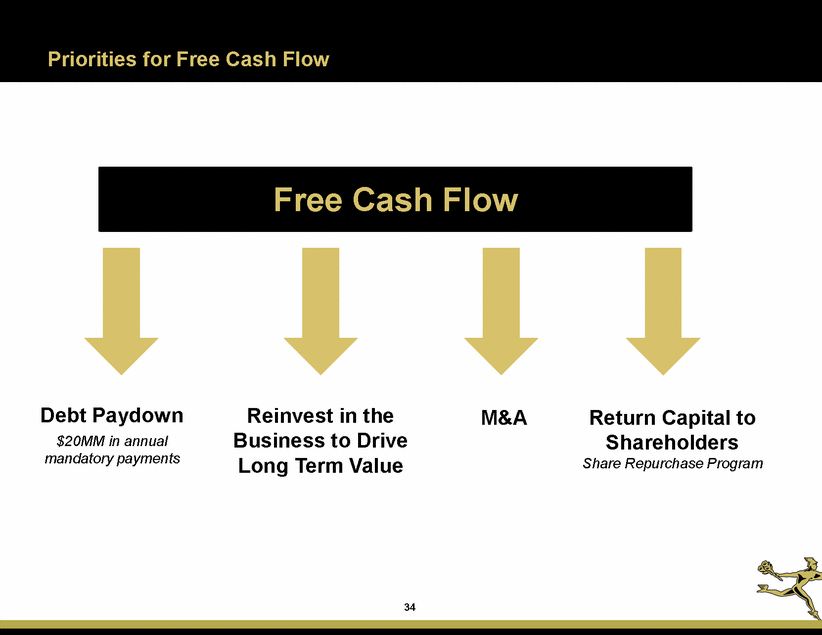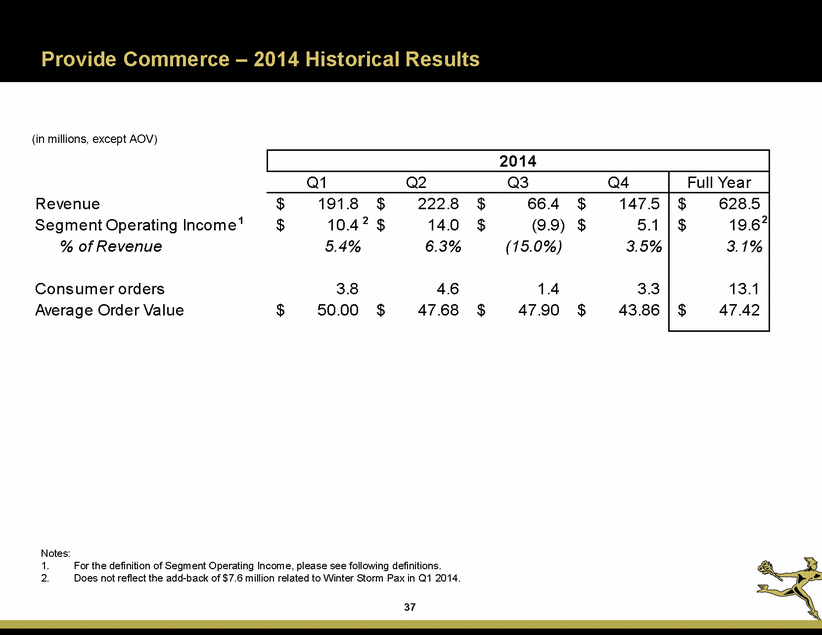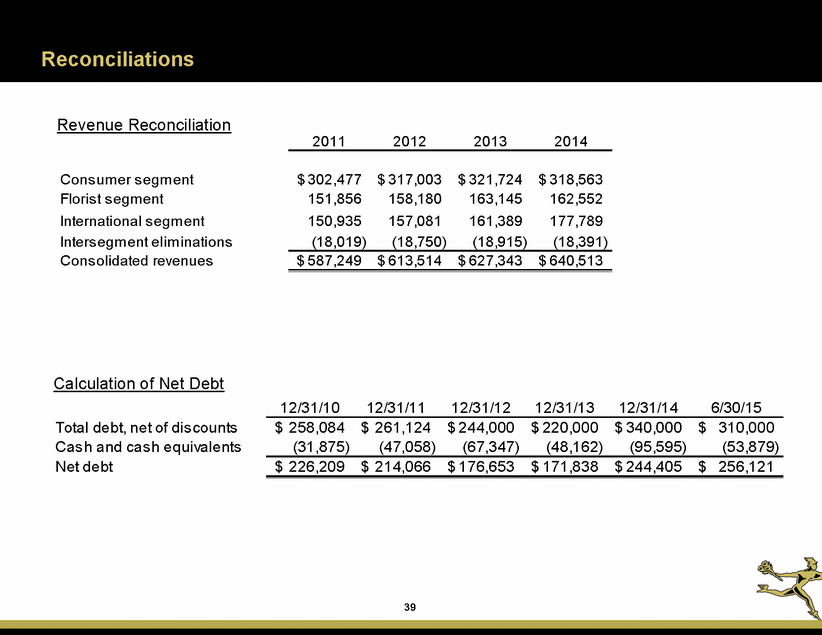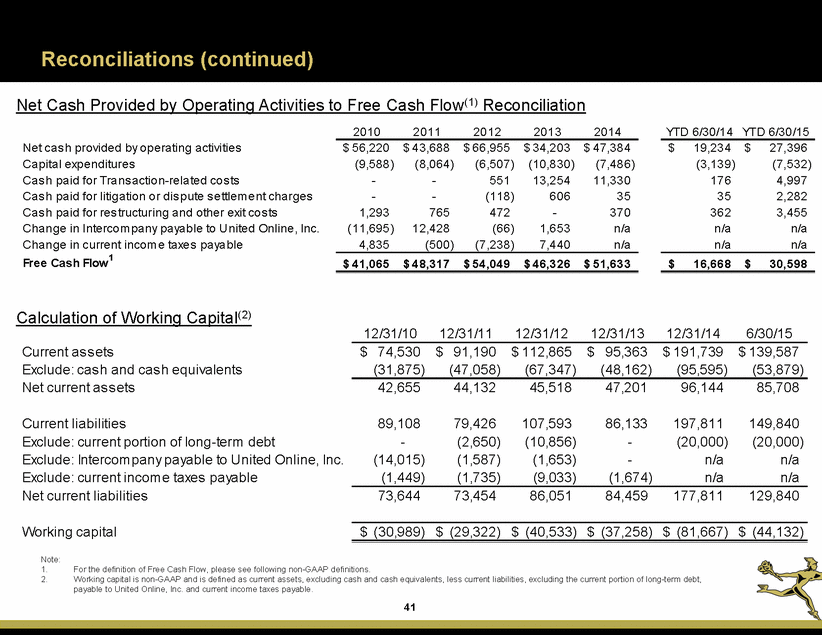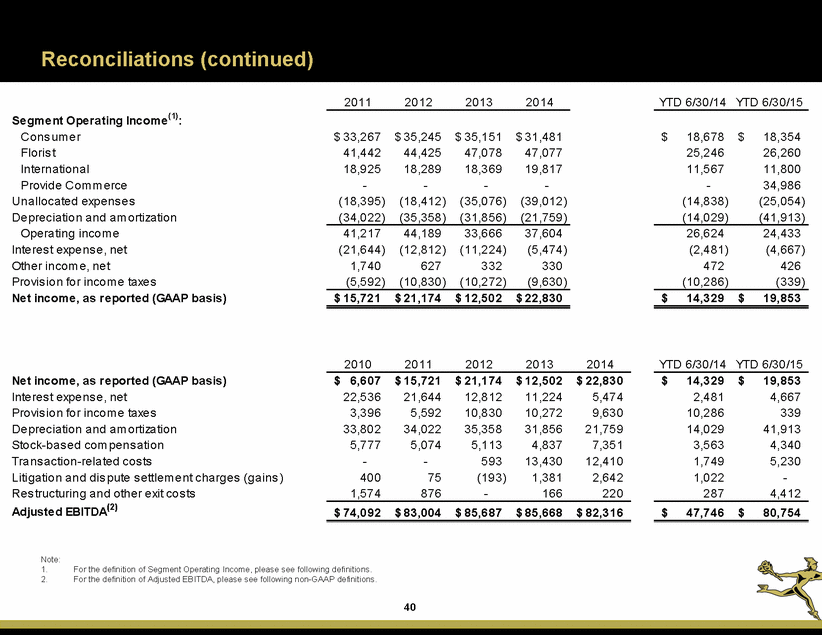
| Reconciliations (continued) 2011 2012 2013 2014 YTD 6/30/14 YTD 6/30/15 Segment Operating Income(1): Cons um er Floris t International Provide Com m erce Unallocated expens es Depreciation and am ortization Operating incom e Interes t expens e, net Other incom e, net Provis ion for incom e taxes Net income, as reported (GAAP basis) $ 33,267 41,442 18,925 - (18,395) (34,022) $ 35,245 44,425 18,289 - (18,412) (35,358) $ 35,151 47,078 18,369 - (35,076) (31,856) $ 31,481 47,077 19,817 - (39,012) (21,759) $ 18,678 25,246 11,567 - (14,838) (14,029) $ 18,354 26,260 11,800 34,986 (25,054) (41,913) 41,217 (21,644) 1,740 (5,592) 44,189 (12,812) 627 (10,830) 33,666 (11,224) 332 (10,272) 37,604 (5,474) 330 (9,630) 26,624 (2,481) 472 (10,286) 24,433 (4,667) 426 (339) $ 15,721 $ 21,174 $ 12,502 $ 22,830 $ 14,329 $ 19,853 2010 2011 2012 2013 2014 YTD 6/30/14 YTD 6/30/15 Net income, as reported (GAAP basis) Interes t expens e, net Provis ion for incom e taxes Depreciation and am ortization Stock-bas ed com pens ation Trans action-related cos ts Litigation and dis pute s ettlem ent charges (gains ) Res tructuring and other exit cos ts Adjusted EBITDA(2) $ 6,607 22,536 3,396 33,802 5,777 - 400 1,574 $ 15,721 21,644 5,592 34,022 5,074 - 75 876 $ 21,174 12,812 10,830 35,358 5,113 593 (193) - $ 12,502 11,224 10,272 31,856 4,837 13,430 1,381 166 $ 22,830 5,474 9,630 21,759 7,351 12,410 2,642 220 $ 14,329 2,481 10,286 14,029 3,563 1,749 1,022 287 $ 19,853 4,667 339 41,913 4,340 5,230 - 4,412 $ 74,092 $ 83,004 $ 85,687 $ 85,668 $ 82,316 $ 47,746 $ 80,754 Note: 1. 2. For the definition of Segment Operating Income, please see following definitions. For the definition of Adjusted EBITDA, please see following non-GAAP definitions. 40 |

