Exhibit 99.1
First Quarter Update
Investor Presentation
Presented by:
H. Michael Schwartz – Chairman & CEO
LEASE-UP EXPANSION
DEVELOPMENT/REDEVELOPMENT
SELF STORAGE PROPERTIES Disclaimer and Risk Factors
This investor presentation may contain certain forward-looking statements within the meaning of Section 27A of the Securities Act of 1933, as amended, and Section 21E of the Securities Exchange Act of 1934, as amended. Such forward-looking statements can generally be identified by our use of forward-looking terminology such as “may,” “will,” “expect,” “intend,” “anticipate,” “estimate,” “believe,” “continue,” or other similar words. Because such statements include risks, uncertainties and contingencies, actual results may differ materially from the expectations, intentions, beliefs, plans or predictions of the future expressed or implied by such forwardlooking statements. These risks, uncertainties and contingencies include, but are not limited to: uncertainties relating to changes in general economic and real estate conditions; uncertainties relating to the implementation of our real estate investment strategy; uncertainties relating to financing availability and capital proceeds; uncertainties relating to the closing of property acquisitions; uncertainties related to the timing and availability of distributions; and other risk factors as outlined in the Company’s public filings with the Securities and Exchange Commission. This is neither an offer nor a solicitation to purchase secuities. See our Form10-K and recent Form10-Q for specific risks associated with an investment in Strategic Storage Growth Trust, Inc. As of March 31, 2017, our accumulated deficit was approximately $13.7 million, and we anticipate that our operations will not be profitable in 2017. We have paid distributions from sources other than our cash flows from operations, including from the net proceeds of our public offering. We are not prohibited from undertaking such activities by our charter, bylaws or investment policies, and we may use an unlimited amount from any source to pay our distributions. From commencement of paying distributions in November 2015 through March 31, 2017, the payment of distributions has been paid from offering proceeds. Until we generate cash flows sufficient to pay distributions to you, we may pay distributions from the net proceeds of our public offering or from borrowings in anticipation of future cash flows. No public market currently exists for shares of our common stock and we may not list our shares on a national securities exchange before three to five years after completion of our public offering, if at all; therefore, it may be difficult to sell your shares. If you sell your shares, it will likely be at a substantial discount. Our charter does not require us to pursue a liquidity transaction at any time. We may only calculate the value per share for our shares annually and, therefore, you may not be able to determine the net asset value of your shares on an ongoing basis. We have limited prior operating history, and the prior performance of real estate programs sponsored by affiliates of our sponsor may not be indicative of our future results. We have no employees and are dependent on our advisor to select investments and conduct our operations, and there is no guarantee that our advisor will devote adequate time or resources to us. There are substantial conflicts of interest among us and our sponsor, advisor, property manager, and dealer manager. Our advisor will face conflicts of interest relating to the purchase of properties, including conflicts with Strategic Storage Trust II, Inc. and Strategic Storage Trust IV, Inc., and such conflicts may not be resolved in our favor, which could adversely affect our investment opportunities. We will pay substantial fees and expenses to our advisor, its affiliates, and participating broker-dealers for the servicesthey provide to us, which will reduce cash available for investment and distribution. We may be required to pay our advisor a significant distribution if our advisory agreement is involuntarily terminated. We may incur substantial debt, which could hinder our ability to pay distributionso our stockholders or could decrease the value of your investment. We may fail to qualify as a REIT, which could adversely affect our operations and our ability to make distributions. Our board of directors may change any of our investment objectives without your consent. 2
NOI, FFO, and MFFO Funds from Operations (“FFO”) and Modified Funds from Operations (“MFFO”) Due to certain unique operating characteristics of real estate companies, the National Association of Real Estate Investment Trusts, or NAREIT, an industry trade group, has promulgated a measure known as funds from operations, or FFO, which SSGT believes to be an appropriate supplemental measure to reflect the operating performance of a REIT. The use of FFO is recommended by the REIT industry as a supplemental performance measure. FFO is not equivalent to SSGT’s net income (loss) as determined under GAAP.
SSGT defines FFO, anon-GAAP measure, consistent with the standards established by the White Paper on FFO approved by the Board of Governors of NAREIT, as revised in February 2004, or the White Paper. The White Paper defines FFO as net income (loss) computed in accordance with GAAP, excluding gains or losses from sales of property and asset impairment write downs, plus depreciation and amortization, and after adjustments for unconsolidated partnerships and jointventures. Adjustments for unconsolidated partnerships and joint ventures are calculated to reflect FFO on the same basis. SSGT’s FFO calculation complies with NAREIT’s policy described above. The historical accounting convention used for real estate assets requires straight-line depreciation of buildings and improvements, which implies that the value of real estate assets diminishes predictably over time. Diminution in value may occur if such assets are not adequately maintained or repaired and renovated as required by relevant circumstances or other measures necessary to maintain the assets are not undertaken. However, SSGT believes that, since real estate values historically rise and fall with market conditions, including inflation, interest rates, the business cycle, unemployment and consumer spending, presentations of operating results for a REIT using historical accounting for depreciation may be less informative. In addition, in the determination of FFO, SSGT believes it is appropriate to disregard impairment charges, as this is a fair value adjustment that is largely based on market fluctuations and assessments regarding general market conditions which can change over time. An asset will only be evaluated for impairment if certain impairment indications exist and if the carrying value, or book value, exceeds the total estimated undiscounted future cash flows (including net rental revenues, net proceeds on the sale of the property, and any other ancillary cash flows at a property or group level under GAAP) from such asset. Testing for impairment is a continuous process and isanalyzed on a quarterly basis. Investors should note, however, that determinations of whether impairment charges have been incurred are based partly on anticipated operating performance, because estimated undiscounted future cash flows from a property, including estimated future net rental revenues, net proceeds on the sale of the property, and certain other ancillary cash flows, are taken into account in determining whether an impairment charge has been incurred. While impairment charges are excluded from the calculation of FFO as described above, investors are cautioned that due to the fact that impairments are based on estimated future undiscounted cash flows and that SSGT intends to have a relatively limited term of its operations; it could be difficult to recover any impairment charges through the eventual sale of the property. To date, SSGT has not recognized any impairments. Historical accounting for real estate involves the use of GAAP. Any other method of accounting for real estate such as the fair value method cannot be construed to be any more accurate or relevant than the comparable methodologies of real estate valuation found in GAAP. Nevertheless, SSGT believes that the use of FFO, which excludes the impact of real estate related depreciation and amortization and impairments, assists in providing a more complete understanding of its performance to investors and to its management, and when compared year over year, reflects the impact on SSGT’s operations from trends in occupancy rates, rental rates, operating costs, general and administrative expenses, and interest costs, which may not be immediately apparent from net income (loss). However, FFO or modified funds from operations (“MFFO”), discussed below, should not be construed to be more relevant or accurate than the current GAAP methodology in calculating net income (loss) or in its applicability in evaluating SSGT’s operating performance. The method utilized to evaluate the value and performance of real estate under GAAP should be considered a more relevant measure of operational performance and is, therefore, given more prominence than thenon-GAAP FFO and MFFO measures and the adjustments to GAAP in calculating FFO and MFFO. Changes in the accounting and reporting rules under GAAP that were put into effect and other changes to GAAP accounting for real estate subsequent to the establishment of NAREIT’s definition of FFO have prompted an increase in cash-settled expenses, specifically acquisition fees and expenses, that are expensed as operating expenses under GAAP. SSGT believes these fees and expenses do not affect its overall long-term operating performance. Publicly registered, nontraded
REITs typically have a significant amount of acquisition activity and are substantially more dynamic during their initial years of investment and operation. Investor Presentation 3
Additional Information Regarding NOI, FFO, and MFFO The purchase of properties, and the corresponding expenses associated with that process, is a key feature of SSGT’s business plan in order to generate operational income and cash flow in order to make distributions to investors. While otherstart-up entities may also experience significant acquisition activity during their initial years, SSGT believes that publicly registered,non-traded REITs are unique in that they typically have a limited life with targeted exitstrategies within a relatively limited time frame after the acquisition activity ceases. As disclosed in the prospectus for SSGT’s offering, SSGT will use the proceeds raised in its offering to acquire properties and SSGT expects to begin the process of achieving a liquidity event (i.e., listing of its shares of common stock on a national securities exchange, a merger or sale, the sale of all or substantially all of its assets, or another similar transaction) within three to five years after the completion of its offering, which is generally comparable to other publicly registered,non-traded REITs. Thus, SSGT does not intend to continuously purchase assets and intends to have a limited life. The decision whether to engage in any liquidity event is in the sole discretion of the board of directors of SSGT. Due to the above factors and other unique features of publicly registered,non-traded REITs, the Investment Program Association, or the IPA, an industry trade group, has standardized a measure known as MFFO, which the IPA has recommended as a supplemental measure for publicly registered, nontraded REITs and which SSGT believes to be another appropriate supplemental measure to reflect the operating performance of a publicly registered, nontraded REIT having the characteristics described above. MFFO is not equivalent to SSGT’s net income (loss) as determined under GAAP, and MFFO may not be a useful measure of the impact of long-term operating performance on value if SSGT does not ultimately engage in a liquidity event. SSGT believes that, because MFFO excludes acquisition fees and expenses that affect its operations only in periods in which properties are acquired and that SSGT considers more reflective of investing activities, as well as othernon-operating items included in FFO, MFFO can provide, on a going-forward basis, an indication of the sustainability (that is, the capacity to continue to be maintained) of SSGT’s operating performance after the period in which it is acquiring properties and once its portfolio is in place. By providing MFFO, SSGT believes it is presenting useful information that assists investors and analysts to better assess the sustainability of its operating performance after its offering has been completed and its properties have been acquired. SSGT also believes that MFFO is a recognized measure of sustainable operating performance by the publicly registered,non-traded REIT industry. Further, SSGT believes MFFO is useful in comparing the sustainability of its operating performance after its offering and acquisitions are completed with the sustainability of the operating performance of other real estate companies that are not as involved in acquisition activities. Investors are cautioned that MFFO should only be used to assess the sustainability of SSGT’s operating performance after its offering has been completed and properties have been acquired, as it excludes acquisition fees and expenses that have a negative effect on SSGT’s operating performance during the periods in which properties are acquired. SSGT defines MFFO, anon-GAAP measure, consistent with the IPA’s Guideline2010-01, Supplemental Performance Measure for Publicly Registered, Non- Listed REITs: Modified Funds From Operations (the “Practice Guideline”) issued by the IPA in November 2010. The Practice Guideline defines MFFO as FFO further adjusted for the following items included in the determination of GAAP net income (loss): acquisition fees and expenses; amounts relating to straight line rents and amortization of above or below intangible lease assets and liabilities; accretion of discounts and amortization of premiums on debt investments;non-recurring impairments of real estate related investments;mark-to-market adjustments included in net income;non-recurring gains or losses included in net income from the extinguishment or sale of debt, hedges, foreign exchange, derivatives or securities holdings where trading of such holdings is not a fundamental attribute of the business plan, unrealized gains or losses resulting from consolidation from, or deconsolidation to, equity accounting, adjustments relating to contingent purchase price obligations included in net income, and after adjustments for consolidated and unconsolidated partnerships and joint ventures, with such adjustments calculated to reflect MFFO on the same basis. The accretion of discounts and amortization of premiums on debt investments, unrealized gains and losses on hedges, foreign exchange, derivatives or securities holdings, unrealized gains and losses resulting from consolidations, as well as other listed cash flow adjustments are adjustments made to net income (loss) in calculating cash flows from operations and, in some cases, reflect gains or losses which are unrealized and may not ultimately be realized. SSGT’s MFFO calculation complies with the IPA’s Practice Guideline described above. In calculating MFFO, SSGT excludesacquisition related expenses. The other adjustments included in the IPA’s Practice Guideline are not applicable to SSGT for the periods presented. Acquisition fees and expenses are paid in cash by SSGT, and it has not set aside or put into escrow any specific amount of proceeds from its offering to be used to fund acquisition fees and expenses. Investor Presentation 4
Additional Information Regarding NOI, FFO, and MFFO SSGT does not intend to fund acquisition fees and expenses in the future from operating revenues and cash flows, nor from the sale of properties and subsequent redeployment of capital and concurrent incurring of acquisition fees and expenses. Acquisition fees and expenses include payments to SSGT’s advisor and third parties. Acquisition related expenses under GAAP are considered operating expenses and as expenses included in the determination of net income (loss) and income (loss) from continuing operations, both of which are performance measures under GAAP. All paid and accrued acquisition fees and expenses will have negative effects on returns to investors, the potential for future distributions, and cash flows generated by SSGT, unless earnings from operations or net sales proceeds from the disposition of other properties are generated to cover the purchase price of the property, these fees and expenses and other costs related to such property. In the future, if SSGT is not able to raise additional proceeds from future offerings, this could result in SSGT paying acquisition fees or reimbursing acquisition expenses due to its advisor, or a portion thereof, with net proceeds from borrowed funds, operational earnings or cash flows, net proceeds from the sale of properties, or ancillary cash flows. As a result, the amount of proceeds available for investment and operations would be reduced, or SSGT may incur additional interest expense as a result of borrowed funds. Further, under GAAP, certain contemplatednon-cash fair value and othernon-cash adjustments are considered operatingnon-cash adjustments to net income (loss) in determining cash flows from operations. In addition, SSGT views fair value adjustments of derivatives and the amortization of fair value adjustments related to debt as items which are unrealized and may not ultimately be realized or as items which are not reflective ofon-going operations and are therefore typically adjusted for when assessing operating performance. SSGT uses MFFO and the adjustments used to calculate it in order to evaluate its performance against other publicly registered,non-traded REITs which intend to have limited lives with short and defined acquisition periods and targeted exit strategies shortly thereafter. As noted above, MFFO may not be a useful measure of the impact of long-term operating performance if SSGT does not continue to operate in this manner. SSGT believes that its use of MFFO and the adjustments used to calculate it allow it to present its performance in a manner that reflects certain characteristics that are unique to publicly registered,non-traded REITs, such as their limited life, limited and defined acquisition period and targeted exit strategy, and hence that the use of such measures may be useful to investors. For example, acquisition fees and expenses are intended to be funded from the proceeds of SSGT’s offering and other financing sources and not from operations. By excluding expensed acquisition fees and expenses, the use of MFFO provides information consistent with management’s analysis of the operating performance of the properties. Additionally, fair value adjustments, which are based on the impact of current market fluctuations and underlying assessments of general market conditions, but can also result from operational factors such as rental and occupancy rates, may not be directly related or attributable to SSGT’s current operating performance. By excluding such charges that may reflect anticipated and unrealized gains or losses, SSGT believes MFFO provides useful supplemental information. Presentation of this information is intended to provide useful information to investors as they compare the operating performance of different REITs, although it should be noted that not all REITs calculate FFO and MFFO the same way, so comparisons with other REITs may not be meaningful. Furthermore, FFO and MFFO are not necessarily indicative of cash flow available to fund cash needs and should not be considered as an alternative to net income (loss) or income (loss) from continuing operations as an indication of SSGT’s performance, as an alternative to cash flows from operations, which is an indication of SSGT’s liquidity, or indicative of funds available to fund SSGT’s cash needs including its ability to make distributions to its stockholders. FFO and MFFO should be reviewed in conjunction with other measurements as an indication of SSGT’s performance. MFFO may be useful in assisting management and investors in assessing the sustainability of operating performance in future operating periods, and in particular, after the offering and acquisition stages are complete. Neither the SEC, NAREIT, nor any other regulatory body has passed judgment on the acceptability of the adjustments that SSGT uses to calculate FFO or MFFO. In the future, the SEC, NAREIT or another regulatory body may decide to standardize the allowable adjustments across the publicly registered,non-traded REIT industry and SSGT would have to adjust its calculation and characterization of FFO or MFFO. Net Operating Income or (“NOI”) NOI is anon-GAAP measure that we define as net income (loss), computed in accordance with GAAP, generated from properties before corporate general and administrative expenses, asset management fees, interest expense, depreciation, amortization, acquisition expenses and othernon-property related expenses. We believe that NOI is useful for investors as it provides a measure of the operating performance of our operating assets because NOI excludes certain items that are not associated with the operation of the properties. Additionally, we believe that NOI is a widely accepted measure of comparative operating performance in the real estate community. However, our use of the term NOI may not be comparable to that of other real estate companies as they may have different methodologies for computing this amount. Investor Presentation 5
Investment Strategy
Investor Presentation 6
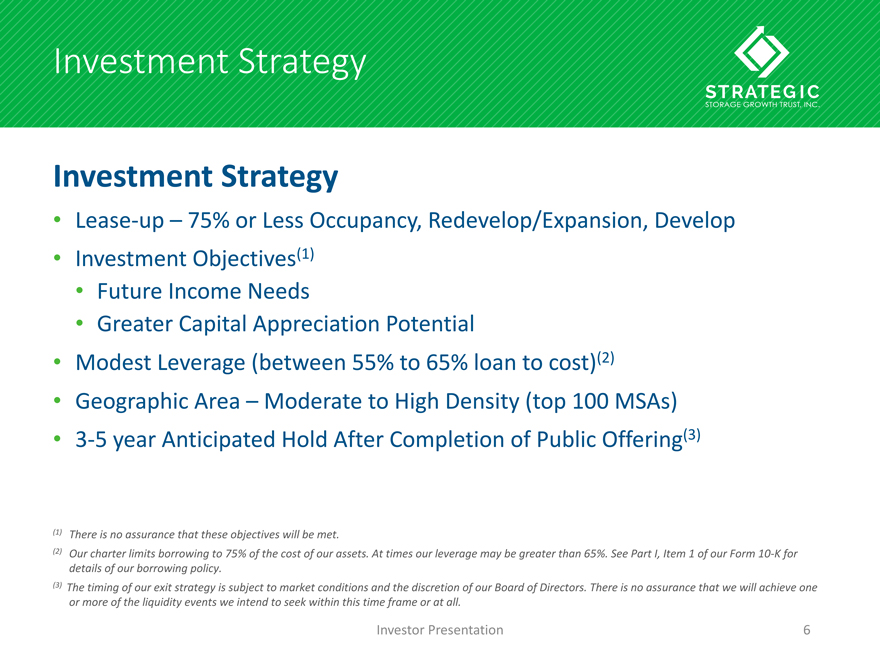
Investment Strategy
•Lease-up – 75% or Less Occupancy, Redevelop/Expansion, Develop
• Investment Objectives(1)
• Future Income Needs
• Greater Capital Appreciation Potential
• Modest Leverage (between 55% to 65% loan to cost)(2)
• Geographic Area – Moderate to High Density (top 100 MSAs)
•3-5 year Anticipated Hold After Completion of Public Offering(3)
(1) There is no assurance that these objectives will be met.
(2) Our charter limits borrowing to 75% of the cost of our assets. At times our leverage may be greater than 65%. See Part I, Item 1 of our Form10-K for
details of our borrowing policy.
(3) The timing of our exit strategy is subject to market conditions and the discretion of our Board of Directors. There is no assurance that we will achieve one or more of the liquidity events we intend to seek within this time frame or at all.
6
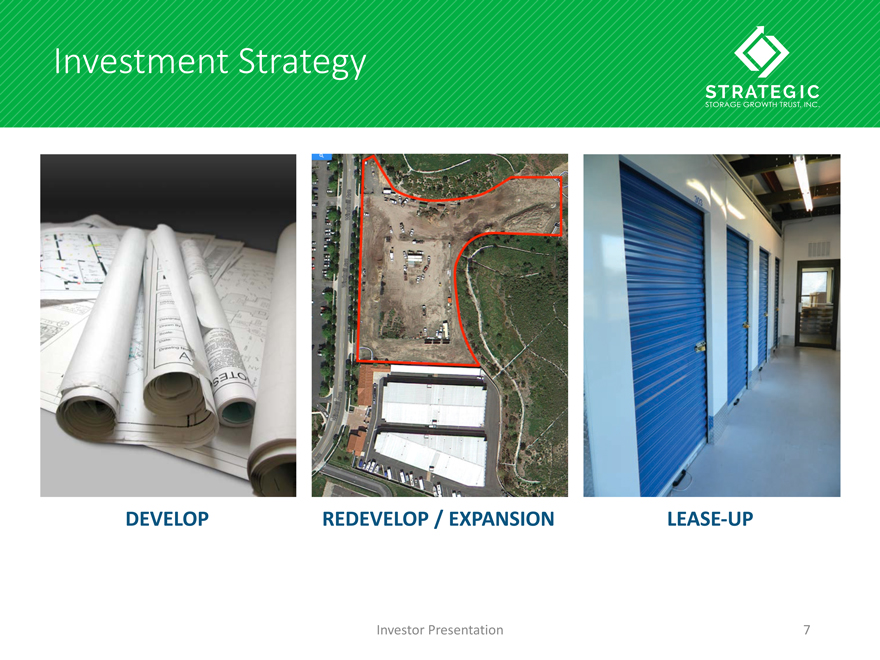
Investment Strategy
DEVELOP REDEVELOP / EXPANSIONLEASE-UP
Investor Presentation 7
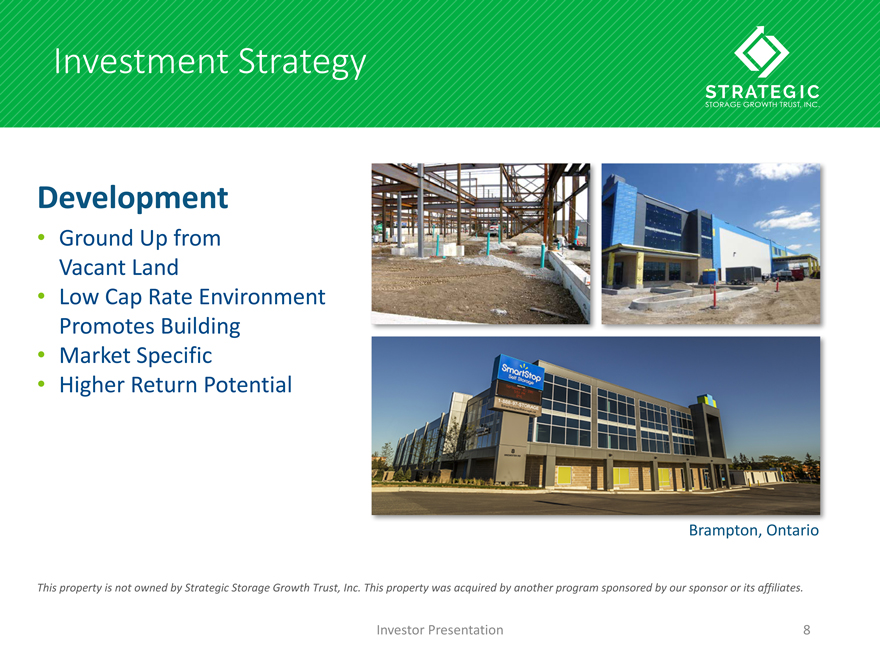
This property is not owned by Strategic Storage Growth Trust, Inc. This property was acquired by another program sponsored by our sponsor or its affiliates.
Development
• Ground Up from
Vacant Land
• Low Cap Rate Environment
Promotes Building
• Market Specific
• Higher Return Potential
Brampton, Ontario
Investor Presentation 8
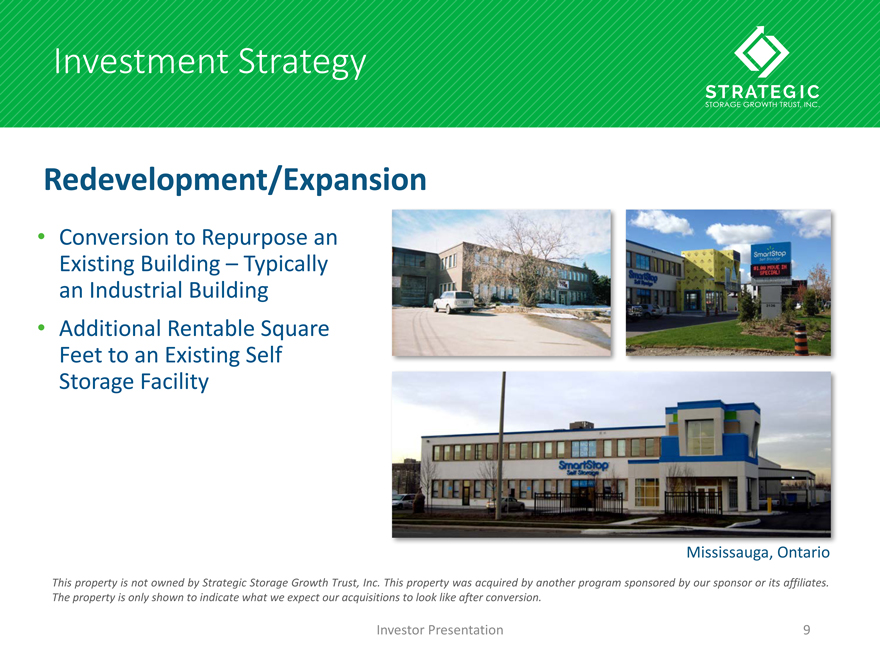
Investment Strategy
• Conversion to Repurpose an Existing Building – Typically an Industrial Building
• Additional Rentable Square
Feet to an Existing Self
Storage Facility
This property is not owned by Strategic Storage Growth Trust, Inc. This property was acquired by another program sponsored by our sponsor or its affiliates.
The property is only shown to indicate what we expect our acquisitions to look like after conversion.
Mississauga, Ontario
Redevelopment/Expansion
Investor Presentation 9
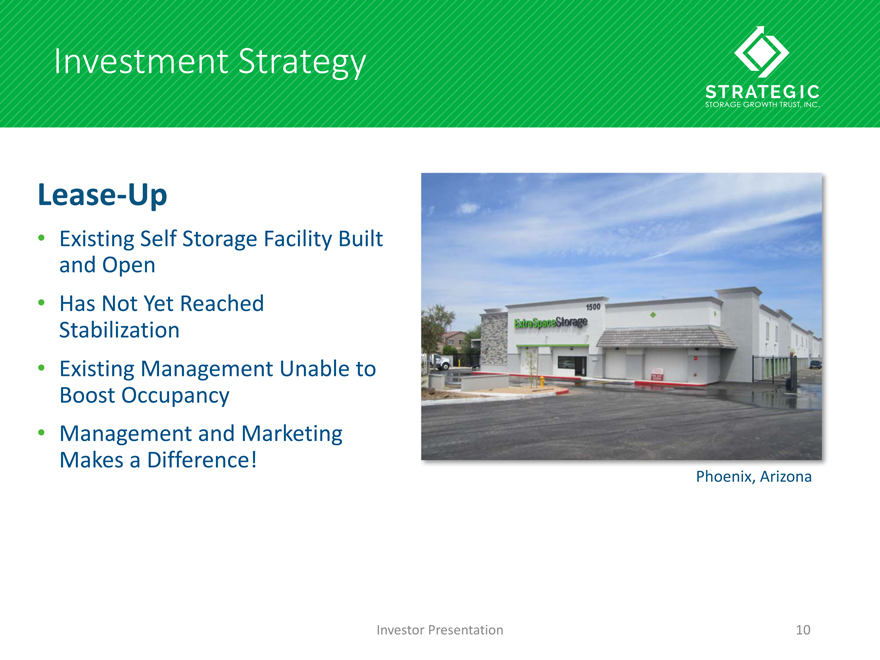
Investment Strategy
Lease-Up
• Existing Self Storage Facility Built and Open
• Has Not Yet Reached Stabilization
• Existing Management Unable to
Boost Occupancy
• Management and Marketing
Makes a Difference!
Phoenix, Arizona
Investor Presentation 10
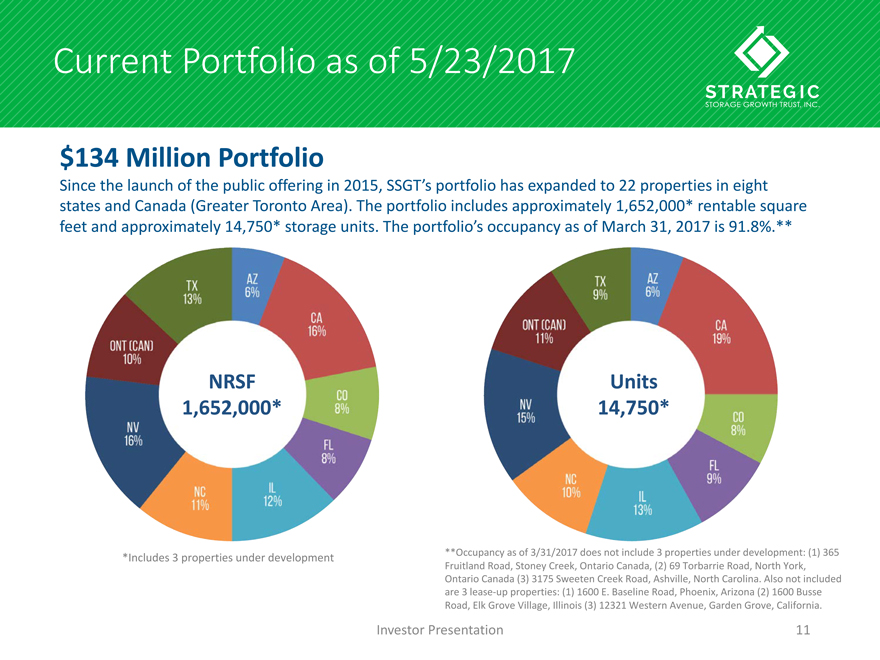
Current Portfolio as of 5/23/2017 *Includes 3 properties under development **Occupancy as of 3/31/2017 does not include 3 properties under development: (1) 365 Fruitland Road, Stoney Creek, Ontario Canada, (2) 69 Torbarrie Road, North York, Ontario Canada (3) 3175 Sweeten Creek Road, Ashville, North Carolina. Also not included are 3lease-up properties: (1) 1600 E. Baseline Road, Phoenix, Arizona (2) 1600 Busse Road, Elk Grove Village, Illinois (3) 12321 Western Avenue, Garden Grove, California. NRSF 1,652,000* Units 14,750* $134 Million Portfolio Since the launch of the public offering in 2015, SSGT’s portfolio has expanded to 22 properties in eight states and Canada (Greater Toronto Area). The portfolio includes approximately 1,652,000* rentable square feet and approximately 14,750* storage units. The portfolio’s occupancy as of March 31, 2017 is 91.8%.** Investor Presentation 11
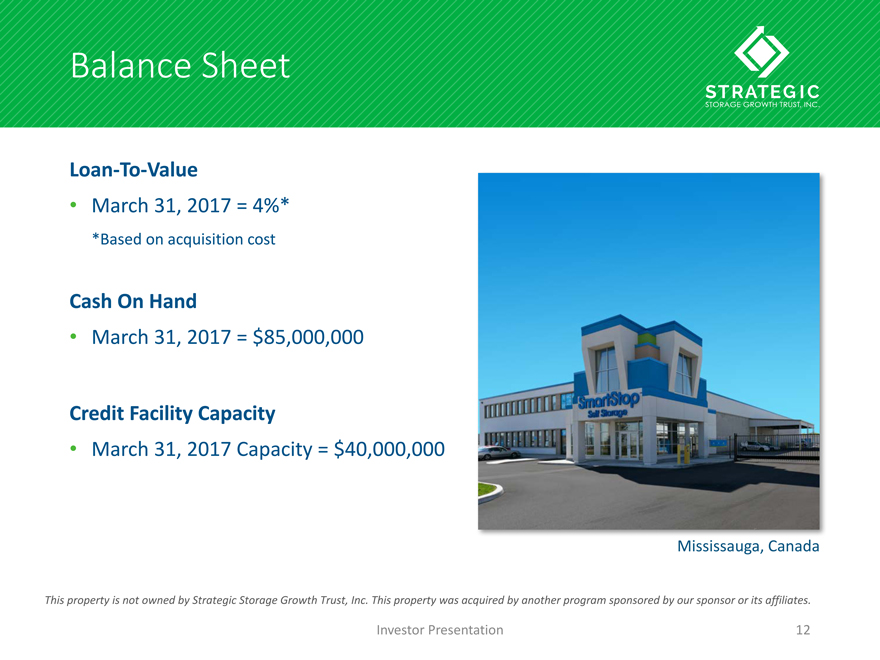
Balance SheetLoan-To-Value • March 31, 2017 = 4%* *Based on acquisition cost Cash On Hand • March 31, 2017 = $85,000,000 Credit Facility Capacity • March 31, 2017 Capacity = $40,000,000 Mississauga, Canada This property is not owned by Strategic Storage Growth Trust, Inc. This property was acquired by another program sponsored by our sponsor or its affiliates. ı. Investor Presentation 12
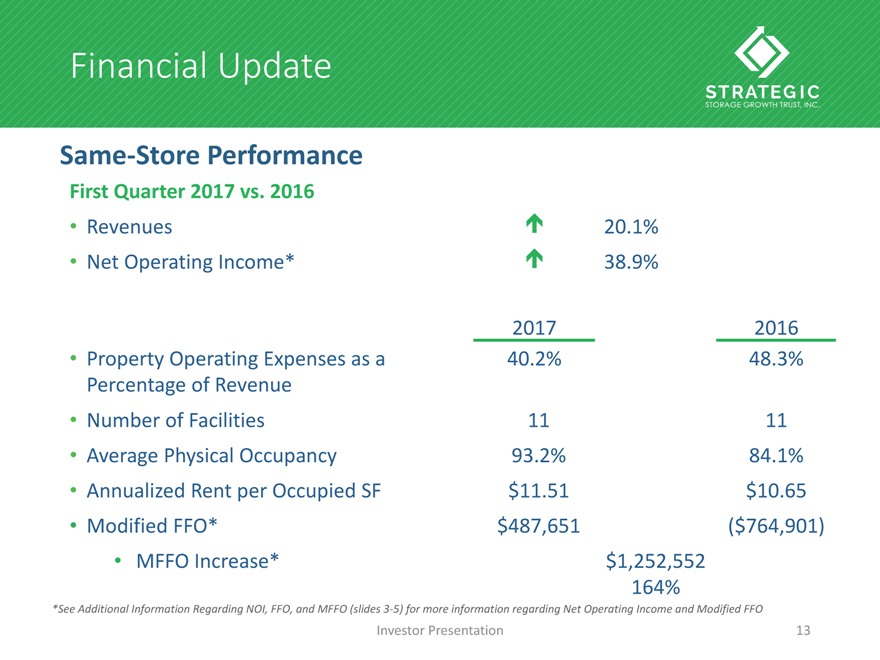
Financial Update First Quarter 2017 vs. 2016 • Revenues é 20.1% • Net Operating Income* é 38.9% 2017 2016 • Property Operating Expenses as a Percentage of Revenue 40.2% 48.3% • Number of Facilities 11 11 • Average Physical Occupancy 93.2% 84.1% • Annualized Rent per Occupied SF $11.51 $10.65 • Modified FFO* $487,651 ($764,901) • MFFO Increase* $1,252,552 164% Same-Store Performance *See Additional Information Regarding NOI, FFO, and MFFO (slides3-5) for more information regarding Net Operating Income and Modified FFO Investor Presentation 13
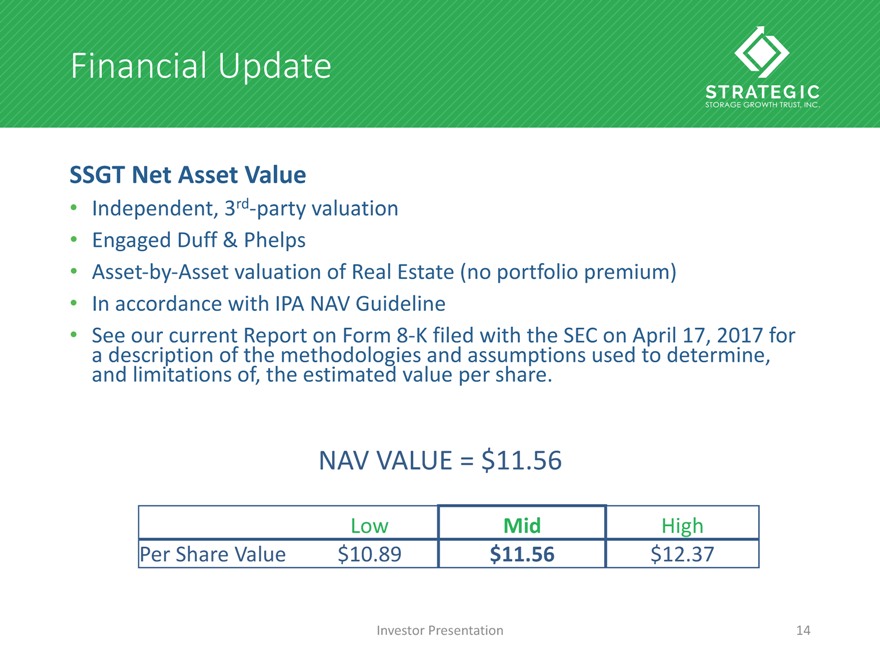
Financial Update SSGT Net Asset Value • Independent,3rd-party valuation • Engaged Duff & Phelps •Asset-by-Asset valuation of Real Estate (no portfolio premium) • In accordance with IPA NAV Guideline • See our current Report on Form8-K filed with the SEC on April 17, 2017 for a description of the methodologies and assumptions used to determine, and limitations of, the estimated value per share. NAV VALUE = $11.56 Low Mid High Per Share Value $10.89 $11.56 $12.37 Investor Presentation 14

Current Portfolio 7211 Arlington Ave Riverside, CA 610 Units 60,100 NRSF 97.4% Phys. Occ.* 1001 Toll Gate Rd Elgin, IL 410 Units 49,600 NRSF 93.0% Phys. Occ.* 3252 N. US Hwy 1 Ft. Pierce, FL 770 Units 88,400 NRSF 96.0% Phys. Occ.* 1302 Marquette Dr Romeoville, IL 680 Units 66,700 NRSF 87.3% Phys. Occ.* 1111 W. Gladstone Azusa, CA 660 Units 64,400 NRSF 95.3% Phys. Occ.* 7760 Lorraine Ave Stockton, CA 560 Units 49,100 NRSF 98.0% Phys. Occ.* 3850 Airport Rd. Colorado Springs, CO 680 Units
61,800 NRSF 81.6% Phys. Occ.* 4866 E. Russell Rd Las Vegas, NV 1,210 Units 171,100 NRSF 92.1% Phys. Occ.* *Occupancy as of 3/31/17 Investor Presentation 15
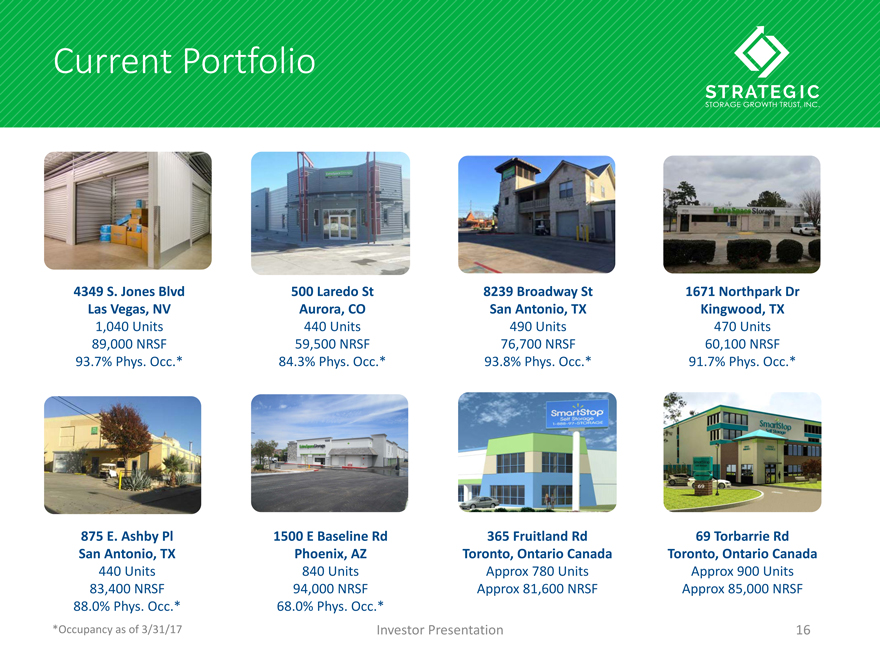
Current Portfolio * 4349 S. Jones Blvd Las Vegas, NV 1,040 Units 89,000 NRSF 93.7% Phys. Occ.* 365 Fruitland Rd Toronto, Ontario Canada Approx 780 Units Approx 81,600 NRSF 500 Laredo St Aurora, CO 440 Units 59,500 NRSF 84.3% Phys. Occ.* 8239 Broadway St San Antonio, TX 490 Units 76,700 NRSF 93.8% Phys. Occ.* 1671 Northpark Dr Kingwood, TX 470 Units 60,100 NRSF 91.7% Phys. Occ.* 875 E. Ashby Pl San Antonio, TX 440 Units 83,400 NRSF 88.0% Phys. Occ.* 69 Torbarrie Rd Toronto, Ontario Canada Approx 900 Units Approx 85,000 NRSF 1500 E Baseline Rd Phoenix, AZ 840 Units 94,000 NRSF 68.0% Phys. Occ.* Occupancy as of 3/31/17 Investor Presentation 16
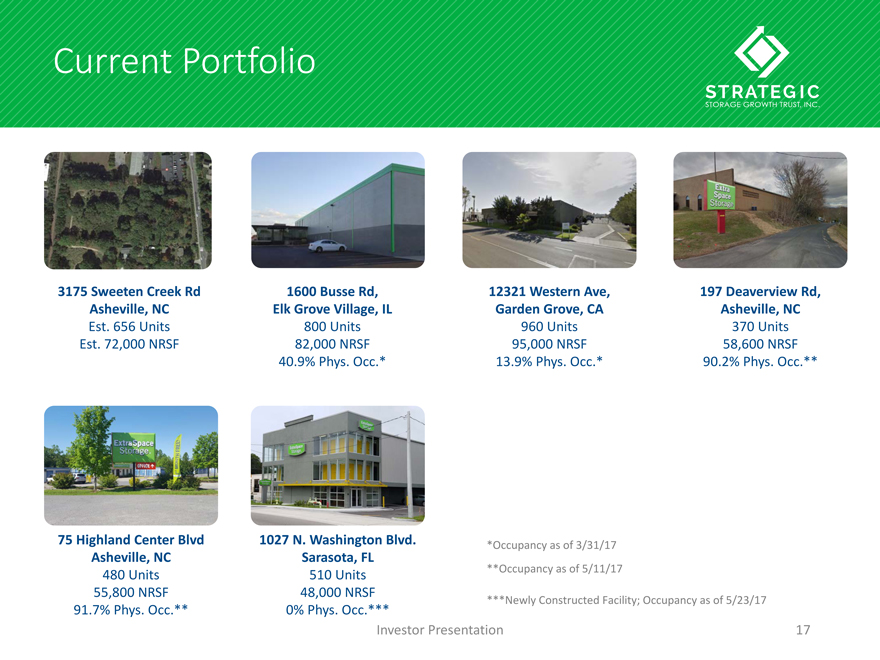
Current Portfolio Investor Presentation 17 3175 Sweeten Creek Rd Asheville, NC Est. 656 Units Est. 72,000 NRSF 1600 Busse Rd, Elk Grove Village, IL 800 Units 82,000 NRSF 40.9% Phys. Occ.* 12321 Western Ave, Garden Grove, CA 960 Units 95,000 NRSF 13.9% Phys. Occ.* 197 Deaverview Rd, Asheville, NC 370 Units 58,600 NRSF 90.2% Phys. Occ.** 75 Highland Center Blvd Asheville, NC 480 Units 55,800 NRSF 91.7% Phys. Occ.** 1027 N. Washington Blvd. *Occupancy as of 3/31/17 Sarasota, FL 510 Units 48,000 NRSF 0% Phys. Occ.*** **Occupancy as of 5/11/17 ***Newly Constructed Facility; Occupancy as of 5/23/17 Current Portfolio Investor Presentation 17
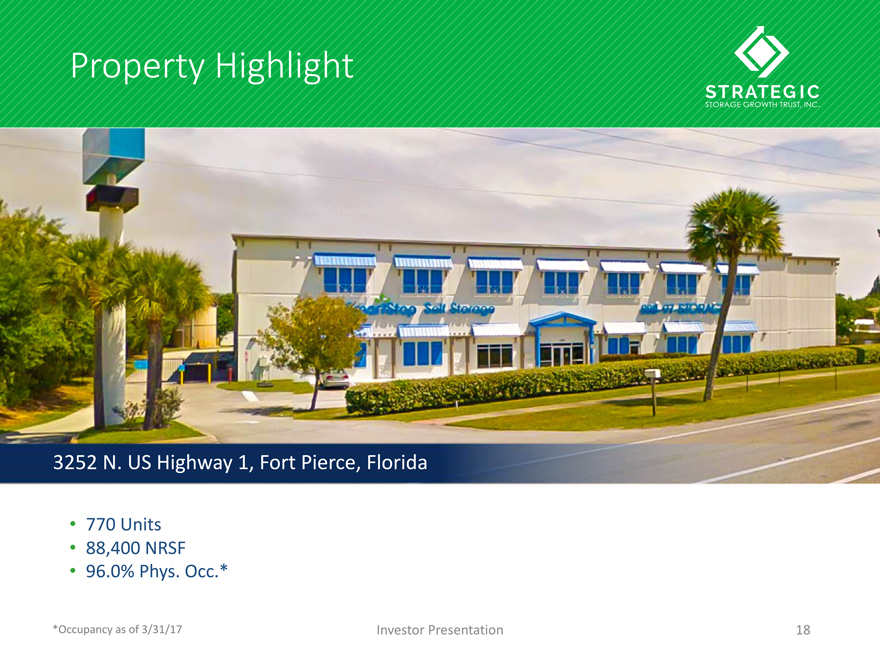
Property Highlight • 770 Units • 88,400 NRSF • 96.0% Phys. Occ.* *Occupancy as of 3/31/17 3252 N. US H
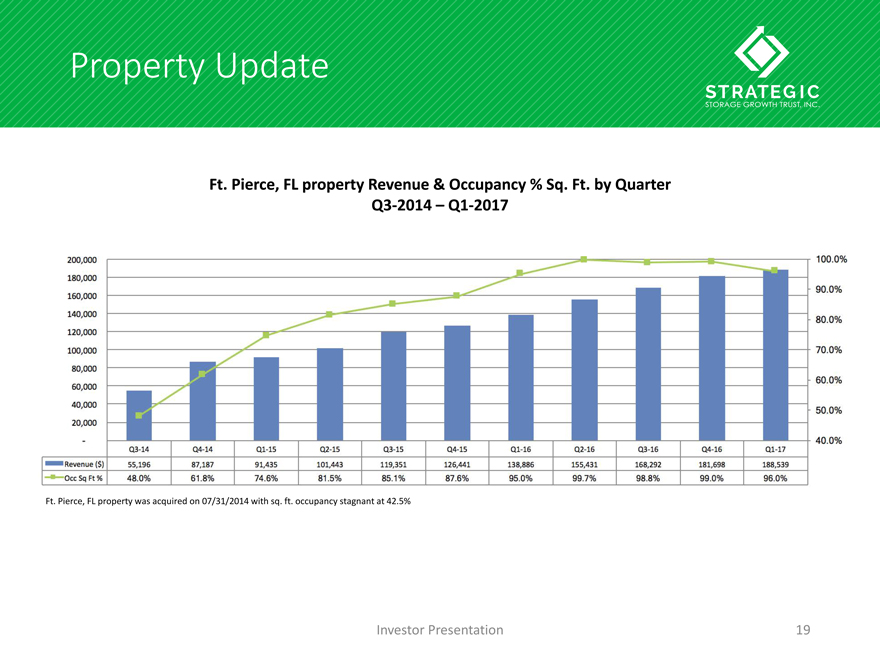
Highway 1, Fort Pierce, Florida Property Update Ft. Pierce, FL property Revenue & Occupancy % Sq. Ft. by QuarterQ3-2014 –Q1-2017, 200,00 180,000 160,000 140,000 120,000 100,000 80,000 60,000 40,000 20,000 100.0% 90.0% 80.0% 70.0% 60.0% 50.0% 40.0% Ft. Pierce, FL property was acquired on 07/31/2014 with sq. ft. occupancy stagnant at 42.5% Investor Presentation 19
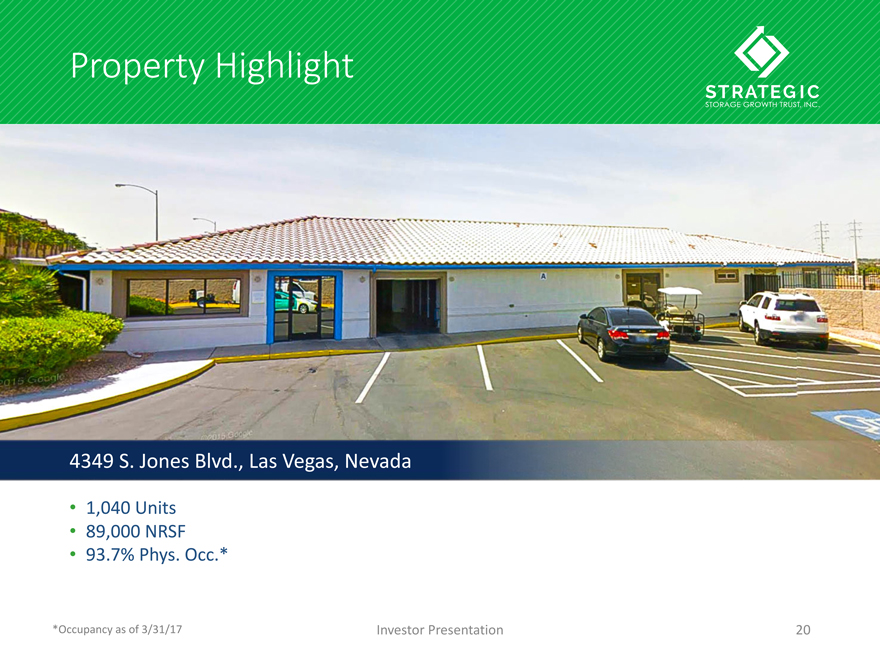
Property Highlight • 1,040 Units • 89,000 NRSF • 93.7% Phys. Occ.* 4349 S. Jones Blvd., Las Vegas, Nevada *Occupancy as of 3/31/17 Investor Presentation 20
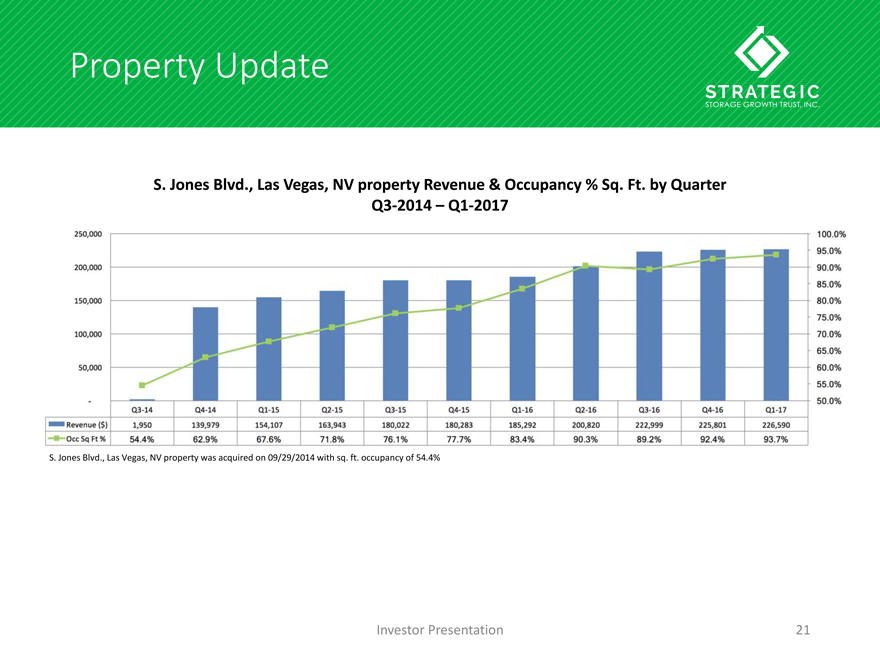
Property Update
S. Jones Blvd., Las Vegas, NV property Revenue & Occupancy % Sq. Ft. by Quarter
Q3-2014 –Q1-2017
250,000 200,000 150,000 100,000 50,000
100.0% 95.0% 90.0% 85.0% 80.0% 75.0% 70.0% 65.0% 60.0% 55.0% 50.0%
1,950 139,979 154,107 163,943 180,022 180,283 185,292 200,820 222,999 225,801 226,590
S. Jones Blvd., Las Vegas, NV property was acquired on 09/29/2014 with sq. ft. occupancy of 54.4%
Investor Presentation 21
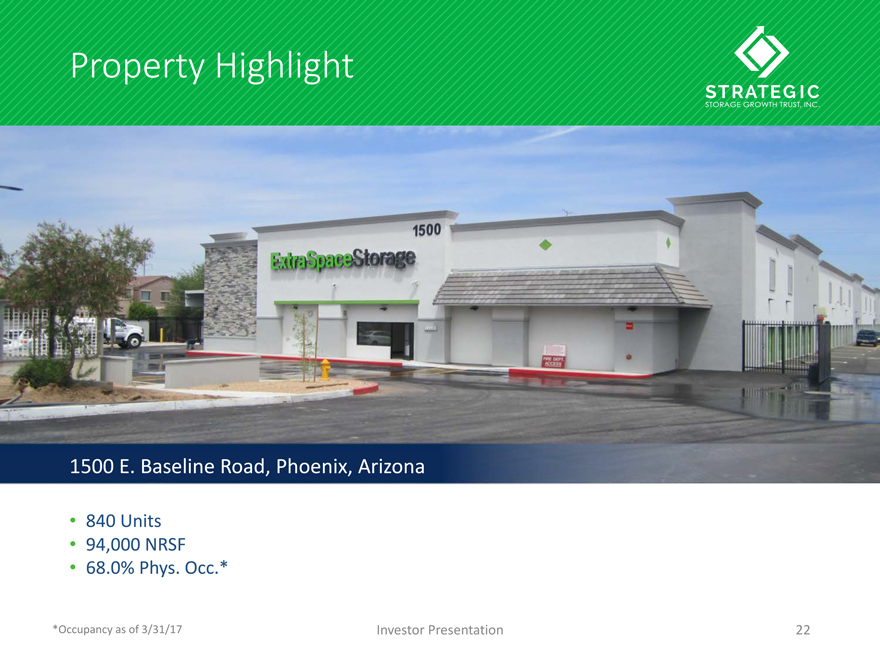
Property Highlight
• 840 Units
• 94,000 NRSF
• 68.0% Phys. Occ.*
1500 E. *Occupancy as of 3/31/17
Investor Presentation 22
Baseline R
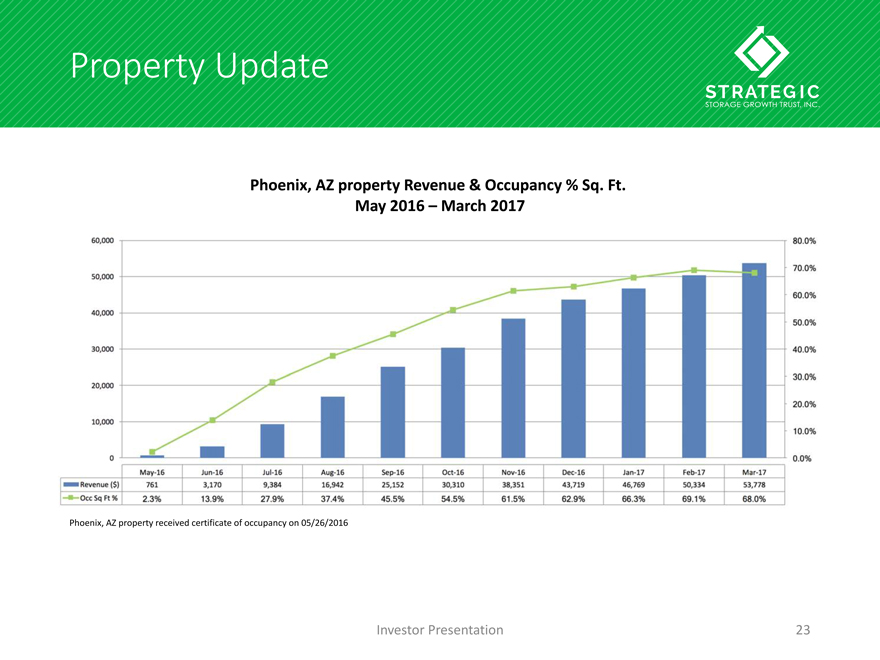
Phoenix, AZ property Revenue & Occupancy % Sq. Ft.
60,000 50,000 40,000 30,000 20,000 10,000 0
80.0% 70.0% 60.0% 50.0% 40.0% 30.0% 20.0% 10.0% 0.0%
761, 3,170 9,384 16,942 25,152 30,310 38,351 43,719 46,769 46,769 50,334 53,778
May 2016 – March 2017
Phoenix, AZ property received certificate of occupancy on 05/26/2016oad, Phoenix, Arizona
Property Update
Investor Presentation 23

Recent Acquisition
• 760 Units + 40 RV Spaces
• 82,000 NRSF
• Property Acquired 1/13/2017
• 40.9% Phys. Occ.*
1600 Busse Road, Elk Grove Village (Chicago), Illinois
*Occupancy as of 3/31/17
Investor Presentation 24
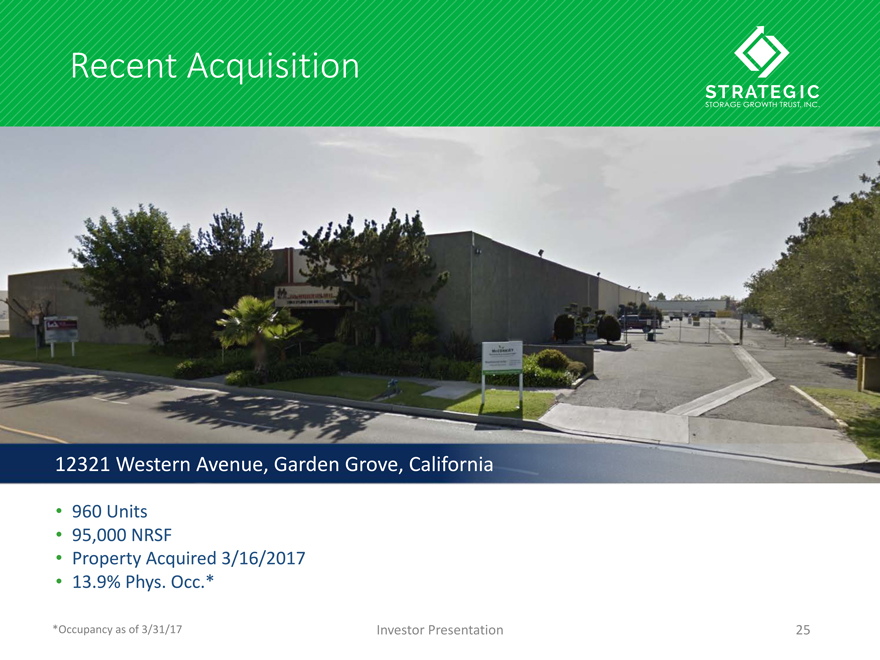
Recent Acquisition
• 960 Units
• 95,000 NRSF
• Property Acquired 3/16/2017
• 13.9% Phys. Occ.*
12321 Western Avenue, Garden Grove, California
*Occupancy as of 3/31/17
Investor Presentation 25
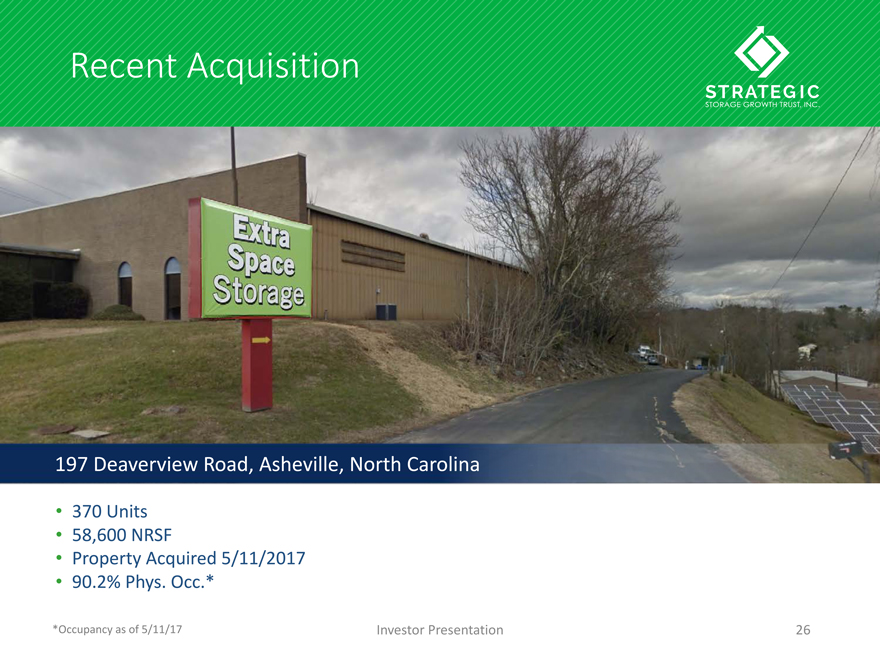
Recent Acquisition
197 Deaverview Road, Asheville, North Carolina
• 370 Units
• 58,600 NRSF
• Property Acquired 5/11/2017
• 90.2% Phys. Occ.*
*Occupancy as of 5/11/17
Investor Presentation 26
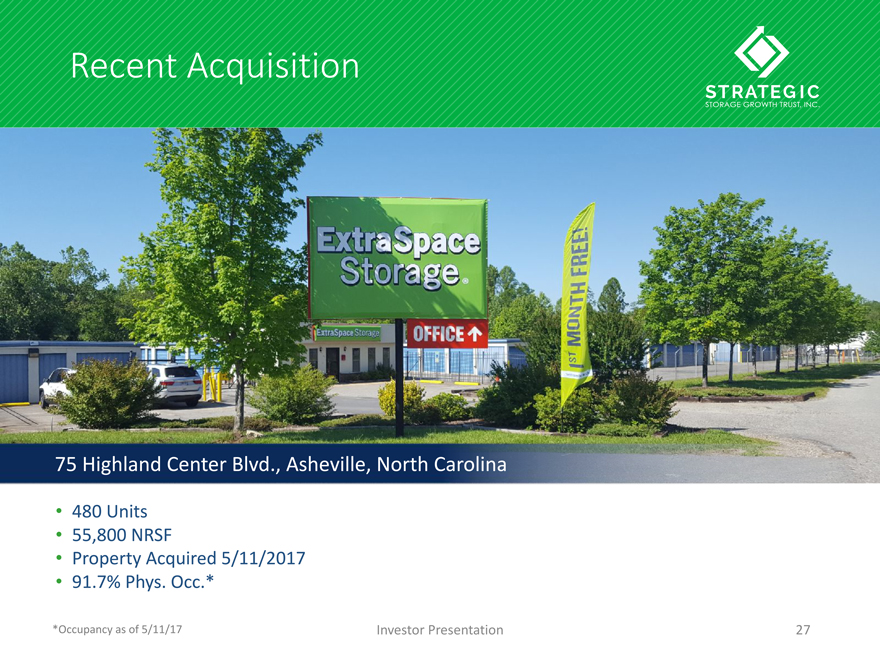
Recent Acquisition
75 Highland Center Blvd., Asheville, North Carolina
• 480 Units
• 55,800 NRSF
• Property Acquired 5/11/2017
• 91.7% Phys. Occ.*
*Occupancy as of 5/11/17
Investor Presentation 27
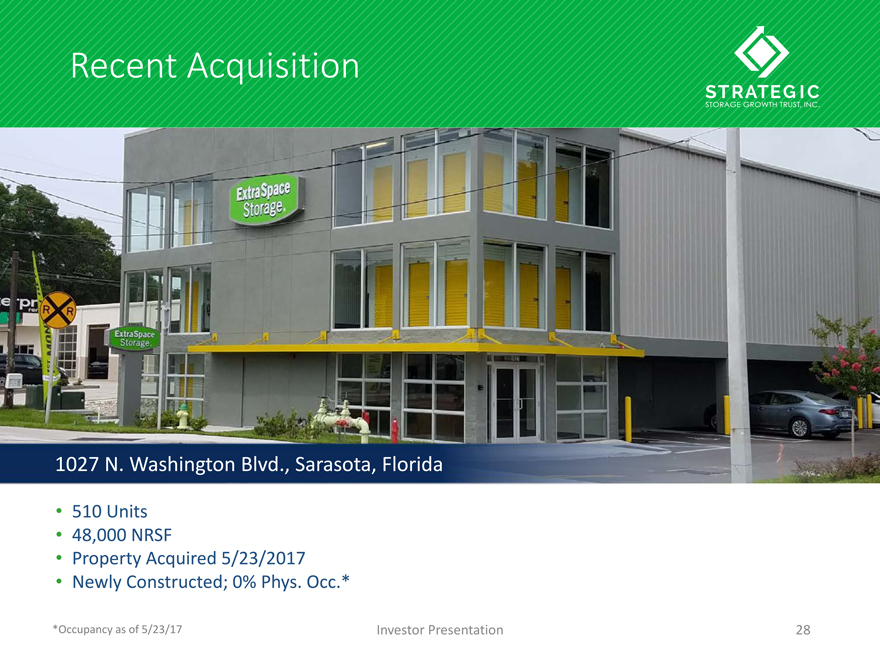
Recent Acquisition
1027 N. Washington Blvd., Sarasota, Florida
• 510 Units
• 48,000 NRSF
• Property Acquired 5/23/2017
• Newly Constructed; 0% Phys. Occ.*
*Occupancy as of 5/23/17
Investor Presentation 28
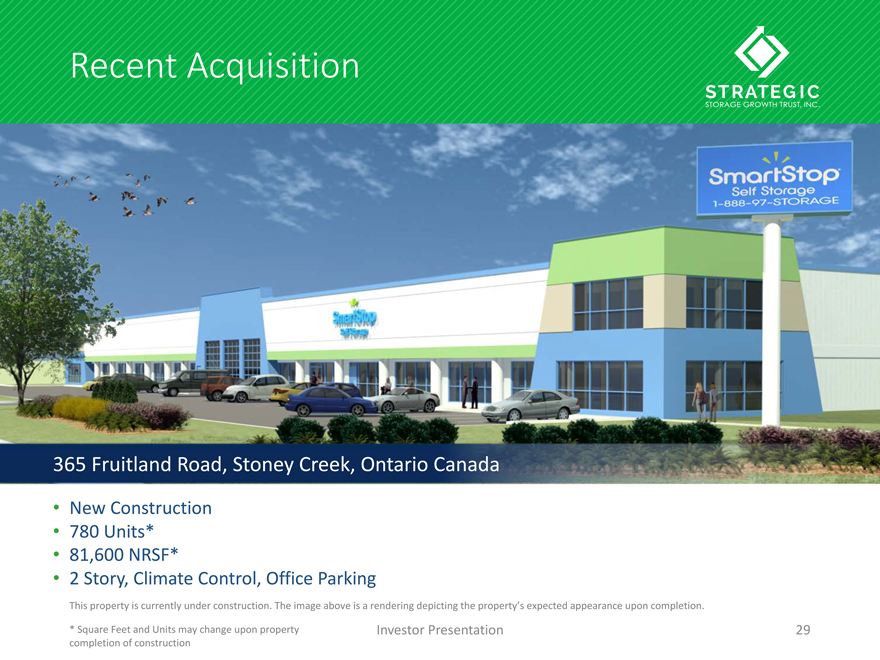
Recent Acquisition
* Square Feet and Units may change upon property completion of construction
• New Construction
• 780 Units*
• 81,600 NRSF*
• 2 Story, Climate Control, Office Parking
365 Fruitland Road, Stoney Creek, Ontario Canada
This property is currently under construction. The image above is a rendering depicting the property’s expected appearance upon completion.
Investor Presentation 29
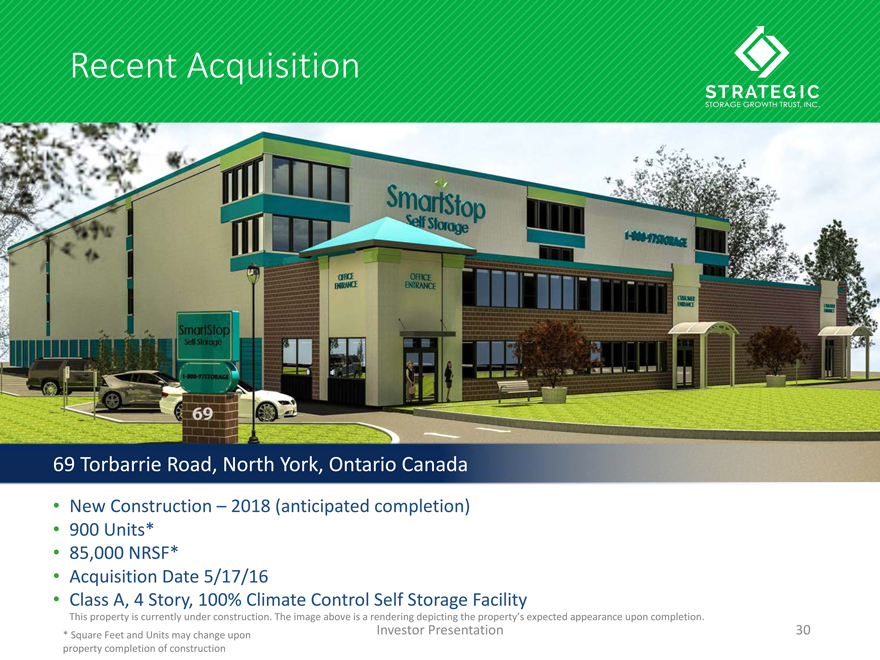
Recent Acquisition
* Square Feet and Units may change upon property completion of construction
• New Construction – 2018 (anticipated completion)
• 900 Units*
• 85,000 NRSF*
• Acquisition Date 5/17/16
• Class A, 4 Story, 100% Climate Control Self Storage Facility
69 Torbarrie Road, North York, Ontario Canada
This property is currently under construction. The image above is a rendering depicting the property’s expected appearance upon completion.
Investor Presentation 30
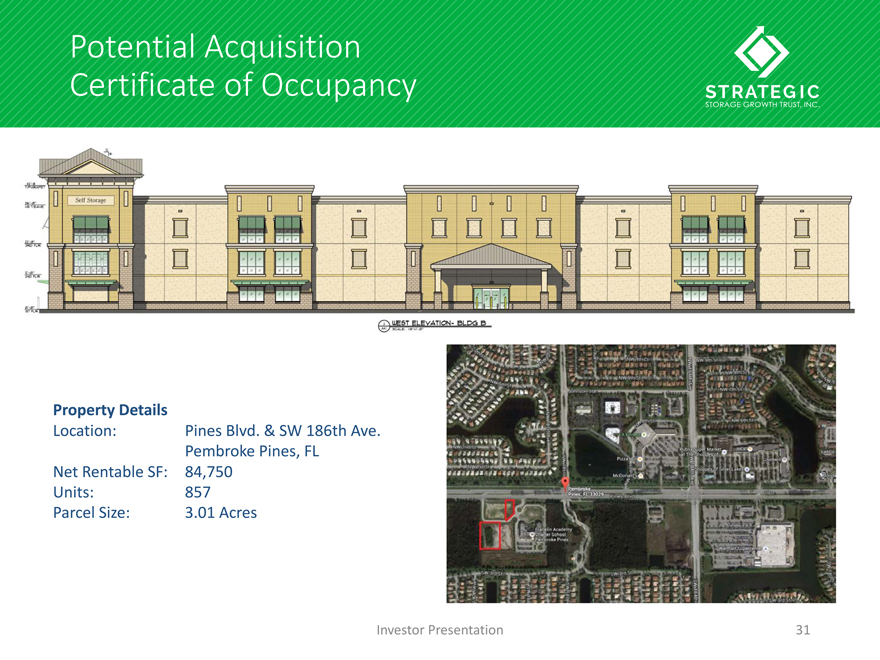
Potential Acquisition
Certificate of Occupancy
Property Details
Location: Pines Blvd. & SW 186th Ave.
Pembroke Pines, FL
Net Rentable SF: 84,750
Units: 857
Parcel Size: 3.01 Acres
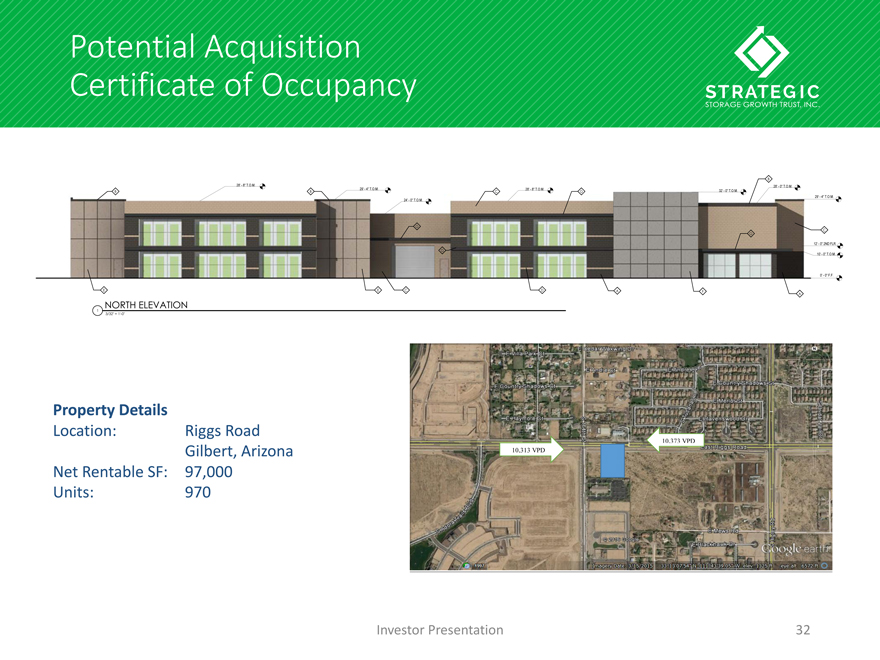
Certificate of Occupancy
Property Details
Location: Riggs Road
Gilbert, Arizona
Net Rentable SF: 97,000
Units: 970
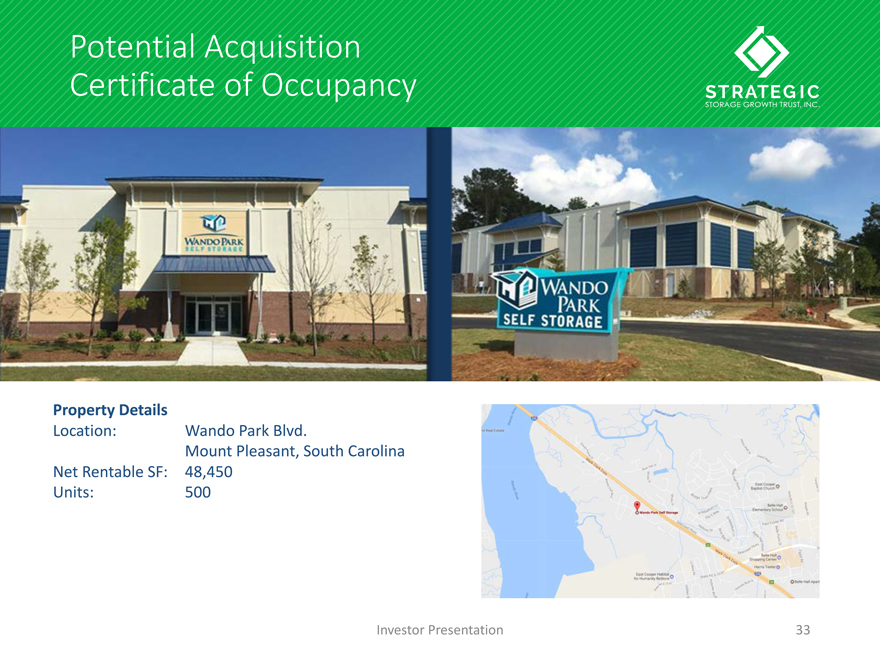
Potential Acquisition
Property Details
Location: Wando Park BIvd.
Mount Pleasant, South Carolina
Net Rentable SF: 48, 450
Units: 500
33
Potential Acquisition Potential Acquisition Certificate of Occupancy Property Details Location: Wando Park Blvd.
Mount Pleasant, South Carolina Net Rentable SF: 48,450 Units: 500 CONFIDENTIAL New Construction,503-Unit, Climate-ControlledSelf-68,400 Square Feet / 48,280 Net Rentable Square 701 Wando Park Boulevard, Mt. Pleasant, South Carolina, Property Overview Name: Wando Park Self Storage Address: 701 Wando Park Boulevard, Mt. Pleasant, SC
Year Built / Opened: 2015-2016 / November 2016 Land: 1.5 acre land parcel Building Size: 68,400 SF / 48,280 NRSF Floors: 3 stories Units: 503 units Other Features: 100% Climate controlled 24 /7 video security (PTI security system) with keypad entrance to building and each floor
Motion-activated fluorescent lighting 2 elevators Building Details
Foundation: Reinforced concrete slab on grade Structural Framing: Steel frame Exterior Walls: Steel panel, masonry, stucco veneer Roof: TPO Roofing, metal Ceiling Height: 8 feet (floors 1 & 2) / 12 feet (floor 3) Office / Retail: ~900 SF Doors / Access: Betco doors /roll-up unit doors Restrooms: 2 Parking: 6 lined spaces + 1 handicapped space, plus large driveway turnaround for
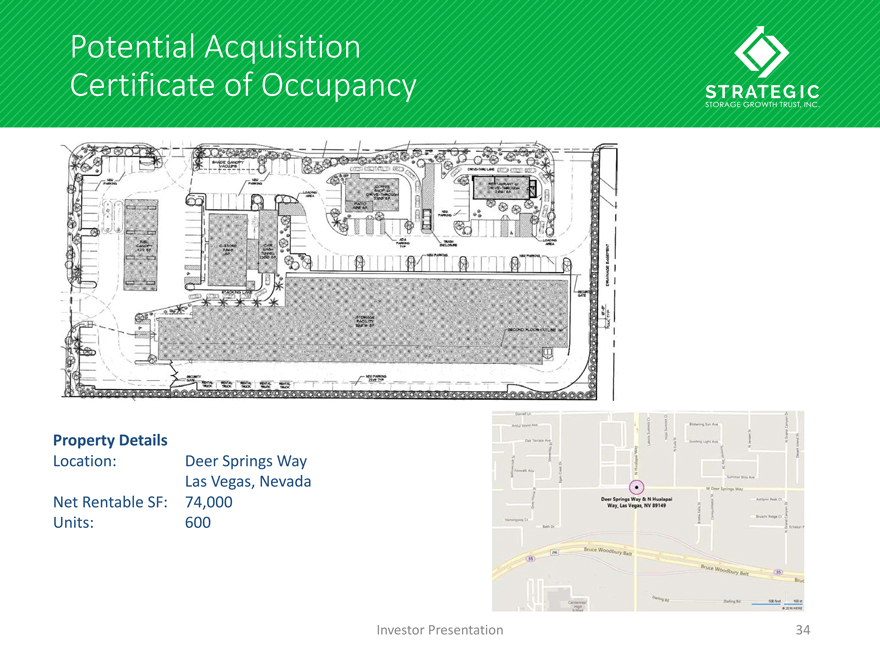
moving trucks and overflow parking Property Details Wando Park Property DetailsCertificate of Occupa Investor Presentation 33 Potential Acquisition Certificate of Occupancy Property Details Location: Deer Springs Way Las Vegas, Nevada Net Rentable SF: 74,000 Units: 600
THE PROPERTY StorageOne Development @ Deer Springs & Hualapai Siteplan THE PROPERTY StorageOne Development @ Deer Springs &Hualapai Property Highlights Air cooled Manager’s residence on site Office/merchandise showroom Wide driveways Individuallyalarmed and sprinklered units
Located across from planned grocery anchored shopping center Large pylon sign
Major residential growth in the immediate area Close/immediate access to the 215 beltway at Hualapai
Other planned uses on 5 acre commercial subdivision include corner convenience
store with car wash, free standing national fast food restaurant, and free standing national coffee chain Property Location/Accessncy Investor Presentation 34

Publicly Traded Self Storage Companiesublicly Traded Self Storage Companies
PublicNon-Traded Self Storage REITs
NYSE: PSA NYSE: LSI NYSE: UHAL NYSE: EXR NYSE: CUBE NYSE: JCAP NYSE: NSA
Investor Presentation 35

QUESTIONS?
Investor Presentation 36