Exhibit 99.1
Strategic Storage Growth Trust, Inc. Second Quarter Update H. Michael Schwartz – Founder,)Chairman)&)CEO Is the sponsor of Strategic Storage Growth Trust, Inc. Investor Presentation
Disclaimer & Risk Factors This investor presentation may contain certain forward-looking statements within the meaning of Section 27A of the Securities Act of 1933, as amended, and Section 21E of the Securities Exchange Act of 1934, as amended. Such forward-looking statements can generally be identified by our use of forward-looking terminology such as “may ” “will,” “expect,” “intend,” “anticipate,” “estimate,” “believe,” “continue,” or other similar words. Because such statements include risks, uncertainties and contingencies, actual results may differ materially from the expectations, intentions, beliefs, plans or predictions of the future expressed or implied by such forward-looking statements. These risks, uncertainties and contingencies include, but are not limited to: uncertainties relating to changes in general economic and real estate conditions; uncertainties relating to the implementation of our real estate investment strategy; uncertainties relating to financing availability and capital proceeds; uncertainties relating to the closing of property acquisitions; uncertainties related to the timing and availability of distributions; and other risk factors as outlined in the Company’s public filings with the Securities and Exchange Commission. This is neither an offer nor a solicitation to purchase securities. • See our Form10-K and recent Form10-Q for specific risks associated with an investment in Strategic Storage Growth Trust, Inc. • As of June 30, 2017, our accumulated deficit was approximately $14.9 million, and we anticipate that our operations may not be profitable in 2017. • We have paid distributions from sources other than our cash flows from operations, including from the net proceeds of our public offering. We are not prohibited from undertaking such activities by our charter, bylaws or investment policies, and we may use an unlimited amount from any source to pay our distributions. For the years ended December 31, 2014 and 2015, we funded 100% of our distributions using proceeds from our offering. For the year ended December 31, 2016, the payment of distributions was paid 4.1% from cash flows from operations and 95.9% from offering proceeds. For the six months ended June 30, 2017, the payment of distributions was paid 16.0% from cash flows from operations and 84.0% from offering proceeds. If we continue to pay distributions from sources other than cash flows from operations, we will have fewer funds available for acquiring properties, which may reduce our stockholders’ overall returns. Additionally, to the extent distributions exceed cash flows from operations, a stockholder’s basis in our stock may be reduced and, to the extent distributions exceed a stockholder’s basis, the stockholder may recognize a capital gain. • No public market currently exists for shares of our common stock and we may not list our shares on a national securities exchange before three to five years after completion of our public offering, if at all; therefore, it may be difficult to sell your shares. If you sell your shares, it will likely be at a substantial discount. Our charter does not require us to pursue a liquidity transaction at any time. • We may only calculate the value per share for our shares annually and, therefore, you may not be able to determine the net asset value of your shares on an ongoing basis. • We have limited prior operating history, and the prior performance of real estate programs sponsored by affiliates of our sponsor may not be indicative of our future results. • We have no employees and are dependent on our advisor to select investments and conduct our operations, and there is no guarantee that our advisor will devote adequate time or resources to us. • There are substantial conflicts of interest among us and our sponsor, advisor, property manager, and dealer manager. • Our advisor will face conflicts of interest relating to the purchase of properties, including conflicts with Strategic Storage Trust II, Inc. and Strategic Storage Trust IV, Inc., and such conflicts may not be resolved in our favor, which could adversely affect our investment opportunities. • We will pay substantial fees and expenses to our advisor and its affiliates for the services they provide to us, which will reduce cash available for investment and distribution. We may be required to pay our advisor a significant distribution if our advisory agreement is involuntarily terminated. • We may incur substantial debt, which could hinder our ability to pay distributions to our stockholders or could decrease the value of your investment. • We may fail to qualify as a REIT, which could adversely affect our operations and our ability to make distributions. • Our board of directors may change any of our investment objectives without your consent. is the sponsor of Strategic Storage Growth Trust, Inc. Investor Presentation 2
Additional Information Regarding NOI, FFO & MFFO Funds from Operations (“FFO”) and Modified Funds from Operations (“MFFO”) Due to certain unique operating characteristics of real estate companies, the National Association of Real Estate Investment Trusts, or NAREIT, an industry trade group, has promulgated a measure known as funds from operations, or FFO, which SSGT believes to be an appropriate supplemental measure to reflect the operating performance of a REIT. The use of FFO is recommended by the REIT industry as a supplemental performance measure. FFO is not equivalent to SSGT’s net income (loss) as determined under GAAP. SSGT defines FFO, anon-GAAP measure, consistent with the standards established by the White Paper on FFO approved by the Board of Governors of NAREIT, as revised in February 2004, or the White Paper. The White Paper defines FFO as net income (loss) computed in accordance with GAAP, excluding gains or losses from sales of property and asset impairment write downs, plus depreciation and amortization, and after adjustments for unconsolidated partnerships and joint ventures. Adjustments for unconsolidated partnerships and joint ventures are calculated to reflect FFO on the same basis. SSGT’s FFO calculation complies with NAREIT’s policy described above. The historical accounting convention used for real estate assets requires straight-line depreciation of buildings and improvements, which implies that the value of real estate assets diminishes predictably over time. Diminution in value may occur if such assets are not adequately maintained or repaired and renovated as required by relevant circumstances or other measures necessary to maintain the assets are not undertaken. However, SSGT believes that, since real estate values historically rise and fall with market conditions, including inflation, interest rates, the business cycle, unemployment and consumer spending, presentations of operating results for a REIT using historical accounting for depreciation may be less informative. In addition, in the determination of FFO, SSGT believes it is appropriate to disregard impairment charges, as this is a fair value adjustment that is largely based on market fluctuations and assessments regarding general market conditions which can change over time. An asset will only be evaluated for impairment if certain impairment indications exist and if the carrying value, or book value, exceeds the total estimated undiscounted future cash flows (including net rental revenues, net proceeds on the sale of the property, and any other ancillary cash flows at a property or group level under GAAP) from such asset. Testing for impairment is a continuous process and is analyzed on a quarterly basis. Investors should note, however, that determinations of whether impairment charges have been incurred are based partly on anticipated operating performance, because estimated undiscounted future cash flows from a property, including estimated future net rental revenues, net proceeds on the sale of the property, and certain other ancillary cash flows, are taken into account in determining whether an impairment charge has been incurred. While impairment charges are excluded from the calculation of FFO as described above, investors are cautioned that due to the fact that impairments are based on estimated future undiscounted cash flows and that SSGT intends to have a relatively limited term of its operations; it could be difficult to recover any impairment charges through the eventual sale of the property. To date, SSGT has not recognized any impairments. Historical accounting for real estate involves the use of GAAP. Any other method of accounting for real estate such as the fair value method cannot be construed to be any more accurate or relevant than the comparable methodologies of real estate valuation found in GAAP. Nevertheless, SSGT believes that the use of FFO, which excludes the impact of real estate related depreciation and amortization and impairments, assists in providing a more complete understanding of its performance to investors and to its management, and when compared year over year, reflects the impact on SSGT’s operations from trends in occupancy rates, rental rates, operating costs, general and administrative expenses, and interest costs, which may not be immediately apparent from net income (loss). However, FFO or modified funds from operations (“MFFO”), discussed below, should not be construed to be more relevant or accurate than the current GAAP methodology in calculating net income (loss) or in its applicability in evaluating SSGT’s operating performance. The method utilized to evaluate the value and performance of real estate under GAAP should be considered a more relevant measure of operational performance and is, therefore, given more prominence than thenon-GAAP FFO and MFFO measures and the adjustments to GAAP in calculating FFO and MFFO. Changes in the accounting and reporting rules under GAAP that were put into effect and other changes to GAAP accounting for real estate subsequent to the establishment of NAREIT’s definition of FFO have prompted an increase in cash-settled expenses, specifically acquisition fees and expenses, that are expensed as operating expenses under GAAP. SSGT believes these fees and expenses do not affect its overall long-term operating performance. Publicly registered,non-traded REITs typically have a significant amount of acquisition activity and are substantially more dynamic during their initial years of investment and operation. is the sponsor of Strategic Storage Growth Trust, Inc. Investor Presentation 3
Additional Information Regarding NOI, FFO & MFFO The purchase of properties, and the corresponding expenses associated with that process, is a key feature of SSGT’s business plan in order to generate operational income and cash flow in order to make distributions to investors. While otherstart-up entities may also experience significant acquisition activity during their initial years, SSGT believes that publicly registered,non-traded REITs are unique in that they typically have a limited life with targeted exit strategies within a relatively limited time frame after the acquisition activity ceases. As disclosed in the prospectus for SSGT’s offering, SSGT will use the proceeds raised in its offering to acquire properties and SSGT expects to begin the process of achieving a liquidity event (i.e., listing of its shares of common stock on a national securities exchange, a merger or sale, the sale of all or substantially all of its assets, or another similar transaction) within three to five years after the completion of its offering, which is generally comparable to other publicly registered,non-traded REITs. Thus, SSGT does not intend to continuously purchase assets and intends to have a limited life. The decision whether to engage in any liquidity event is in the sole discretion of the board of directors of SSGT. Due to the above factors and other unique features of publicly registered,non-traded REITs, the Investment Program Association, or the IPA, an industry trade group, has standardized a measure known as MFFO, which the IPA has recommended as a supplemental measure for publicly registered,non-traded REITs and which SSGT believes to be another appropriate supplemental measure to reflect the operating performance of a publicly registered,non-traded REIT having the characteristics described above. MFFO is not equivalent to SSGT’s net income (loss) as determined under GAAP, and MFFO may not be a useful measure of the impact of long-term operating performance on value if SSGT does not ultimately engage in a liquidity event. SSGT believes that, because MFFO excludes acquisition fees and expenses that affect its operations only in periods in which properties are acquired and that SSGT considers more reflective of investing activities, as well as othernon-operating items included in FFO, MFFO can provide, on a going-forward basis, an indication of the sustainability (that is, the capacity to continue to be maintained) of SSGT’s operating performance after the period in which it is acquiring properties and once its portfolio is in place. By providing MFFO, SSGT believes it is presenting useful information that assists investors and analysts to better assess the sustainability of its operating performance after its offering has been completed and its properties have been acquired. SSGT also believes that MFFO is a recognized measure of sustainable operating performance by the publicly registered,non-traded REIT industry. Further, SSGT believes MFFO is useful in comparing the sustainability of its operating performance after its offering and acquisitions are completed with the sustainability of the operating performance of other real estate companies that are not as involved in acquisition activities. Investors are cautioned that MFFO should only be used to assess the sustainability of SSGT’s operating performance after its offering has been completed and properties have been acquired, as it excludes acquisition fees and expenses that have a negative effect on SSGT’s operating performance during the periods in which properties are acquired. SSGT defines MFFO, anon-GAAP measure, consistent with the IPA’s Guideline2010-01, Supplemental Performance Measure for Publicly Registered,Non-Listed REITs: Modified Funds From Operations (the “Practice Guideline”) issued by the IPA in November 2010. The Practice Guideline defines MFFO as FFO further adjusted for the following items included in the determination of GAAP net income (loss): acquisition fees and expenses; amounts relating to straight line rents and amortization of above or below intangible lease assets and liabilities; accretion of discounts and amortization of premiums on debt investments;non-recurring impairments of real estate related investments;mark-to-market adjustments included in net income;non-recurring gains or losses included in net income from the extinguishment or sale of debt, hedges, foreign exchange, derivatives or securities holdings where trading of such holdings is not a fundamental attribute of the business plan, unrealized gains or losses resulting from consolidation from, or deconsolidation to, equity accounting, adjustments relating to contingent purchase price obligations included in net income, and after adjustments for consolidated and unconsolidated partnerships and joint ventures, with such adjustments calculated to reflect MFFO on the same basis. The accretion of discounts and amortization of premiums on debt investments, unrealized gains and losses on hedges, foreign exchange, derivatives or securities holdings, unrealized gains and losses resulting from consolidations, as well as other listed cash flow adjustments are adjustments made to net income (loss) in calculating cash flows from operations and, in some cases, reflect gains or losses which are unrealized and may not ultimately be realized. SSGT’s MFFO calculation complies with the IPA’s Practice Guideline described above. In calculating MFFO, SSGT excludes acquisition related expenses. The other adjustments included in the IPA’s Practice Guideline are not applicable to SSGT for the periods presented. Acquisition fees and expenses are paid in cash by SSGT, and it has not set aside or put into escrow any specific amount of proceeds from its offering to be used to fund acquisition fees and expenses. is the sponsor of Strategic Storage Growth Trust, Inc. Investor Presentation 4
Additional Information Regarding NOI, FFO & MFFO SSGT does not intend to fund acquisition fees and expenses in the future from operating revenues and cash flows, nor from the sale of properties and subsequentre-deployment of capital and concurrent incurring of acquisition fees and expenses. Acquisition fees and expenses include payments to SSGT’s advisor and third parties. Acquisition related expenses under GAAP are considered operating expenses and as expenses included in the determination of net income (loss) and income (loss) from continuing operations, both of which are performance measures under GAAP. All paid and accrued acquisition fees and expenses will have negative effects on returns to investors, the potential for future distributions, and cash flows generated by SSGT, unless earnings from operations or net sales proceeds from the disposition of other properties are generated to cover the purchase price of the property, these fees and expenses and other costs related to such property. In the future, if SSGT is not able to raise additional proceeds from future offerings, this could result in SSGT paying acquisition fees or reimbursing acquisition expenses due to its advisor, or a portion thereof, with net proceeds from borrowed funds, operational earnings or cash flows, net proceeds from the sale of properties, or ancillary cash flows. As a result, the amount of proceeds available for investment and operations would be reduced, or SSGT may incur additional interest expense as a result of borrowed funds. Further, under GAAP, certain contemplatednon-cash fair value and othernon-cash adjustments are considered operatingnon-cash adjustments to net income (loss) in determining cash flows from operations. In addition, SSGT views fair value adjustments of derivatives and the amortization of fair value adjustments related to debt as items which are unrealized and may not ultimately be realized or as items which are not reflective ofon-going operations and are therefore typically adjusted for when assessing operating performance. SSGT uses MFFO and the adjustments used to calculate it in order to evaluate its performance against other publicly registered,non-traded REITs which intend to have limited lives with short and defined acquisition periods and targeted exit strategies shortly thereafter. As noted above, MFFO may not be a useful measure of the impact of long-term operating performance if SSGT does not continue to operate in this manner. SSGT believes that its use of MFFO and the adjustments used to calculate it allow it to present its performance in a manner that reflects certain characteristics that are unique to publicly registered,non-traded REITs, such as their limited life, limited and defined acquisition period and targeted exit strategy, and hence that the use of such measures may be useful to investors. For example, acquisition fees and expenses are intended to be funded from the proceeds of SSGT’s offering and other financing sources and not from operations. By excluding expensed acquisition fees and expenses, the use of MFFO provides information consistent with management’s analysis of the operating performance of the properties. Additionally, fair value adjustments, which are based on the impact of current market fluctuations and underlying assessments of general market conditions, but can also result from operational factors such as rental and occupancy rates, may not be directly related or attributable to SSGT’s current operating performance. By excluding such charges that may reflect anticipated and unrealized gains or losses, SSGT believes MFFO provides useful supplemental information. Presentation of this information is intended to provide useful information to investors as they compare the operating performance of different REITs, although it should be noted that not all REITs calculate FFO and MFFO the same way, so comparisons with other REITs may not be meaningful. Furthermore, FFO and MFFO are not necessarily indicative of cash flow available to fund cash needs and should not be considered as an alternative to net income (loss) or income (loss) from continuing operations as an indication of SSGT’s performance, as an alternative to cash flows from operations, which is an indication of SSGT’s liquidity, or indicative of funds available to fund SSGT’s cash needs including its ability to make distributions to its stockholders. FFO and MFFO should be reviewed in conjunction with other measurements as an indication of SSGT’s performance. MFFO may be useful in assisting management and investors in assessing the sustainability of operating performance in future operating periods, and in particular, after the offering and acquisition stages are complete. Neither the SEC, NAREIT, nor any other regulatory body has passed judgment on the acceptability of the adjustments that SSGT uses to calculate FFO or MFFO. In the future, the SEC, NAREIT or another regulatory body may decide to standardize the allowable adjustments across the publicly registered,non-traded REIT industry and SSGT would have to adjust its calculation and characterization of FFO or MFFO. Net Operating Income or (“NOI”) NOI is anon-GAAP measure that we define as net income (loss), computed in accordance with GAAP, generated from properties before corporate general and administrative expenses, asset management fees, interest expense, depreciation, amortization, acquisition expenses and othernon-property related expenses. We believe that NOI is useful for investors as it provides a measure of the operating performance of our operating assets because NOI excludes certain items that are not associated with the operation of the properties. Additionally, we believe that NOI is a widely accepted measure of comparative operating performance in the real estate community. However, our use of the term NOI may not be comparable to that of other real estate companies as they may have different methodologies for computing this amount. is the sponsor of Strategic Storage Growth Trust, Inc. Investor Presentation 5
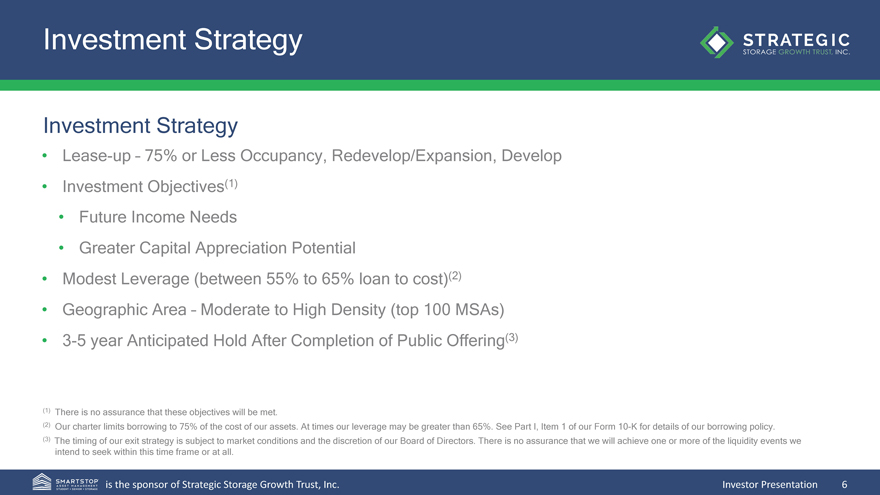
Investment Strategy Investment Strategy •Lease-up – 75% or Less Occupancy, Redevelop/Expansion, Develop • Investment Objectives(1) • Future Income Needs • Greater Capital Appreciation Potential • Modest Leverage (between 55% to 65% loan to cost)(2) • Geographic Area – Moderate to High Density (top 100 MSAs) •3-5 year Anticipated Hold After Completion of Public Offering(3) (1) There is no assurance that these objectives will be met. (2) Our charter limits borrowing to 75% of the cost of our assets. At times our leverage may be greater than 65%. See Part I, Item 1 of our Form10-K for details of our borrowing policy. (3) The timing of our exit strategy is subject to market conditions and the discretion of our Board of Directors. There is no assurance that we will achieve one or more of the liquidity events we intend to seek within this time frame or at all. is the sponsor of Strategic Storage Growth Trust, Inc. Investor Presentation 6

Investment Strategy DEVELOP REDEVELOP /EXPANSION LEASE-UP is the sponsor of Strategic Storage Growth Trust, Inc. Investor Presentation 7
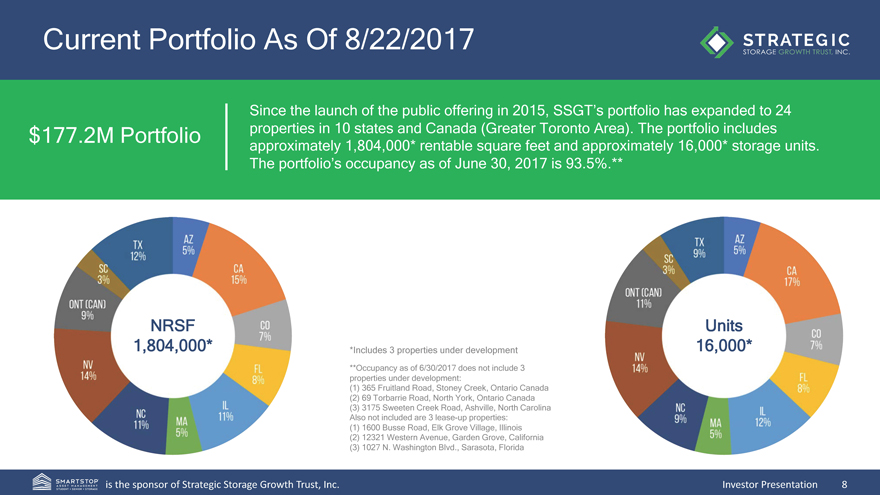
Current Portfolio As Of 8/22/2017 $177.2M Portfolio Since the launch of the public offering in 2015, SSGT’s portfolio has expanded to 24 properties in 10 states and Canada (Greater Toronto Area). The portfolio includes approximately 1,804,000* rentable square feet and approximately 16,000* storage units. The portfolio’s occupancy as of June 30, 2017 is 93.5%.** NRSF 1,804,000* *Includes 3 properties under development **Occupancy as of 6/30/2017 does not include 3 properties under development: (1) 365 Fruitland Road, Stoney Creek, Ontario Canada (2) 69 Torbarrie Road, North York, Ontario Canada (3) 3175 Sweeten Creek Road, Ashville, North Carolina Also not included are 3lease-up properties: (1) 1600 Busse Road, Elk Grove Village, Illinois (2) 12321 Western Avenue, Garden Grove, California (3) 1027 N. Washington Blvd., Sarasota, Florida Units 16,000* is the sponsor of Strategic Storage Growth Trust, Inc. Investor Presentation 8
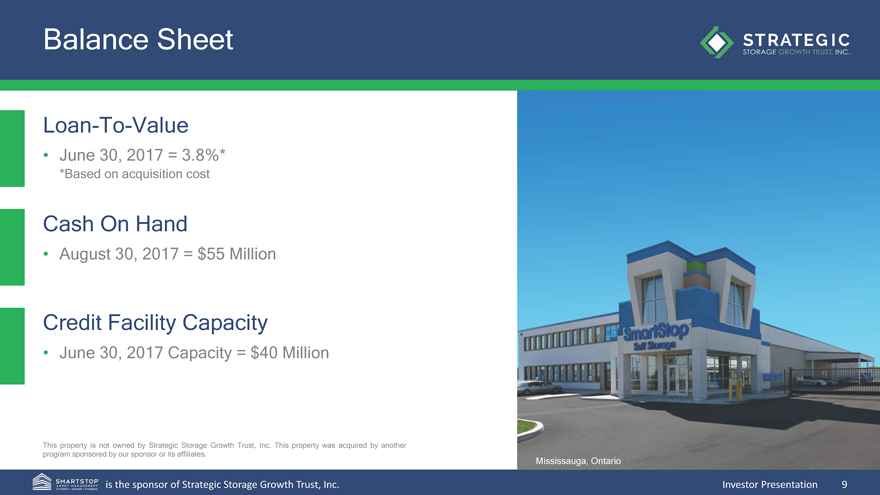
BalanceSheet Loan-To-Value • June 30, 2017 = 3.8%* *Based on acquisition cost Cash On Hand • August 30, 2017 = $55 Million Credit Facility Capacity • June 30, 2017 Capacity = $40 Million This property is not owned by Strategic Storage Growth Trust, Inc. This property was acquired by another program sponsored by our sponsor or its affiliates. is the sponsor of Strategic Storage Growth Trust, Inc. Mississauga, Ontario Investor Presentation 9
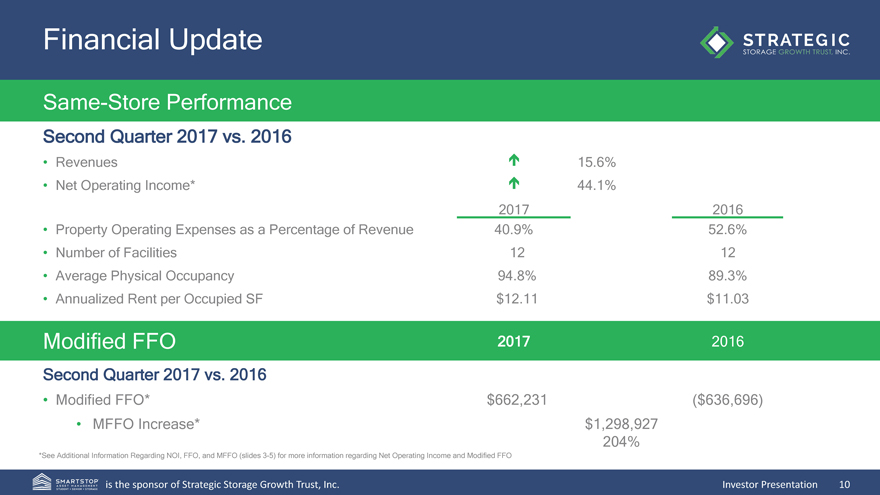
Financial Update Same-Store Performance Second Quarter 2017 vs. 2016 •Revenues 15.6% •Net Operating Income* 44.1% 20172016 •Property Operating Expenses as a Percentage of Revenue40.9%52.6% •Number of Facilities1212 •Average Physical Occupancy94.8%89.3% •Annualized Rent per Occupied SF$12.11$11.03 Modified FFO20172016 Second Quarter 2017 vs. 2016 •Modified FFO*$662,231($636,696) • MFFO Increase*$1,298,927 204% *See Additional Information Regarding NOI, FFO, and MFFO (slides3-5) for more information regarding Net Operating Income and Modified FFO is the sponsor of Strategic Storage Growth Trust, Inc.Investor Presentation10
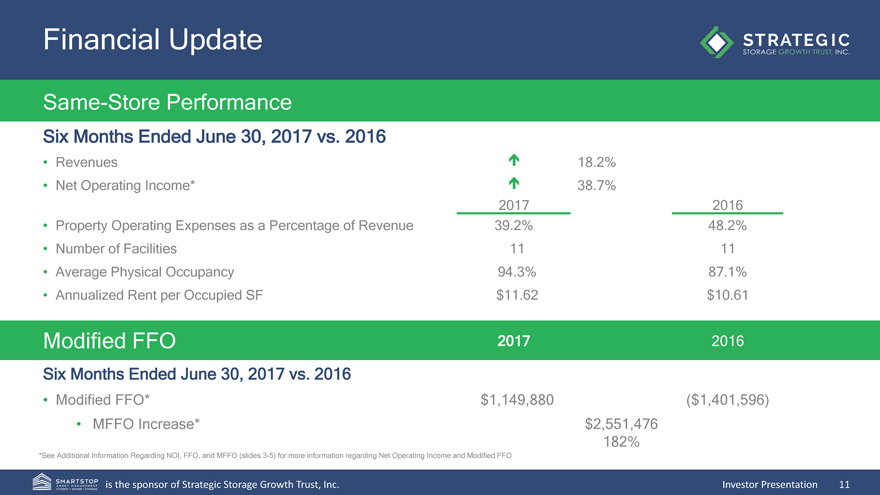
Financial Update Same-Store Performance Six Months Ended June 30, 2017 vs. 2016 •Revenues 18.2% •Net Operating Income* 38.7% 20172016 •Property Operating Expenses as a Percentage of Revenue39.2%48.2% •Number of Facilities1111 •Average Physical Occupancy94.3%87.1% •Annualized Rent per Occupied SF$11.62$10.61 Modified FFO20172016 Six Months Ended June 30, 2017 vs. 2016 •Modified FFO*$1,149,880($1,401,596) • MFFO Increase*$2,551,476 182% *See Additional Information Regarding NOI, FFO, and MFFO (slides3-5) for more information regarding Net Operating Income and Modified FFO is the sponsor of Strategic Storage Growth Trust, Inc.Investor Presentation11
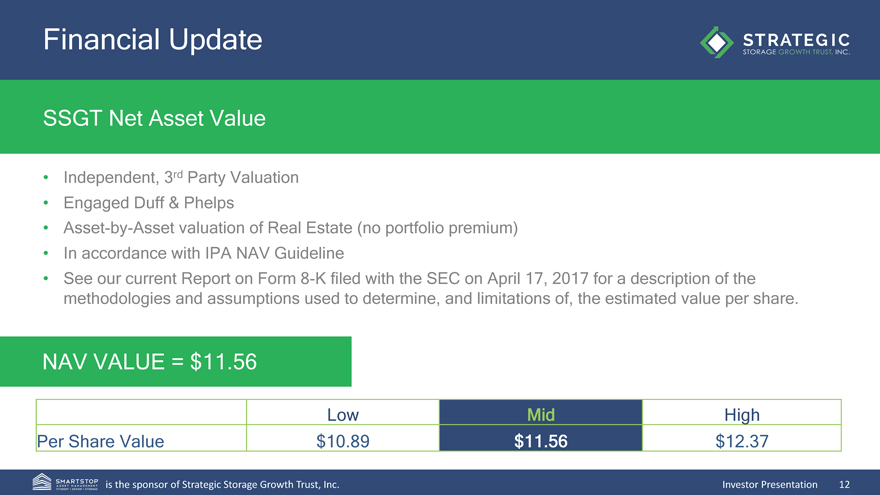
Financial Update SSGT Net Asset Value •Independent, 3rd Party Valuation •Engaged Duff & Phelps•Asset-by-Asset valuation of Real Estate (no portfolio premium) •In accordance with IPA NAV Guideline •See our current Report on Form8-K filed with the SEC on April 17, 2017 for a description of the methodologies and assumptions used to determine, and limitations of, the estimated value per share. NAV VALUE= $11.56 LowMid High Per Share Value$10.89$11.56$12.37 is the sponsor of Strategic Storage Growth Trust, Inc.Investor Presentation12

Current Portfolio 1111 W. Gladstone 7211 Arlington Ave 7760 Lorraine Ave3850 Airport Rd.3252 N. US Hwy 1 Azusa, CARiverside, CAStockton, CAColorado Springs, COFt. Pierce, FL 660 Units610 Units560 Units680 Units770 Units 64,400 NRSF60,100 NRSF49,100 NRSF61,800 NRSF88,400 NRSF 96.5% Phys. Occ.*97.7% Phys. Occ.*98.0% Phys. Occ.*86.3% Phys. Occ.*98.0% Phys. Occ.* 1001 Toll Gate Rd1302 Marquette Dr 4866 E. Russell Rd4349 S. Jones Blvd500 Laredo St Elgin, ILRomeoville, ILLas Vegas, NVLas Vegas, NVAurora, CO 410 Units680 Units1,210 Units1,040 Units440 Units 49,600 NRSF66,700 NRSF171,100 NRSF89,000 NRSF59,500 NRSF 93.3% Phys. Occ.*90.0% Phys. Occ.*96.4% Phys. Occ.*97.0% Phys. Occ.*88.6% Phys. Occ.* *Occupancy as of 6/30/17 is the sponsor of Strategic Storage Growth Trust, Inc.Investor Presentation13

Current Portfolio 8239 Broadway St 1671 Northpark Dr 875 E. Ashby Pl1500 E Baseline Rd365 Fruitland Rd San Antonio, TXKingwood, TXSan Antonio, TXPhoenix, AZToronto, Ontario Canada 490 Units470 Units440 Units840 UnitsApprox 780 Units 76,700 NRSF60,100 NRSF83,400 NRSF94,000 NRSFApprox 81,600 NRSF 95.5% Phys. Occ.*92.6% Phys. Occ.*92.3% Phys. Occ.*86.9% Phys. Occ.* 69 Torbarrie Rd 3175 Sweeten Creek Rd1600 Busse Rd, 12321 Western Ave,197 Deaverview Rd, Toronto, Ontario CanadaAsheville, NCElk Grove Village, ILGarden Grove, CAAsheville, NC Approx 900 Units Est. 650 Units800 Units960 Units370 Units Approx 85,000 NRSF Est. 72,000 NRSF82,000 NRSF95,000 NRSF58,600 NRSF 56.0% Phys. Occ.*38.6% Phys. Occ.*88.4% Phys. Occ.* *Occupancy as of 6/30/17 is the sponsor of Strategic Storage Growth Trust, Inc.Investor Presentation14

Current Portfolio 75 Highland Center Blvd1027 N. Washington Blvd.701 Wando Park Blvd.6 Sun Island Rd. Asheville, NCSarasota, FLMt. Pleasant, SCNantucket, MA 490 Units485 Units500 Units840 Units 66,600 NRSF48,000 NRSF48,000 NRSF93,000 NRSF 93.7% Phys. Occ.*18.0% Phys. Occ.*16.6% Phys. Occ.** 91.2% Phys. Occ.*** *Occupancy as of 6/30/17**Occupancy as of 7/17/17***Occupancy as of 8/22/17 is the sponsor of Strategic Storage Growth Trust, Inc.Investor Presentation15
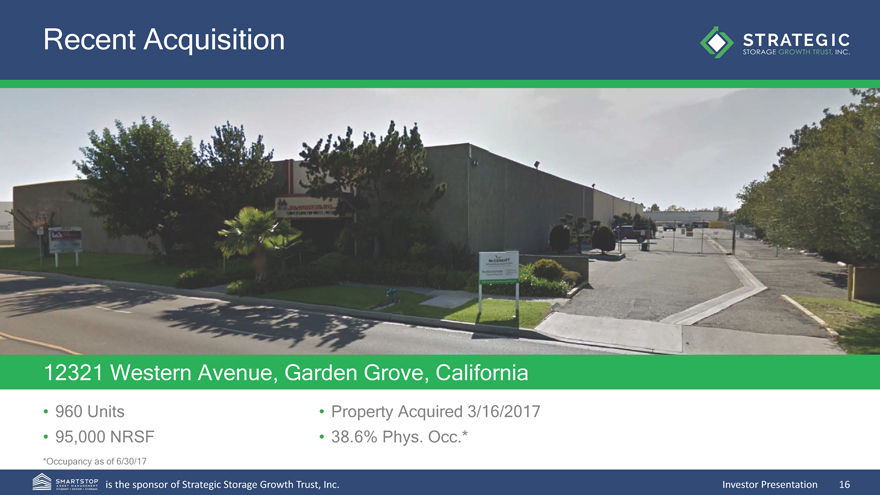
Recent Acquisition 12321 Western Avenue, Garden Grove, California • 960 Units•Property Acquired 3/16/2017 • 95,000 NRSF•38.6% Phys. Occ.* *Occupancy as of 6/30/17 is the sponsor of Strategic Storage Growth Trust, Inc.Investor Presentation16
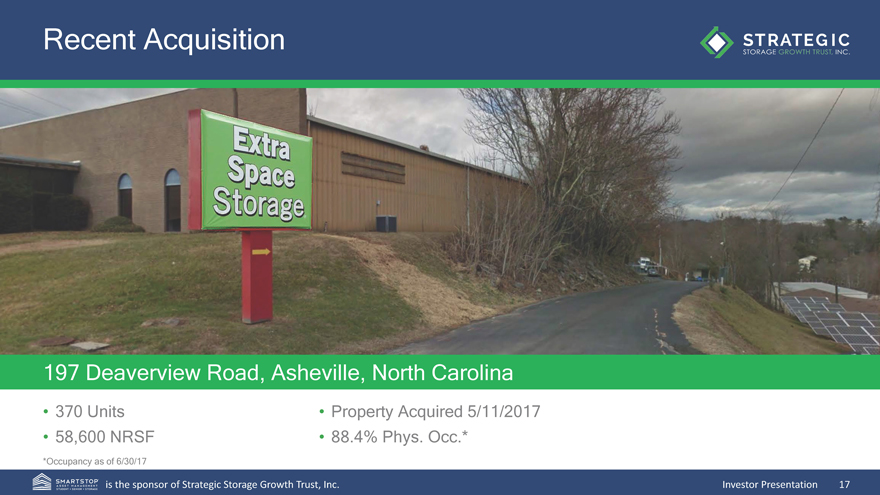
Recent Acquisition 197 Deaverview Road, Asheville, NorthCarolina • 370 Units•Property Acquired 5/11/2017 • 58,600 NRSF•88.4% Phys.Occ.* *Occupancy as of 6/30/17 is the sponsor of Strategic Storage Growth Trust, Inc.Investor Presentation17

Recent Acquisition 75 Highland Center Blvd.,Asheville, North Carolina • 480 Units•Property Acquired 5/11/2017 • 55,800 NRSF•93.7% Phys. Occ.* *Occupancy as of 6/30/17 is the sponsor of Strategic Storage Growth Trust, Inc.Investor Presentation18
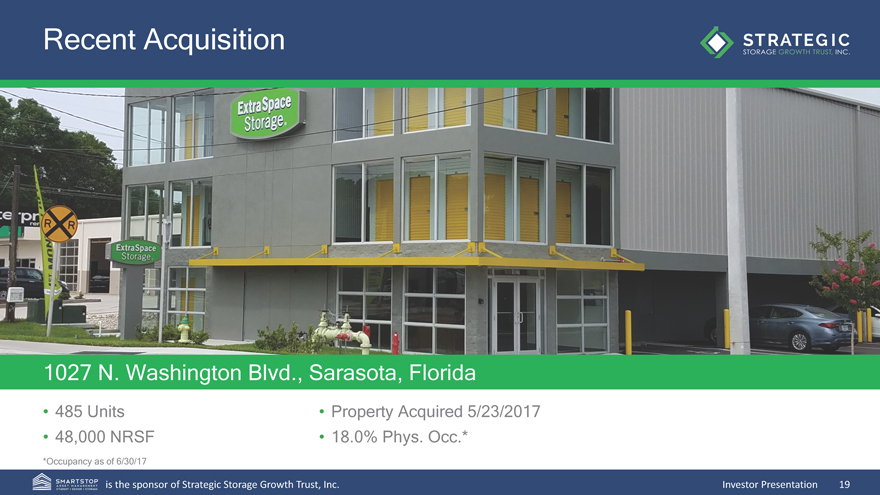
Recent Acquisition 1027 N. Washington Blvd., Sarasota, Florida • 485 Units • Property Acquired 5/23/2017 • 48,000 NRSF • 18.0% Phys. Occ.* *Occupancy as of 6/30/17 is the sponsor of Strategic Storage Growth Trust, Inc. Investor Presentation 19

Recent Acquisition 701 Wando Park Blvd., Mt. Pleasant, South Carolina • 500 Units • Acquisition Date 7/17/2017 • 48,000 NRSF • 16.6% Phys. Occ.* *Occupancy as of 7/17/17 is the sponsor of Strategic Storage Growth Trust, Inc. Investor Presentation 20

Recent Acquisition 6 Sun Island Road, Nantucket, Massachusetts • 840 Units • Acquisition Date 8/22/2017 • 93,000 NRSF • 91.2% Phys. Occ.* *Occupancy as of 8/22/17 is the sponsor of Strategic Storage Growth Trust, Inc. Investor Presentation 21
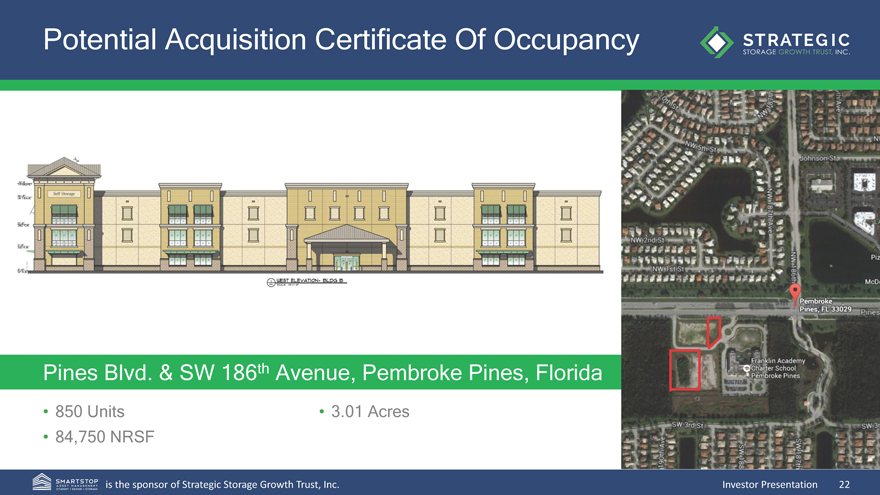
Potential Acquisition Certificate Of Occupancy Pines Blvd. & SW 186th Avenue, Pembroke Pines, Florida • 850 Units • 3.01 Acres • 84,750 NRSF is the sponsor of Strategic Storage Growth Trust, Inc. Investor Presentation 22
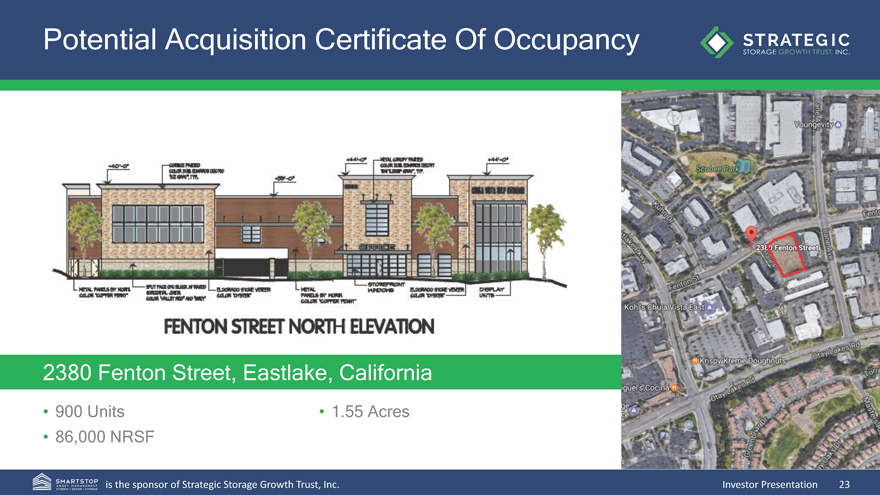
Potential Acquisition Certificate Of Occupancy 2380 Fenton Street, Eastlake, California • 900 Units • 1.55 Acres • 86,000 NRSF is the sponsor of Strategic Storage Growth Trust, Inc. Investor Presentation 23
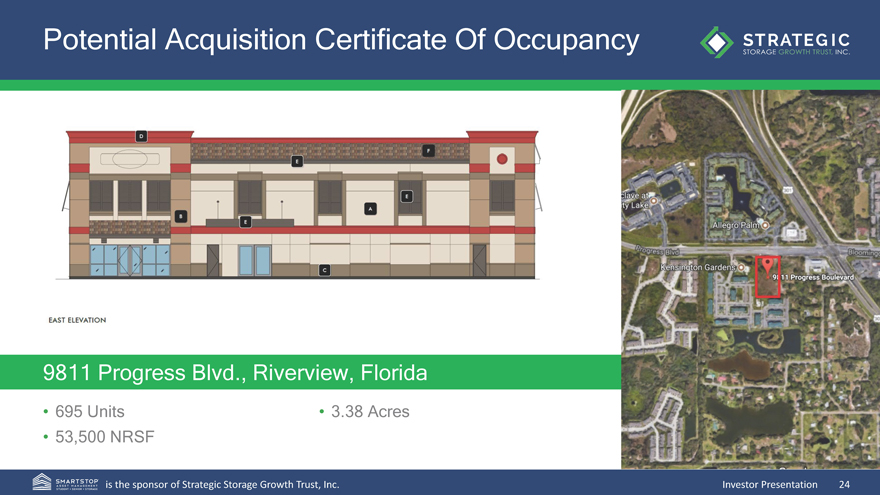
Potential Acquisition Certificate Of Occupancy 9811 Progress Blvd., Riverview, Florida • 695 Units • 3.38 Acres • 53,500 NRSF is the sponsor of Strategic Storage Growth Trust, Inc. Investor Presentation 24

Potential Acquisition Certificate Of Occupancy B 28’—8” T.O.M. 29’—4” T.O.M. 28’—0” T.O.M. 28’—8” T.O.M. 32’—0” T.O.M. B B C G 24’—0” T.O.M. 29’—4” T.O.M. G C G 12’—0” 2ND FLR. G 10’—0” T.O.M. 0’—0” F.F. E E C D A F A 1 NORTH ELEVATION 10,313 VPD 3/32” =1’-0” Riggs Road, Gilbert, Arizona • 970 Units • 97,000 NRSF is the sponsor of Strategic Storage Growth Trust, Inc. Investor Presentation 25
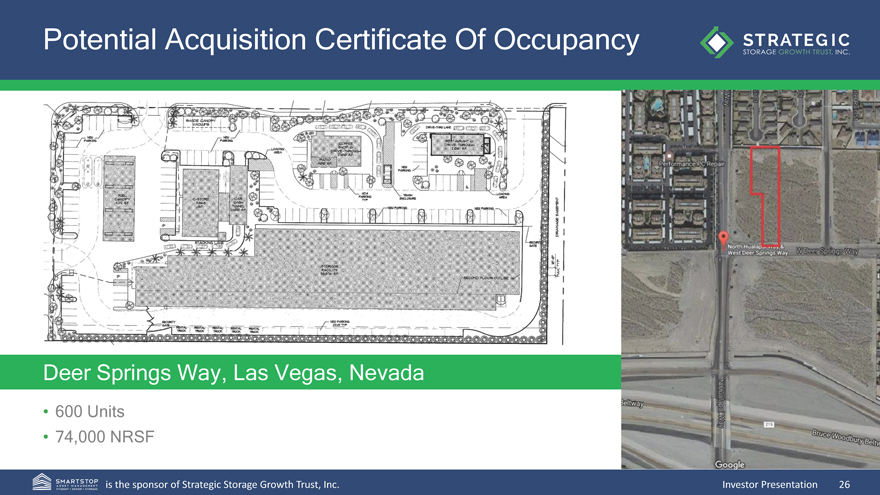
Potential Acquisition Certificate Of Occupancy Deer Springs Way, Las Vegas, Nevada • 600 Units • 74,000 NRSF is the sponsor of Strategic Storage Growth Trust, Inc. Investor Presentation 26
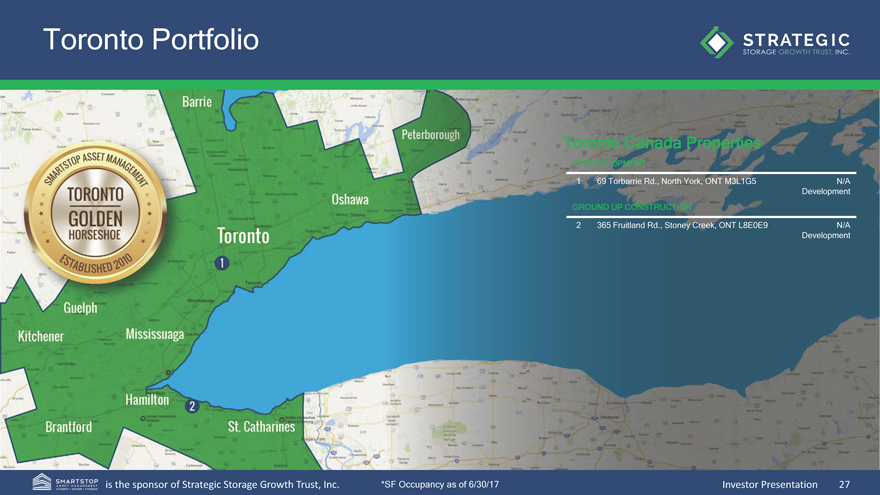
Toronto Portfolio Toronto Canada Properties REDEVELOPMENT 1 69 Torbarrie Rd., North York, ONT M3L1G5 N/A Development GROUND UP CONSTRUCTION 2 365 Fruitland Rd., Stoney Creek, ONT L8E0E9 N/A Development is the sponsor of Strategic Storage Growth Trust, Inc. *SF Occupancy as of 6/30/17 Investor Presentation 27
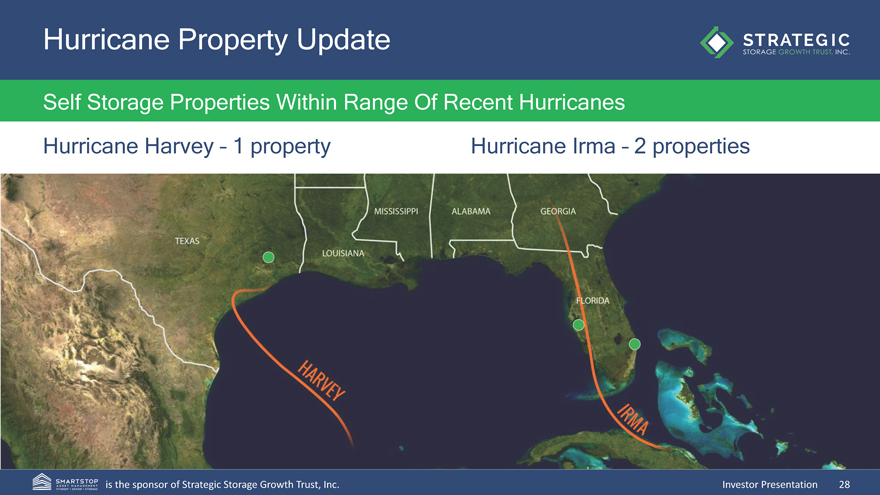
Hurricane Property Update Self Storage Properties Within Range Of Recent Hurricanes Hurricane Harvey – 1 property Hurricane Irma – 2 properties is the sponsor of Strategic Storage Growth Trust, Inc. Investor Presentation 28

Self Storage Companies Publicly Traded Self Storage Companies NYSE: PSA NYSE: LSI NYSE: UHAL NYSE: EXR NYSE: CUBE NYSE: JCAP NYSE: NSA PublicNon-Traded Self Storage REITs—OFFERING CLOSED — OFFERING CLOSED — OFFERING OPEN—is the sponsor of Strategic Storage Growth Trust, Inc. Investor Presentation 29

Questions? is the sponsor of Strategic Storage Growth Trust, Inc. Investor Presentation 30