Exhibit 99.1

Investor Deck
March 2014
Forward-Looking Statements and Non-GAAP Financial Measures
Certain statements in this presentation are forward-looking as defined in the Private Securities Litigation Reform Act of 1995. Any statements contained herein (including, but not limited to, statements to the effect that Sprouts Farmers Market, Inc. (the “Company“) or its management “anticipates,” “plans,” “estimates,” “expects,” “believes,” or the negative of these terms and other similar expressions) that are not statements of historical fact should be considered forward-looking statements, including, without limitation, statements regarding the Company‘s estimated growth and long-term financial targets. These statements involve certain risks and uncertainties that may cause actual results to differ materially from expectations as of the date of this presentation. These risks and uncertainties include, without limitation, risks associated with the Company‘s ability to successfully compete in its intensely competitive industry; the Company‘s ability to successfully open new stores; the Company‘s ability to manage its rapid growth; the Company‘s ability to maintain or improve its operating margins; the Company‘s ability to identify and react to trends in consumer preferences; product supply disruptions; general economic conditions; and other factors as set forth from time to time in the Company‘s Securities and Exchange Commission filings. The Company intends these forward-looking statements to speak only as of the date of this presentation and does not undertake to update or revise them as more information becomes available, except as required by law.
In addition to reporting financial results in accordance with GAAP, the Company has presented adjusted net income, adjusted diluted earnings per share and adjusted EBITDA. These measures are not in accordance with, or an alternative to GAAP. The Company’s management believes that these presentations provide useful information to management, analysts and investors regarding certain additional financial and business trends relating to its results of operations and financial condition. In addition, management uses these measures for reviewing the financial results of the Company as well as a component of incentive compensation. In addition, in comparing its results to the comparable periods of 2012, the Company has presented 2012 financial results on a proforma basis as if the May 2012 business combination with Sunflower Farmers market, Inc. (“Sunflower Transaction“) had occurred on the first day of the Company’s 2012 fiscal year. See the Appendix for unaudited supplemental pro forma condensed consolidated financial information. The Company defines adjusted net income as net income excluding store closure and exit costs, one-time costs associated with its April 2011 combination (the Henry’s Transaction) with Henry’s Holdings, LLC (“Henry’s“) and the Sunflower Transaction (collectively, the “Transactions“), gain and losses from disposal of assets, the loss on extinguishment of debt and the related tax impact of those adjustments. The Company defines adjusted diluted earnings per share as adjusted net income divided by the weighted average diluted shares outstanding. The Company defines EBITDA as net income before interest expense, provision for income tax, and depreciation and amortization, and defines adjusted EBITDA as EBITDA excluding store closure and exit costs, one-time costs associated with the Transactions, gains and losses from disposal of assets and the loss on extinguishment of debt.
These non-GAAP measures are intended to provide additional information only and do not have any standard meanings prescribed by GAAP. Use of these terms may differ from similar measures reported by other companies. Because of their limitations, none of these non-GAAP measures should be considered as a measure of discretionary cash available to use to reinvest in growth of the Company’s business, or as a measure of cash that will be available to meet the Company’s obligations. Each of these non-GAAP measures has its limitations as an analytical tool, and you should not consider them in isolation or as a substitute for analysis of the Company’s results as reported under GAAP.
See the Appendix for reconciliation for these non-GAAP measure to the comparable GAAP measures.
1
Overview of Sprouts
2
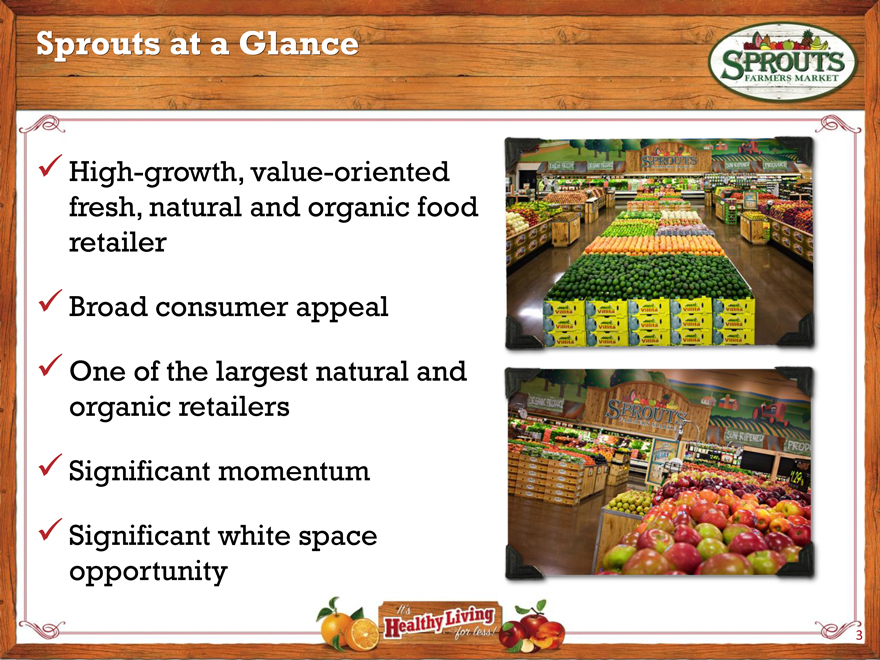
Sprouts at a Glance
High-growth, value-oriented fresh, natural and organic food retailer
Broad consumer appeal
One of the largest natural and organic retailers
Significant momentum
Significant white space opportunity
3
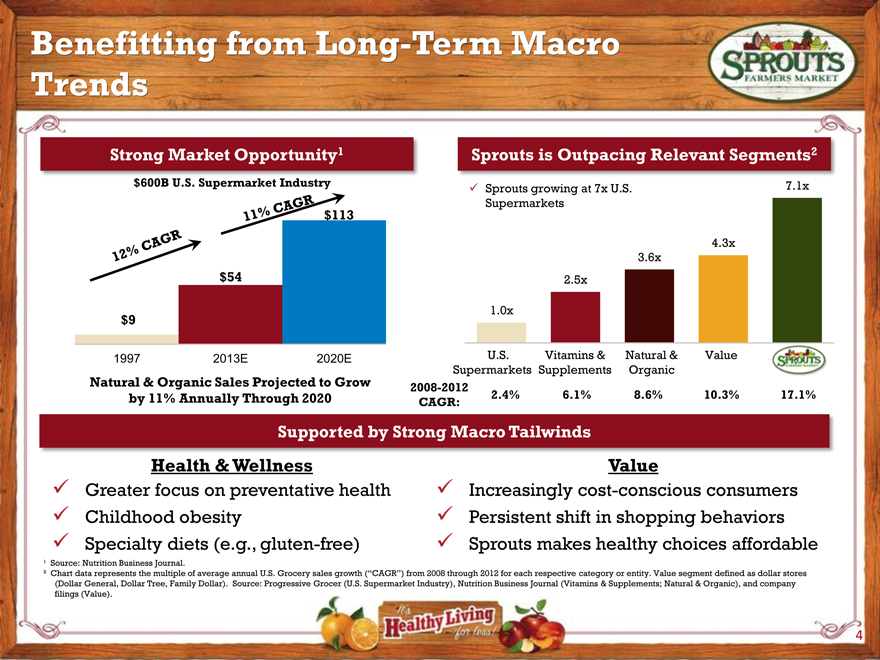
Benefitting from Long Term Macro Trends
Strong Market Opportunity 1 Sprouts is Outpacing Relevant Segments 2
$600B U.S. Supermarket Industry 7.1x
Sprouts growing at 7x U.S. $113 Supermarkets
4.3x 3.6x $54 2.5x
1.0x $9
1997 2013E 2020E U.S. Vitamins & Natural & Value
Natural & Organic Sales Projected to Grow Supermarkets Supplements Organic
2008-2012 by 11% Annually Through 2020 2.4% 6.1% 8.6% 10.3% 17.1% CAGR:
Supported by Strong Macro Tailwinds
Health &Wellness Value
Greater focus on preventative health Increasingly cost-conscious consumers
Childhood obesity Persistent shift in shopping behaviors
Specialty diets (e.g., gluten-free) Sprouts makes healthy choices affordable
¹ Source: Nutrition Business Journal.
² Chart data represents the multiple of average annual U.S. Grocery sales growth (“CAGR”) from 2008 through 2012 for each respective category or entity. Value segment defined as dollar stores (Dollar General, Dollar Tree, Family Dollar) . Source: Progressive Grocer (U.S. Supermarket Industry), Nutrition Business Journal (Vitamins & Supplements; Natural & Organic), and company filings (Value).
4
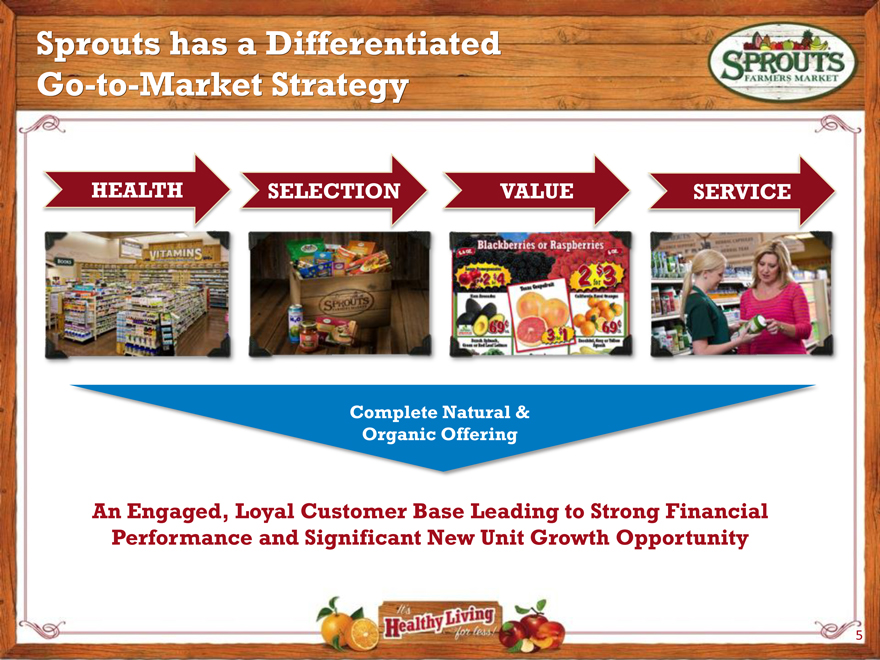
Sprouts has a Differentiated Go-to-Market Strategy
HEALTH SELECTION VALUE SERVICE
Complete Natural & Organic Offering
An Engaged, Loyal Customer Base Leading to Strong Financial Performance and Significant New Unit Growth Opportunity
5
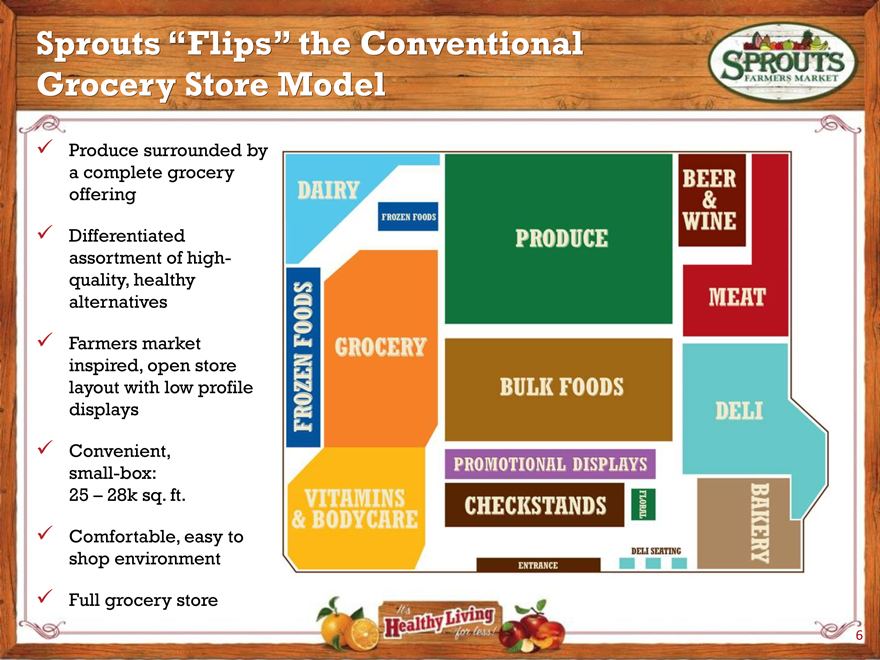
Sprouts “Flips” the Conventional Grocery Store Model
Produce surrounded by a complete grocery offering
Differentiated assortment of high-quality, healthy alternatives
Farmers market inspired, open store layout with low profile displays
Convenient, small-box: 25 – 28k sq. ft.
Comfortable, easy to shop environment
Full grocery store
6
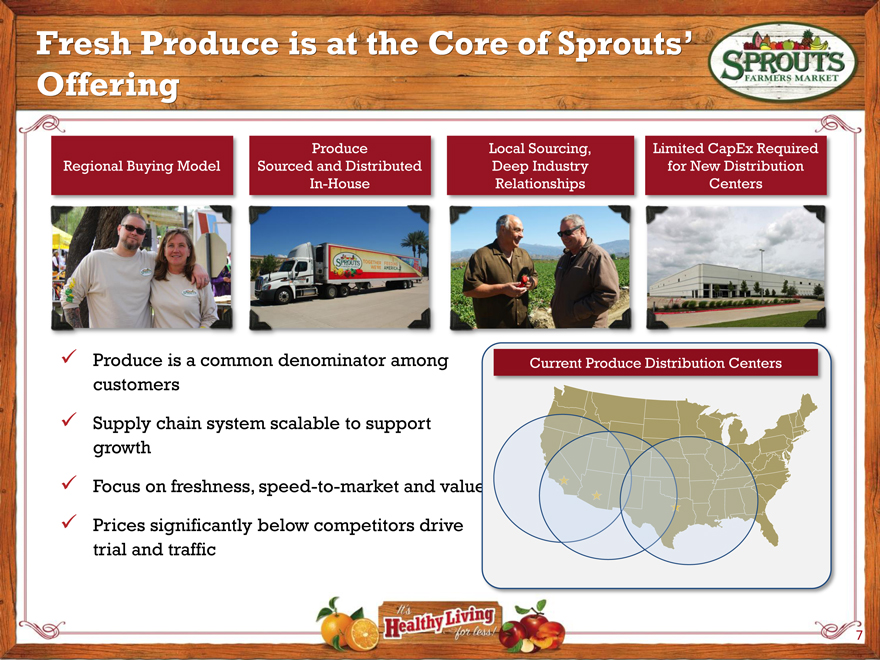
Fresh Produce is at the Core of Sprouts’ Offering
Produce Local Sourcing, Limited CapEx Required Regional Buying Model Sourced and Distributed Deep Industry for New Distribution In-House Relationships Centers
Produce is a common denominator among Current Produce Distribution Centers customers
Supply chain system scalable to support growth
Focus on freshness, speed-to-market and value
Prices significantly below competitors drive trial and traffic
7
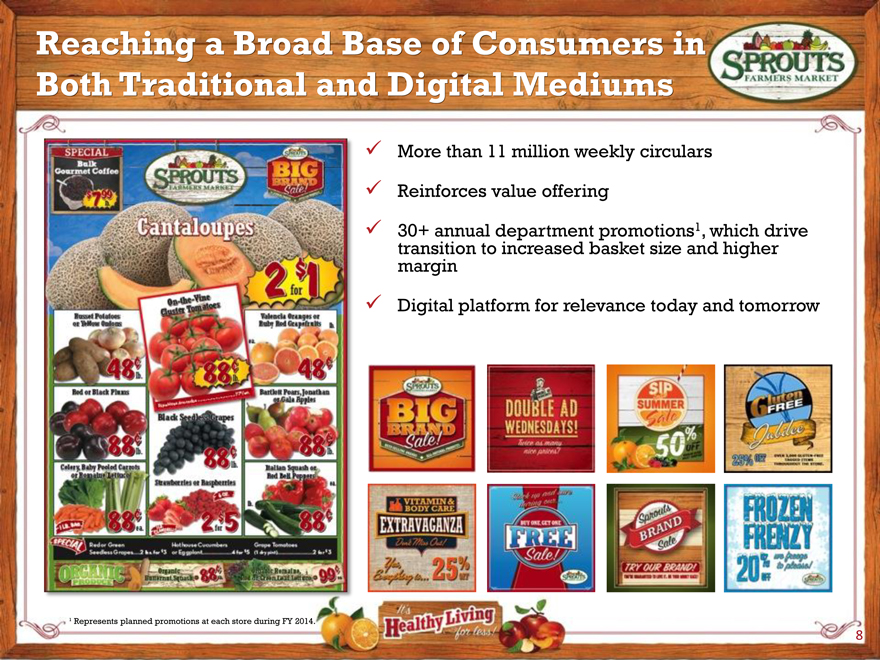
Reaching a Broad Base of Consumers in Both Traditional and Digital Mediums
More than 11 million weekly circulars
Reinforces value offering
30+ annual department promotions 1, which drive transition margin to increased basket size and higher
Digital platform for relevance today and tomorrow
¹ Represents planned promotions at each store during FY 2014.
8
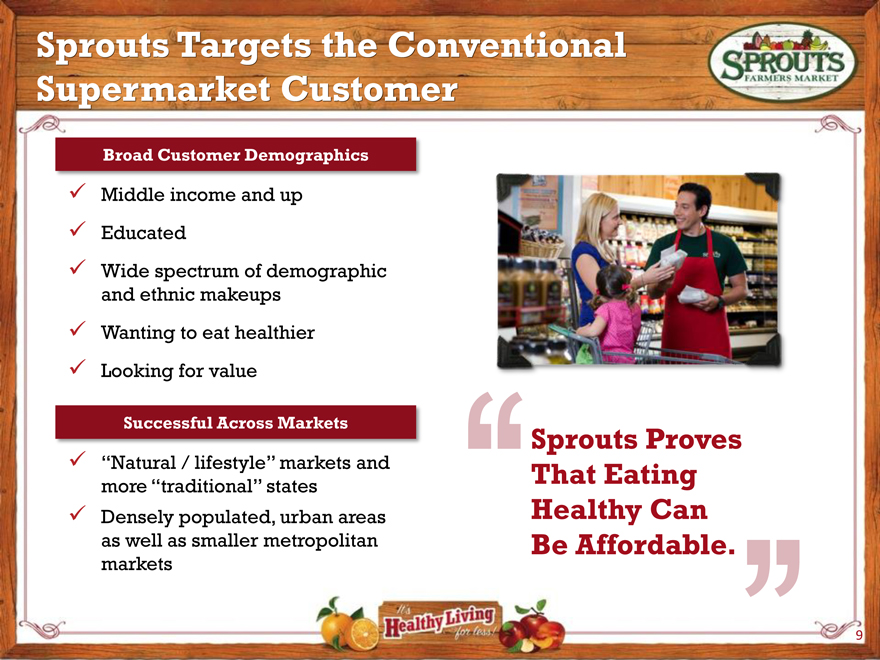
Sprouts Targets the Conventional Supermarket Customer
Broad Customer Demographics
Middle income and up
Educated
Wide spectrum of demographic and ethnic makeups
Wanting to eat healthier
Looking for value
Successful Across Markets
Sprouts Proves
“Natural / lifestyle” markets and That Eating more “traditional” states
Densely populated, urban areas Healthy Can as well as smaller metropolitan Be Affordable. markets
9
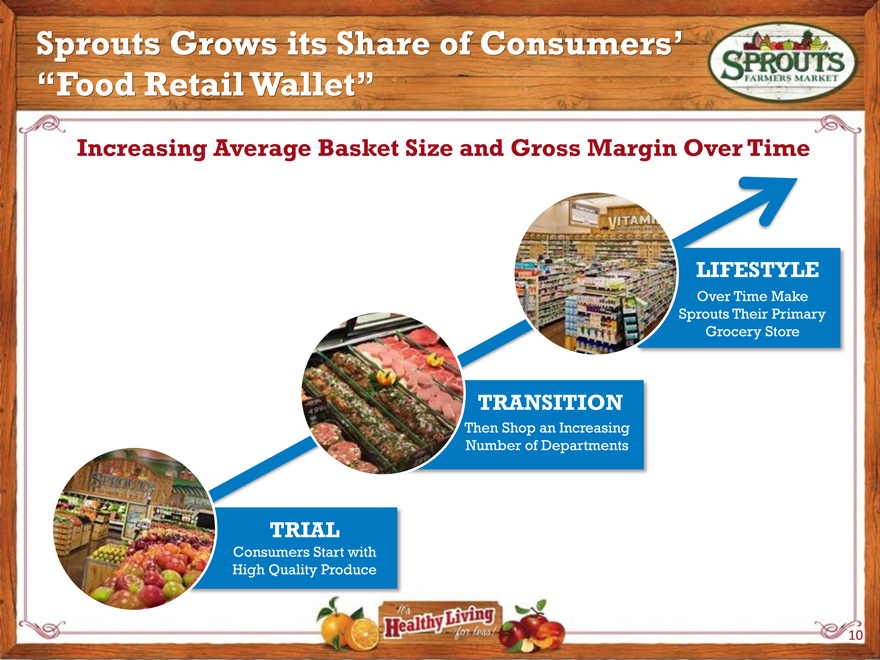
Sprouts Grows its Share of Consumers’ “Food RetailWallet”
Increasing Average Basket Size and Gross Margin Over Time
LIFESTYLE
Over Time Make Sprouts Their Primary Grocery Store
TRANSITION
Then Shop an Increasing Number of Departments
TRIAL
Consumers Start with High Quality Produce
10
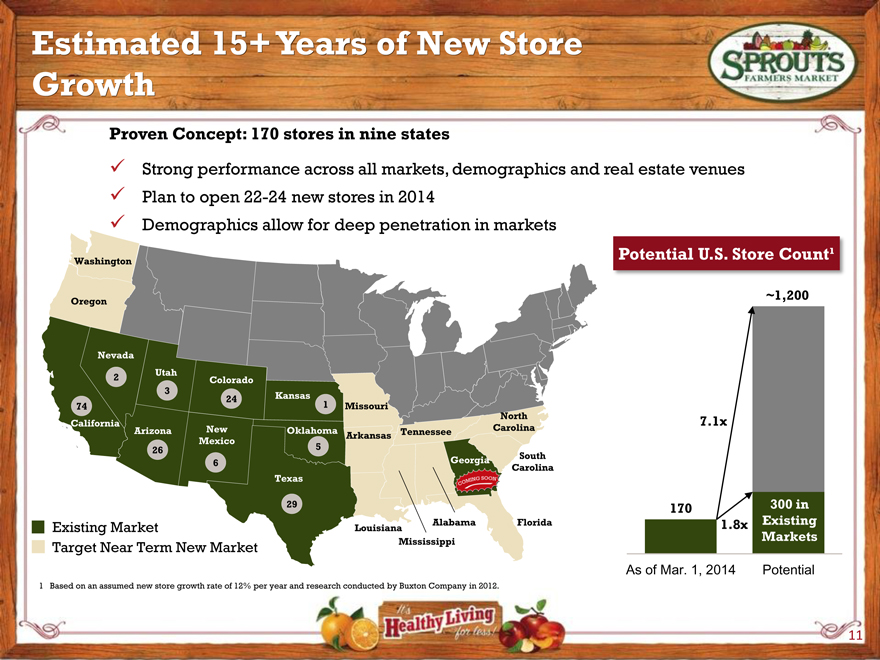
Estimated 15+ Years of New Store Growth
Proven Concept: 170 stores in nine states
Strong performance across all markets, demographics and real estate venues
Plan to open 22-24 new stores in 2014
Demographics allow for deep penetration in markets
Potential U.S. Store Count¹
Washington
~1,200
Oregon
Nevada
Utah
2 Colorado 3
24 Kansas 1
74 Missouri North
California 7.1x Arizona New Oklahoma Tennessee Carolina Arkansas Mexico
26 5 South
6 Georgia
Carolina Texas
29 170 300 in
Alabama Florida 1.8x Existing
Existing Market Louisiana
Mississippi Markets
Target Near Term New Market
As of Mar. 1, 2014 Potential
1 Based on an assumed new store growth rate of 12% per year and research conducted by Buxton Company in 2012.
11
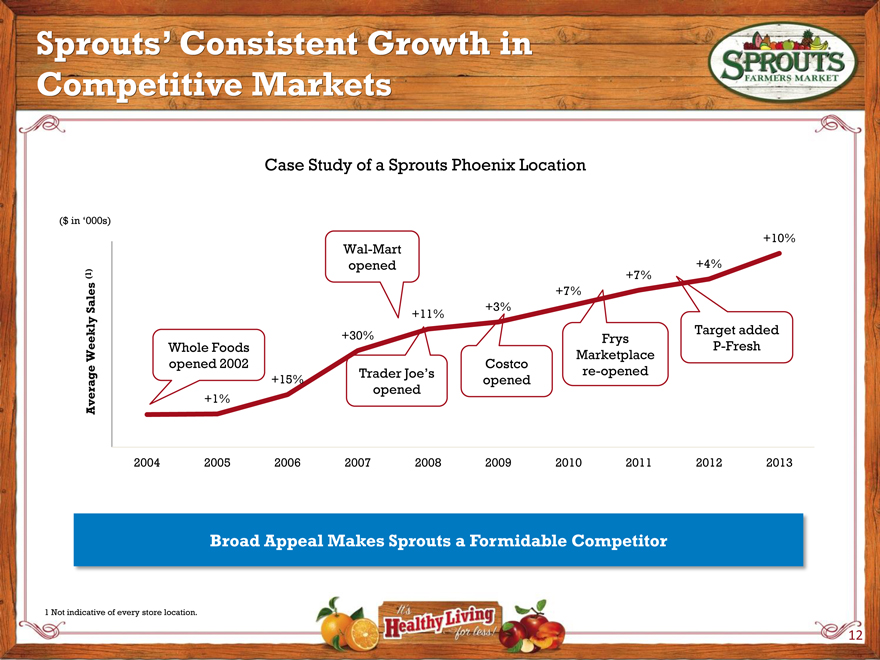
Sprouts’ Consistent Growth in Competitive Markets
Case Study of a Sprouts Phoenix Location
($ in 000s)
+10%
Wal-Mart opened +4%
(1) +7%
+7%
Sales +3%
+11%
+30% Target added Frys Whole Foods P-Fresh Weekly Marketplace opened 2002 Trader Joe_s Costco re-opened +15% opened opened
Average +1%
2004 2005 2006 2007 2008 2009 2010 2011 2012 2013
Broad Appeal Makes Sprouts a Formidable Competitor
1 Not indicative of every store location.
12
Business & Financial Performance
13
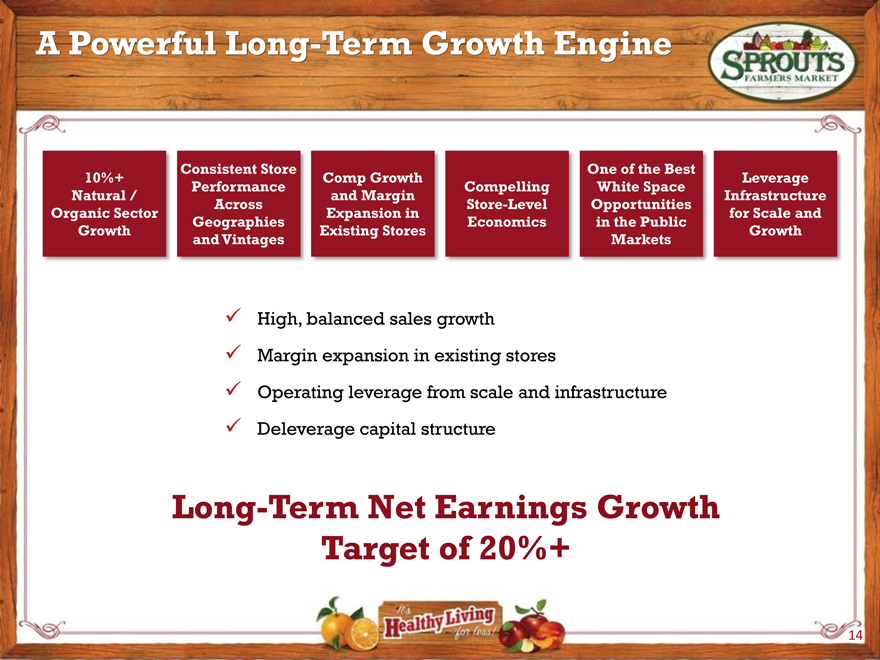
A Powerful Long-Term Growth Engine
Consistent Store One of the Best
10%+ Comp Growth Leverage Performance Compelling White Space Natural / and Margin Infrastructure Across Store-Level Opportunities Organic Sector Expansion in for Scale and Geographies Economics in the Public Growth Existing Stores Growth and Vintages Markets
High, balanced sales growth
Margin expansion in existing stores
Operating leverage from scale and infrastructure
Deleverage capital structure
Long-Term Net Earnings Growth Target of 20%+
14
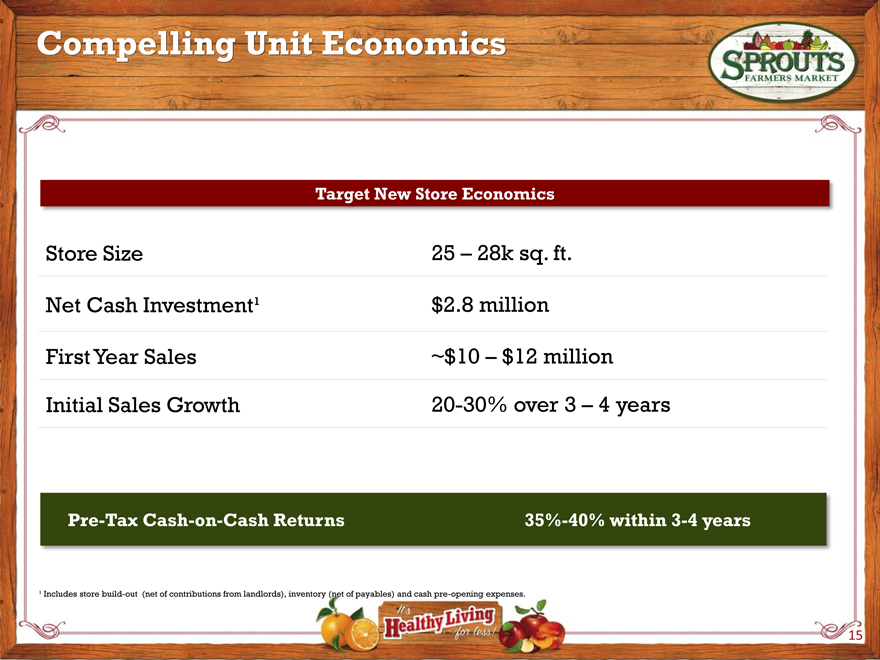
Compelling Unit Economics
Target New Store Economics
Store Size 25 – 28k sq.ft. Net Cash Investment¹ $2.8 million First Year Sales ~$10 – $12 million
Initial Sales Growth 20-30%over3 – 4years
Pre-Tax Cash-on-Cash Returns
35%-40% within 3-4 years
¹ Includes store build-out (net of contributions from landlords), inventory (net of payables) and cash pre-opening expenses.
15
History of Organic Growth
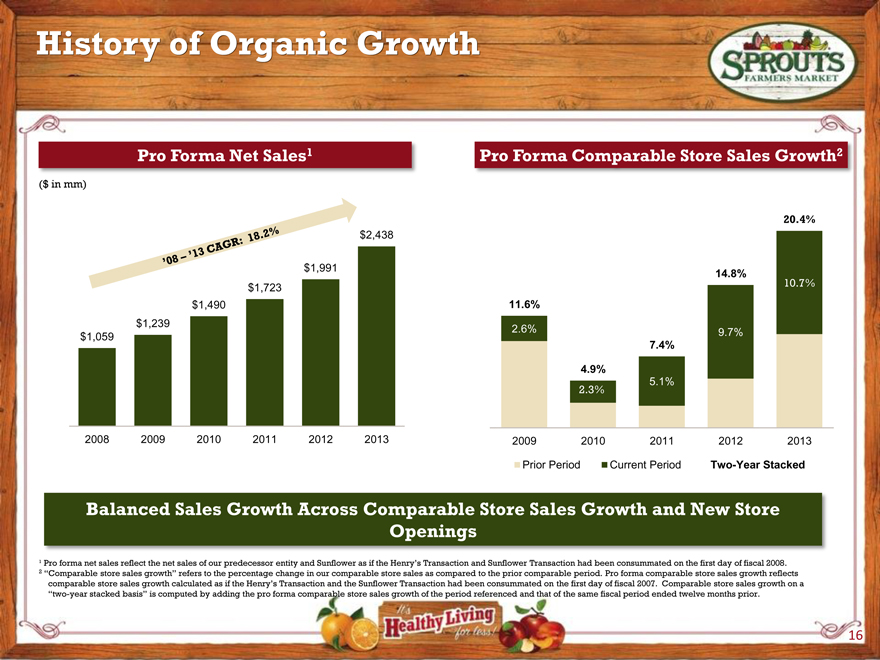
Pro Forma Net Sales 1 Pro Forma Comparable Store Sales Growth 2
($ in mm)
20.4% $2,438
$1,991
14.8% 10.7% $1,723 $1,490 11.6% $1,239 2.6% 9.7% $1,059 7.4%
4.9%
5.1%
2.3%
2008 2009 2010 2011 2012 2013 2009 2010 2011 2012 2013
‘08-’13 CAGR: 18.2%
Prior Period Current Period Two-Year Stacked
Balanced Sales Growth Across Comparable Store Sales Growth and New Store Openings
¹Proforma net sales reflect the net sales of our predecessor entity and Sunflower as if the Henry’s Transaction and Sunflower Transaction had been consummated on the first day offiscal 2008.
2 “Comparable store sales growth” refers to the percentage change in our comparable store sales as compared to the prior comparable period. Pro forma comparable store sales growth reflects comparable store sales growth calculated as if the Henrys Transaction and the Sunflower Transaction had been consummated on the first day of fiscal 2007. Comparable store sales growth on a “two-year stacked basis” is computed by adding the pro forma comparable store sales growth of the period referenced and that of the same fiscal period ended twelve months prior.
16
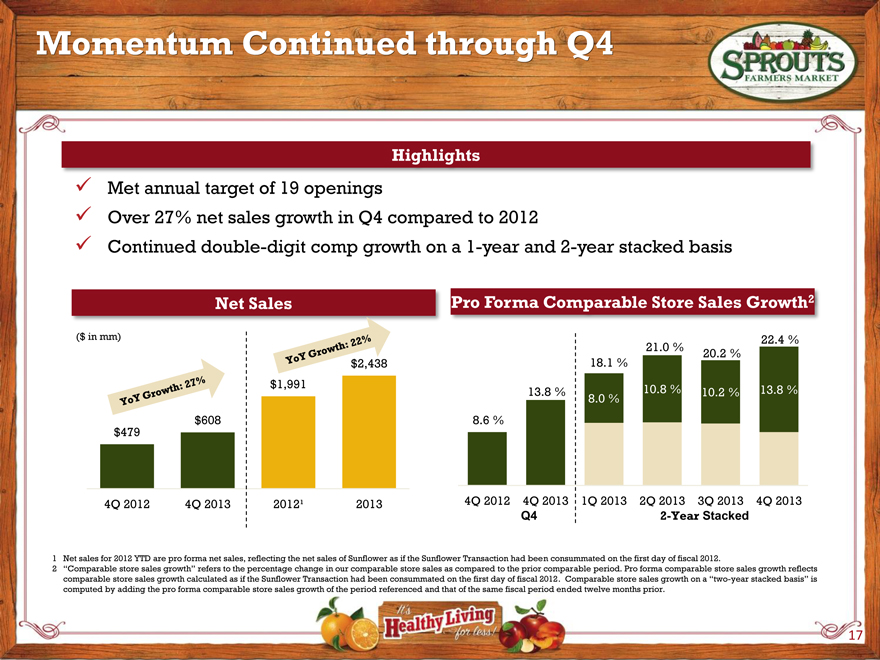
Momentum Continued through Q4
Highlights
Met annual target of 19 openings
Over 27% net sales growth in Q4 compared to 2012
Continued double -digit comp growth on a 1-year and 2-year stacked basis
Net Sales Pro Forma Comparable Store Sales Growth 2
YoY Growth: 27% YoY Growth: 22%
($ in mm) 21.0 % 22.4 % 20.2 % $2,438 18.1 % $1,991 10.8 % 13.8 % 13.8 % 10.2 % 8.0 % $479 $608 8.6 %
4Q 2012 4Q 2013 2012¹ 2013 4Q 2012 4Q 2013 1Q 2013 2Q 2013 3Q 2013 4Q 2013
Q4 2-Year Stacked
1 Net sales for 2012 YTD are pro forma net sales, reflecting the net sales of Sunflower as if the Sunflower Transaction had been consummated on the first day of fiscal 2012.
2 “Comparable store sales growth” refers to the percentage change in our comparable store sales as compared to the prior comparable period. Pro forma comparable store sales growth reflects comparable store sales growth calculated as if the Sunflower Transaction had been consummated on the first day of fiscal 2012. Comparable store sales growth on a “two-year stacked basis” is computed by adding the pro forma comparable store sales growth of the period referenced and that of the same fiscal period ended twelve months prior.
17
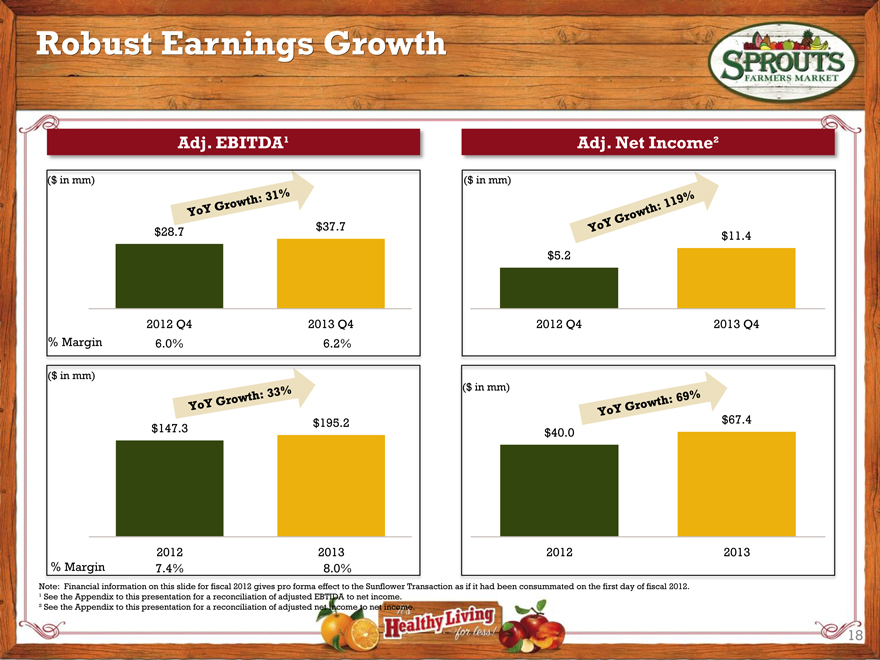
Robust Earnings Growth
Adj. EBITDA¹ Adj. Net Income²
($ in mm) ($ in mm)
$28.7 $37.7 $11.4 $5.2
2012 Q4 2013 Q4 2012 Q4 2013 Q4
% Margin 6.0% 6.2%
($inmm)
($ in mm)
YoY Growth:31%
YoY Growth:119%
YoY Growth:33%
YoY Growth:69%
$195.2 $67.4 $147.3 $40.0
2012 2013 2012 2013
% Margin 7.4% 8.0%
Note: Financial information on this slide for fiscal 2012 gives pro forma effect to the Sunflower Transaction as if it had been consummated on the first day of fiscal 2012. ¹ See the Appendix to this presentation for a reconciliation of adjusted EBTIDA to net income.
² See the Appendix to this presentation for a reconciliation of adjusted net income to net income.
18
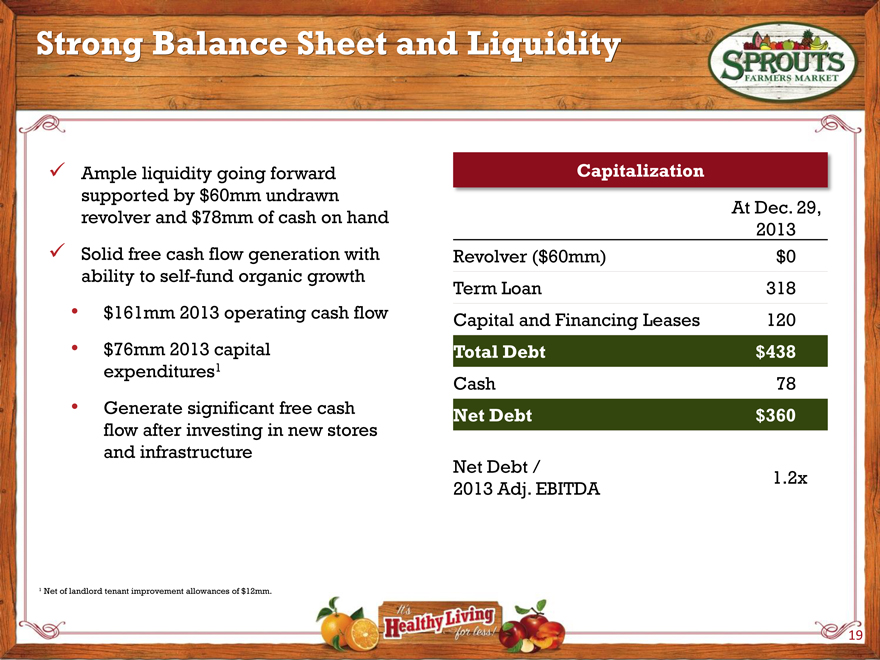
Strong Balance Sheet and Liquidity
Ample liquidity going forward supported by $60mm undrawn revolver and $78mm of cash on hand
Solid free cash flow generation with ability to self-fund organic growth $161mm 2013 operating cash flow $76mm 2013 capital expenditures 1
Generate significant free cash flow after investing in new stores and infrastructure
¹ Net of landlord tenant improvement allowances of $12mm.
Capitalization
At Dec.29, 2013 Revolver ($60mm) $0 Term Loan 318 Capital and Financing Leases 120
Total Debt $438
Cash 78
Net Debt $360
NetDebt/
1.2x 2013 Adj. EBITDA
19
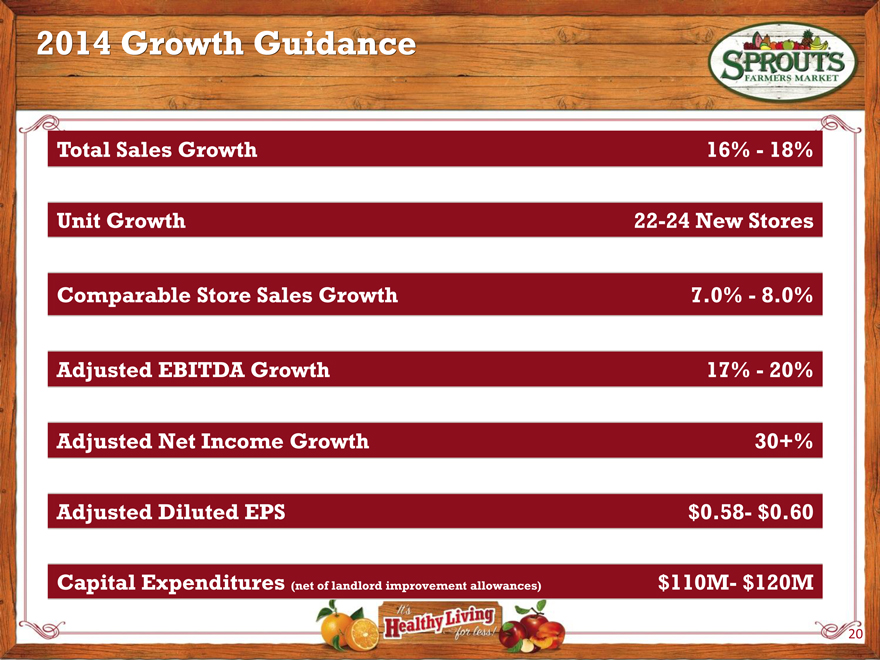
2014 Growth Guidance
Total Sales Growth 16% - 18% Unit Growth 22-24 New Stores Comparable Store Sales Growth 7.0% - 8.0% Adjusted EBITDA Growth 17% - 20% Adjusted Net Income Growth 30+% Adjusted Diluted EPS $0.58 - $0.60
Capital Expenditures (net of landlord improvement allowances) $110M-$120M
20
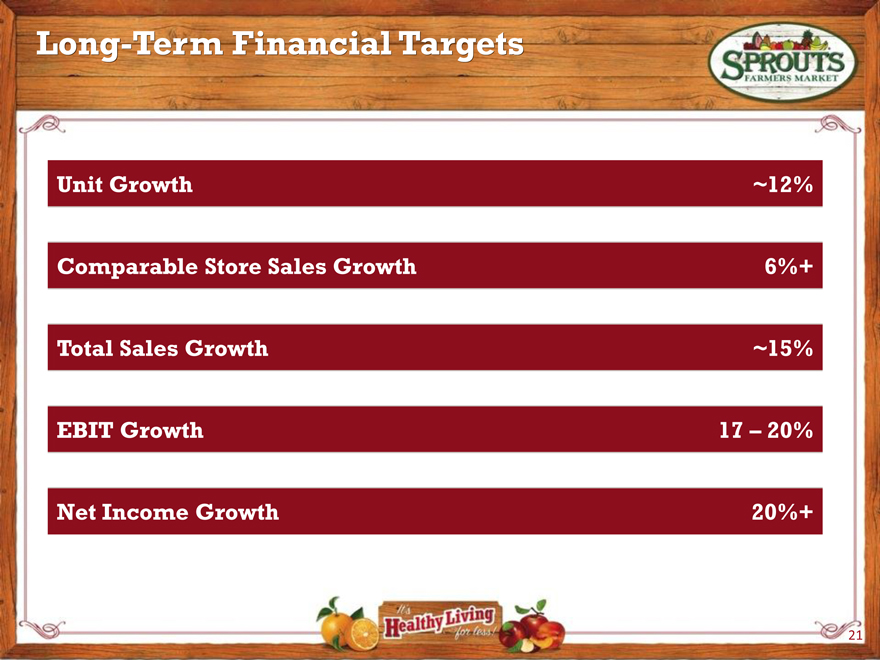
Long-Termer Financial Targets
Unit Growth ~12% Comparable Store Sales Growth 6%+ Total Sales Growth ~15% EBIT Growth 17 – 20% Net Income Growth 20%+
21
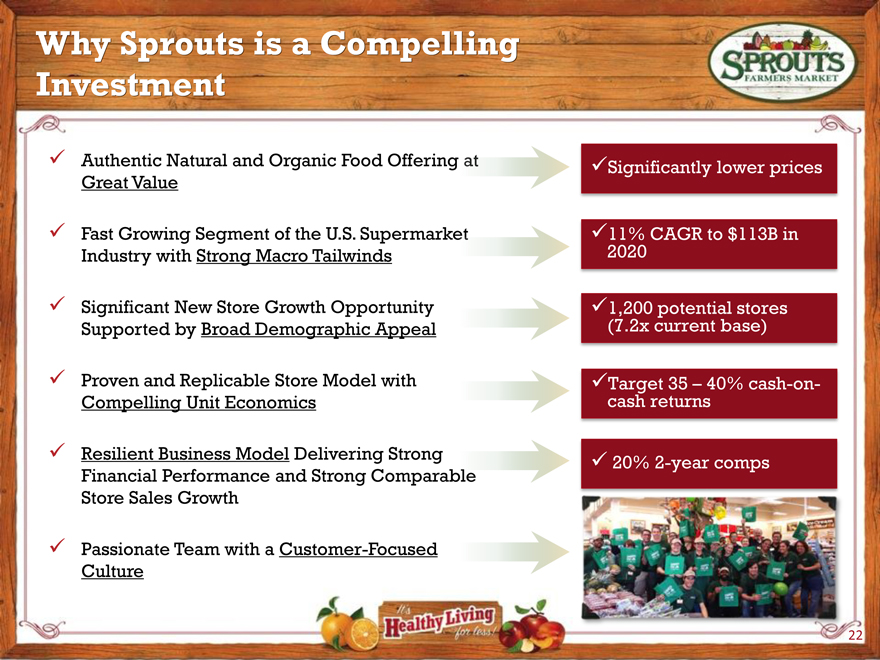
Why Sprouts is a Compelling Investment
9 Authentic Natural and Organic Food Offering Great Value
9 Fast Growing Segment of the U.S. Supermarke Industry with Strong Macro Tailwinds
9 Significant New Store Growth Opportunity Supported by Broad Demographic Appeal
9 Proven and Replicable Store Model with Compelling Unit Economics
9 Resilient Business Model Delivering Strong Financial Performance and Strong Comparable Store Sales Growth
9 Passionate Team with a Customer -Focused Culture
9Significantly lower prices
92020 11% CAGR to $113B in
9(7.2x 1,200 current potential base) stores
9cashTarget 35 returns _40% cash-on-
920% 2-year comps
22

Appendix: Supplemental Materials
23
Non-GAAP Reconciliation
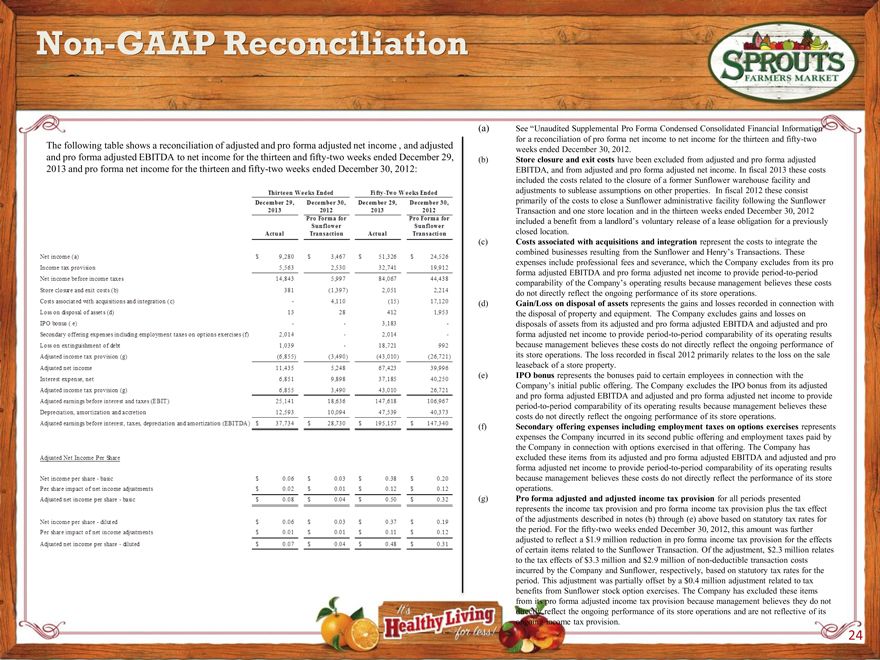
The following table shows a reconciliation of adjusted and pro forma adjusted net income , and adjusted and pro forma adjusted EBITDA to net income for the thirteen and fifty-two weeks ended December 29, 2013 and pro forma net income for the thirteen and fifty-two weeks ended December 30, 2012:
December 29, December 30, December 29. December 30,
2013 2012 2013 2012
Pro Forma for Pro Forma for
Sunflower Sunflower
Actual Transaction Actual Transaction
Net income (a) $ 9,280 $ 3,467 $ 51,326 $ 24,526
Income tax provision 5,563 2,530 32,741 19,912
Net income before income taxes 14,843 5,997 84,067 44,438
Store closure and exit costs (b) 381 (1.397) 2,051 2,214
Costs associated with acquisitions and integration (c) - 4,110 (15) 17,120
Loss on disposal of assets (d) 13 28 412 1,953
IPO bonus (e) - - 3,183 -
Secondary offering expenses including employment taxes on options exercises (f) 2,014 - 2,014 -
Loss on extinguishment of debt 1,039 - 18,721 992
Adjusted income tax provision (g) (6,855) (3,490) (43,010) (26,721)
Adjusted net income 11,435 5,248 67,423 39,996
Interest expense, net 6,851 9,898 37,185 40,250
Adjusted income tax provision (g) 6,855 3,490 43,010 26,721
Adjusted earnings before interest and taxes (EBIT) 25,141 18,636 147,618 106,967
Depreciation, amortization and accretion 12,593 10,094 47,539 40,373
Adjusted earnings before interest, taxes, depreciation and amortization (EBITDA) $ 37,734 $ 28,730 $ 195,157 $ 147,340
Adjusted Net Income Per Share
Net income per share - basic $ 0.06 $ 0.03 $ 0.38 $ 0.20
Per share impact of net income adjustments $ 0.02 $ 0.01 $ 0.12 $ 0.12
Adjusted net income per share - basic $ 0.08 $ 0.04 $ 0.50 $ 0.32
Net income per share - diluted $ 0.06 $ 0.03 $ 0.37 $ 0.19
Per share impact of net income adjustments $ 0.01 $ 0.01 $ 0.11 $ 0.12
Adjusted net income per share - diluted $ 0.07 $ 0.04 $ 0.48 $ 0.31
(a) See “Unaudited Supplemental Pro Forma Condensed Consolidated Financial Information” for a reconciliation of pro forma net income to net income for the thirteen and fifty-two weeks ended December 30, 2012. (b) Store closure and exit costs have been excluded from adjusted and pro forma adjusted EBITDA, and from adjusted and pro forma adjusted net income. In fiscal 2013 these costs included the costs related to the closure of a former Sunflower warehouse facility and adjustments to sublease assumptions on other properties. In fiscal 2012 these consist primarily of the costs to close a Sunflower administrative facility following the Sunflower Transaction and one store location and in the thirteen weeks ended December 30, 2012 included a benefit from a landlord’s voluntary release of a lease obligation for a previously closed location.
(c) Costs associated with acquisitions and integration represent the costs to integrate the combined businesses resulting from the Sunflower and Henry’s Transactions. These expenses include professional fees and severance, which the Company excludes from its pro forma adjusted EBITDA and pro forma adjusted net income to provide period-to-period comparability of the Company’s operating results because management believes these costs do not directly reflect the ongoing performance of its store operations.
(d) Gain/Loss on disposal of assets represents the gains and losses recorded in connection with the disposal of property and equipment. The Company excludes gains and losses on disposals of assets from its adjusted and pro forma adjusted EBITDA and adjusted and pro forma adjusted net income to provide period-to-period comparability of its operating results because management believes these costs do not directly reflect the ongoing performance of its store operations. The loss recorded in fiscal 2012 primarily relates to the loss on the sale leaseback of a store property.
(e) IPO bonus represents the bonuses paid to certain employees in connection with the Company’s initial public offering. The Company excludes the IPO bonus from its adjusted and pro forma adjusted EBITDA and adjusted and pro forma adjusted net income to provide period-to-period comparability of its operating results because management believes these costs do not directly reflect the ongoing performance of its store operations.
(f) Secondary offering expenses including employment taxes on options exercises represents expenses the Company incurred in its second public offering and employment taxes paid by the Company in connection with options exercised in that offering. The Company has excluded these items from its adjusted and pro forma adjusted EBITDA and adjusted and pro forma adjusted net income to provide period-to-period comparability of its operating results because management believes these costs do not directly reflect the performance of its store operations.
(g) Pro forma adjusted and adjusted income tax provision for all periods presented represents the income tax provision and pro forma income tax provision plus the tax effect of the adjustments described in notes (b) through (e) above based on statutory tax rates for the period. For the fifty-two weeks ended December 30, 2012, this amount was further adjusted to reflect a $1.9 million reduction in pro forma income tax provision for the effects of certain items related to the Sunflower Transaction. Of the adjustment, $2.3 million relates to the tax effects of $3.3 million and $2.9 million of non-deductible transaction costs incurred by the Company and Sunflower, respectively, based on statutory tax rates for the period. This adjustment was partially offset by a $0.4 million adjustment related to tax benefits from Sunflower stock option exercises. The Company has excluded these items from its pro forma adjusted income tax provision because management believes they do not directly reflect the ongoing performance of its store operations and are not reflective of its ongoing income tax provision.
24
Pro Forma Reconciliation
SPROUTS FARMERS MARKET, INC.
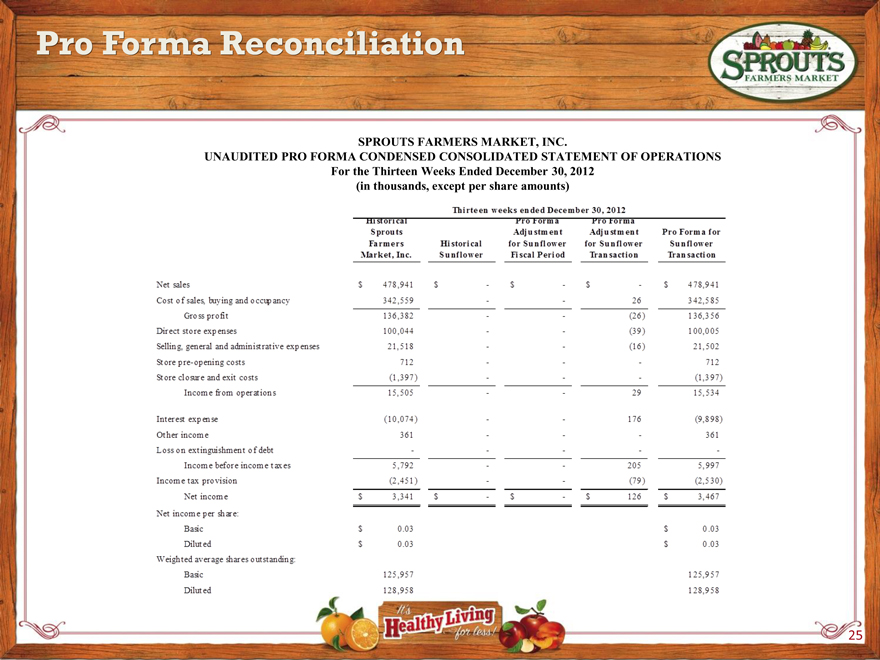
UNAUDITED PRO FORMA CONDENSED CONSOLIDATED STATEMENT OF OPERATIONS For the Thirteen Weeks Ended December 30, 2012 (in thousands, except per share amounts)
Thirteen weeks ended December 30, 2012
Historical ProForma Pro Forma
Sprouts Adjustment Adjustment Pro Forma for
Farmers Historical for Sunflower for Sunflower Sunflower
Market, Inc. Sunflower Fiscal Period Transaction Transaction
Net sales $ 478,941 $ - $ - $ - $ 478,941
Cost of sales, buying and occupancy 342,559 - - 26 342,585
Gross profit 136,382 - - (26) 136,356
Direct store expenses 100,044 - - (39) 100,005
Selling, general and administrative expenses 21,518 - - (16) 21,502
Store pre-opening costs 712 - - - 712
Store closure and exit costs (1,397) - - - (1,397)
Income from operations 15,505 - - 29 15,534
Interest expense (10,074) - - 176 (9,898) Other income 361 - - - 361 Loss on extinguishment of debt ---- Income before income taxes 5,792 - - 205 5,997 Income tax provision (2,451) - - (79) (2,530) Net income $ 3,341 $ - $ - $ 126 $ 3,467 Net income per share:
Basic $ 0.03 $ 0.03
Diluted $ 0.03 $ 0.03 Weighted average shares outstanding:
Basic 125,957 125,957
Diluted 128,958 128,958
25
Pro Forma Reconciliation
SPROUTS FARMERS MARKET, INC.
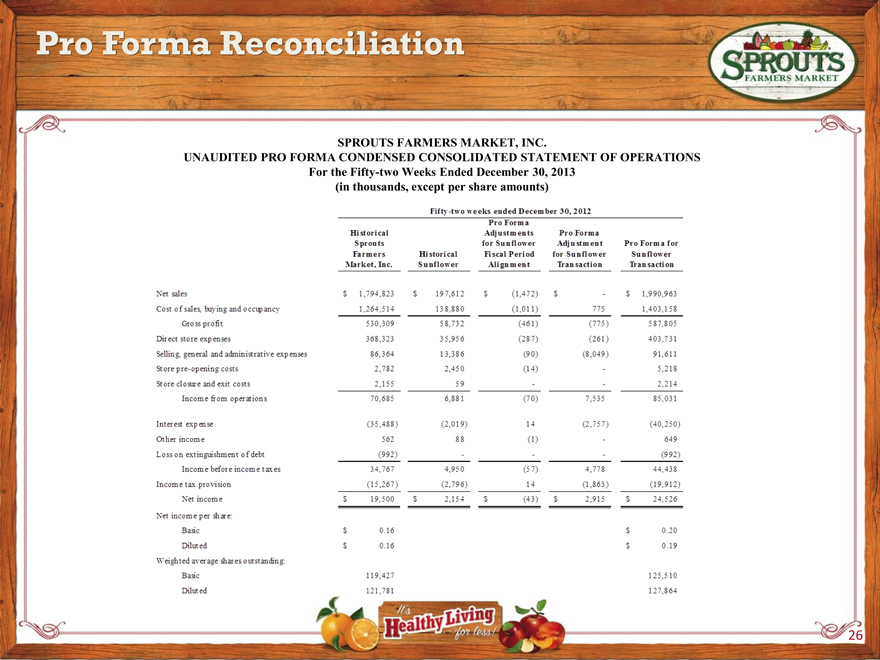
UNAUDITED PRO FORMA CONDENSED CONSOLIDATED STATEMENT OF OPERATIONS For the Fifty-two Weeks Ended December 30, 2013 (in thousands, except per share amounts)
Fifty-two weeks ended December 30, 2012 Pro Forma
Historical Adjustments Pro Forma
Sprouts for Sunflower Adjustment Pro Forma for
Farmers Historical Fiscal Period for Sunflower Sunflower
Market, Inc. Sunflower Alignment Transaction Transaction
Net sales $ 1,794,823 $ 197,612 $ (1,472) $ - $ 1,990,963
Cost of sales, buying and occupancy 1,264,514 138,880 (1,01 $1) 775 1,403,158
Gross profit 530,309 58,732 (461) (775) 587,805
Direct store expenses 368,323 35,956 (287) (261) 403,731
Selling, general and administrative expenses 86,364 13,386 (90) (8,049) 91,611
Store pre-opening costs 2,782 2,450 (14) - 5,218
Store closure and exit costs 2,155 59 - - 2,214
Income from operations 70,685 6,88 1 (70) 7,535 85,031
Interest expense (35,488) (2,019) 14 (2,757) (40,250)
Other income 562 88 (1) - 649
Loss on extinguishment of debt (992) - - - (992)
Income before income taxes 34,767 4,950 (57) 4,778 44,438
Income tax provision (15,267) (2,796) 14 (1,863) (19,912)
Net income $ 19,500 $ 2,154 $ (43) $ 2,915 $ 24,526 Net income per share:
Basic $ 0.16 $ 0.20
Diluted $ 0.16 $ 0.19 Weighted average shares outstanding:
Basic 119,427 125,510
Diluted 121,781 127,864
26
Pro Forma Reconciliation
SPROUTS FARMERS MARKET, INC.
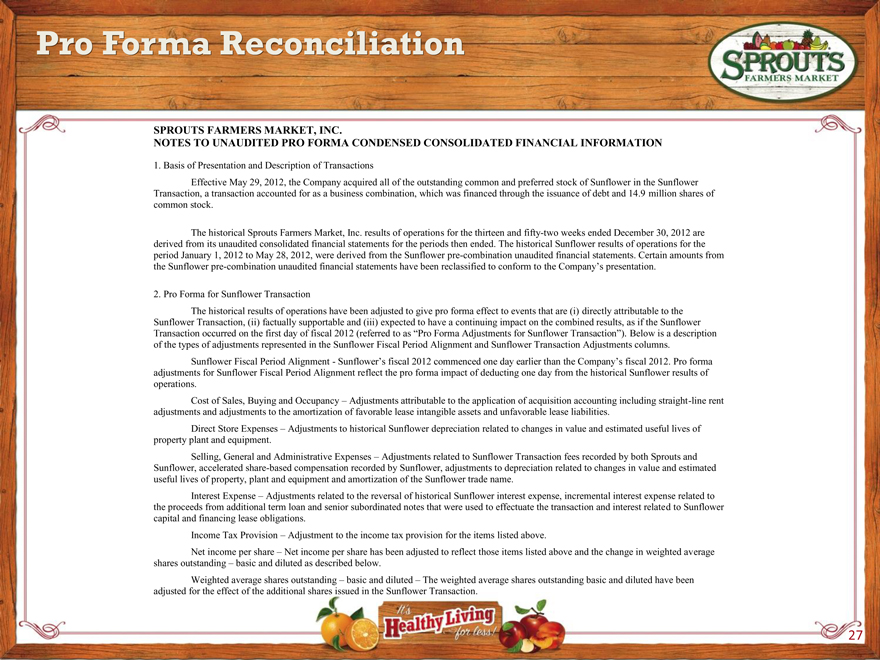
NOTES TO UNAUDITED PRO FORMA CONDENSED CONSOLIDATED FINANCIAL INFORMATION
1. Basis of Presentation and Description of Transactions
Effective May 29, 2012, the Company acquired all of the outstanding common and preferred stock of Sunflower in the Sunflower Transaction, a transaction accounted for as a business combination, which was financed through the issuance of debt and 14.9 million shares of common stock.
The historical Sprouts Farmers Market, Inc. results of operations for the thirteen and fifty-two weeks ended December 30, 2012 are derived from its unaudited consolidated financial statements for the periods then ended. The historical Sunflower results of operations for the period January 1, 2012 to May 28, 2012, were derived from the Sunflower pre-combination unaudited financial statements. Certain amounts from the Sunflower pre-combination unaudited financial statements have been reclassified to conform to the Company’s presentation.
2. Pro Forma for Sunflower Transaction
The historical results of operations have been adjusted to give pro forma effect to events that are (i) directly attributable to the Sunflower Transaction, (ii) factually supportable and (iii) expected to have a continuing impact on the combined results, as if the Sunflower Transaction occurred on the first day of fiscal 2012 (referred to as “Pro Forma Adjustments for Sunflower Transaction”) . Below is a description of the types of adjustments represented in the Sunflower Fiscal Period Alignment and Sunflower Transaction Adjustments columns.
Sunflower Fiscal Period Alignment - Sunflower’s fiscal 2012 commenced one day earlier than the Company’s fiscal 2012. Pro forma adjustments for Sunflower Fiscal Period Alignment reflect the pro forma impact of deducting one day from the historical Sunflower results of operations.
Cost of Sales, Buying and Occupancy – Adjustments attributable to the application of acquisition accounting including straight-line rent adjustments and adjustments to the amortization of favorable lease intangible assets and unfavorable lease liabilities.
Direct Store Expenses – Adjustments to historical Sunflower depreciation related to changes in value and estimated useful lives of property plant and equipment.
Selling, General and Administrative Expenses – Adjustments related to Sunflower Transaction fees recorded by both Sprouts and Sunflower, accelerated share-based compensation recorded by Sunflower, adjustments to depreciation related to changes in value and estimated useful lives of property, plant and equipment and amortization of the Sunflower trade name.
Interest Expense – Adjustments related to the reversal of historical Sunflower interest expense, incremental interest expense related to the proceeds from additional term loan and senior subordinated notes that were used to effectuate the transaction and interest related to Sunflower capital and financing lease obligations.
Income Tax Provision – Adjustment to the income tax provision for the items listed above.
Net income per share – Net income per share has been adjusted to reflect those items listed above and the change in weighted average shares outstanding –basic and diluted as described below.
Weighted average shares outstanding – basic and diluted – The weighted average shares outstanding basic and diluted have been adjusted for the effect of the additional shares issued in the Sunflower Transaction.
27