Exhibit 99.1
Investor Deck
3rd Quarter 2014
Forward-Looking Statements and Non-GAAP Financial Measures
Certain statements in this presentation are forward-looking as defined in the Private Securities Litigation Reform Act of 1995. Any statements contained herein (including, but not limited to, statements to the effect that Sprouts Farmers Market, Inc. (the “Company”) or its management “anticipates,” “plans,” “estimates,” “expects,” “believes,” or the negative of these terms and other similar expressions) that are not statements of historical fact should be considered forward-looking statements, including, without limitation, statements regarding the Company’s estimated growth, expected results and long-term financial targets. These statements involve certain risks and uncertainties that may cause actual results to differ materially from expectations as of the date of this presentation. These risks and uncertainties include, without limitation, risks associated with the Company’s ability to successfully compete in its intensely competitive industry; the Company’s ability to successfully open new stores; the Company’s ability to manage its rapid growth; the Company’s ability to maintain or improve its comparable store sales and operating margins; the Company’s ability to identify and react to trends in consumer preferences; product supply disruptions; general economic conditions; and other factors as set forth from time to time in the Company’s Securities and Exchange Commission filings. The Company intends these forward-looking statements to speak only as of the date of this presentation and does not undertake to update or revise them as more information becomes available, except as required by law.
In addition to reporting financial results in accordance with GAAP, the Company has presented adjusted net income, adjusted diluted earnings per share and adjusted EBITDA. These measures are not in accordance with, or an alternative to GAAP. The Company’s management believes that these presentations provide useful information to management, analysts and investors regarding certain additional financial and business trends relating to its results of operations and financial condition. In addition, management uses these measures for reviewing the financial results of the Company as well as a component of incentive compensation. The Company defines adjusted net income as net income excluding store closure and exit costs, one-time costs associated with its April 2011 combination (the “Henry’s Transaction”) with Henry’s Holdings, LLC (“Henry’s”) and its May 2012 business combination with Sunflower Farmers Market, Inc. (“the Sunflower Transaction,” and collectively, the “Transactions”), gain and losses from disposal of assets, expenses incurred by the Company in its secondary public offerings and employment taxes paid by the Company in connection with options exercised in those offerings (“Public Offering Expenses”), the loss on extinguishment of debt and the related tax impact of those adjustments. The Company defines adjusted diluted earnings per share as adjusted net income divided by the weighted average diluted shares outstanding. The Company defines EBITDA as net income before interest expense, provision for income tax, and depreciation and amortization, and defines adjusted EBITDA as EBITDA excluding store closure and exit costs, one-time costs associated with the Transactions, gains and losses from disposal of assets, Public Offering Expenses, and the loss on extinguishment of debt.
These non-GAAP measures are intended to provide additional information only and do not have any standard meanings prescribed by GAAP. Use of these terms may differ from similar measures reported by other companies. Because of their limitations, none of these non-GAAP measures should be considered as a measure of discretionary cash available to use to reinvest in growth of the Company’s business, or as a measure of cash that will be available to meet the Company’s obligations. Each of these non-GAAP measures has its limitations as an analytical tool, and you should not consider them in isolation or as a substitute for analysis of the Company’s results as reported under GAAP. See the Appendix for reconciliation for these non-GAAP measures to the comparable GAAP measures. 1
Overview of Sprouts
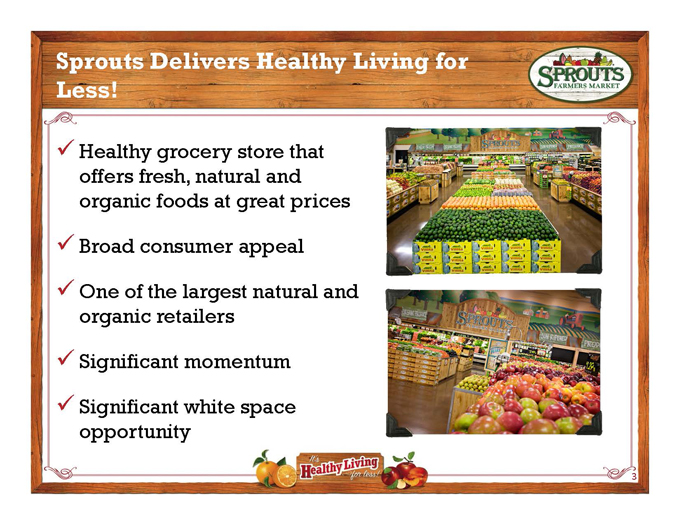
Sprouts Delivers Healthy Living for Less!
Healthy grocery store that offers fresh, natural and organic foods at great prices
Broad consumer appeal
One of the largest natural and organic retailers
Significant momentum
Significant white space opportunity 3
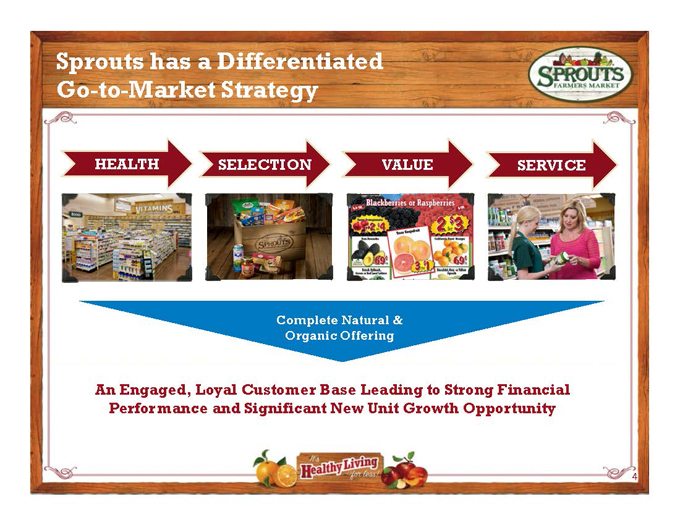
Sprouts has a Differentiated
Go-to-Market Strategy
HEALTH
SELECTION
VALUE
SERVICE
Complete Natural & Organic Offering
An Engaged, Loyal Customer Base Leading to Strong Financial Performance and Significant New Unit Growth Opportunity
4
Sprouts has a Long Runway for Growth as Consumers Seek Healthy Products at a Great Value
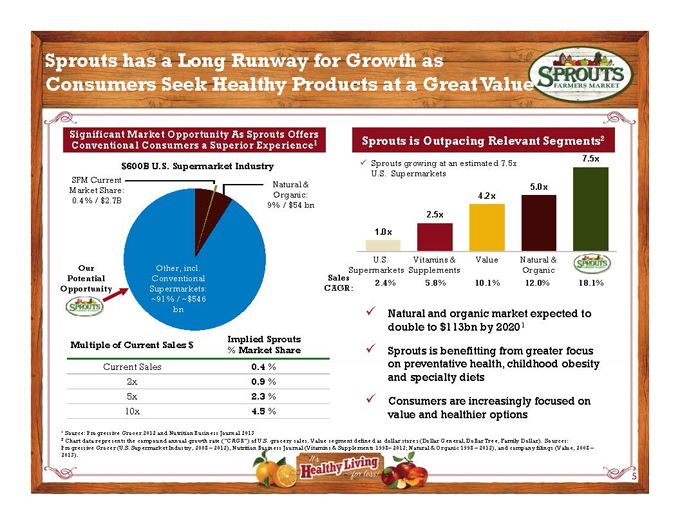
Significant Market Opportunity As Sprouts Offers Conventional Consumers a Superior Experience1
$600B U.S. Supermarket Industry
SFM Current Market Share: 0.4% / $2.7B
Natural & Organic: 9% / $54 bn
Other, incl. Conventional Supermarkets: ~91% / ~$546 bn
Our Potential Opportunity
Multiple of Current Sales $ Implied Sprouts
% Market Share
Current Sales 0.4 %
2x 0.9 %
5x 2.3 %
10x 4.5 %
Sprouts is Outpacing Relevant Segments2
Sprouts growing at an estimated 7.5x U.S. Supermarkets
Column1
U.S.
Supermarkets 1.0x
Vitamins & Supplements 2.5x
Value 4.2x
Natural & Organic 5.0x
Sprouts 7.5x
Sales CAGR: 2.4% 5.8% 10.1% 12.0% 18.1%
Natural and organic market expected to double to $113bn by 20201
Sprouts is benefitting from greater focus on preventative health, childhood obesity and specialty diets
Consumers are increasingly focused on value and healthier options
¹ Source: Progressive Grocer 2012 and Nutrition Business Journal 2013
2 Chart data represents the compound annual growth rate (“CAGR”) of U.S. grocery sales. Value segment defined as dollar stores (Dollar General, Dollar Tree, Family Dollar). Sources: Progressive Grocer (U.S. Supermarket Industry, 2008 – 2012), Nutrition Business Journal (Vitamins & Supplements 1998– 2012; Natural & Organic 1998 – 2012), and company filings (Value, 2008 – 2013). 5
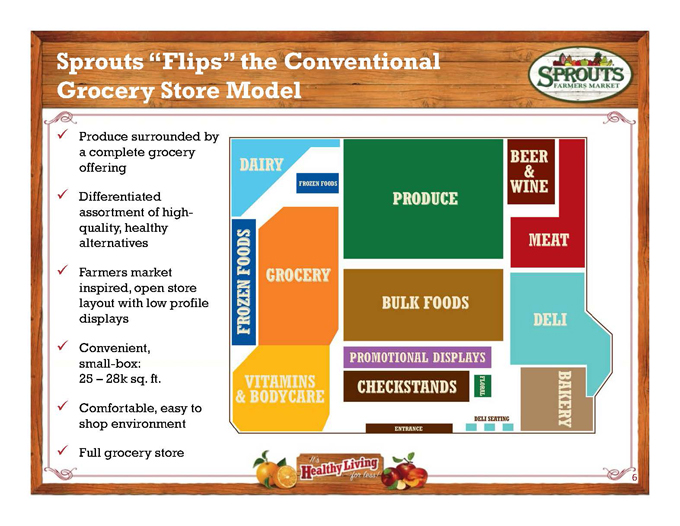
Sprouts “Flips” the Conventional Grocery Store Model
Produce surrounded by a complete grocery offering
Differentiated assortment of high-quality, healthy alternatives
Farmers market inspired, open store layout with low profile displays
Convenient, small-box: 25 – 28k sq. ft.
Comfortable, easy to shop environment
Full grocery store
6
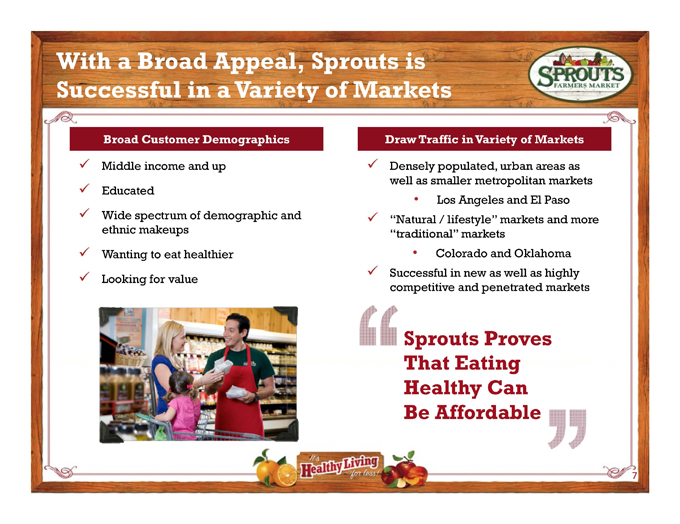
With a Broad Appeal, Sprouts is Successful in a Variety of Markets
Broad Customer Demographics
Middle income and up
Educated
Wide spectrum of demographic and ethnic makeups
Wanting to eat healthier
Looking for value
Draw Traffic in Variety of Markets
Densely populated, urban areas as well as smaller metropolitan markets
Los Angeles and El Paso
“Natural / lifestyle” markets and more “traditional” markets
Colorado and Oklahoma
Successful in new as well as highly competitive and penetrated markets
Sprouts Proves That Eating Healthy Can Be Affordable 7
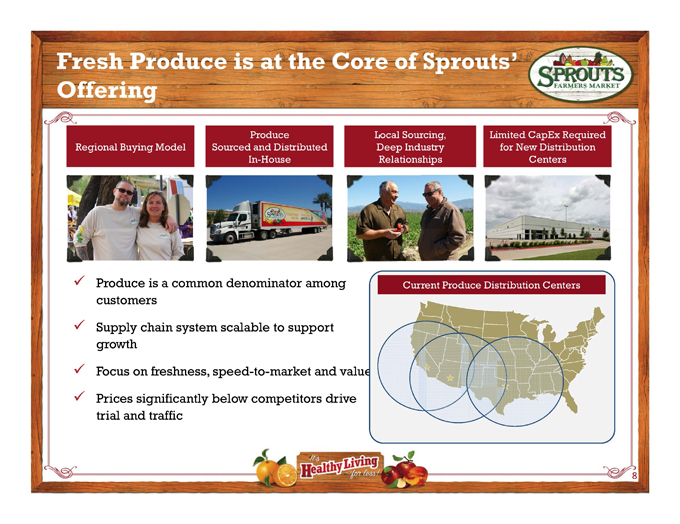
Fresh Produce is at the Core of Sprouts’ Offering
Regional Buying Model
Produce Sourced and Distributed In-House
Local Sourcing, Deep Industry Relationships
Limited CapEx Required for New Distribution Centers
Produce is a common denominator among customers
Supply chain system scalable to support growth
Focus on freshness, speed-to-market and value
Prices significantly below competitors drive trial and traffic 8
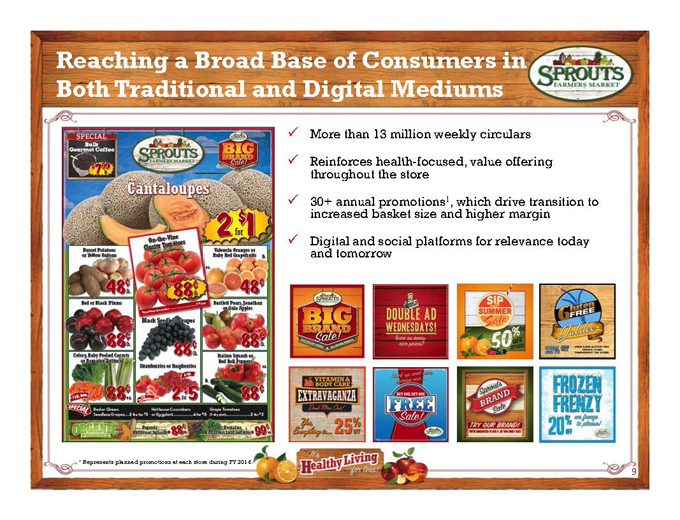
Reaching a Broad Base of Consumers in Both Traditional and Digital Mediums
More than 13 million weekly circulars
Reinforces health-focused, value offering throughout the store
30+ annual promotions1, which drive transition to increased basket size and higher margin
Digital and social platforms for relevance today and tomorrow
¹ Represents planned promotions at each store during FY 2014. 9
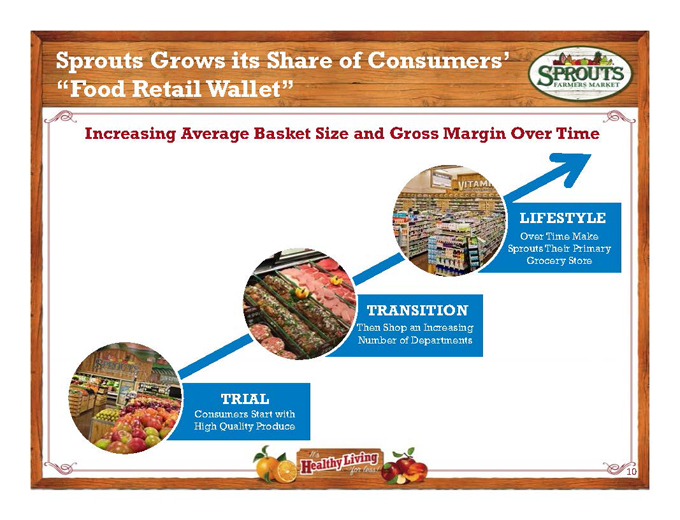
Sprouts Grows its Share of Consumers’ “Food Retail Wallet”
Increasing Average Basket Size and Gross Margin Over Time
LIFESTYLE Over Time Make Sprouts Their Primary Grocery Store
TRANSITION Then Shop an Increasing Number of Departments
TRIAL Consumers Start with High Quality Produce 10
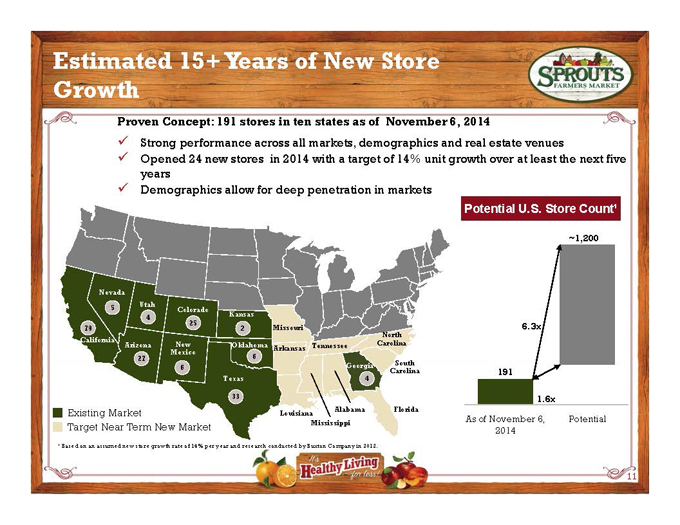
Estimated 15+ Years of New Store Growth
Proven Concept: 191 stores in ten states as of November 6, 2014
Strong performance across all markets, demographics and real estate venues
Opened 24 new stores in 2014 with a target of 14% unit growth over at least the next five years
Demographics allow for deep penetration in markets
Potential U.S. Store Count¹
Nevada Utah Colorado Kansas Missouri Tennessee Arkansas North Carolina Florida Alabama Georgia Oklahoma New Mexico Arizona California Louisiana Mississippi Texas South Carolina 5 4 25 2 6 4 79 27 5 33
¹ Based on an assumed new store growth rate of 14% per year and research conducted by Buxton Company in 2012. 11
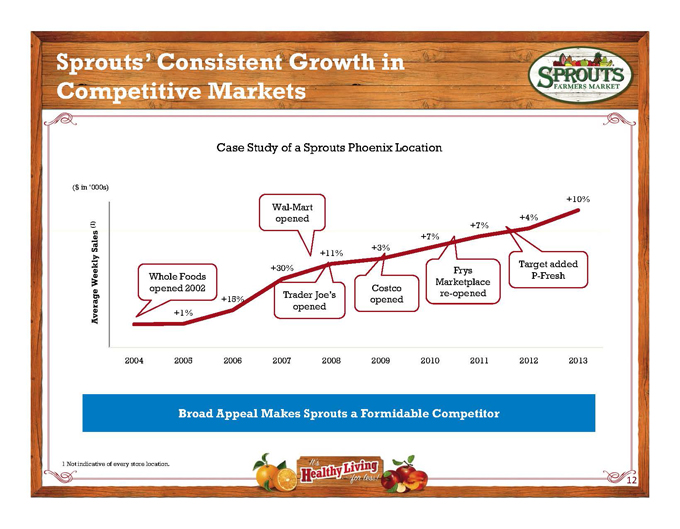
Sprouts’ Consistent Growth in Competitive Markets
Case Study of a Sprouts Phoenix Location
($ in ‘000s)
Average Weekly Sales(1)
Whole Foods opened 2002 Wal-Mart opened Trader Joe’s opened Costco opened Frys Marketplace re-opened Target added P-Fresh
2004
2005 +1%
2006 +15%
2007 +30%
2008 +11%
2009 +3%
2010 +7%
2011 +7%
2012 +4%
2013 +10%
Broad Appeal Makes Sprouts a Formidable Competitor
1 Not indicative of every store location. 12
Business & Financial Performance
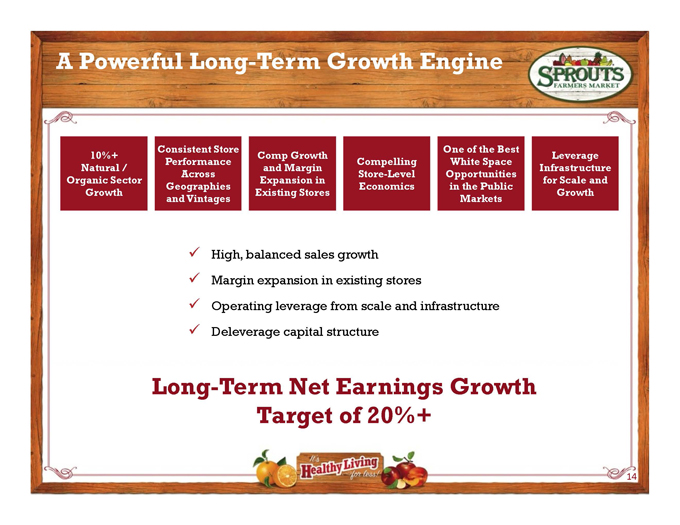
A Powerful Long-Term Growth Engine
10%+ Natural / Organic Sector Growth
Consistent Store Performance Across Geographies and Vintages
Comp Growth and Margin Expansion in Existing Stores
Compelling Store-Level Economics
One of the Best White Space Opportunities in the Public Markets
Leverage Infrastructure for Scale and Growth
High, balanced sales growth
Margin expansion in existing stores
Operating leverage from scale and infrastructure
Deleverage capital structure
Long-Term Net Earnings Growth Target of 20%+
14
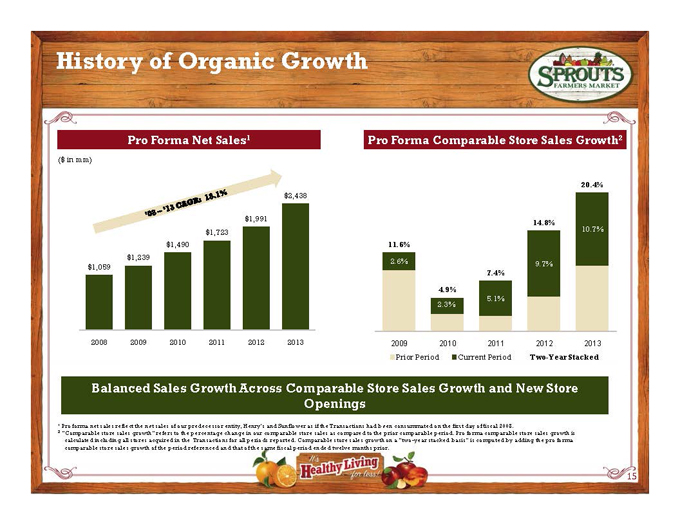
History of Organic Growth
Pro Forma Net Sales1
08 – ’13 CAGR: 18.1%
2008 $1,059
2009 $1,239
2010 $1,490
2011 $1,723
2012 $1,991
2013 $2,438
Pro Forma Comparable Store Sales Growth2
Prior Period Current Period Two-Year Stacked
2009 2,6% 11,6%
2010 2,3% 4,9%
2011 5,1% 7,4%
2012 9,7% 14,8%
2013 10,7% 20,4%
Balanced Sales Growth Across Comparable Store Sales Growth and New Store Openings
¹ Pro forma net sales reflect the net sales of our predecessor entity, Henry’s and Sunflower as if the Transactions had been consummated on the first day of fiscal 2008.
2 “Comparable store sales growth” refers to the percentage change in our comparable store sales as compared to the prior comparable period. Pro forma comparable store sales growth is calculated including all stores acquired in the Transactions for all periods reported. Comparable store sales growth on a “two-year stacked basis” is computed by adding the pro forma comparable store sales growth of the period referenced and that of the same fiscal period ended twelve months prior.
15
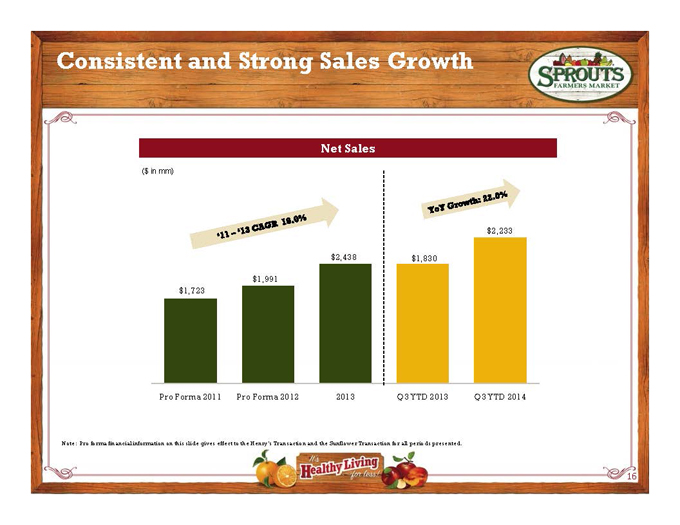
Consistent and Strong Sales Growth
Net Sales
($ in mm)
‘11 – ‘13 CAGR 19.0%
YoY Growth: 22.0%
Pro Forma 2011 $1,723
Pro Forma 2012 $1,991
2013 $2,438
Q3 YTD 2013 $1,830
Q3 YTD 2014 $2,233
Note: Pro forma financial information on this slide gives effect to the Henry’s Transaction and the Sunflower Transaction for all periods presented.
16
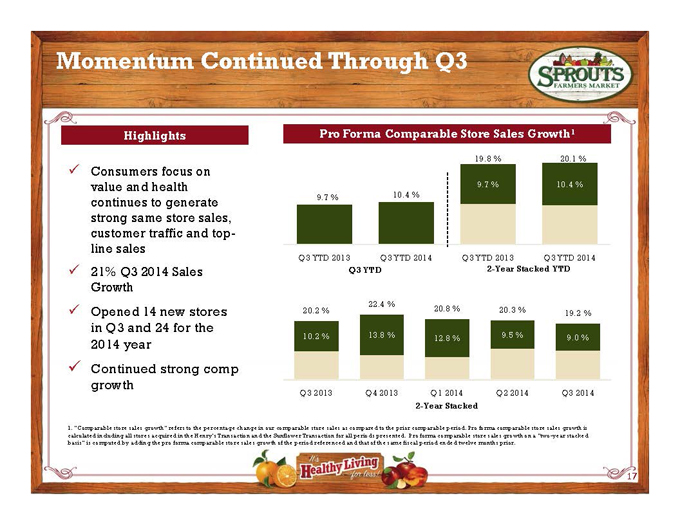
Momentum Continued Through Q3
Highlights
Consumers focus on value and health continues to generate strong same store sales, customer traffic and top-line sales
21% Q3 2014 Sales Growth
Opened 14 new stores in Q3 and 24 for the 2014 year
Continued strong comp growth
Pro Forma Comparable Store Sales Growth1
Q3 YTD 2013 9.7 %
Q3 YTD 2014 10.4 %
Q3 YTD 2013 9.7 % 19.8 %
Q3 YTD 2014 10.4 % 20.1 %
Q3 YTD
2-year stacked YTD
Q3 2013 10.2 % 20.2 %
Q4 2013 13.8 % 22.4 %
Q1 2014 12.8 % 20.8 %
Q2 2014 9.5 % 20.3 %
Q3 2014 9.0 % 19.2 %
2-year stacked
1. “Comparable store sales growth” refers to the percentage change in our comparable store sales as compared to the prior comparable period. Pro forma comparable store sales growth is calculated including all stores acquired in the Henry’s Transaction and the Sunflower Transaction for all periods presented. Pro forma comparable store sales growth on a “two-year stacked basis” is computed by adding the pro forma comparable store sales growth of the period referenced and that of the same fiscal period ended twelve months prior.
17
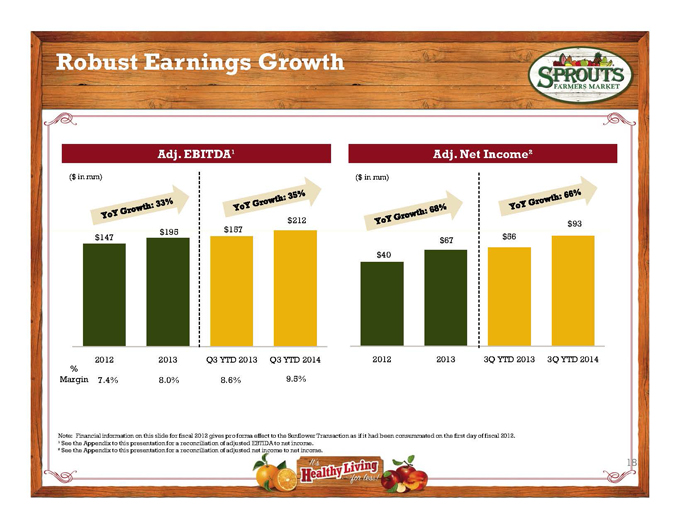
Robust Earnings Growth
Adj. EBITDA¹
($ in mm)
YoY Growth: 33%
YoY Growth: 35%
2012 $147
2013 $195
Q3 YTD 2013$157
Q3 YTD 2014$212
Adj. Net Income²
($ in mm)
YoY Growth: 68%
YoY Growth: 66%
2012 $40
2013 $67,4
3Q YTD 2013 $56
3Q YTD 2014 $93
Note: Financial information on this slide for fiscal 2012 gives pro forma effect to the Sunflower Transaction as if it had been consummated on the first day of fiscal 2012.
¹ See the Appendix to this presentation for a reconciliation of adjusted EBTIDA to net income.
² See the Appendix to this presentation for a reconciliation of adjusted net income to net income. 18
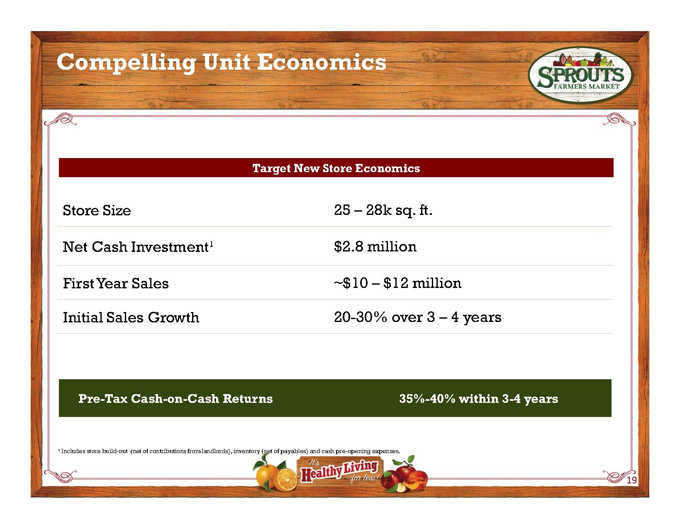
Compelling Unit Economics
Target New Store Economics
Store Size 25 – 28k sq. ft.
Net Cash Investment¹ $2.8 million
First Year Sales ~$10 – $12 million
Initial Sales Growth 20-30% over 3 – 4 years
Pre-Tax Cash-on-Cash Returns 35%-40% within 3-4 years
¹ Includes store build-out (net of contributions from landlords), inventory (net of payables) and cash pre-opening expenses. 19
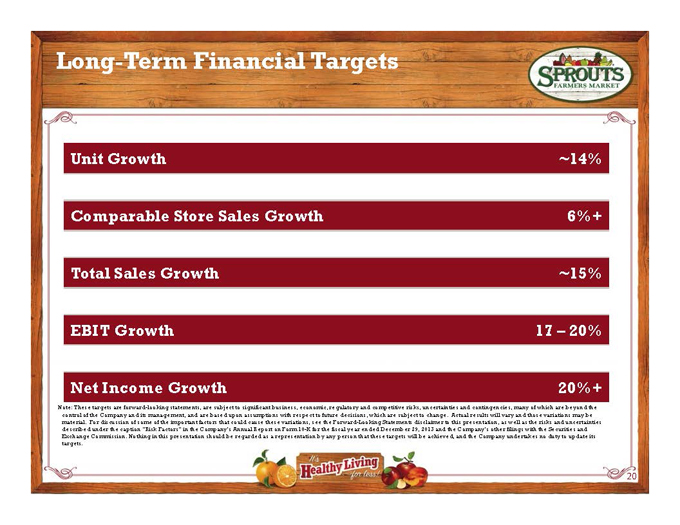
Long-Term Financial Targets
Unit Growth ~14%
Comparable Store Sales Growth 6%+
Total Sales Growth ~15%
EBIT Growth17 – 20%
Net Income Growth 20%+
Note: These targets are forward-looking statements, are subject to significant business, economic, regulatory and competitive risks, uncertainties and contingencies, many of which are beyond the control of the Company and its management, and are based upon assumptions with respect to future decisions, which are subject to change. Actual results will vary and those variations may be material. For discussion of some of the important factors that could cause these variations, see the Forward-Looking Statements disclaimer to this presentation, as well as the risks and uncertainties described under the caption “Risk Factors” in the Company’s Annual Report on Form 10-K for the fiscal year ended December 29, 2013 and the Company’s other filings with the Securities and Exchange Commission. Nothing in this presentation should be regarded as a representation by any person that these targets will be achieved, and the Company undertakes no duty to update its targets. 20
|
|
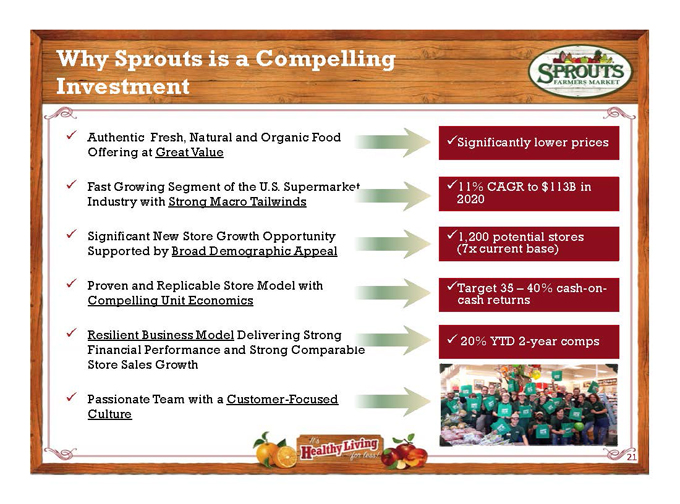
Why Sprouts is a Compelling Investment
Authentic Fresh, Natural and Organic Food Offering at Great Value
Fast Growing Segment of the U.S. Supermarket Industry with Strong Macro Tailwinds
Significant New Store Growth Opportunity Supported by Broad Demographic Appeal
Proven and Replicable Store Model with Compelling Unit Economics
Resilient Business Model Delivering Strong Financial Performance and Strong Comparable Store Sales Growth
Passionate Team with a Customer-Focused Culture
Significantly lower prices
11% CAGR to $113B in 2020
1,200 potential stores (7x current base)
Target 35 – 40% cash-on-cash returns
20% YTD 2-year comps 21
Appendix: Supplemental Materials
Non-GAAP Reconciliation
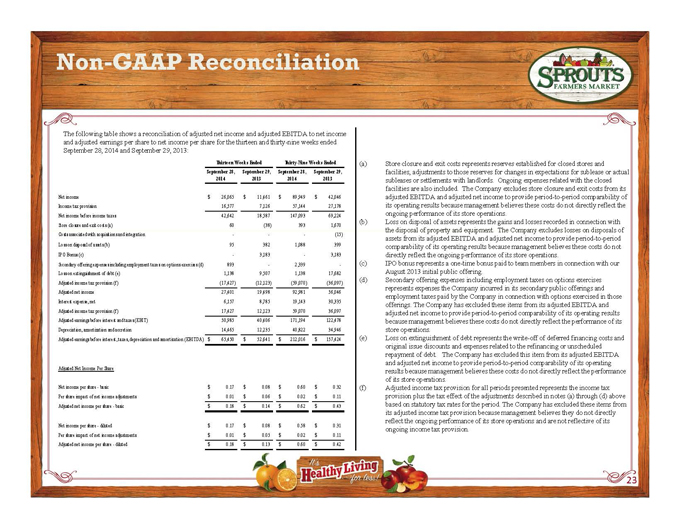
The following table shows a reconciliation of adjusted net income and adjusted EBITDA to net income and adjusted earnings per share to net income per share for the thirteen and thirty-nine weeks ended September 28, 2014 and September 29, 2013:
Thirteen Weeks Ended Thirty-Nine Weeks Ended
September 28, 2014 September 29, 2013 September 28, 2014 September 29, 2013
Net income $ 2 6,065 $ 11,461 $ 89,949 $ 42,046
Income tax provision 16,577 7,126 57,144 27,178
Net income before income taxes 42,642 18,587 147,093 69,224
Store closure and exit costs (a) 60 (38) 393 1,670
Costs associated with acquisitions and integration ——(15)
Loss on disposal of assets (b) 95 382 1,088 399
IPO Bonus (c)—3,183—3,183
Secondary offering expenses including employment taxes on options exercises (d) 893—2,339 -
Loss on extinguishment of debt (e) 1,138 9,507 1,138 17,682
Adjusted income tax provision (f) (17,427) (12,123) (59,070) (36,097)
Adjusted net income 27,401 19,498 92,981 56,046
Interest expense, net 6,157 8,785 19,143 30,335
Adjusted income tax provision (f) 17,427 12,123 59,070 36,097
Adjusted earnings before interest and taxes (EBIT) 50,985 40,406 171,194 122,478
Depreciation, amortization and accretion 14,465 12,235 40,822 34,946
Adjusted earnings before interest, taxes, depreciation and amortization (EBITDA) $ 65,450 $ 52,641 $ 212,016 $ 157,424
Adjusted Net Income Per Share
Net income per share—basic $ 0.17 $ 0 .08 $ 0.60 $ 0.32
Per share impact of net income adjustments $ 0.01 $ 0.06 $ 0.02 $ 0.11
Adjusted net income per share—basic $ 0.18 $ 0.14 $ 0.62 $ 0.43
Net income per share—diluted $ 0.17 $ 0.08 $ 0.58 $ 0.31
Per share impact of net income adjustments $ 0.01 $ 0.05 $ 0.02 $ 0.11
Adjusted net income per share—diluted $ 0.18 $ 0.13 $ 0.60 $ 0.42
(a) Store closure and exit costs represents reserves established for closed stores and facilities, adjustments to those reserves for changes in expectations for sublease or actual subleases or settlements with landlords. Ongoing expenses related with the closed facilities are also included. The Company excludes store closure and exit costs from its adjusted EBITDA and adjusted net income to provide period-to-period comparability of its operating results because management believes these costs do not directly reflect the ongoing performance of its store operations.
(b) Loss on disposal of assets represents the gains and losses recorded in connection with the disposal of property and equipment. The Company excludes losses on disposals of assets from its adjusted EBITDA and adjusted net income to provide period-to-period comparability of its operating results because management believes these costs do not directly reflect the ongoing performance of its store operations.
(c) IPO bonus represents a one-time bonus paid to team members in connection with our August 2013 initial public offering.
(d) Secondary offering expenses including employment taxes on options exercises represents expenses the Company incurred in its secondary public offerings and employment taxes paid by the Company in connection with options exercised in those offerings. The Company has excluded these items from its adjusted EBITDA and adjusted net income to provide period-to-period comparability of its operating results because management believes these costs do not directly reflect the performance of its store operations.
(e) Loss on extinguishment of debt represents the write-off of deferred financing costs and original issue discounts and expenses related to the refinancing or unscheduled repayment of debt. The Company has excluded this item from its adjusted EBITDA and adjusted net income to provide period-to-period comparability of its operating results because management believes these costs do not directly reflect the performance of its store operations.
(f) Adjusted income tax provision for all periods presented represents the income tax provision plus the tax effect of the adjustments described in notes (a) through (d) above based on statutory tax rates for the period. The Company has excluded these items from its adjusted income tax provision because management believes they do not directly reflect the ongoing performance of its store operations and are not reflective of its ongoing income tax provision. 23
Its healthy living for less