
Investor Deck February ‘18 Exhibit 99.1
Forward-Looking Statements: Certain statements in this presentation are forward-looking as defined in the Private Securities Litigation Reform Act of 1995. Any statements contained herein (including, but not limited to, statements to the effect that Sprouts Farmers Market, Inc. (the “Company”) or its management "anticipates," "plans," "estimates," "expects," "believes," or the negative of these terms and other similar expressions) that are not statements of historical fact should be considered forward-looking statements, including, without limitation, statements regarding the Company’s estimated growth, expected results and financial targets. These statements involve certain risks and uncertainties that may cause actual results to differ materially from expectations as of the date of this presentation. These risks and uncertainties include, without limitation, risks associated with the Company’s ability to successfully compete in its intensely competitive industry; the Company’s ability to successfully open new stores; the Company’s ability to manage its rapid growth; the Company’s ability to maintain or improve its comparable store sales and operating margins; the Company’s ability to identify and react to trends in consumer preferences; product supply disruptions; general economic conditions; and other factors as set forth from time to time in the Company’s Securities and Exchange Commission filings. The Company intends these forward-looking statements to speak only as of the date of this presentation and does not undertake to update or revise them as more information becomes available, except as required by law. Non-GAAP Financial Measures: In addition to reporting financial results in accordance with generally accepted accounting principles (“GAAP”), the Company has presented EBITDA for 2016- 2017 and for 2013-2015, adjusted net income and adjusted EBITDA. The Company defines EBITDA as net income before interest expense, provision for income tax, and depreciation and amortization, and defines adjusted EBITDA as EBITDA as further adjusted to exclude store closure and exit costs, costs associated with acquisitions and integrations, gains and losses from disposal of assets, bonuses paid to certain employees in connection with the Company’s initial public offering (“IPO Bonus”), expenses incurred by the Company in its secondary public offerings and employment taxes paid by the Company in connection with options exercised in those offerings (“Public Offering Expenses”) and the loss on extinguishment of debt (collectively, the “Adjustments”). The Company defines adjusted net income as net income excluding the Adjustments and the related tax impact of those Adjustments. For fiscal year 2016 and 2017, such further Adjustments to net income and EBITDA were immaterial; thus only net income and EBITDA are presented. The Company also provides information regarding Return on Invested Capital (“ROIC”) as additional information about its operating results for 2014-2017. ROIC is a non-GAAP financial measure used by management to evaluate the Company’s investment returns on capital and provides a meaningful measure of the effectiveness of its capital allocation over time. The Company defines ROIC as net operating profit after tax (“NOPAT”), including the effect of capitalized operating leases, divided by average invested capital. In addition, the Company presents diluted earnings per share for 2017 excluding the one-time benefit of the legislation commonly referred to as the Tax Cuts and Jobs Act (the “Tax Act”). These non-GAAP measures are intended to provide additional information only and do not have any standard meanings prescribed by GAAP. Use of these terms may differ from similar measures reported by other companies. The Company's management believes that these presentations provide useful information to management, analysts and investors regarding certain additional financial and business trends relating to the Company’s results of operations and financial condition. In addition, management uses these measures for reviewing the financial results of the Company and as a component of incentive compensation. Because of their limitations, none of these non-GAAP measures should be considered as a measure of discretionary cash available to use to reinvest in growth of the Company’s business, or as a measure of cash that will be available to meet the Company’s obligations. Each of these non-GAAP measures has its limitations as an analytical tool, and you should not consider them in isolation or as a substitute for analysis of the Company’s results as reported under GAAP. Please see the Appendix to this presentation for a reconciliation of these non-GAAP measures to the comparable GAAP measures.
Overview of Sprouts
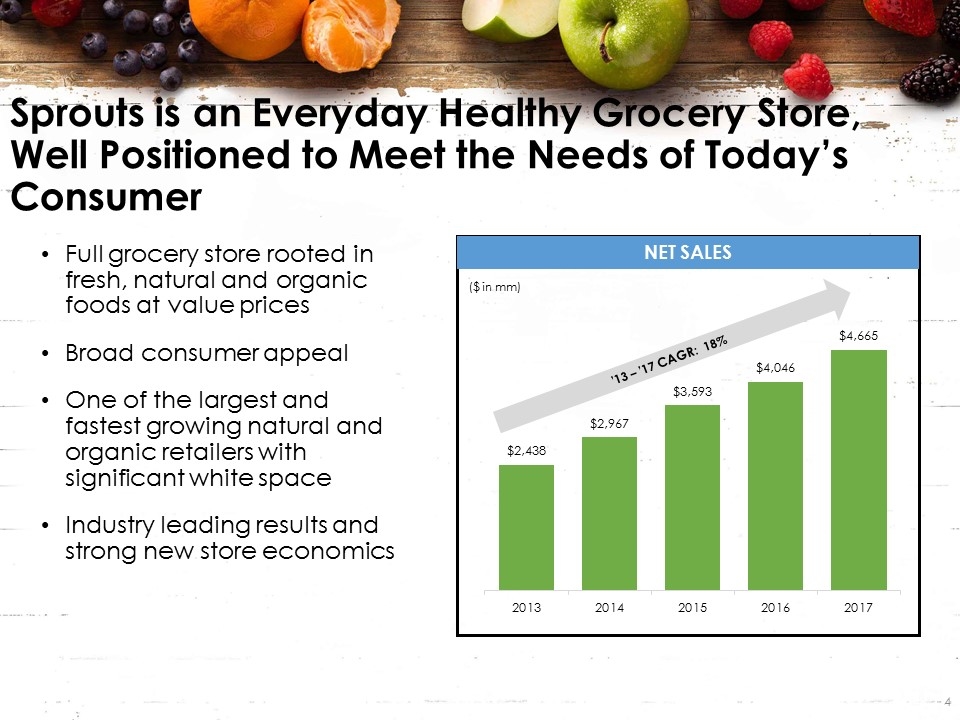
Full grocery store rooted in fresh, natural and organic foods at value prices Broad consumer appeal One of the largest and fastest growing natural and organic retailers with significant white space Industry leading results and strong new store economics Sprouts is an Everyday Healthy Grocery Store, Well Positioned to Meet the Needs of Today’s Consumer ’13 – ’17 CAGR: 18% ($ in mm) Net Sales

Focused Strategic Priorities are Driving Top Line Performance and Improved Operational Efficiencies SALES DRIVERS BUILDING FOR GROWTH THE SPROUTS BRAND Continue to grow Private Label rooted in health, taste, innovation and value Expanding deli offering Further improvement in Meat/Seafood as a traffic driver Unit growth expansion in both existing and new markets Implementing systems to improve operational effectiveness for scale and gain costs efficiencies Enhancing promotional effectiveness through data analytics Investing in team member wages, training, and benefits Plan to offer home delivery in all our major markets Accelerating customer engagement through a digital transformation of our website and app Expand awareness in new markets

A Grocery Shopping Experience that Makes Healthy Living Easy & Affordable Health Value Selection Engagement SELECTION VALUE KNOWLEDGEABLE SERVICE & ENGAGEMENT HEALTH
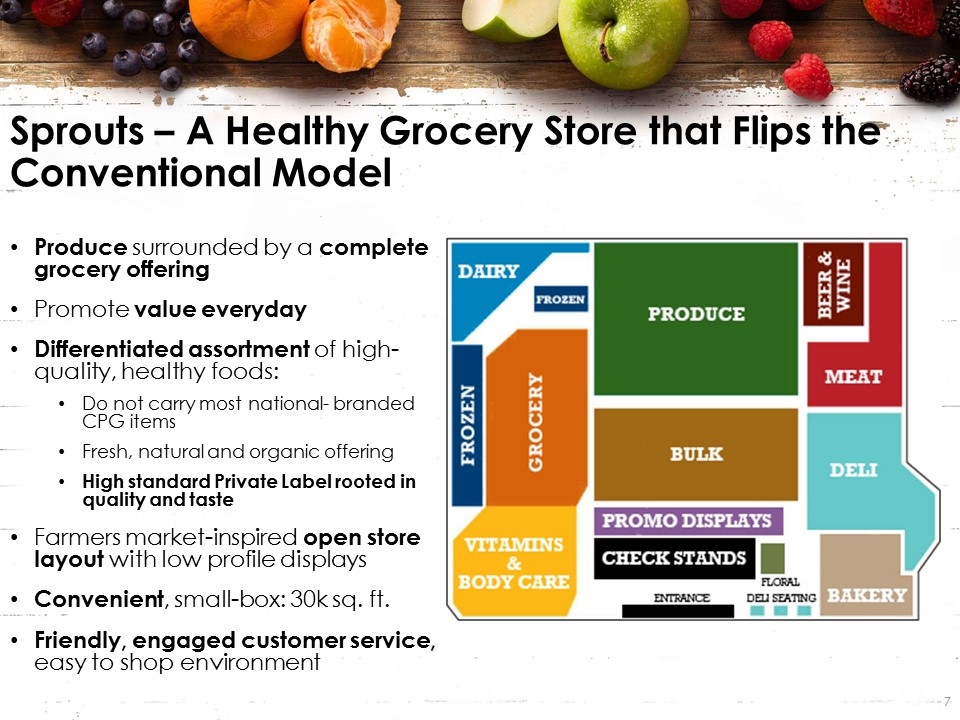
Produce surrounded by a complete grocery offering Promote value everyday Differentiated assortment of high-quality, healthy foods: Do not carry most national- branded CPG items Fresh, natural and organic offering High standard Private Label rooted in quality and taste Farmers market-inspired open store layout with low profile displays Convenient, small-box: 30k sq. ft. Friendly, engaged customer service, easy to shop environment Sprouts – A Healthy Grocery Store that Flips the Conventional Model

Sprouts’ footprint and near-term expansion covers high growth areas Demographics allows for deep penetration in markets Model works well in densely populated, urban areas as well as smaller metropolitan markets Successful in “natural / lifestyle” markets and more “traditional” markets Balanced unit growth with 60% - 70% coming from existing markets Will open approximately 30 stores per year for the near term Years of New Store Growth Existing Market – 290 stores NM TX CO UT AZ NV CA 10 42 35 8 109 8 5 32 OK KS MO TN NC 5 3 6 16 4 AL GA FL 5 2 Near Term Expansion Markets
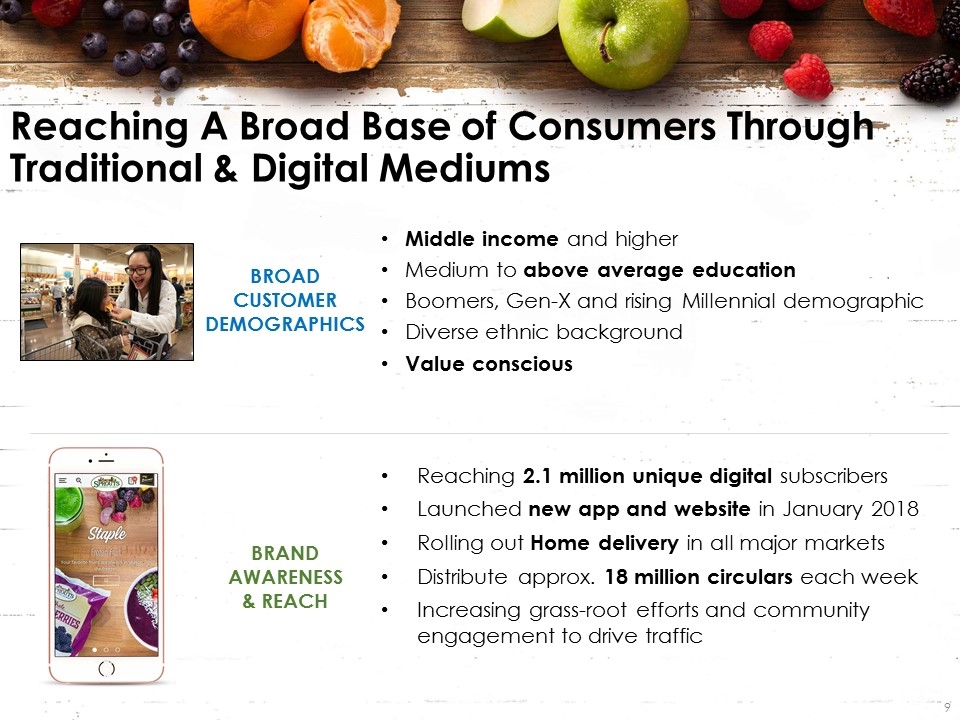
Reaching A Broad Base of Consumers Through Traditional & Digital Mediums BROAD CUSTOMER DEMOGRAPHICS Middle income and higher Medium to above average education Boomers, Gen-X and rising Millennial demographic Diverse ethnic background Value conscious BRAND AWARENESS & REACH Reaching 2.1 million unique digital subscribers Launched new app and website in January 2018 Rolling out Home delivery in all major markets Distribute approx. 18 million circulars each week Increasing grass-root efforts and community engagement to drive traffic
Follows a specific diet because they need to (medical reasons) or they want to (weight management / ingredient avoidance) Sprouts’ Value Proposition Attracts a Customer Base that is Much Broader than that of Traditional Health Food or Specialty Stores Source: Company consumer insight study DIET FOLLOWER Does not follow a strict or specific diet, but health / wellness is important to them and a primary consideration when grocery shopping HEALTH ENTHUSIAST Actively tries to improve their food choices. They have a strong desire to learn more about both healthy living and eating HEALTH CURIOUS Appreciates the small-box nature of the store and may make shopping decisions based on how close a store is to their home or office CONVENIENCE-FOCUSED Are always looking for the best deals and actively price shopping VALUE-FOCUSED Who is the typical Sprouts shopper?

2017 Sustainability & Social Responsibility SUSTAINABLE SOURCING ZERO WASTE ENERGY & CARBON REDUCTION HEALTHY COMMUNITIES Committed to Zero Waste by 2020, a 90% waste diversion rate per EPA Diverted 155 million pounds of food and other recyclables 55% landfill diversion rate achieved 23 million pounds of food donated, equivalent to19 million meals for our communities 30 million pounds of food waste sent to local cattle farms and compost facilities Received the EPA's Store Certification Excellence Award for having 76 EPA GreenChill-certified stores Piloting battery storage systems in stores to reduce on-peak utility energy demand Implemented an in-store energy reduction program utilizing features designed to conserve resources such as night curtains, natural light harvesting and LED lighting Sprouts Healthy Communities Foundation donated more than $5.1 million to health and wellness related causes since 2015 Supported 830 community events, reaching more than 2.75 million neighbors Created more than 4,000 jobs 23% of our more than 27,000 team members were promoted in 2017 We maintain purchasing preferences for suppliers who employ sustainable sourcing, fair treatment of people and animal welfare standards 90% of Sprouts' fresh and frozen seafood is sourced from responsibly managed fisheries Over 70% of our Sprouts Brand packaged food products are non-GMO verified or certified organic

Business & Financial Performance
7-8% Natural and Organic Sector Growth1 Powerful Growth Business – Results Driven GROWTH RESULTS One of the Best White Space Opportunities in Retail Healthy Unit Growth Rate 1 SPINS LLC projections for natural and organic food and supplement sales growth through 2020 Compelling Store-Level Economics Double Digit Sales Growth Strong Free Cash Flow Generation Business Ongoing Share Repurchase Program
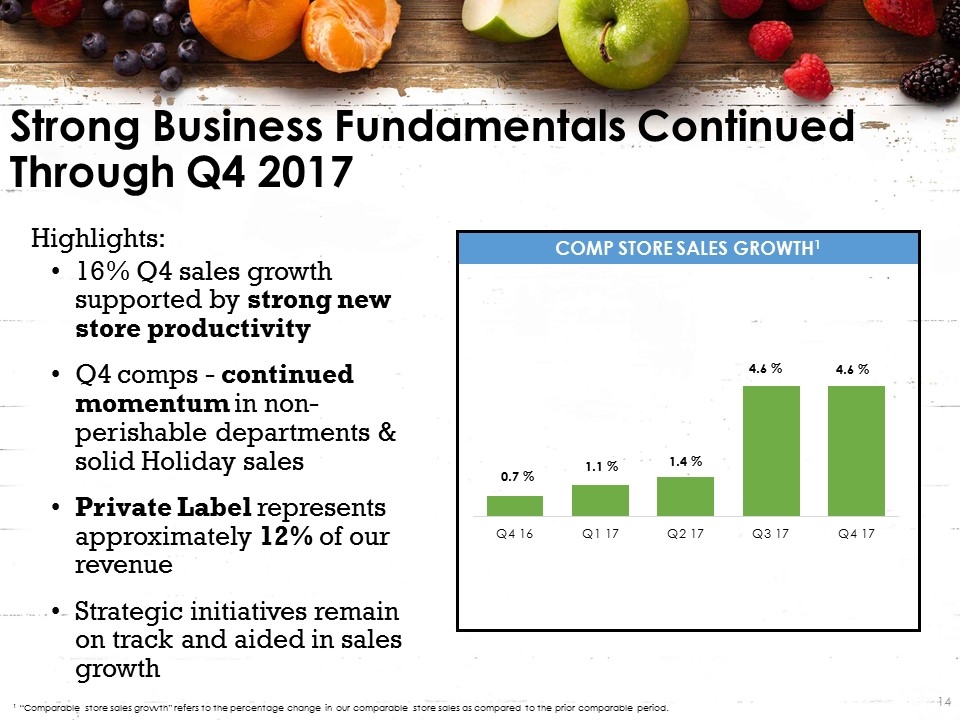
COMP STORE SALES GROWTH1 16% Q4 sales growth supported by strong new store productivity Q4 comps - continued momentum in non-perishable departments & solid Holiday sales Private Label represents approximately 12% of our revenue Strategic initiatives remain on track and aided in sales growth Strong Business Fundamentals Continued Through Q4 2017 1 “Comparable store sales growth” refers to the percentage change in our comparable store sales as compared to the prior comparable period. Highlights:
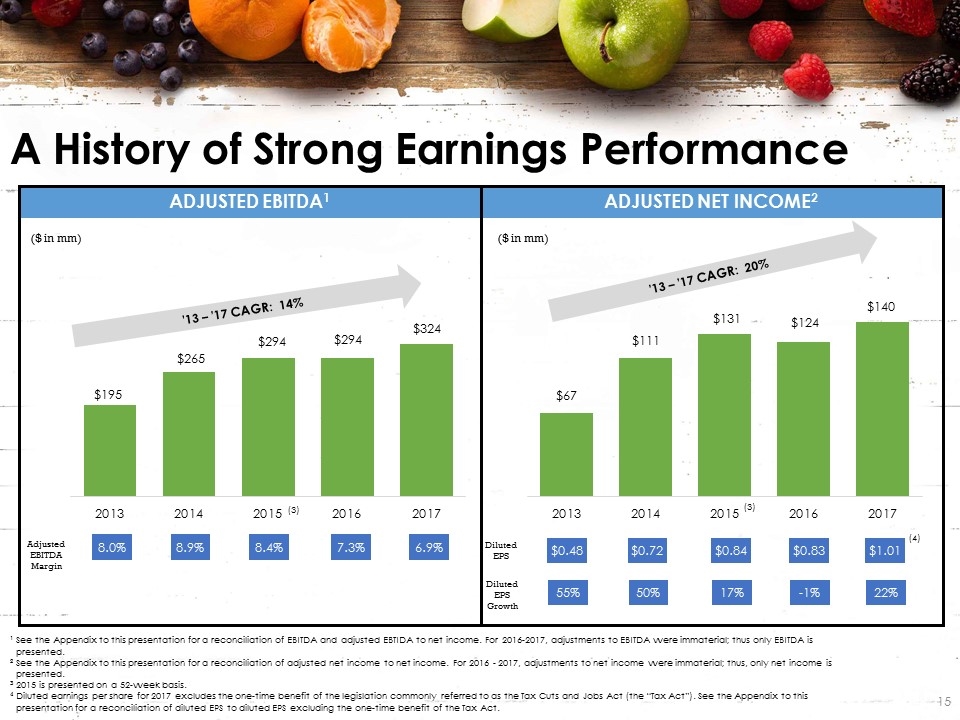
ADJUSTED NET INCOME2 ADJUSTED EBITDA1 A History of Strong Earnings Performance ¹ See the Appendix to this presentation for a reconciliation of EBITDA and adjusted EBTIDA to net income. For 2016-2017, adjustments to EBITDA were immaterial; thus only EBITDA is presented. ² See the Appendix to this presentation for a reconciliation of adjusted net income to net income. For 2016 - 2017, adjustments to net income were immaterial; thus, only net income is presented. 3 2015 is presented on a 52-week basis. 4 Diluted earnings per share for 2017 excludes the one-time benefit of the legislation commonly referred to as the Tax Cuts and Jobs Act (the “Tax Act”). See the Appendix to this presentation for a reconciliation of diluted EPS to diluted EPS excluding the one-time benefit of the Tax Act. ($ in mm) ($ in mm) Adjusted EBITDA Margin ’13 – ’17 CAGR: 14% ’13 – ’17 CAGR: 20% Diluted EPS Diluted EPS Growth (3) (3) 8.0% 8.9% 8.4% 7.3% $0.48 $0.72 $0.84 $0.83 55% 50% 17% -1% 6.9% $1.01 22% (4)
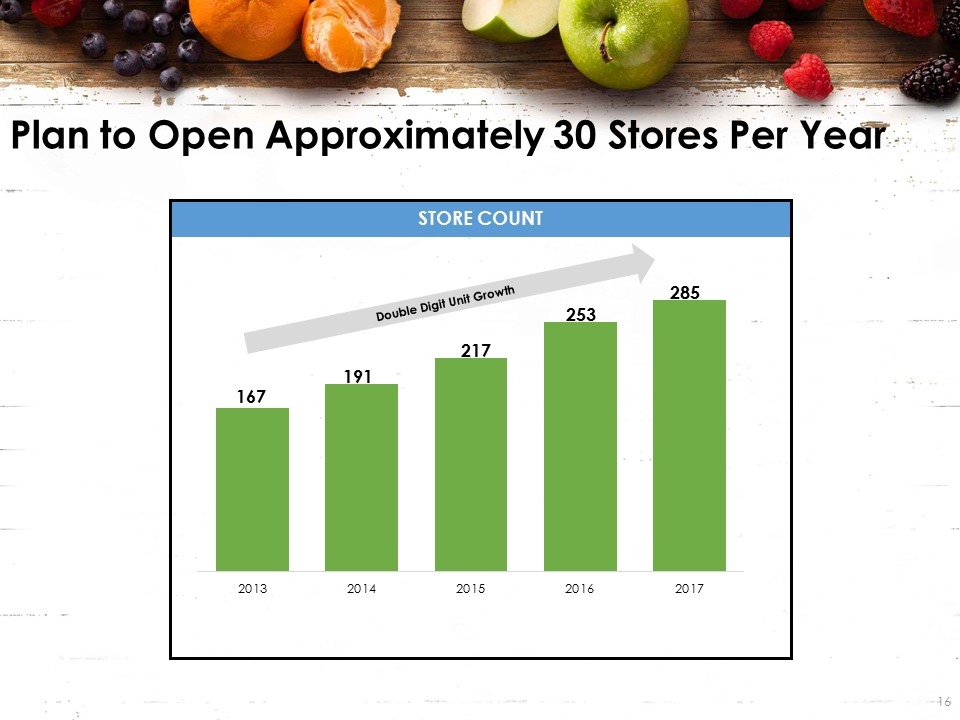
Store Count Plan to Open Approximately 30 Stores Per Year Double Digit Unit Growth
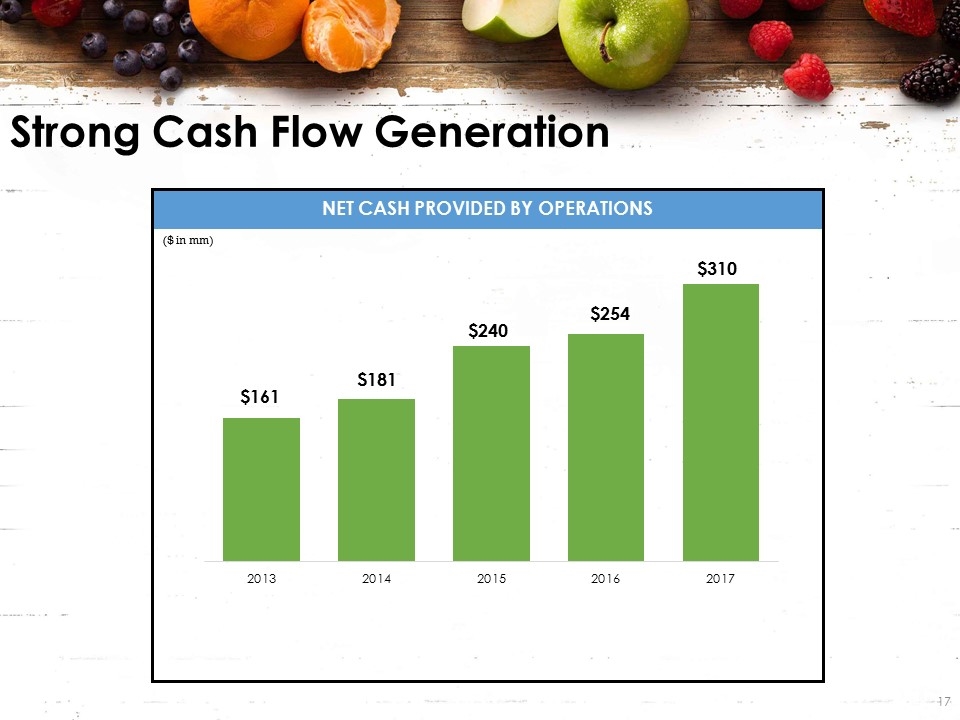
Net cash provided by operations Strong Cash Flow Generation ($ in mm)

Cap ex spend Cap Ex Focused on Unit Growth, Sales Initiatives & Infrastructure ($ in mm) Note: Cap Ex is net of landlord reimbursements
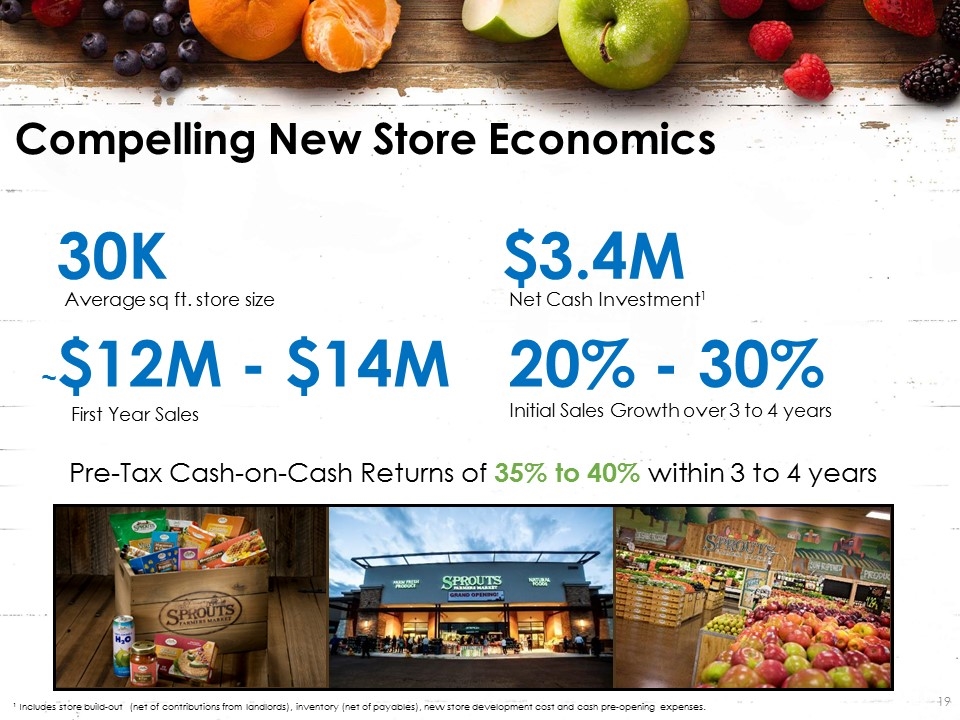
Compelling New Store Economics Average sq ft. store size Net Cash Investment1 First Year Sales Initial Sales Growth over 3 to 4 years ¹ Includes store build-out (net of contributions from landlords), inventory (net of payables), new store development cost and cash pre-opening expenses. 30K $3.4M ~$12M - $14M 20% - 30% Pre-Tax Cash-on-Cash Returns of 35% to 40% within 3 to 4 years
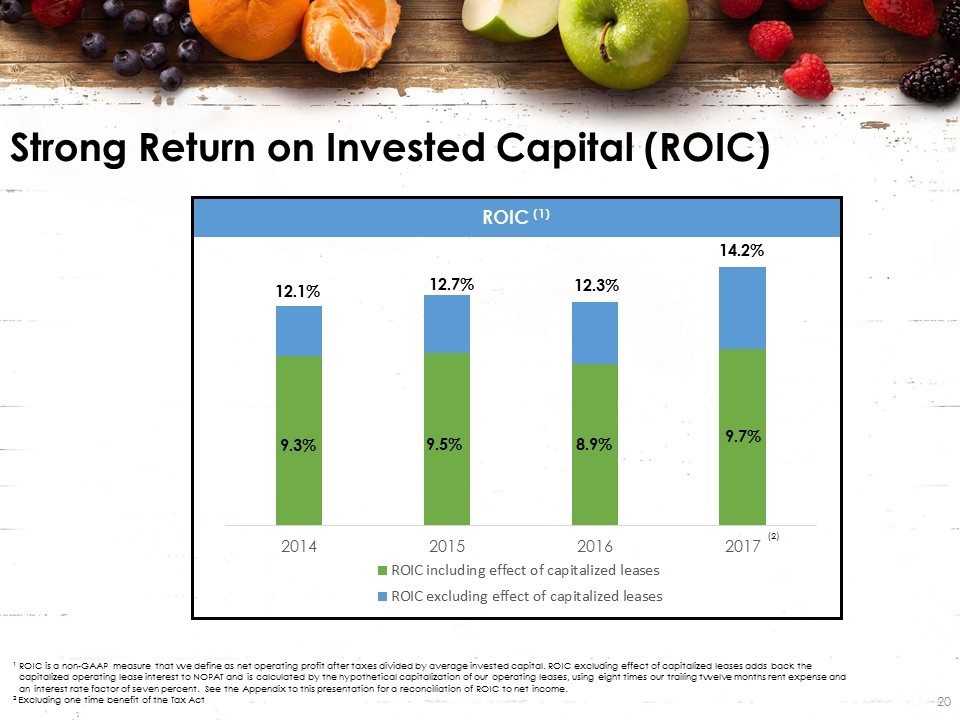
ROIC (1) Strong Return on Invested Capital (ROIC) ¹ ROIC is a non-GAAP measure that we define as net operating profit after taxes divided by average invested capital. ROIC excluding effect of capitalized leases adds back the capitalized operating lease interest to NOPAT and is calculated by the hypothetical capitalization of our operating leases, using eight times our trailing twelve months rent expense and an interest rate factor of seven percent. See the Appendix to this presentation for a reconciliation of ROIC to net income. 2 Excluding one time benefit of the Tax Act 12.7% 12.3% 14.2%
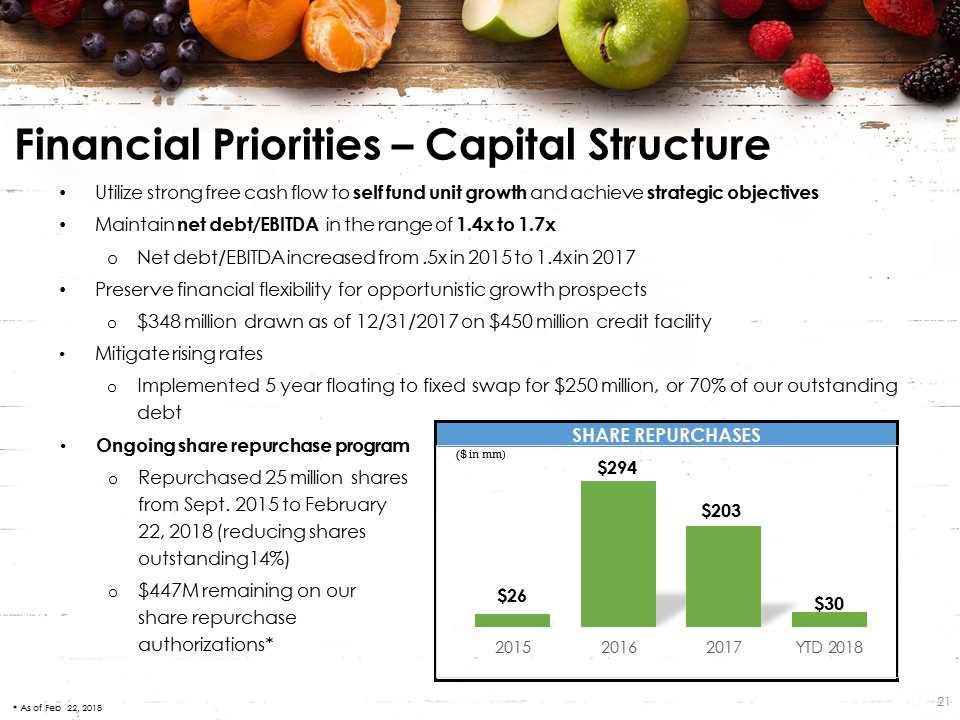
Share repurchases Utilize strong free cash flow to self fund unit growth and achieve strategic objectives Maintain net debt/EBITDA in the range of 1.4x to 1.7x Net debt/EBITDA increased from .5x in 2015 to 1.4x in 2017 Preserve financial flexibility for opportunistic growth prospects $348 million drawn as of 12/31/2017 on $450 million credit facility Mitigate rising rates Implemented 5 year floating to fixed swap for $250 million, or 70% of our outstanding debt Financial Priorities – Capital Structure ($ in mm) * As of Feb 22, 2018 Ongoing share repurchase program Repurchased 25 million shares from Sept. 2015 to February 22, 2018 (reducing shares outstanding14%) $447M remaining on our share repurchase authorizations*
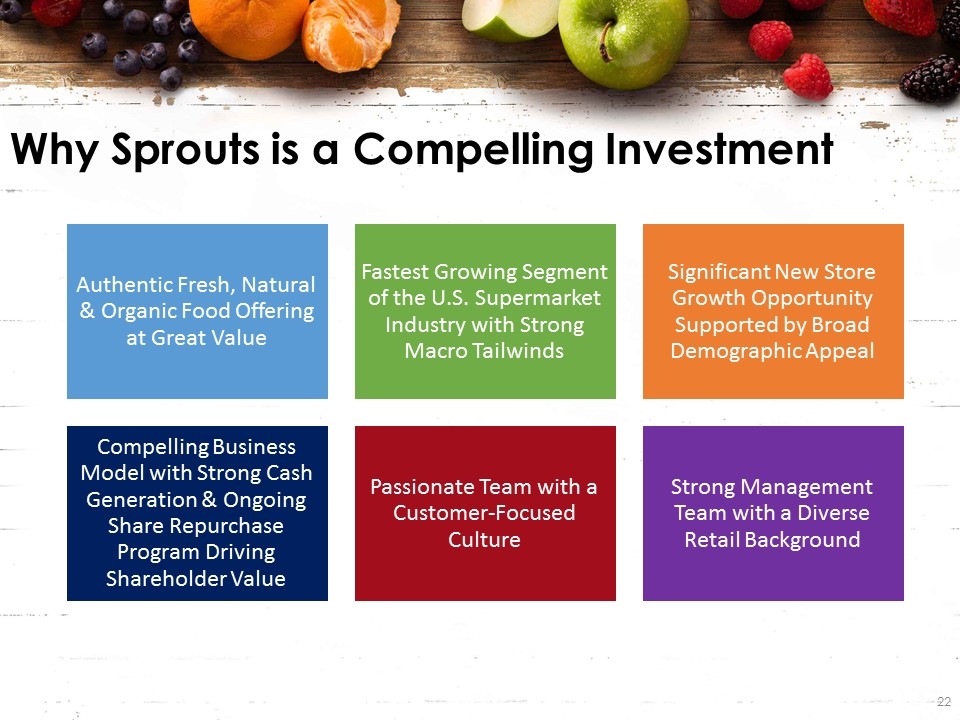
Why Sprouts is a Compelling Investment Authentic Fresh, Natural & Organic Food Offering at Great Value Fastest Growing Segment of the U.S. Supermarket Industry with Strong Macro Tailwinds Significant New Store Growth Opportunity Supported by Broad Demographic Appeal Compelling Business Model with Strong Cash Generation & Ongoing Share Repurchase Program Driving Shareholder Value Passionate Team with a Customer-Focused Culture Strong Management Team with a Diverse Retail Background
Appendix: Supplemental Materials

Management Team with Grocery & Retail Experience Amin Maredia Jim Nielsen Brad Lukow Dan Sanders Dan Bruni Ted Frumkin Shawn Gensch Brandon Lombardi Chief Executive Officer 6 Years with Sprouts President & Chief Operating Officer 6 Years with Sprouts Chief Financial Officer 2 Years with Sprouts Chief Operations Officer 2 Years with Sprouts Chief Information Officer 3 Years with Sprouts Chief Development Officer 6 Years with Sprouts Chief Marketing Officer 2 Years with Sprouts Chief Human Resources & Legal Officer 6 Years with Sprouts
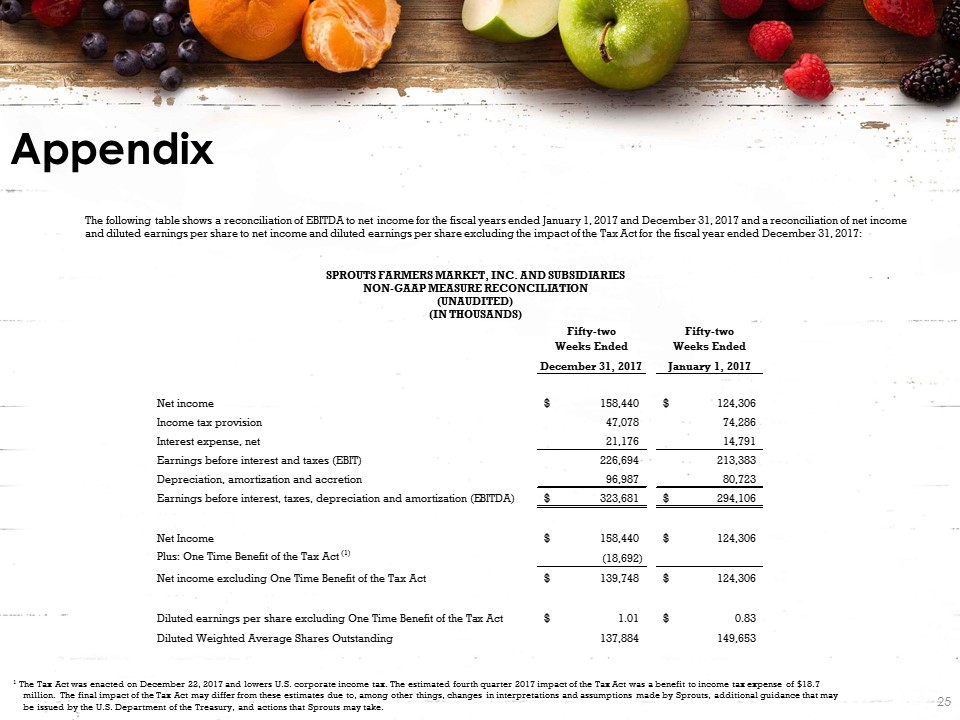
Appendix SPROUTS FARMERS MARKET, INC. AND SUBSIDIARIES NON-GAAP MEASURE RECONCILIATION (UNAUDITED) (IN THOUSANDS) The following table shows a reconciliation of EBITDA to net income for the fiscal years ended January 1, 2017 and December 31, 2017 and a reconciliation of net income and diluted earnings per share to net income and diluted earnings per share excluding the impact of the Tax Act for the fiscal year ended December 31, 2017: 1 The Tax Act was enacted on December 22, 2017 and lowers U.S. corporate income tax. The estimated fourth quarter 2017 impact of the Tax Act was a benefit to income tax expense of $18.7 million. The final impact of the Tax Act may differ from these estimates due to, among other things, changes in interpretations and assumptions made by Sprouts, additional guidance that may be issued by the U.S. Department of the Treasury, and actions that Sprouts may take.

Appendix The following table shows a reconciliation of adjusted net income and adjusted EBITDA to net income for the Company’s 2013, 2014 and 2015 fiscal years: Note: Footnotes on the following page. SPROUTS FARMERS MARKET, INC. AND SUBSIDIARIES NON-GAAP MEASURE RECONCILIATION (UNAUDITED) (IN THOUSANDS) Fifty-Three Weeks Ended Fifty-Two Weeks Ended Fifty-Two Weeks Ended January 3, 2016 December 28, 2014 December 29, 2013 Net income $ 128,991 $ 107,692 $ 51,326 Income tax provision 77,002 66,414 32,741 Net income before income taxes 205,993 174,106 84,067 Store closure and exit costs (a) 1,802 725 2,051 Costs associated with acquisitions and integration (b) - - (15) Loss on disposal of assets (c) 1,521 1,181 412 IPO bonus (d) - - 3,183 Secondary offering expenses including employment taxes on options exercises (e) 335 2,557 2,014 Loss on extinguishment of debt (f) 5,481 1,138 18,721 Adjusted income tax provision (g) (80,418) (68,551) (43,010) Adjusted net income 134,714 111,156 67,423 Interest expense, net 17,707 25,057 37,185 Adjusted income tax provision (g) 80,418 68,551 43,010 Adjusted earnings before interest and taxes (EBIT) 232,839 204,764 147,618 Depreciation, amortization and accretion 69,256 60,612 47,539 Adjusted earnings before interest, taxes, depreciation and amortization (EBITDA) $ 302,095 $ 265,376 $ 195,157

Appendix - Footnotes
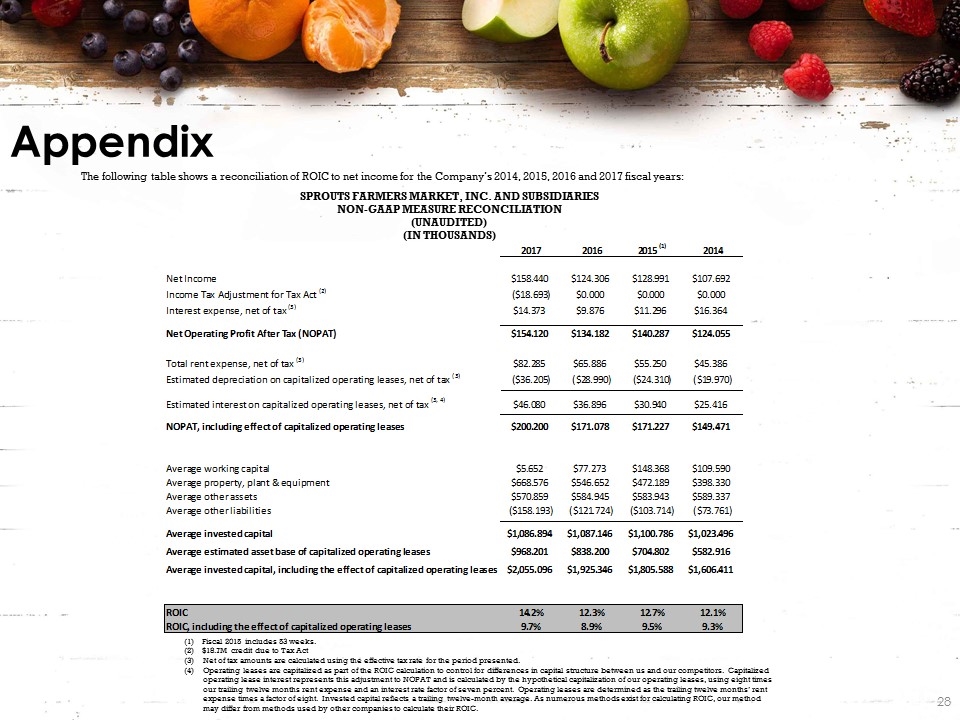
Appendix The following table shows a reconciliation of ROIC to net income for the Company’s 2014, 2015, 2016 and 2017 fiscal years: SPROUTS FARMERS MARKET, INC. AND SUBSIDIARIES NON-GAAP MEASURE RECONCILIATION (UNAUDITED) (IN THOUSANDS) (1) Fiscal 2015 includes 53 weeks. (2) $18.7M credit due to Tax Act (3)Net of tax amounts are calculated using the effective tax rate for the period presented. (4)Operating leases are capitalized as part of the ROIC calculation to control for differences in capital structure between us and our competitors. Capitalized operating lease interest represents this adjustment to NOPAT and is calculated by the hypothetical capitalization of our operating leases, using eight times our trailing twelve months rent expense and an interest rate factor of seven percent. Operating leases are determined as the trailing twelve months’ rent expense times a factor of eight. Invested capital reflects a trailing twelve-month average. As numerous methods exist for calculating ROIC, our method may differ from methods used by other companies to calculate their ROIC.


