Q2 2024 Earnings July 2024 Exhibit 99.2
2 Forward-Looking Statements Certain statements in this presentation are forward-looking as defined in the Private Securities Litigation Reform Act of 1995. Any statements contained herein that are not statements of historical fact (including, but not limited to, statements to the effect that Sprouts Farmers Market, Inc. (the “Company”) or its management "anticipates," "plans," "estimates," "expects," or "believes," or the negative of these terms and other similar expressions) should be considered forward-looking statements, including, without limitation, statements regarding the Company’s outlook, growth, opportunities and long-term strategy. These statements involve certain risks and uncertainties that may cause actual results to differ materially from expectations as of the date of this presentation. These risks and uncertainties include, without limitation, the Company’s ability to execute on its long-term strategy; the Company’s ability to successfully compete in its competitive industry; the Company’s ability to successfully open new stores; the Company’s ability to manage its growth; the Company’s ability to maintain or improve its operating margins; the Company’s ability to identify and react to trends in consumer preferences; product supply disruptions; equipment supply disruptions; general economic conditions that impact consumer spending or result in competitive responses; accounting standard changes; the current inflationary environment and future potential inflationary and/or deflationary trends; and other factors as set forth from time to time in the Company’s Securities and Exchange Commission filings, including, without limitation, the Company’s Annual Report on Form 10-K and Quarterly Reports on Form 10-Q. The Company intends these forward-looking statements to speak only as of the time of this presentation and does not undertake to update or revise them as more information becomes available, except as required by law. Non-GAAP Financial Measures We refer to adjusted gross profit, adjusted gross margin, EBIT, adjusted EBIT, adjusted EBIT Margin, and adjusted diluted earnings per share, each of which is a Non-GAAP Financial Measure. These measures are not prepared in accordance with, and are not intended as alternatives to, generally accepted accounting principles in the United States, or GAAP. The Company's management believes that such measures provide useful information to management, analysts and investors regarding certain additional financial and business trends relating to its results of operations and financial condition. In addition, management uses these measures for reviewing the Company’s financial results, and certain of these measures may be used as components of incentive compensation. The Company defines adjusted gross profit as gross profit, excluding the impact of special items. Adjusted gross margin reflects adjusted gross profit divided by net sales for the applicable period. EBIT is defined as net income before interest expense and provision for income tax, and adjusted EBIT as EBIT, excluding the impact of special items. Adjusted EBIT Margin reflects adjusted EBIT, divided by net sales for the applicable period. The Company defines adjusted diluted earnings per share as diluted earnings per share excluding the impact of special items. Non-GAAP measures are intended to provide additional information only and do not have any standard meanings prescribed by GAAP. Use of these terms may differ from similar measures reported by other companies. Because of their limitations, non-GAAP measures should not be considered as a measure of discretionary cash available to use to reinvest in the growth of the Company’s business, or as a measure of cash that will be available to meet the Company’s obligations. Each non-GAAP measure has its limitations as an analytical tool, and you should not consider them in isolation or as a substitute for analysis of the Company’s results as reported under GAAP. To the extent forward looking non-GAAP financial measures are provided herein, they are not reconciled to comparable forward-looking GAAP measures due to the inherent difficulty in forecasting and quantifying certain amounts that are necessary for such reconciliation.
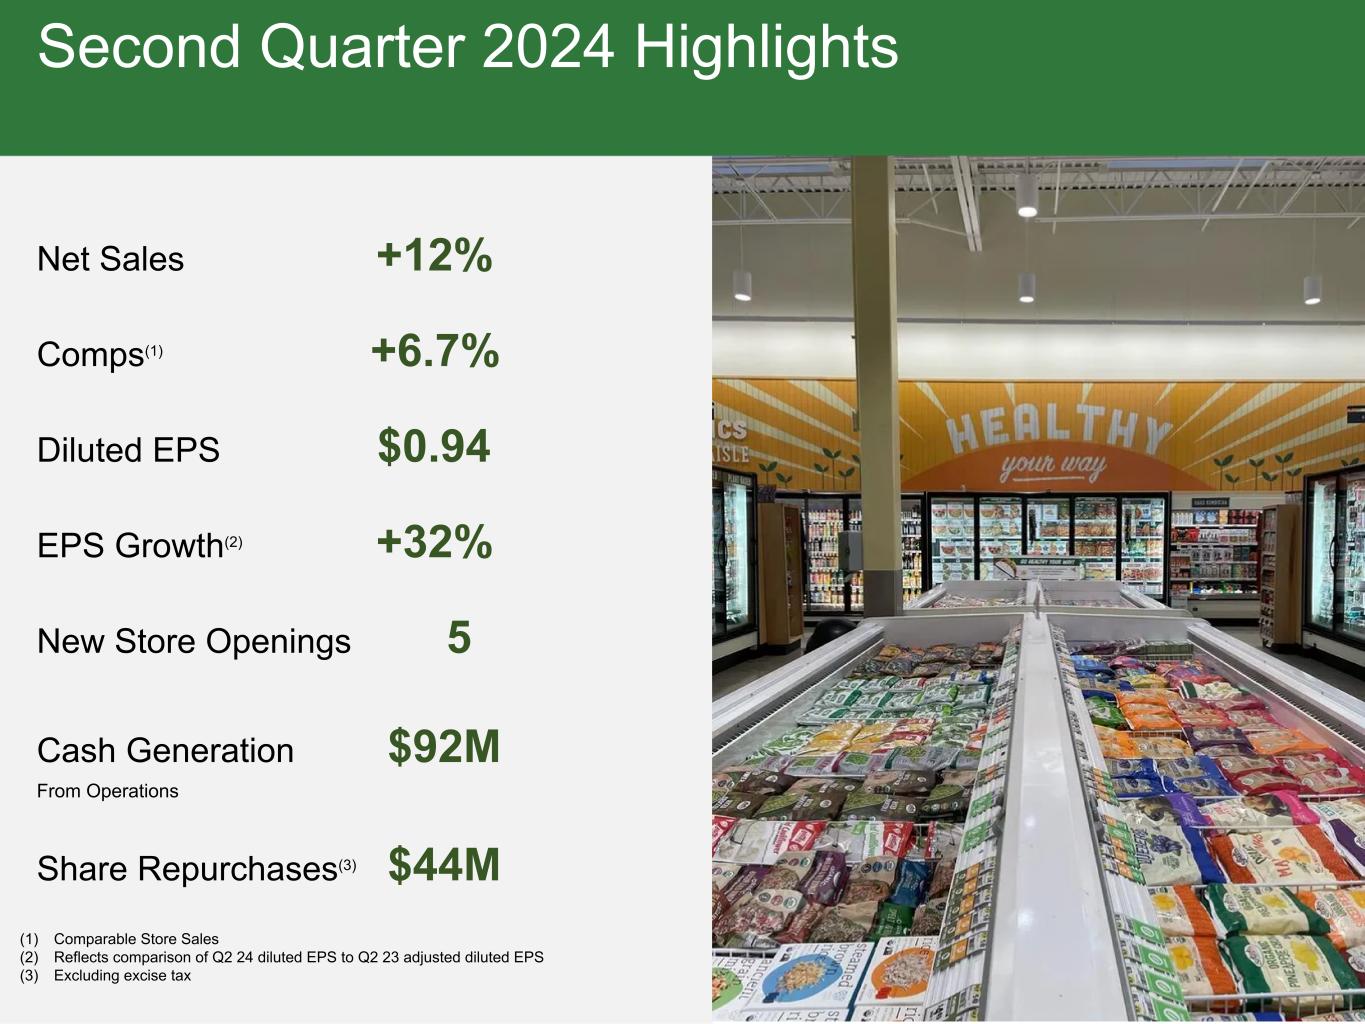
Second Quarter 2024 Highlights Net Sales +12% Comps(1) +6.7% Diluted EPS $0.94 EPS Growth(2) +32% New Store Openings 5 Cash Generation $92M From Operations Share Repurchases(3) $44M (1) Comparable Store Sales (2) Reflects comparison of Q2 24 diluted EPS to Q2 23 adjusted diluted EPS (3) Excluding excise tax 3

YTD 2024 Highlights Net Sales +10% New Store Openings 12 Cash Generation YTD $311M From Operations Share Repurchases(1) $104M (1) Excluding excise tax 4

5 Second Quarter Sales Drivers • Healthy balance of traffic vs ticket, and e-commerce vs brick & mortar • Strong performance across all categories • Foraging Team driving innovative and trending products, in both branded and Sprouts Brand • Enhanced store experience from themed merch events, better in-stocks and great customer service • Strong produce season
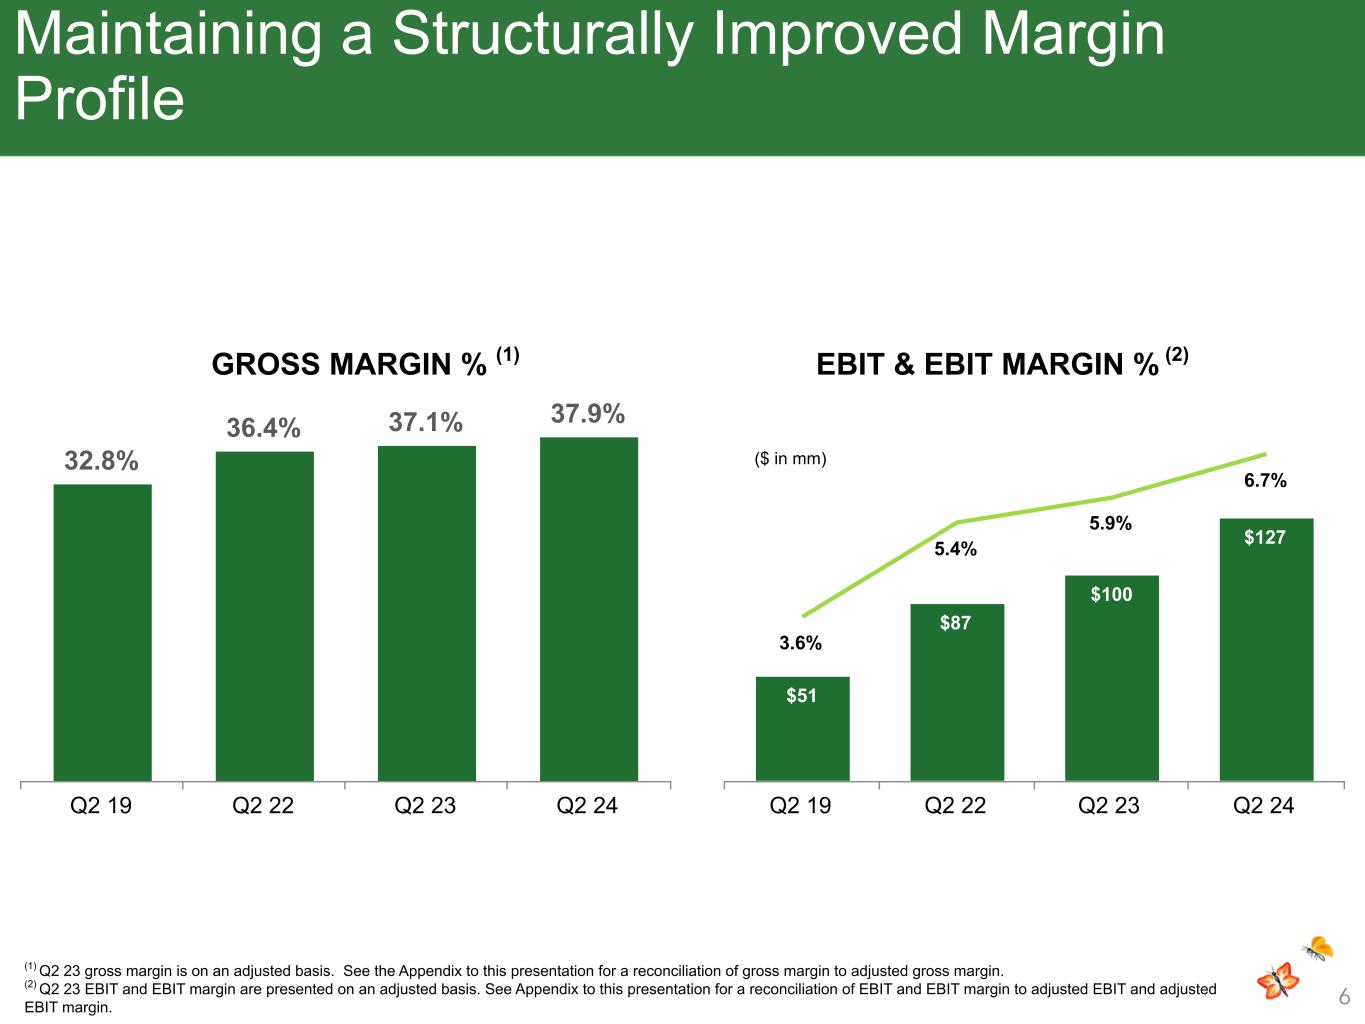
6 Maintaining a Structurally Improved Margin Profile (1) Q2 23 gross margin is on an adjusted basis. See the Appendix to this presentation for a reconciliation of gross margin to adjusted gross margin. (2) Q2 23 EBIT and EBIT margin are presented on an adjusted basis. See Appendix to this presentation for a reconciliation of EBIT and EBIT margin to adjusted EBIT and adjusted EBIT margin. EBIT & EBIT MARGIN % (2) 32.8% 36.4% 37.1% 37.9% Q2 19 Q2 22 Q2 23 Q2 24 $51 $87 $100 $127 3.6% 5.4% 5.9% 6.7% Q2 19 Q2 22 Q2 23 Q2 24 ($ in mm) GROSS MARGIN % (1)
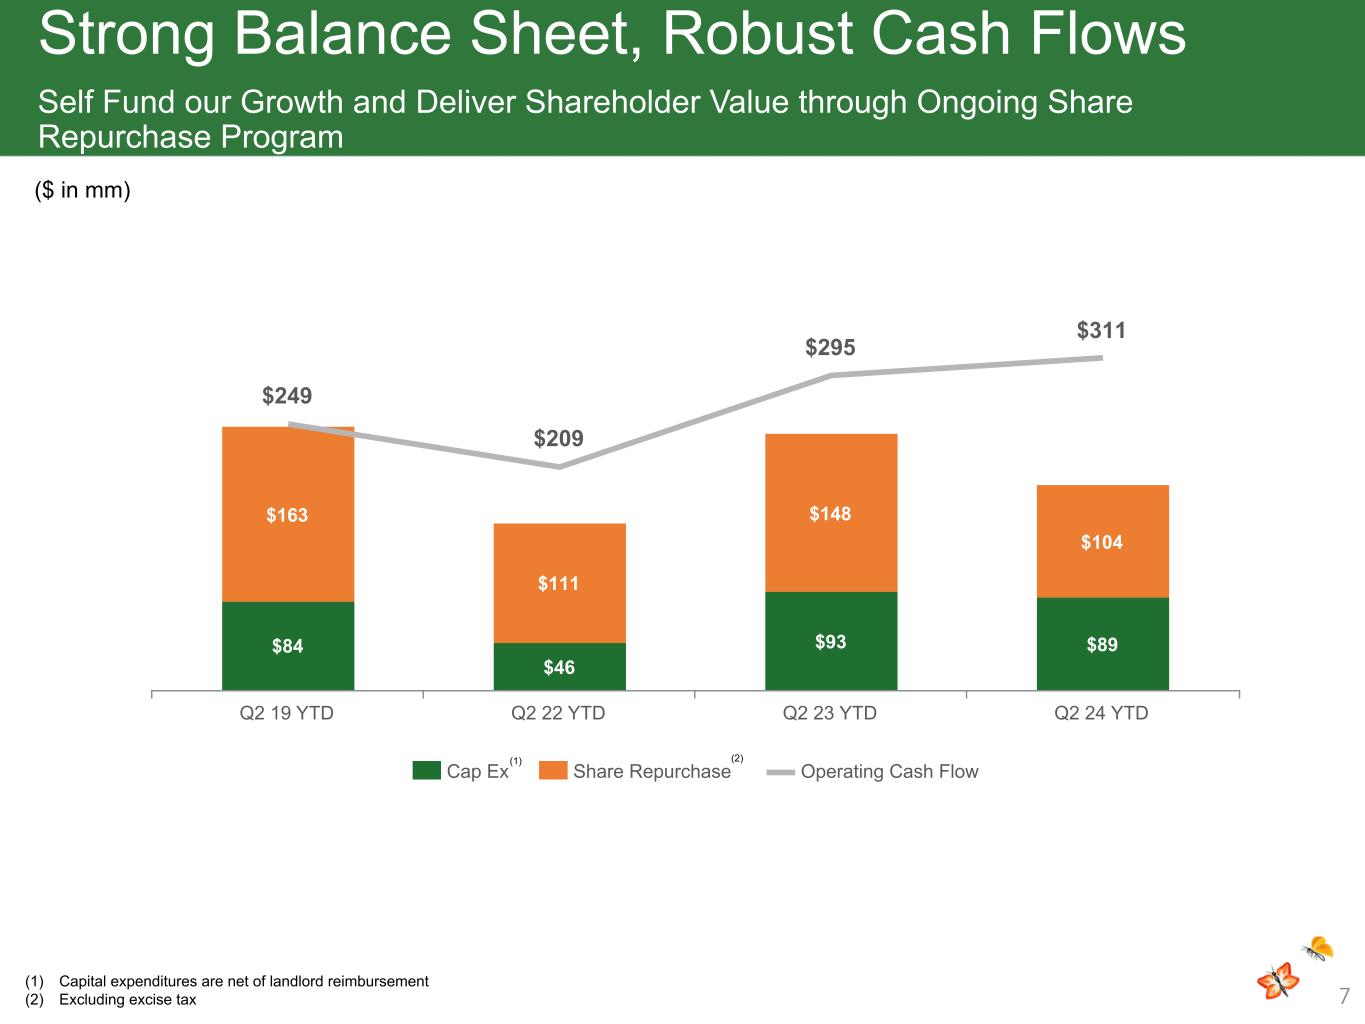
7 Strong Balance Sheet, Robust Cash Flows Self Fund our Growth and Deliver Shareholder Value through Ongoing Share Repurchase Program ($ in mm) (1) Capital expenditures are net of landlord reimbursement (2) Excluding excise tax $84 $46 $93 $89 $163 $111 $148 $104 $249 $209 $295 $311 Cap Ex Share Repurchase Operating Cash Flow Q2 19 YTD Q2 22 YTD Q2 23 YTD Q2 24 YTD (1) (2)
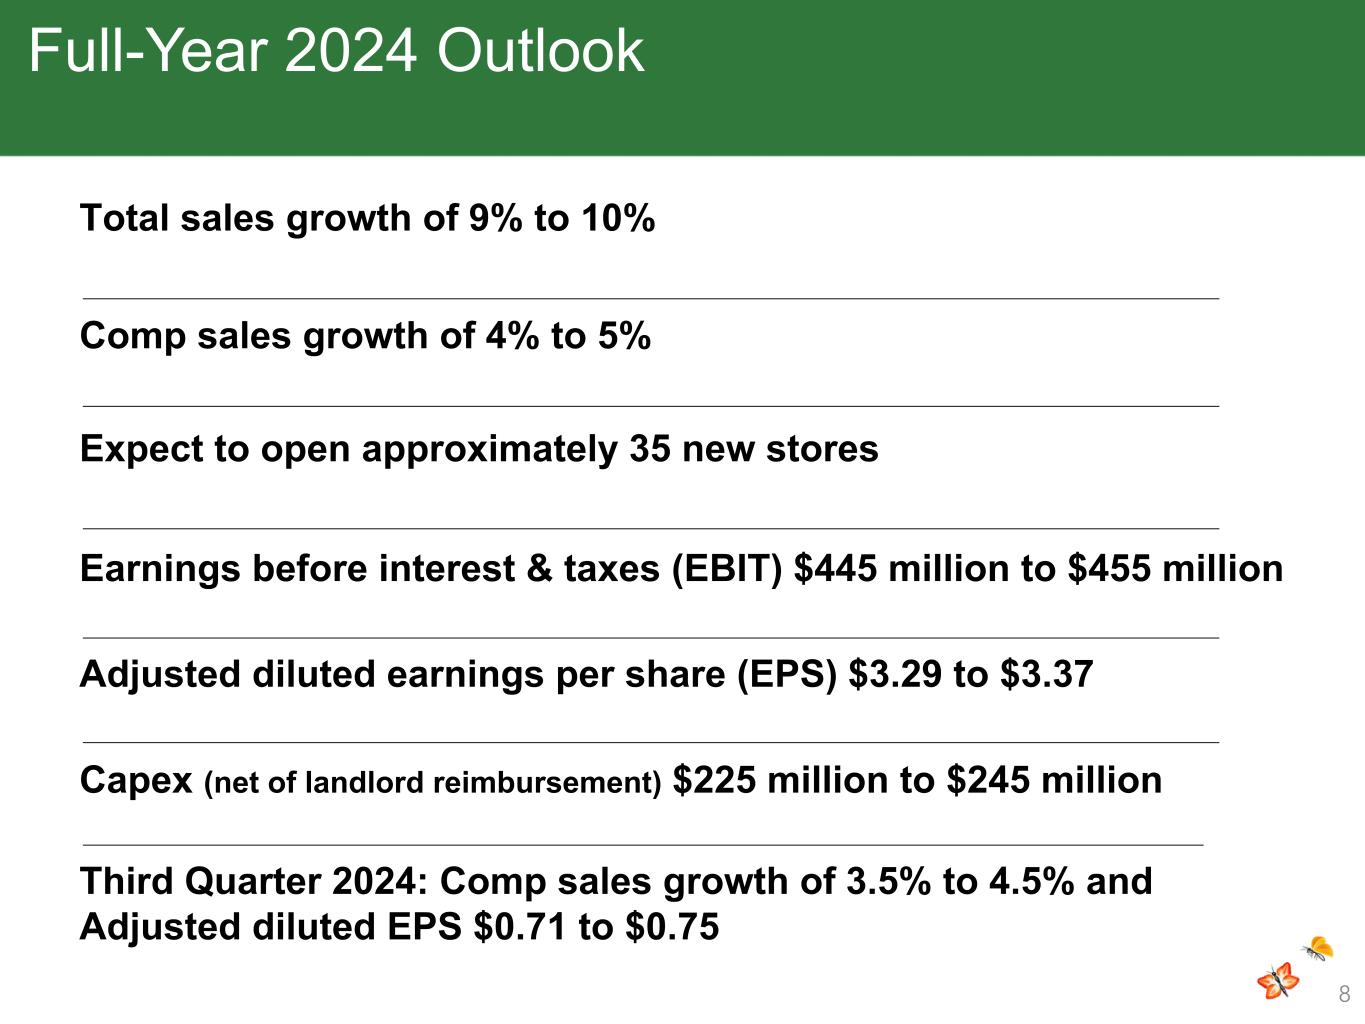
8 Full-Year 2024 Outlook Expect to open approximately 35 new stores Capex (net of landlord reimbursement) $225 million to $245 million Third Quarter 2024: Comp sales growth of 3.5% to 4.5% and Adjusted diluted EPS $0.71 to $0.75 Total sales growth of 9% to 10% Comp sales growth of 4% to 5% Earnings before interest & taxes (EBIT) $445 million to $455 million Adjusted diluted earnings per share (EPS) $3.29 to $3.37

9 Appendix
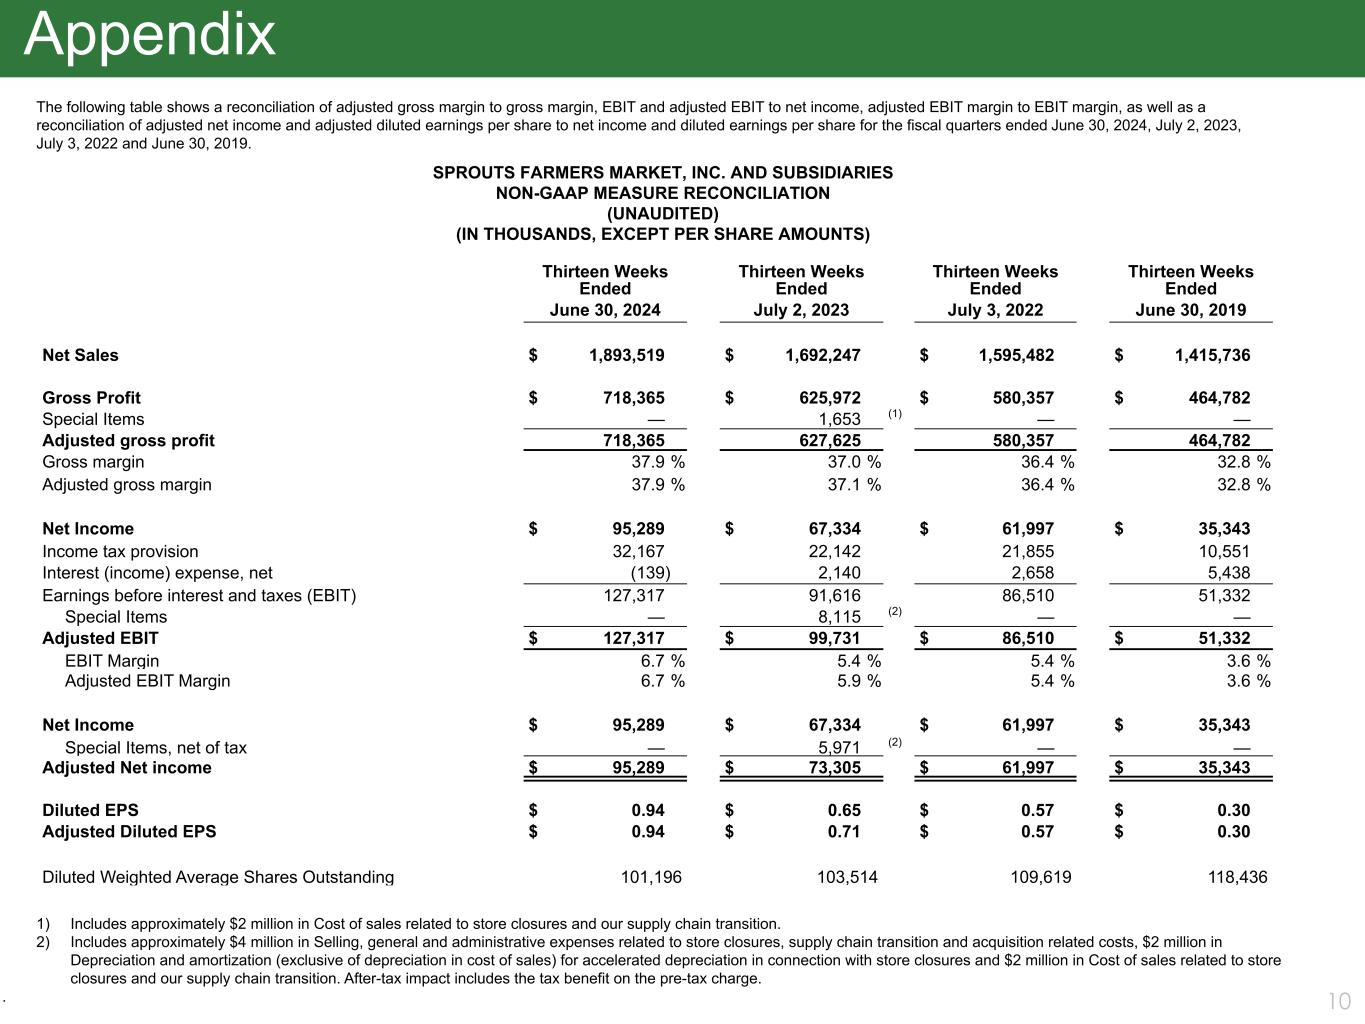
10 SPROUTS FARMERS MARKET, INC. AND SUBSIDIARIES NON-GAAP MEASURE RECONCILIATION (UNAUDITED) (IN THOUSANDS, EXCEPT PER SHARE AMOUNTS) Appendix 1) Includes approximately $2 million in Cost of sales related to store closures and our supply chain transition. 2) Includes approximately $4 million in Selling, general and administrative expenses related to store closures, supply chain transition and acquisition related costs, $2 million in Depreciation and amortization (exclusive of depreciation in cost of sales) for accelerated depreciation in connection with store closures and $2 million in Cost of sales related to store closures and our supply chain transition. After-tax impact includes the tax benefit on the pre-tax charge. . The following table shows a reconciliation of adjusted gross margin to gross margin, EBIT and adjusted EBIT to net income, adjusted EBIT margin to EBIT margin, as well as a reconciliation of adjusted net income and adjusted diluted earnings per share to net income and diluted earnings per share for the fiscal quarters ended June 30, 2024, July 2, 2023, July 3, 2022 and June 30, 2019. Thirteen Weeks Ended Thirteen Weeks Ended Thirteen Weeks Ended Thirteen Weeks Ended June 30, 2024 July 2, 2023 July 3, 2022 June 30, 2019 Net Sales $ 1,893,519 $ 1,692,247 $ 1,595,482 $ 1,415,736 Gross Profit $ 718,365 $ 625,972 $ 580,357 $ 464,782 Special Items — 1,653 (1) — — Adjusted gross profit 718,365 627,625 580,357 464,782 Gross margin 37.9 % 37.0 % 36.4 % 32.8 % Adjusted gross margin 37.9 % 37.1 % 36.4 % 32.8 % Net Income $ 95,289 $ 67,334 $ 61,997 $ 35,343 Income tax provision 32,167 22,142 21,855 10,551 Interest (income) expense, net (139) 2,140 2,658 5,438 Earnings before interest and taxes (EBIT) 127,317 91,616 86,510 51,332 Special Items — 8,115 (2) — — Adjusted EBIT $ 127,317 $ 99,731 $ 86,510 $ 51,332 EBIT Margin 6.7 % 5.4 % 5.4 % 3.6 % Adjusted EBIT Margin 6.7 % 5.9 % 5.4 % 3.6 % Net Income $ 95,289 $ 67,334 $ 61,997 $ 35,343 Special Items, net of tax — 5,971 (2) — — Adjusted Net income $ 95,289 $ 73,305 $ 61,997 $ 35,343 Diluted EPS $ 0.94 $ 0.65 $ 0.57 $ 0.30 Adjusted Diluted EPS $ 0.94 $ 0.71 $ 0.57 $ 0.30 Diluted Weighted Average Shares Outstanding 101,196 103,514 109,619 118,436


