
Frank’s InternationalExhibitpage 99.1 Reporting Segments Change May 1, 2019 © 2019 Frank’s International. All rights reserved.
Frank’s International page 2 Corporate Information Disclaimer This presentation contains forward-looking statements within the meaning of Section 27A of the Securities Act of 1933 and Section 21E of the Securities Exchange Act of 1934, as amended. All statements, other than statements of historical facts, included in this presentation that address activities, events or developments that the Company expects, believes or anticipates will or may occur in the future are Mike Kearney forward-looking statements. Without limiting the generality of the foregoing, forward-looking statements contained in this presentation specifically include statements, estimates and projections regarding the Company’s future business strategy and prospects for growth, cash flows and liquidity, financial strategy, budget, projections and operating results, the amount, nature and timing of capital Chairman, President and Chief expenditures, the availability and terms of capital, the level of activity in the oil and gas industry, volatility of oil and gas prices, which have Executive Officer declined significantly in recent periods, unique risks associated with offshore operations, political, economic and regulatory uncertainties in international operations, the ability to develop new technologies and products, the ability to protect intellectual property rights, the ability to employ and retain skilled and qualified workers, the level of competition in the Company’s industry and other guidance. These statements are based on certain assumptions made by the Company based on management’s experience, expectations and perception of Kyle McClure historical trends, current conditions, anticipated future developments and other factors believed to be appropriate. Forward-looking statements are not guarantees of performance. Although the Company believes the expectations reflected in its forward-looking Senior Vice President and Chief statements are reasonable and are based on reasonable assumptions, no assurance can be given that these assumptions are accurate or that any of these expectations will be achieved (in full or at all) or will prove to have been correct. Moreover, such statements are subject Financial Officer to a number of assumptions, risks and uncertainties, many of which are beyond the control of the Company, which may cause actual results to differ materially from those implied or expressed by the forward-looking statements. These include the factors discussed or referenced in the “Risk Factors” section of the Company’s most recently filed Annual Report on Form 10-K that has been filed with the U.S. Securities and Exchange Commission (the “SEC”) for the year ended December 31, 2018 and the Company’s Quarterly Report on Form 10- Erin Fazio Q for the quarter ended March 31, 2019 that will be filed with the SEC, and any subsequent filings filed with the SEC. Accordingly, you should not place undue reliance on any of the Company’s forward-looking statements. Any forward-looking statement speaks only as of Investor Relations the date on which such statement is made, and the Company undertakes no obligation to correct or update any forward-looking statement, whether as a result of new information, future events or otherwise, except as required by applicable law, and we caution you Ph: (713) 231-2515 not to rely on them unduly. Erin.Fazio@franksintl.com This presentation includes the non-GAAP financial measures of adjusted EBITDA and adjusted EBITDA margin, which may be used periodically by management when discussing the Company’s financial results with investors and analysts. Adjusted EBITDA and adjusted EBITDA margin are presented because management believes these metrics provide additional information relative to the performance of the Company’s business. These metrics are commonly employed by financial analysts and investors to evaluate the operating and financial performance of the Company from period to period and to compare it with the performance of other publicly traded companies within the U.S. Headquarters industry. You should not consider adjusted EBITDA and adjusted EBITDA margin in isolation or as a substitute for analysis of the Company’s results as reported under GAAP. Because adjusted EBITDA and adjusted EBITDA margin may be defined differently by other companies in Frank’s International N.V. the Company’s industry, the Company’s presentation of adjusted EBITDA and adjusted EBITDA margin may not be comparable to similarly titled measures of other companies, thereby diminishing their utility. For a reconciliation of each to the nearest comparable measure in 10260 Westheimer, Suite 700 accordance with GAAP, please see the Supplemental Financials in our earnings press release. Houston, TX 77042 www.franksinternational.com © 2019 Frank’s International. All rights reserved.

Frank’s International page ❖ Strategic Vision and Change ❖ Segment Overview ❖ Segment Comparison ❖ Expense Reclassifications ❖ Financials: Prior vs. Current Disclosure Frank’s International page 3 © 2019 Frank’s International. All rights reserved.

Frank’s International page 4 Strategic Vision Drives Change Completed global Structure designed Financial reporting system integration Align business to burden aligned with of the Blackhawk with industry segments with management acquisition driving peers for overhead costs to structure to drive standardization comparability and more clearly accountability across all benchmarking evaluate segments profitability The change in segments is supported by the key pillars of the Frank’s International strategic plan © 2019 Frank’s International. All rights reserved.
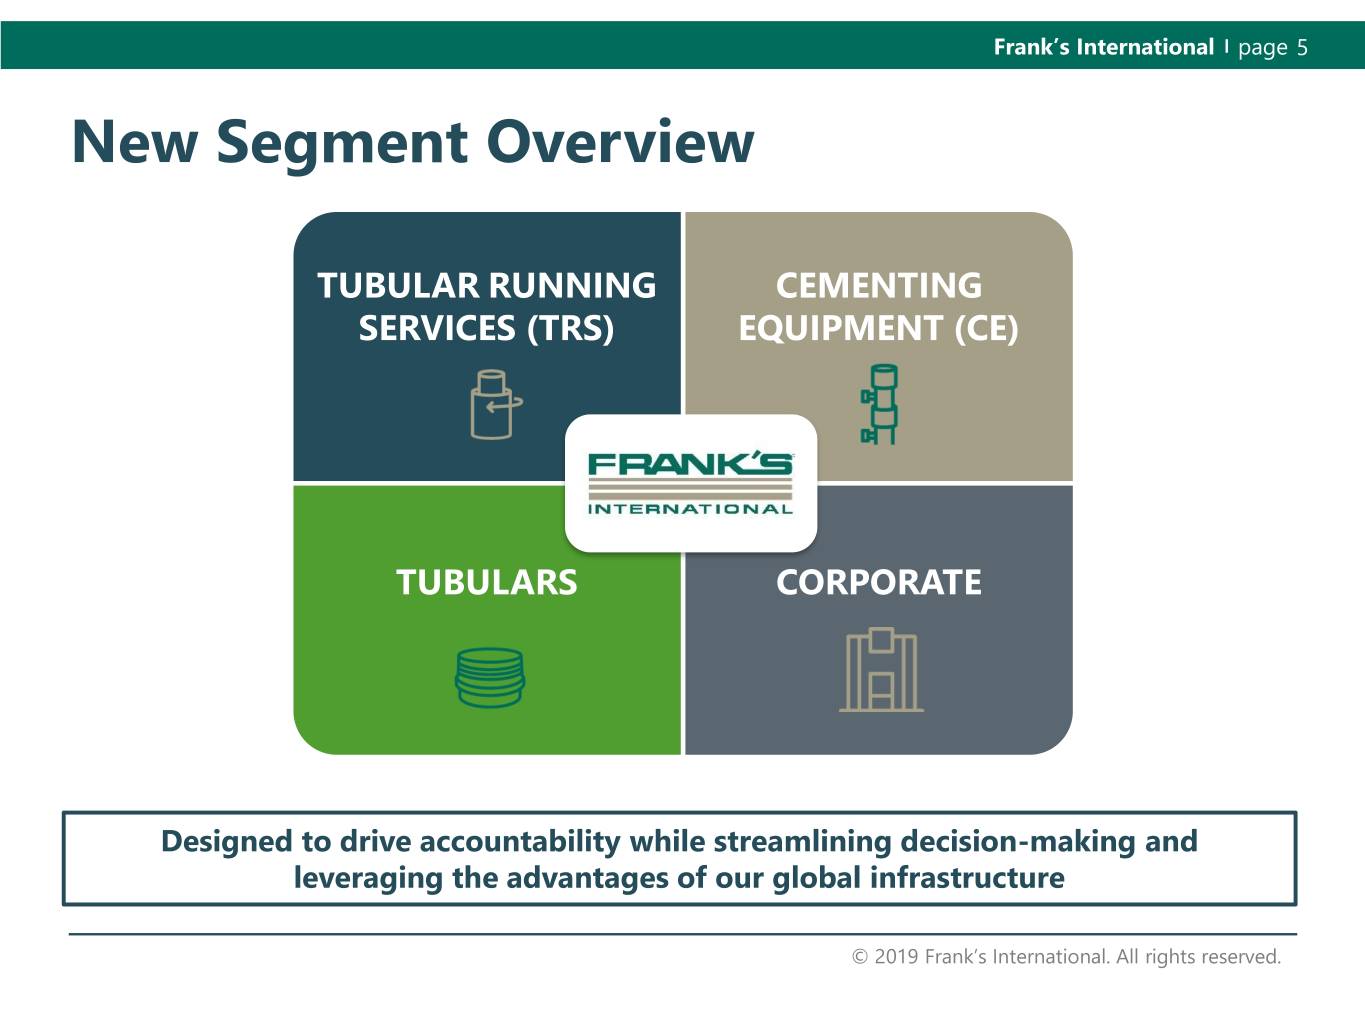
Frank’s International page 5 New Segment Overview TUBULAR RUNNING CEMENTING SERVICES (TRS) EQUIPMENT (CE) Tubulars Cementing Equipment ) (“CE”) TUBULARS CORPORATE Designed to drive accountability while streamlining decision-making and leveraging the advantages of our global infrastructure © 2019 Frank’s International. All rights reserved.
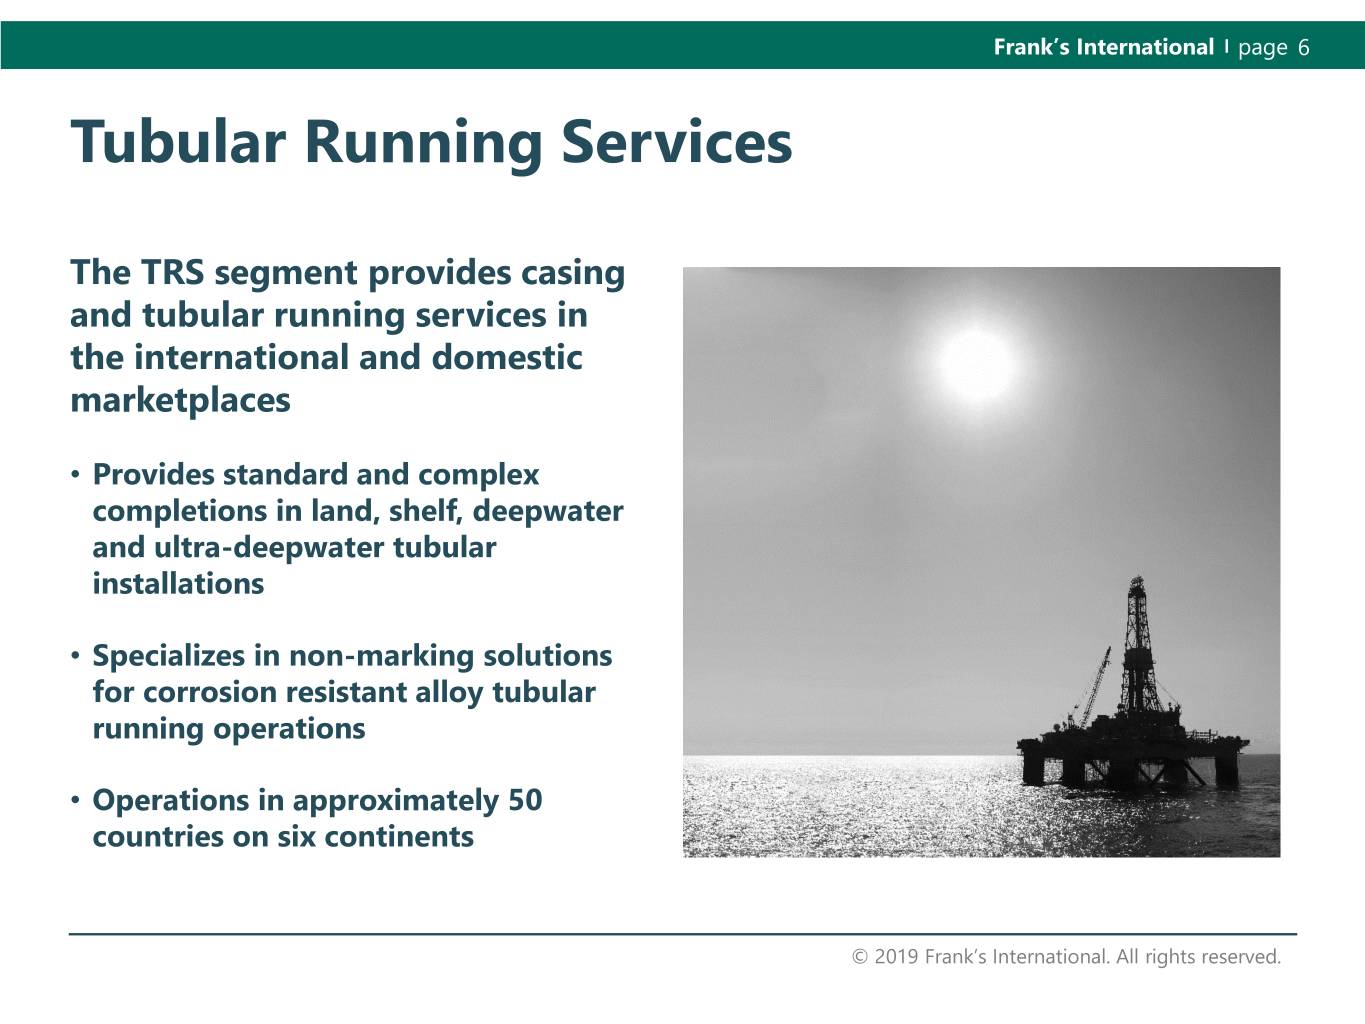
Frank’s International page 6 Tubular Running Services The TRS segment provides casing and tubular running services in the international and domestic marketplaces • Provides standard and complex completions in land, shelf, deepwater and ultra-deepwater tubular installations • Specializes in non-marking solutions for corrosion resistant alloy tubular running operations • Operations in approximately 50 countries on six continents © 2019 Frank’s International. All rights reserved.
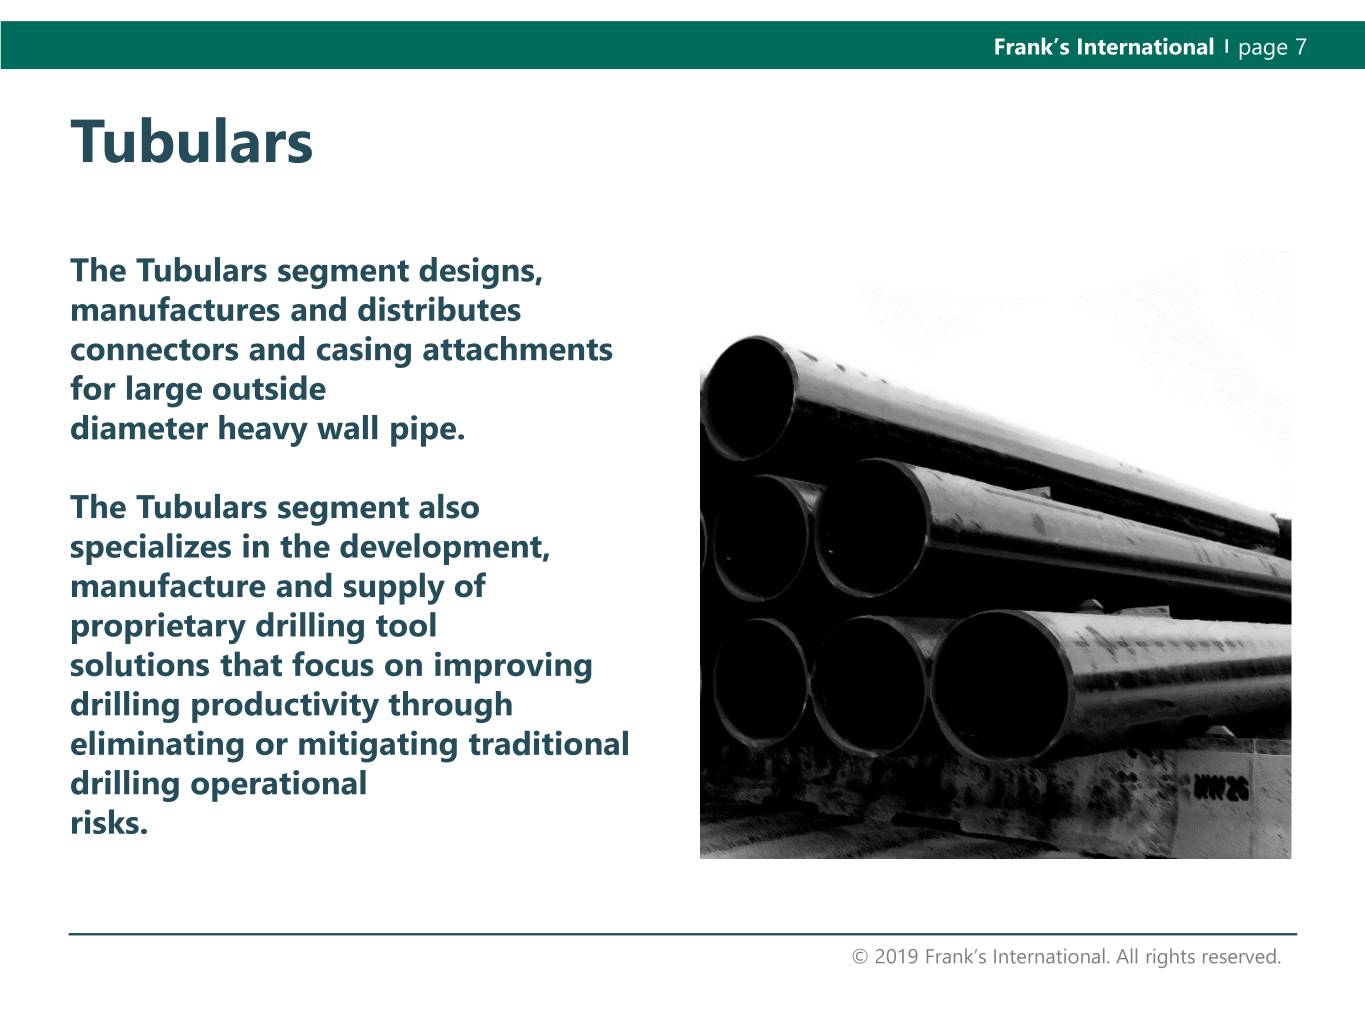
Frank’s International page 7 Tubulars The Tubulars segment designs, manufactures and distributes connectors and casing attachments for large outside diameter heavy wall pipe. The Tubulars segment also specializes in the development, manufacture and supply of proprietary drilling tool solutions that focus on improving drilling productivity through eliminating or mitigating traditional drilling operational risks. © 2019 Frank’s International. All rights reserved.

Frank’s International page 8 Cementing Equipment The CE segment provides specialized equipment, services and products utilized in the construction, completion or abandonment of the wellbore in both onshore and offshore environments. These offerings improve operational efficiencies and limit non-productive time if unscheduled events are encountered at the wellsite. © 2019 Frank’s International. All rights reserved.
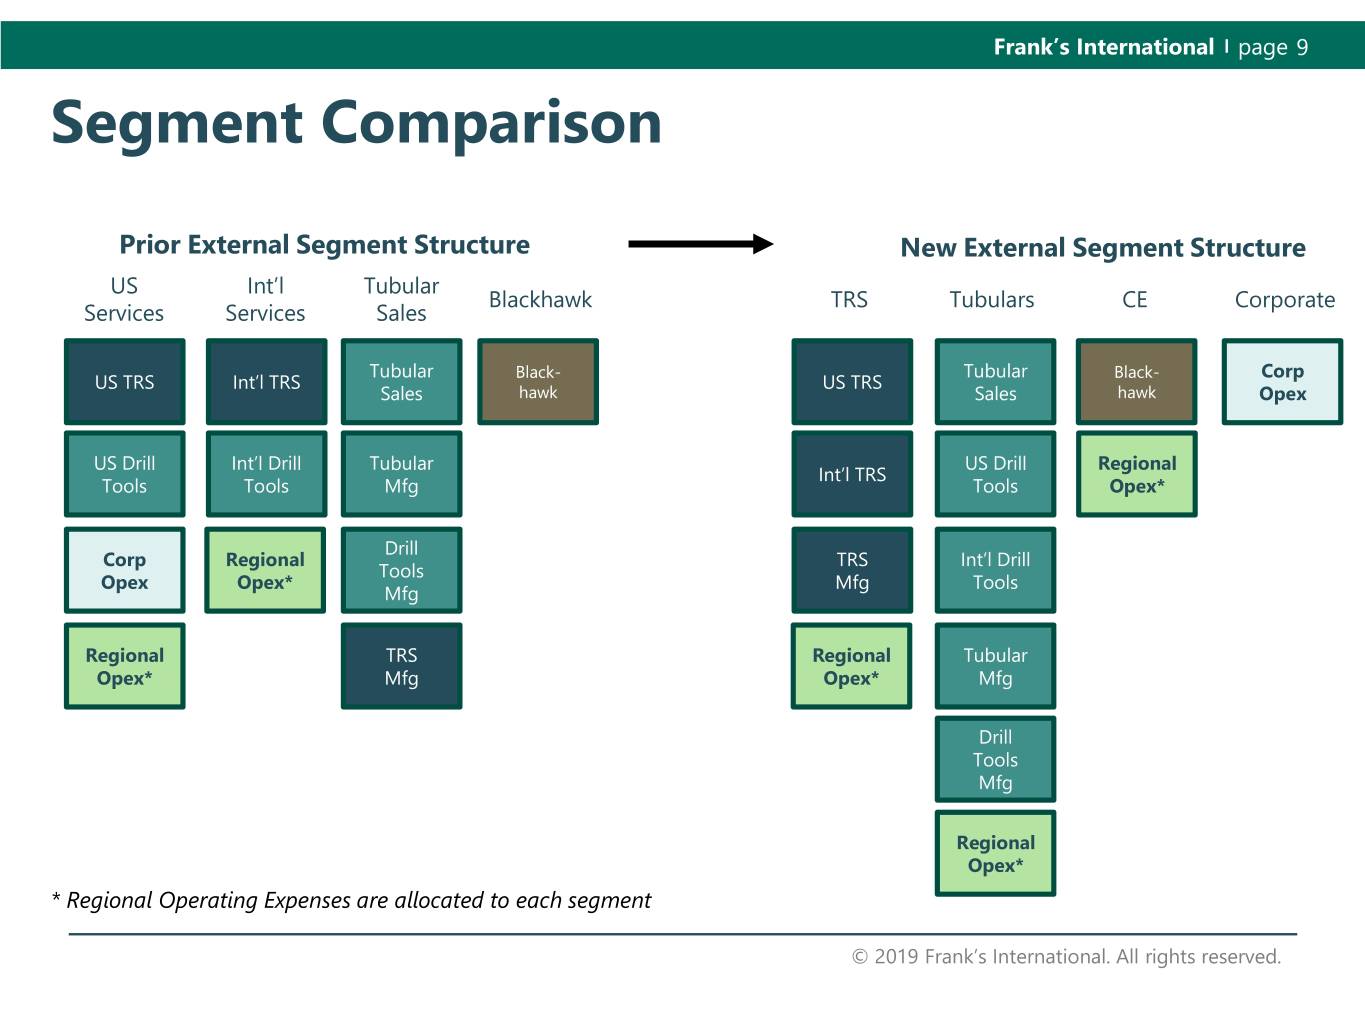
Frank’s International page 9 Segment Comparison Prior External Segment Structure New External Segment Structure US Int’l Tubular Blackhawk TRS Tubulars CE Corporate Services Services Sales Tubular Black- Tubular Black- Corp US TRS Int’l TRS US TRS Sales hawk Sales hawk Opex US Drill Int’l Drill Tubular US Drill Regional Int’l TRS Tools Tools Mfg Tools Opex* Drill Corp Regional TRS Int’l Drill Tools Opex Opex* Mfg Tools Mfg Regional TRS Regional Tubular Opex* Mfg Opex* Mfg Drill Tools Mfg Regional Opex* * Regional Operating Expenses are allocated to each segment © 2019 Frank’s International. All rights reserved.
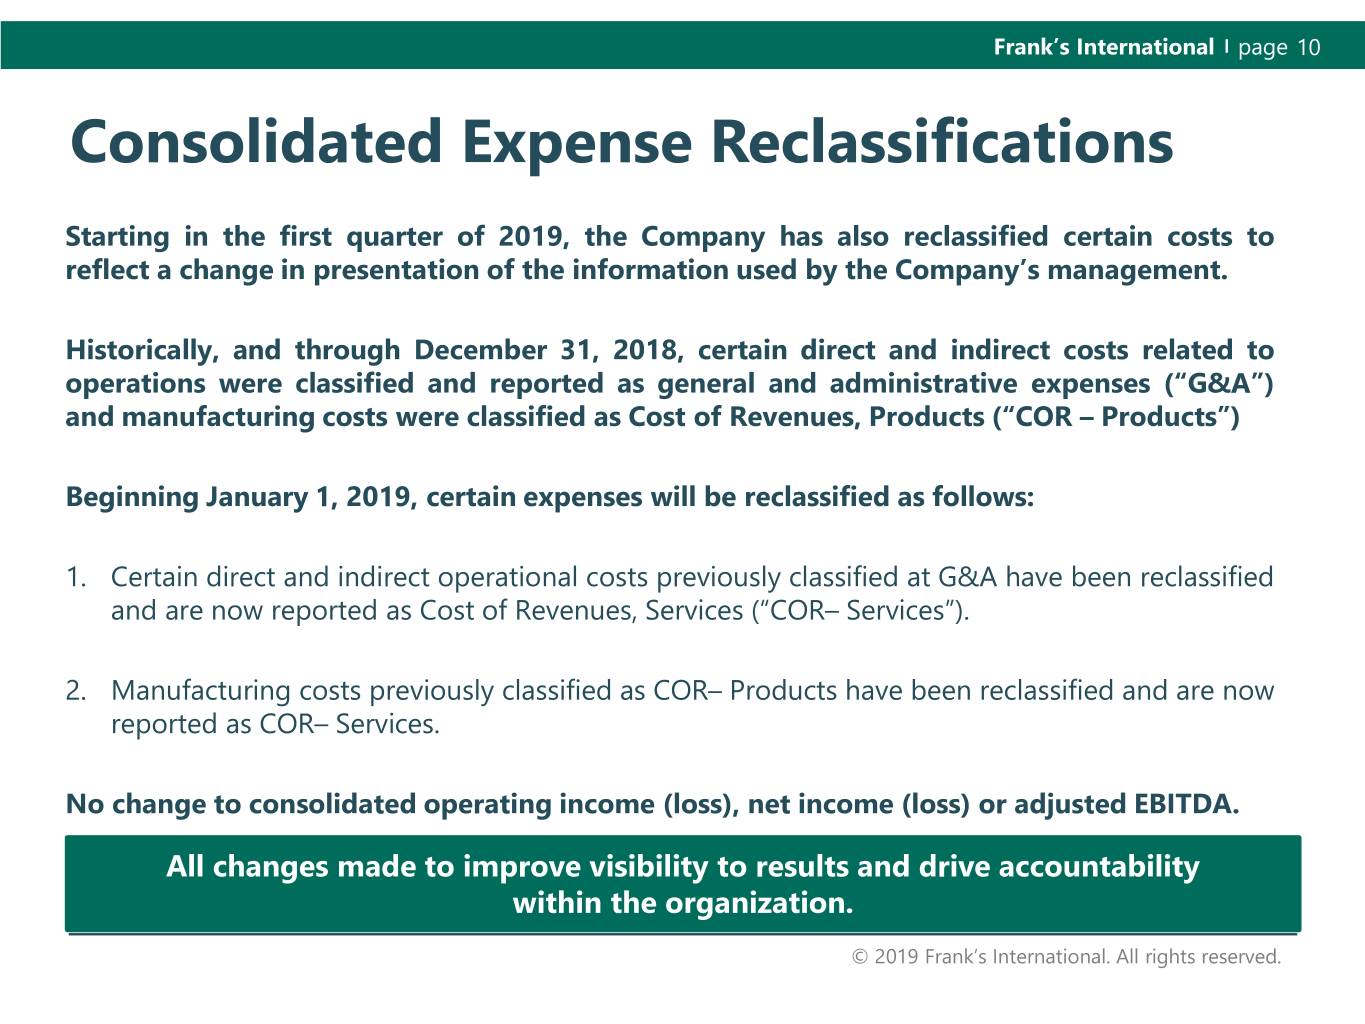
Frank’s International page 10 Consolidated Expense Reclassifications Starting in the first quarter of 2019, the Company has also reclassified certain costs to reflect a change in presentation of the information used by the Company’s management. Historically, and through December 31, 2018, certain direct and indirect costs related to operations were classified and reported as general and administrative expenses (“G&A”) and manufacturing costs were classified as Cost of Revenues, Products (“COR – Products”) Beginning January 1, 2019, certain expenses will be reclassified as follows: 1. Certain direct and indirect operational costs previously classified at G&A have been reclassified and are now reported as Cost of Revenues, Services (“COR– Services”). 2. Manufacturing costs previously classified as COR– Products have been reclassified and are now reported as COR– Services. No change to consolidated operating income (loss), net income (loss) or adjusted EBITDA. All changes made to improve visibility to results and drive accountability within the organization. © 2019 Frank’s International. All rights reserved.
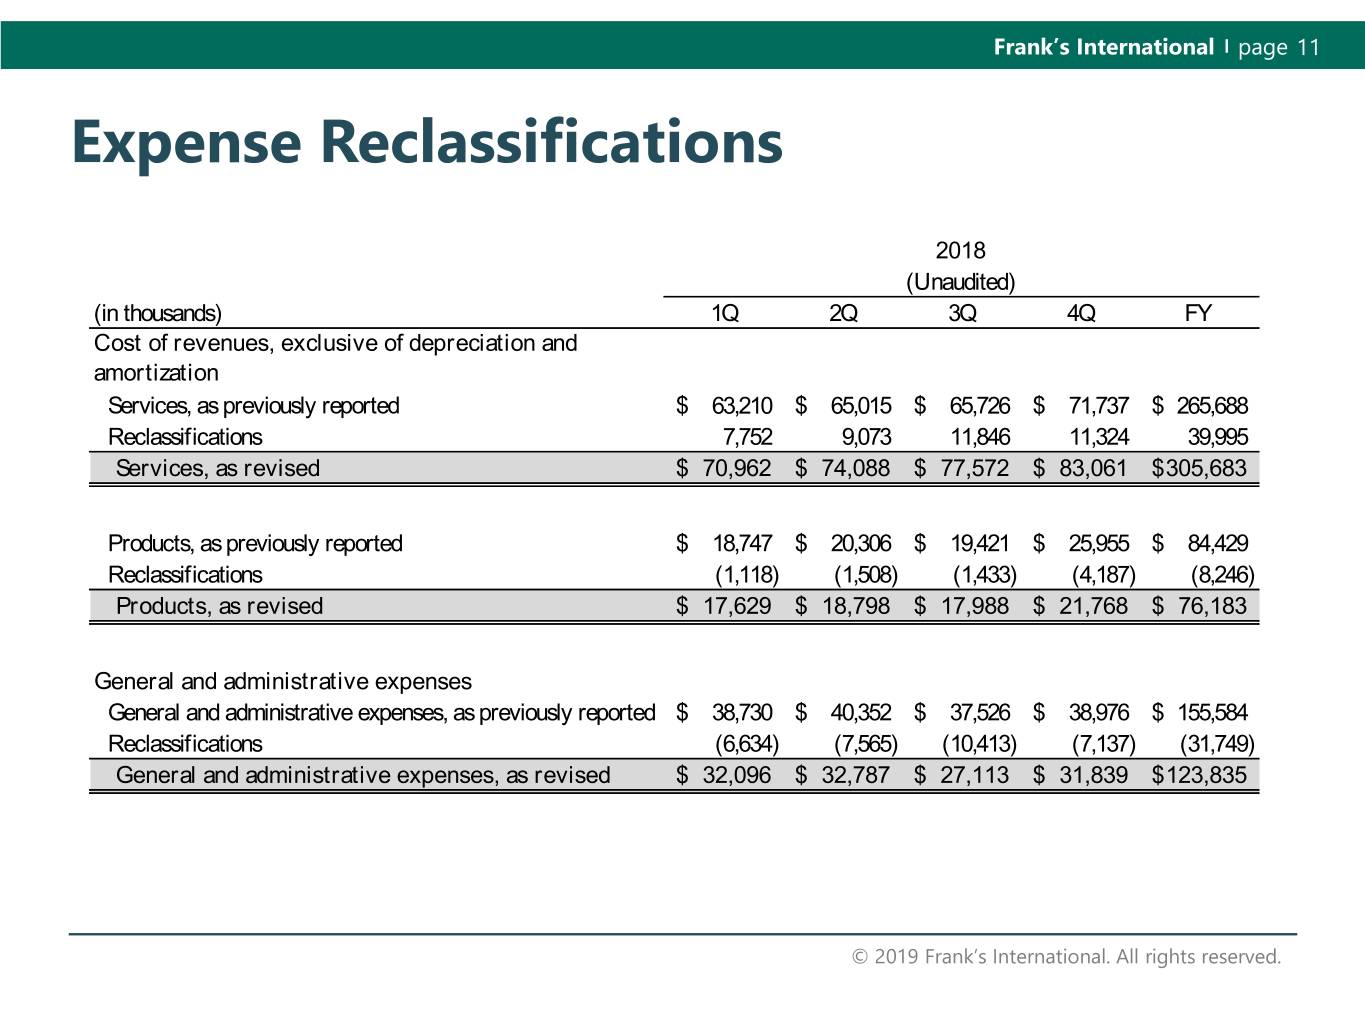
Frank’s International page 11 Expense Reclassifications 2018 (Unaudited) (in thousands) 1Q 2Q 3Q 4Q FY Cost of revenues, exclusive of depreciation and amortization Services, as previously reported $ 63,210 $ 65,015 $ 65,726 $ 71,737 $ 265,688 Reclassifications 7,752 9,073 11,846 11,324 39,995 Services, as revised $ 70,962 $ 74,088 $ 77,572 $ 83,061 $ 305,683 Products, as previously reported $ 18,747 $ 20,306 $ 19,421 $ 25,955 $ 84,429 Reclassifications (1,118) (1,508) (1,433) (4,187) (8,246) Products, as revised $ 17,629 $ 18,798 $ 17,988 $ 21,768 $ 76,183 General and administrative expenses General and administrative expenses, as previously reported $ 38,730 $ 40,352 $ 37,526 $ 38,976 $ 155,584 Reclassifications (6,634) (7,565) (10,413) (7,137) (31,749) General and administrative expenses, as revised $ 32,096 $ 32,787 $ 27,113 $ 31,839 $ 123,835 © 2019 Frank’s International. All rights reserved.
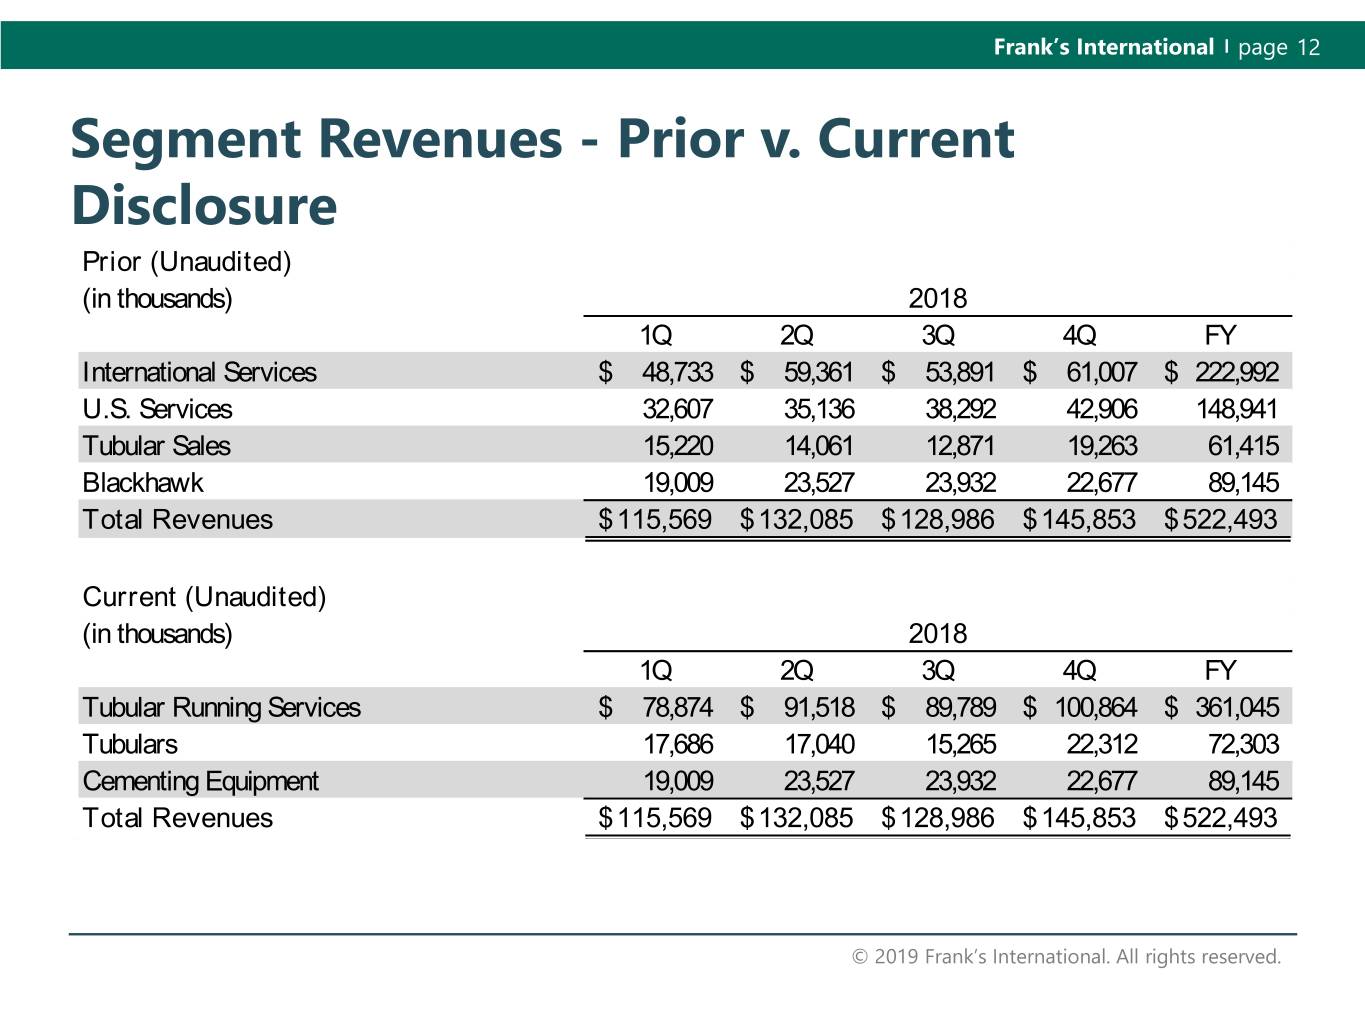
Frank’s International page 12 Segment Revenues - Prior v. Current Disclosure Prior (Unaudited) (in thousands) 2018 1Q 2Q 3Q 4Q FY International Services $ 48,733 $ 59,361 $ 53,891 $ 61,007 $ 222,992 U.S. Services 32,607 35,136 38,292 42,906 148,941 Tubular Sales 15,220 14,061 12,871 19,263 61,415 Blackhawk 19,009 23,527 23,932 22,677 89,145 Total Revenues $ 115,569 $ 132,085 $ 128,986 $ 145,853 $ 522,493 Current (Unaudited) (in thousands) 2018 1Q 2Q 3Q 4Q FY Tubular Running Services $ 78,874 $ 91,518 $ 89,789 $ 100,864 $ 361,045 Tubulars 17,686 17,040 15,265 22,312 72,303 Cementing Equipment 19,009 23,527 23,932 22,677 89,145 Total Revenues $ 115,569 $ 132,085 $ 128,986 $ 145,853 $ 522,493 © 2019 Frank’s International. All rights reserved.
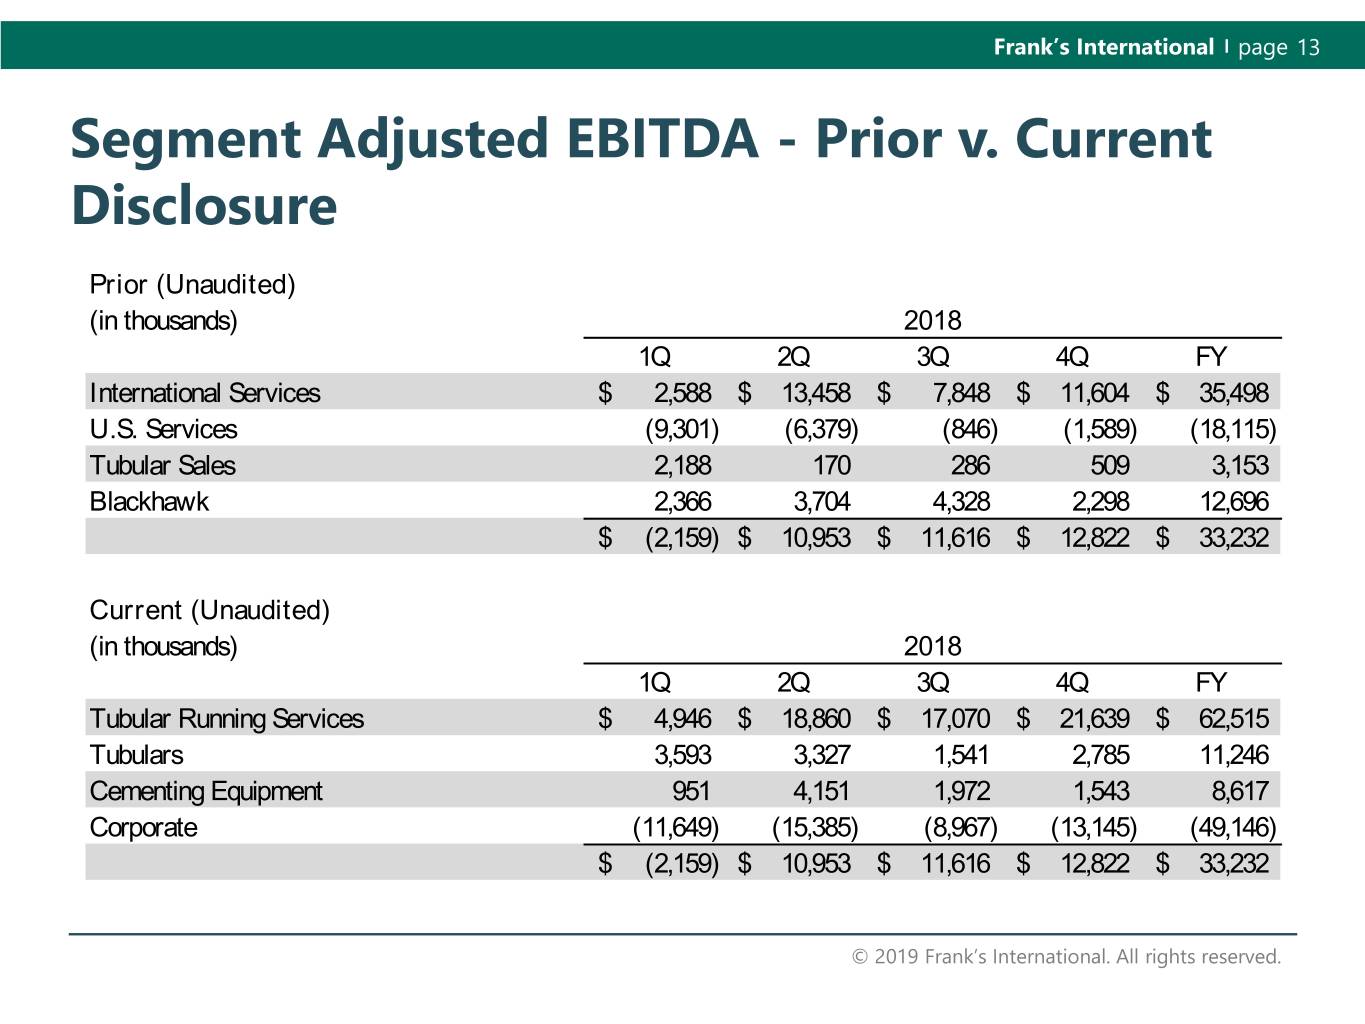
Frank’s International page 13 Segment Adjusted EBITDA - Prior v. Current Disclosure Prior (Unaudited) (in thousands) 2018 1Q 2Q 3Q 4Q FY International Services $ 2,588 $ 13,458 $ 7,848 $ 11,604 $ 35,498 U.S. Services (9,301) (6,379) (846) (1,589) (18,115) Tubular Sales 2,188 170 286 509 3,153 Blackhawk 2,366 3,704 4,328 2,298 12,696 $ (2,159) $ 10,953 $ 11,616 $ 12,822 $ 33,232 Current (Unaudited) (in thousands) 2018 1Q 2Q 3Q 4Q FY Tubular Running Services $ 4,946 $ 18,860 $ 17,070 $ 21,639 $ 62,515 Tubulars 3,593 3,327 1,541 2,785 11,246 Cementing Equipment 951 4,151 1,972 1,543 8,617 Corporate (11,649) (15,385) (8,967) (13,145) (49,146) $ (2,159) $ 10,953 $ 11,616 $ 12,822 $ 33,232 © 2019 Frank’s International. All rights reserved.

Frank’s International page 14 (2) (1) (1) Market capitalization as of April 15, 2019 © 2019 Frank’s International. All rights reserved. (2) For reconciliation of all non U.S. GAAP numbers to U.S. GAAP numbers see tables in the appendix of this presentation

Frank’s International page Appendix Frank’s International page 15 © 2019 Frank’s International. All rights reserved.
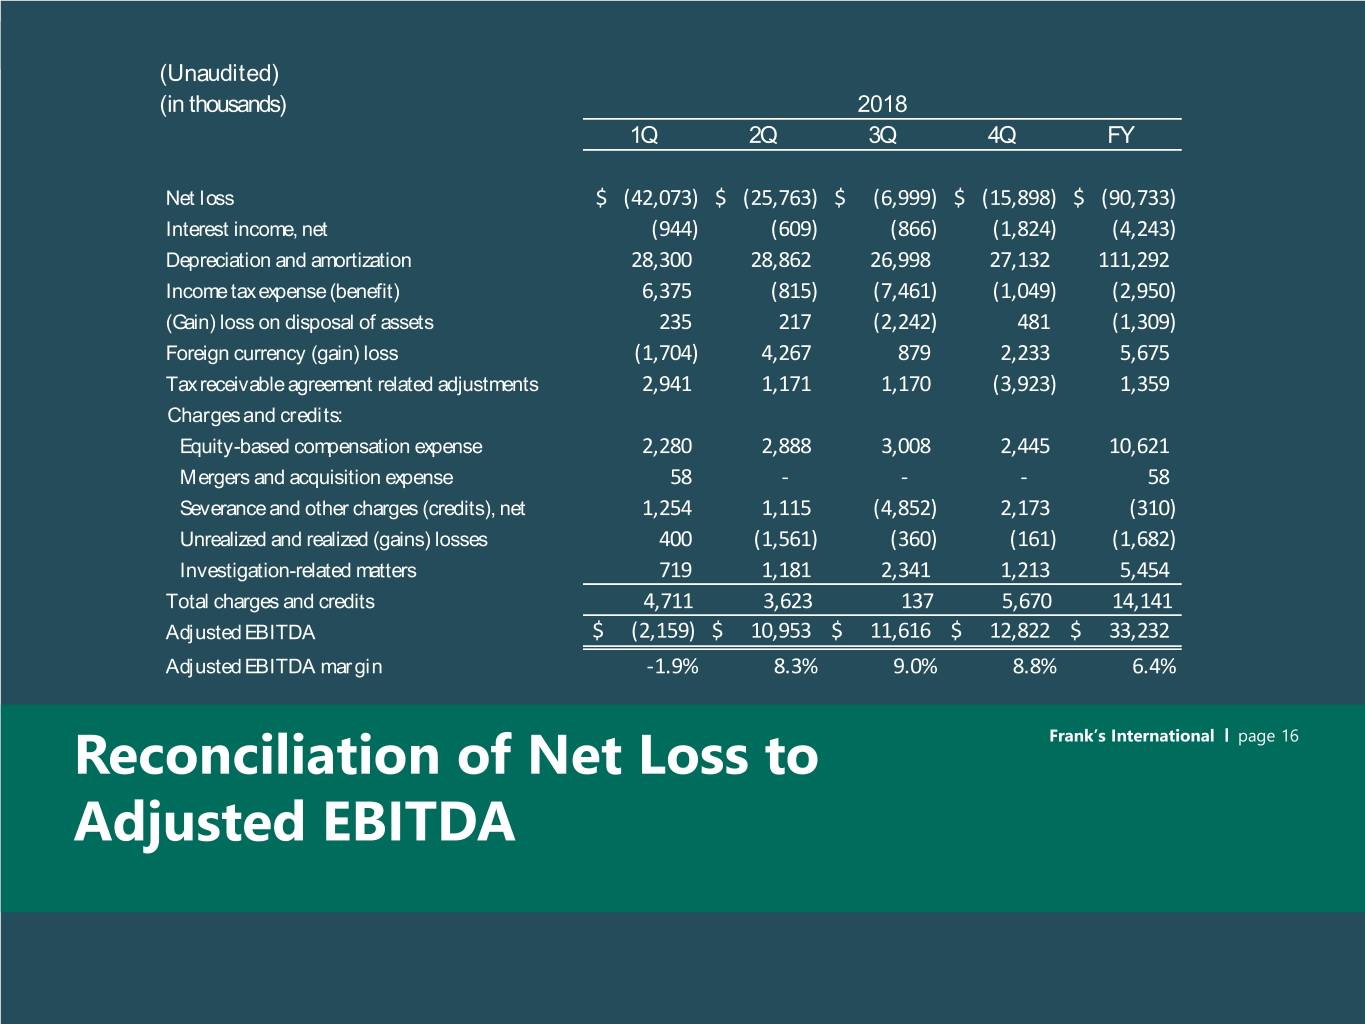
Frank’s International page (Unaudited) (in thousands) 2018 1Q 2Q 3Q 4Q FY Net loss $ (42,073) $ (25,763) $ (6,999) $ (15,898) $ (90,733) Interest income, net (944) (609) (866) (1,824) (4,243) Depreciation and amortization 28,300 28,862 26,998 27,132 111,292 Income tax expense (benefit) 6,375 (815) (7,461) (1,049) (2,950) (Gain) loss on disposal of assets 235 217 (2,242) 481 (1,309) Foreign currency (gain) loss (1,704) 4,267 879 2,233 5,675 Tax receivable agreement related adjustments 2,941 1,171 1,170 (3,923) 1,359 Charges and credits: Equity-based compensation expense 2,280 2,888 3,008 2,445 10,621 Mergers and acquisition expense 58 - - - 58 Severance and other charges (credits), net 1,254 1,115 (4,852) 2,173 (310) Unrealized and realized (gains) losses 400 (1,561) (360) (161) (1,682) Investigation-related matters 719 1,181 2,341 1,213 5,454 Total charges and credits 4,711 3,623 137 5,670 14,141 Adjusted EBITDA $ (2,159) $ 10,953 $ 11,616 $ 12,822 $ 33,232 Adjusted EBITDA margin -1.9% 8.3% 9.0% 8.8% 6.4% Reconciliation of Net Loss to Frank’s International page 16 Adjusted EBITDA © 2019 Frank’s International. All rights reserved.

Frank’s International page 17 www.linkedin.com/company/franks/ www.facebook.com/franksinternational/ connect with us @franksintl © 2019 Frank’s International. All rights reserved.


