
Caesars Entertainment Resort Properties, LLC Presentation to Lenders April 27th, 2017 Privileged & Confidential 1 Exhibit 99.1
Legal disclaimer This presentation contains certain forward‐looking statements within the meaning of Section 27A of the Securities Act of 1933, as amended, and Section 21E of the Securities Exchange Act of 1934, as amended. These statements may be made directly in this presentation. Some of the forward‐looking statements can be identified by the use of forward‐looking words. Statements that are not strictly historical in nature, including the words “may,” “estimate,” “seek,” “propose,” “expect,” “plan,” “will,” “continue,” and similar words, or the negatives or other variations of those words and comparable terminology, are intended to identify forward‐looking statements. Certain statements regarding the following particularly are forward‐looking in nature: The expected benefits of the repricing transaction; Our business strategy; Future performance, developments, actions, new projects, market forecasts or projections and the outcome of contingencies; and Projected capital expenditures. All forward‐looking statements are based on our management’s current beliefs, assumptions and expectations of our future economic performance, taking into account the information currently available to it. These statements are not statements of historical fact. Forward‐looking statements are subject to a number of factors, risks, uncertainties and contingencies, some of which are not currently known to us, that may cause our actual results, performance or financial condition to be materially different from the expectations of future results, performance or financial position. Although such forward‐looking statements have been prepared in good faith and are based on assumptions believed by our management to be reasonable, there is no assurance or guarantee that the expected results will be achieved. Our actual results may differ materially from the results discussed in forward‐looking statements. We make no representations or warranties as to the accuracy of any such forward-looking statements and we disclaim any obligation to update any forward-looking statements except as required by law. In addition, our discussion will include references to non-GAAP financial measures, including but not limited to adjusted EBITDA, adjusted EBITDA margin, and free cash flow. Such non-GAAP measures should be considered only as supplemental to, and not as superior to, financial measures prepared in accordance with GAAP. They are used by management during the strategic review of performance. The results are not necessarily indicative of future performance or the results that would be achieved should the reorganization of Caesars Entertainment Operating Company, Inc., as currently contemplated, be successfully completed. See the Appendix to this presentation for a reconciliation of net income/loss to these non-GAAP measures. This presentation and all information provided or discussed in connection therewith are confidential and being provided to you for informational use solely in connection with your consideration of the financing transaction contemplated herein. Acceptance of these materials constitutes your agreement to hold the information contained herein in strict confidence in accordance with the confidentiality provisions agreed to by you in accepting the invitation to this meeting.
Rule 425 disclaimer (Important additional information) Pursuant to the Amended and Restated Agreement and Plan of Merger, dated as of July 9, 2016, between Caesars Entertainment Corporation (“CEC”) and Caesars Acquisition Company (“CAC”), as subsequently amended on February 20, 2017 (as amended, the “Merger Agreement”), among other things, CAC will merge with and into CEC, with CEC as the surviving company (the “Merger”). In connection with the Merger, on March 13, 2017, CEC and CAC filed with the Securities and Exchange Commission (the “SEC”) a registration statement on Form S-4 that includes a preliminary joint proxy statement/prospectus, as well as other relevant documents concerning the proposed transaction. The registration statement has not yet become effective. After the registration statement is declared effective by the SEC, a definitive joint proxy statement/prospectus will be mailed to stockholders of CEC and CAC. Stockholders are urged to read the registration statement and joint proxy statement/prospectus regarding the Merger and any other relevant documents filed with the SEC, as well as any amendments or supplements to those documents, because they will contain important information. You will be able to obtain a free copy of such joint proxy statement/prospectus, as well as other filings containing information about CEC and CAC, at the SEC’s website (www.sec.gov), from CEC Investor Relations (investor.caesars.com) or from CAC Investor Relations (investor.caesarsacquisitioncompany.com). The information in this communication is for informational purposes only and is neither an offer to purchase, nor a solicitation of an offer to sell, subscribe for or buy any securities or the solicitation of any vote or approval in any jurisdiction pursuant to or in connection with the proposed transactions or otherwise, nor shall there be any sale, issuance or transfer of securities in any jurisdiction in contravention of applicable law. No offer of securities shall be made except by means of a prospectus meeting the requirements of Section 10 of the Securities Act of 1933, as amended, and otherwise in accordance with applicable law. CEC, CAC and their respective directors, executive officers and certain other members of management and employees may be soliciting proxies from CEC and CAC stockholders in favor of the business combination transaction. Information regarding the persons who may, under the rules of the SEC, be considered participants in the solicitation of the CEC and CAC stockholders in connection with the proposed business combination transaction is set forth in the definitive proxy statement filed with the SEC on April 12, 2017 and Amendment No. 1 to the Annual Report on Form 10-K for CAC’s fiscal year ended December 31, 2016, filed on March 31, 2017, respectively. You can obtain free copies of these documents from CEC and CAC in the manner set forth above.
Use of Non-GAAP measures The following non-GAAP measures will be used in the presentation and discussed on the conference call which this presentation accompanies: Adjusted EBITDA, adjusted EBITDA margin, and free cash flow See the Appendix to this presentation for a reconciliation of net income/loss to these non-GAAP measures.
Caesars Entertainment Corporation Presenters Eric Hession Executive Vice President & Chief Financial Officer Jacqueline Beato Senior Vice President, Finance & Treasurer Joyce Thomas Vice President, Finance & Assistant Treasurer
1.Introduction
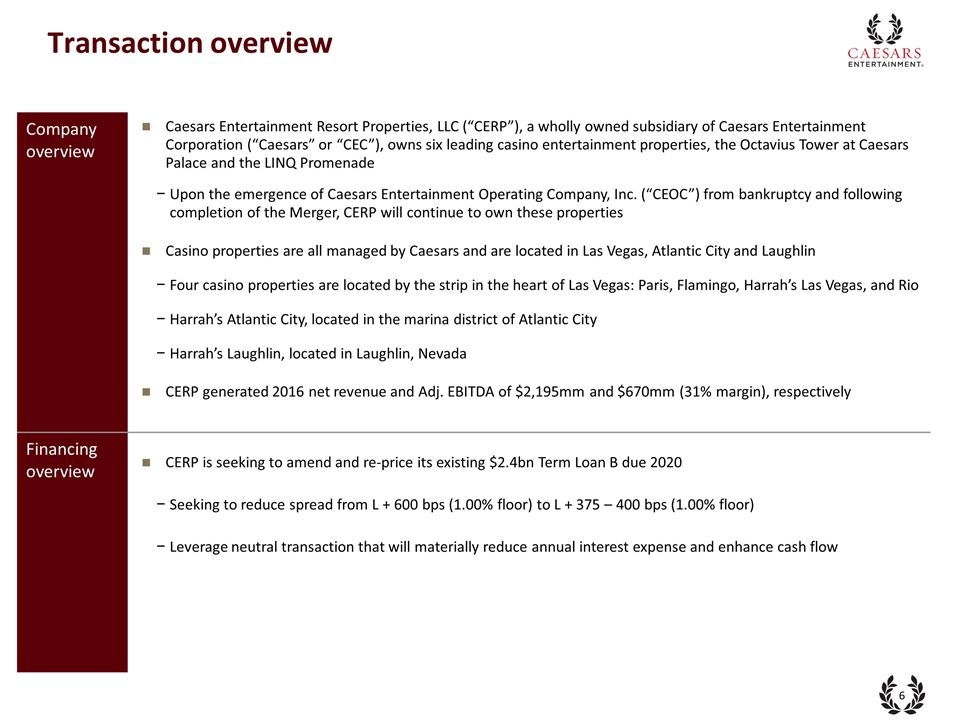
Company overview Financing overview Transaction overview CERP is seeking to amend and re-price its existing $2.4bn Term Loan B due 2020 Seeking to reduce spread from L + 600 bps (1.00% floor) to L + 375 – 400 bps (1.00% floor) Leverage neutral transaction that will materially reduce annual interest expense and enhance cash flow Caesars Entertainment Resort Properties, LLC (“CERP”), a wholly owned subsidiary of Caesars Entertainment Corporation (“Caesars” or “CEC”), owns six leading casino entertainment properties, the Octavius Tower at Caesars Palace and the LINQ Promenade Upon the emergence of Caesars Entertainment Operating Company, Inc. (“CEOC”) from bankruptcy and following completion of the Merger, CERP will continue to own these properties Casino properties are all managed by Caesars and are located in Las Vegas, Atlantic City and Laughlin Four casino properties are located by the strip in the heart of Las Vegas: Paris, Flamingo, Harrah’s Las Vegas, and Rio Harrah’s Atlantic City, located in the marina district of Atlantic City Harrah’s Laughlin, located in Laughlin, Nevada CERP generated 2016 net revenue and Adj. EBITDA of $2,195mm and $670mm (31% margin), respectively
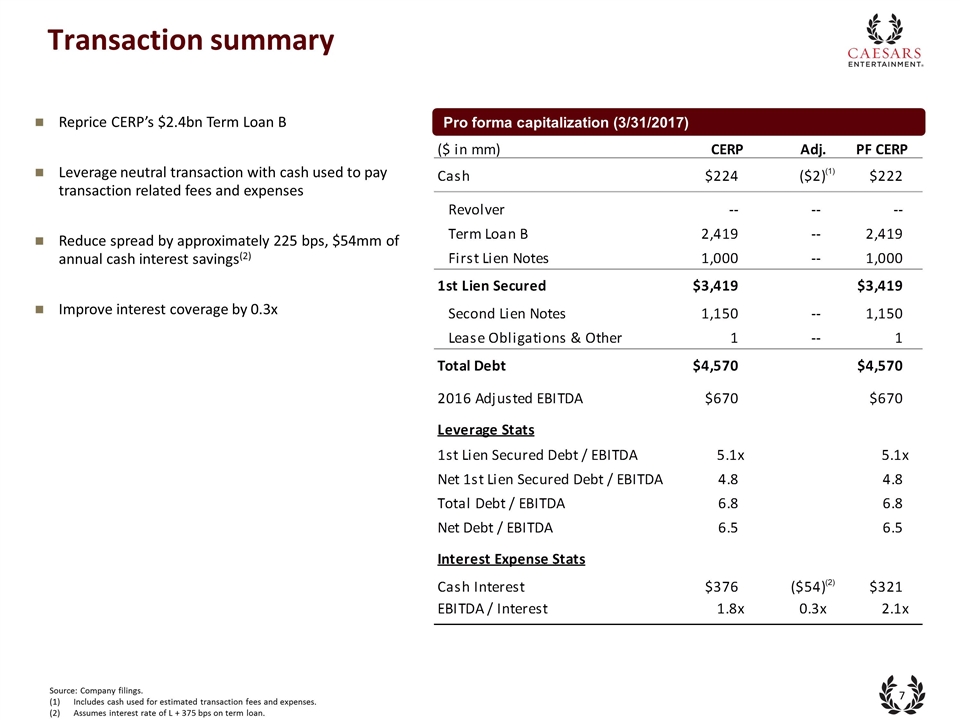
Reprice CERP’s $2.4bn Term Loan B Leverage neutral transaction with cash used to pay transaction related fees and expenses Reduce spread by approximately 225 bps, $54mm of annual cash interest savings(2) Improve interest coverage by 0.3x Transaction summary Pro forma capitalization (3/31/2017) Source: Company filings. Includes cash used for estimated transaction fees and expenses. Assumes interest rate of L + 375 bps on term loan. (1) (2)
2.Business Update
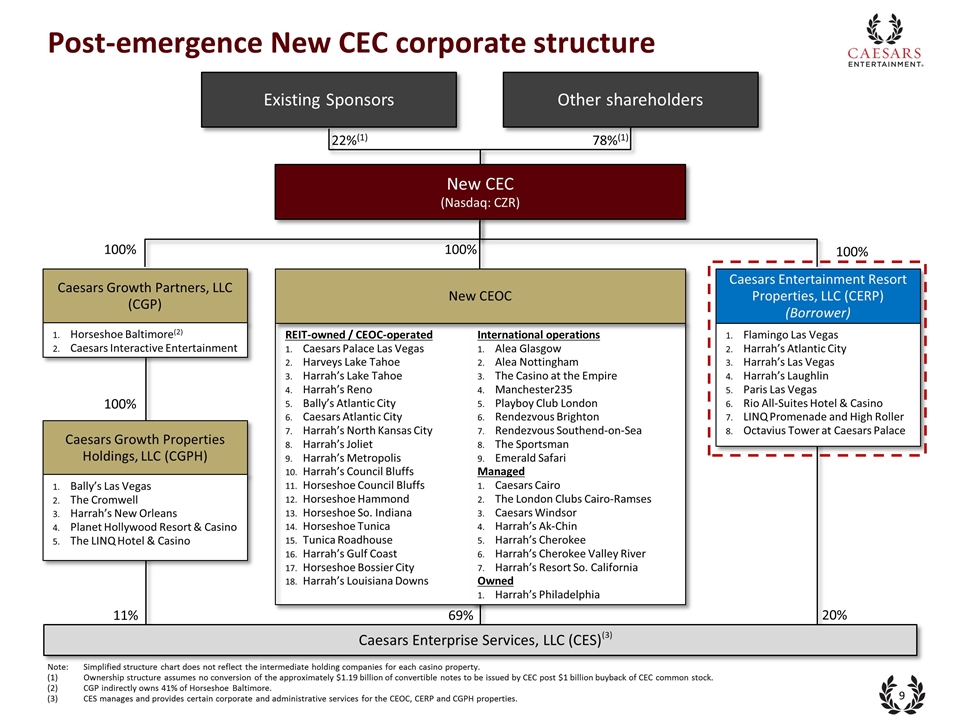
REIT-owned / CEOC-operated Caesars Palace Las Vegas Harveys Lake Tahoe Harrah’s Lake Tahoe Harrah’s Reno Bally’s Atlantic City Caesars Atlantic City Harrah’s North Kansas City Harrah’s Joliet Harrah’s Metropolis Harrah’s Council Bluffs Horseshoe Council Bluffs Horseshoe Hammond Horseshoe So. Indiana Horseshoe Tunica Tunica Roadhouse Harrah’s Gulf Coast Horseshoe Bossier City Harrah’s Louisiana Downs International operations Alea Glasgow Alea Nottingham The Casino at the Empire Manchester235 Playboy Club London Rendezvous Brighton Rendezvous Southend-on-Sea The Sportsman Emerald Safari Managed Caesars Cairo The London Clubs Cairo-Ramses Caesars Windsor Harrah’s Ak-Chin Harrah’s Cherokee Harrah’s Cherokee Valley River Harrah’s Resort So. California Owned Harrah’s Philadelphia 69% Post-emergence New CEC corporate structure Caesars Entertainment Resort Properties, LLC (CERP) (Borrower) 100% Note:Simplified structure chart does not reflect the intermediate holding companies for each casino property. (1) Ownership structure assumes no conversion of the approximately $1.19 billion of convertible notes to be issued by CEC post $1 billion buyback of CEC common stock. (2)CGP indirectly owns 41% of Horseshoe Baltimore. (3)CES manages and provides certain corporate and administrative services for the CEOC, CERP and CGPH properties. Flamingo Las Vegas Harrah’s Atlantic City Harrah’s Las Vegas Harrah’s Laughlin Paris Las Vegas Rio All-Suites Hotel & Casino LINQ Promenade and High Roller Octavius Tower at Caesars Palace New CEOC 20% 11% Caesars Enterprise Services, LLC (CES) (3) Existing Sponsors Other shareholders 22%(1) 78%(1) New CEC (Nasdaq: CZR) Caesars Growth Partners, LLC (CGP) 100% Horseshoe Baltimore(2) Caesars Interactive Entertainment Caesars Growth Properties Holdings, LLC (CGPH) Bally’s Las Vegas The Cromwell Harrah’s New Orleans Planet Hollywood Resort & Casino The LINQ Hotel & Casino 100% 100%
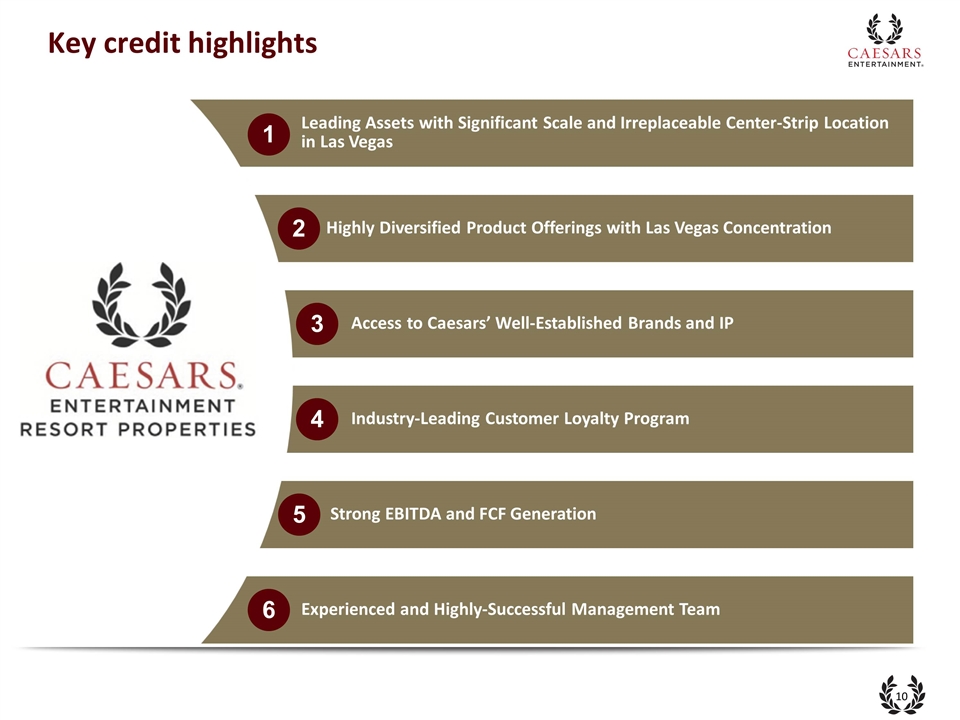
Leading Assets with Significant Scale and Irreplaceable Center-Strip Location in Las Vegas Key credit highlights Highly Diversified Product Offerings with Las Vegas Concentration Access to Caesars’ Well-Established Brands and IP Industry-Leading Customer Loyalty Program Strong EBITDA and FCF Generation Experienced and Highly-Successful Management Team 1 2 5 4 3 6
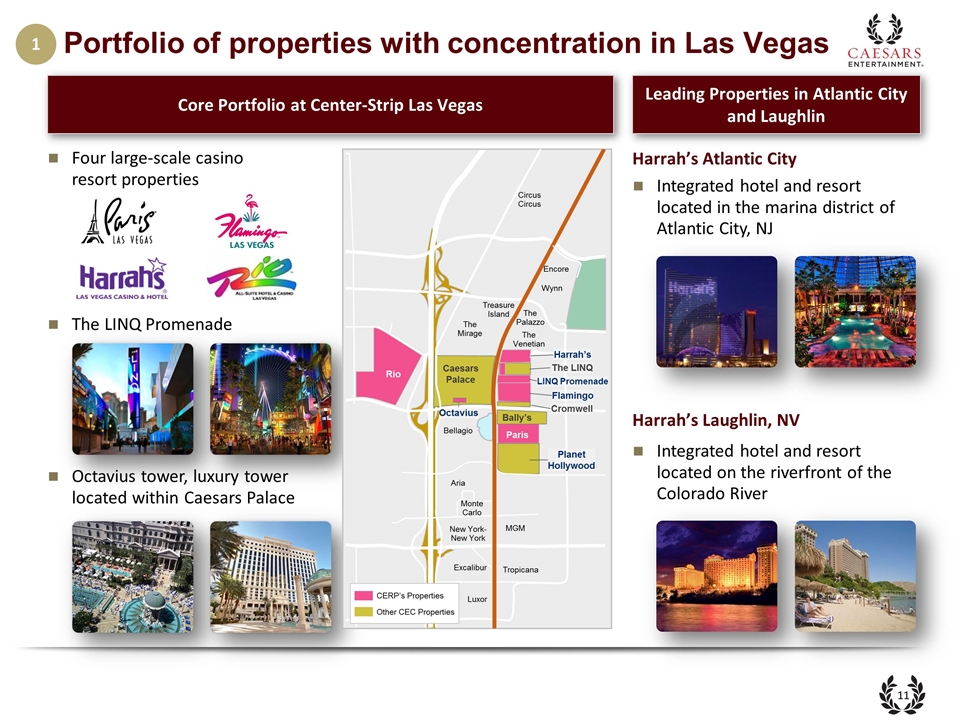
Core Portfolio at Center-Strip Las Vegas Portfolio of properties with concentration in Las Vegas Leading Properties in Atlantic City and Laughlin Four large-scale casino resort properties Integrated hotel and resort located in the marina district of Atlantic City, NJ Integrated hotel and resort located on the riverfront of the Colorado River The LINQ Promenade Octavius tower, luxury tower located within Caesars Palace Harrah’s Atlantic City Harrah’s Laughlin, NV Harrah’s LINQ Promenade Flamingo Bally’s Paris Rio Caesars Palace Other CEC Properties CERP’s Properties Luxor The Mirage Circus Circus Bellagio Aria New York- New York MGM Tropicana Encore The Palazzo Treasure Island Wynn Excalibur The Venetian Monte Carlo Octavius Planet Hollywood Cromwell The LINQ 1
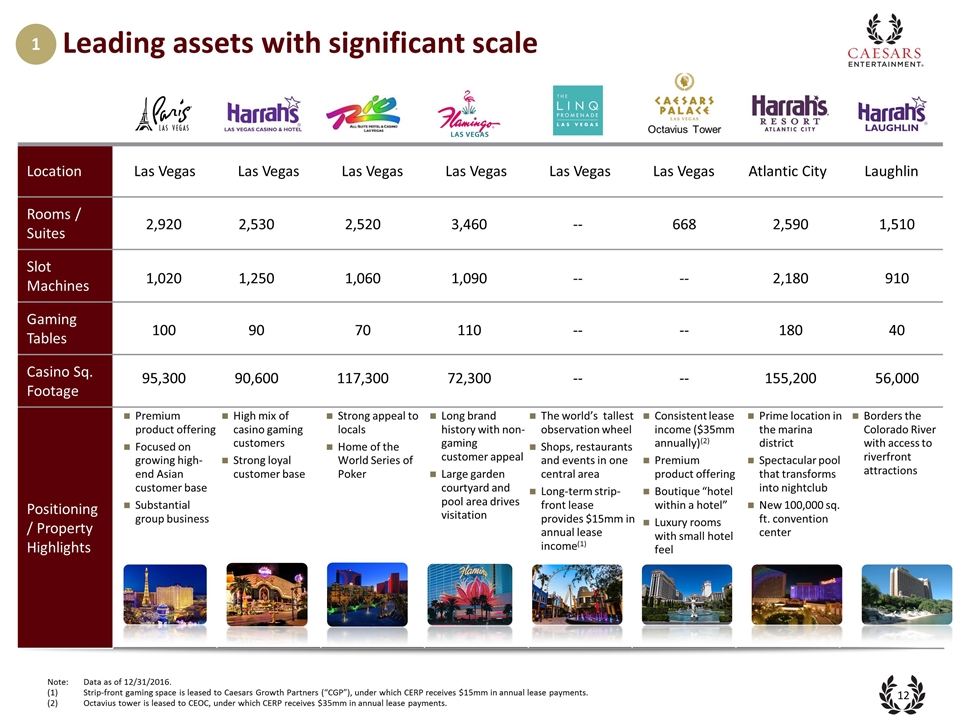
Location Las Vegas Las Vegas Las Vegas Las Vegas Las Vegas Las Vegas Atlantic City Laughlin Rooms / Suites Slot Machines Gaming Tables Casino Sq. Footage Positioning/ Property Highlights Leading assets with significant scale 2,530 2,520 3,460 1,250 1,060 1,090 90 70 110 90,600 117,300 72,300 High mix of casino gaming customers Strong loyal customer base Strong appeal to locals Home of the World Series of Poker Long brand history with non-gaming customer appeal Large garden courtyard and pool area drives visitation -- -- -- -- 668 -- -- -- 2,590 2,180 180 155,200 1,510 910 40 56,000 Octavius Tower The world’s tallest observation wheel Shops, restaurants and events in one central area Long-term strip-front lease provides $15mm in annual lease income(1) Consistent lease income ($35mm annually)(2) Premium product offering Boutique “hotel within a hotel” Luxury rooms with small hotel feel Prime location in the marina district Spectacular pool that transforms into nightclub New 100,000 sq. ft. convention center Borders the Colorado River with access to riverfront attractions 1 2,920 1,020 100 95,300 Premium product offering Focused on growing high-end Asian customer base Substantial group business Note: Data as of 12/31/2016. Strip-front gaming space is leased to Caesars Growth Partners (“CGP”), under which CERP receives $15mm in annual lease payments. Octavius tower is leased to CEOC, under which CERP receives $35mm in annual lease payments.
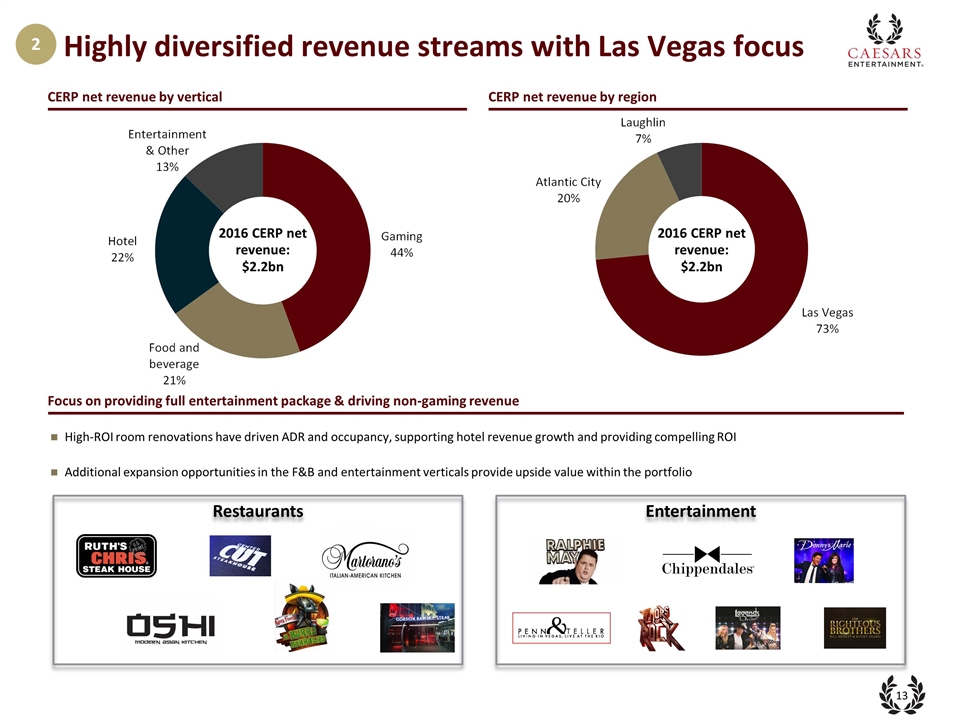
Restaurants Entertainment Highly diversified revenue streams with Las Vegas focus Focus on providing full entertainment package & driving non-gaming revenue High-ROI room renovations have driven ADR and occupancy, supporting hotel revenue growth and providing compelling ROI Additional expansion opportunities in the F&B and entertainment verticals provide upside value within the portfolio CERP net revenue by vertical CERP net revenue by region 2016 CERP net revenue: $2.2bn 2 2016 CERP net revenue: $2.2bn
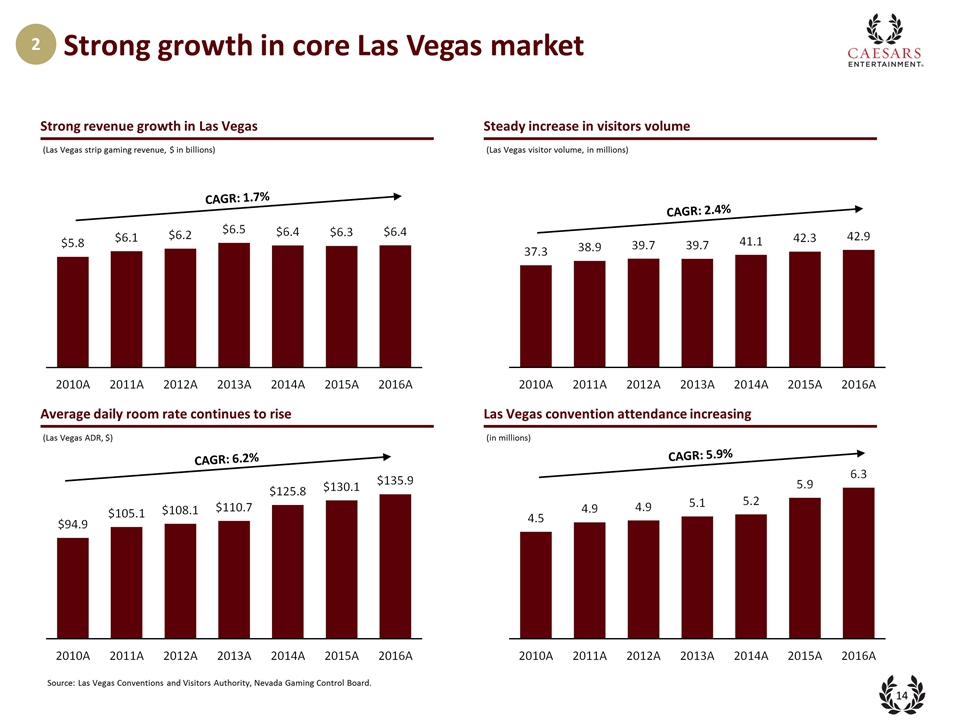
Strong growth in core Las Vegas market Steady increase in visitors volume Average daily room rate continues to rise (Las Vegas visitor volume, in millions) Source: Las Vegas Conventions and Visitors Authority, Nevada Gaming Control Board. Strong revenue growth in Las Vegas (Las Vegas strip gaming revenue, $ in billions) CAGR: 2.4% CAGR: 6.2% (Las Vegas ADR, $) CAGR: 1.7% Las Vegas convention attendance increasing (in millions) CAGR: 5.9% 2

Atlantic City gaming revenues are stabilizing Atlantic City gaming revenues (Total Atlantic City gaming revenue, $ in billions) Harrah’s Atlantic City EBITDA Source: State of New Jersey Division of Gaming Enforcement. Based on number of casinos open at end of each year. Trump Taj Mahal closed in October 2016. Includes Golden Nugget and Resorts. 2 Number of casinos(1) ($ in millions) Cash ADR has increased by 43% since 2014 New 100,000 sq. ft. convention center opened in Q3 2015 24% increase Harrah’s Atlantic City has leading market share (2) (2) (3) 15% Borgata 29% $3.56 $3.32 $3.05 $2.86 $2.62 $2.41 $2.41 2010 2011 2012 2013 2014 2015 2016
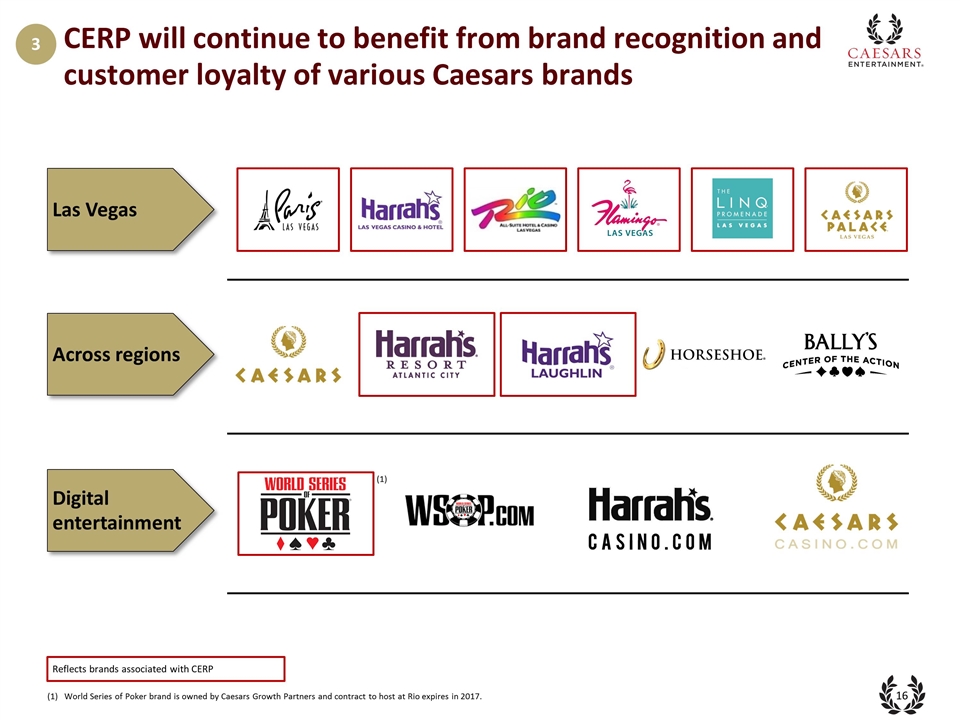
CERP will continue to benefit from brand recognition and customer loyalty of various Caesars brands Reflects brands associated with CERP Across regions Digital entertainment Las Vegas 3 (1) World Series of Poker brand is owned by Caesars Growth Partners and contract to host at Rio expires in 2017. (1)
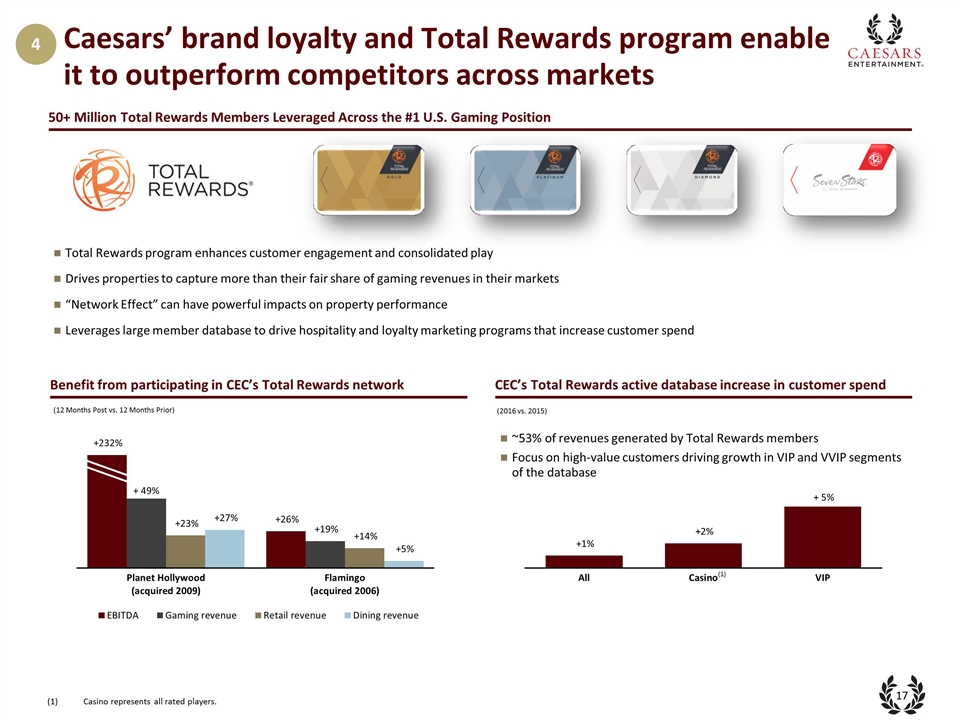
Caesars’ brand loyalty and Total Rewards program enable it to outperform competitors across markets Casino represents all rated players. Benefit from participating in CEC’s Total Rewards network CEC’s Total Rewards active database increase in customer spend (12 Months Post vs. 12 Months Prior) (2016 vs. 2015) (1) ~53% of revenues generated by Total Rewards members Focus on high-value customers driving growth in VIP and VVIP segments of the database 4 50+ Million Total Rewards Members Leveraged Across the #1 U.S. Gaming Position Total Rewards program enhances customer engagement and consolidated play Drives properties to capture more than their fair share of gaming revenues in their markets “Network Effect” can have powerful impacts on property performance Leverages large member database to drive hospitality and loyalty marketing programs that increase customer spend
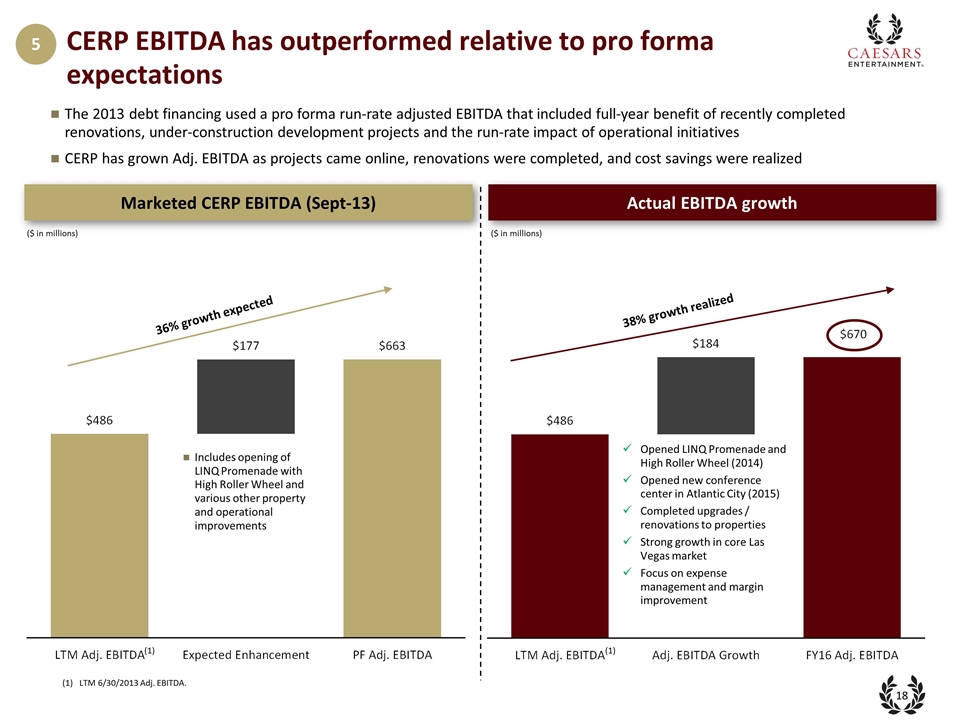
CERP EBITDA has outperformed relative to pro forma expectations 5 Marketed CERP EBITDA (Sept-13) Actual EBITDA growth The 2013 debt financing used a pro forma run-rate adjusted EBITDA that included full-year benefit of recently completed renovations, under-construction development projects and the run-rate impact of operational initiatives CERP has grown Adj. EBITDA as projects came online, renovations were completed, and cost savings were realized ($ in millions) ($ in millions) 36% growth expected 38% growth realized Opened LINQ Promenade and High Roller Wheel (2014) Opened new conference center in Atlantic City (2015) Completed upgrades / renovations to properties Strong growth in core Las Vegas market Focus on expense management and margin improvement Includes opening of LINQ Promenade with High Roller Wheel and various other property and operational improvements (1) (1) LTM 6/30/2013 Adj. EBITDA. (1)
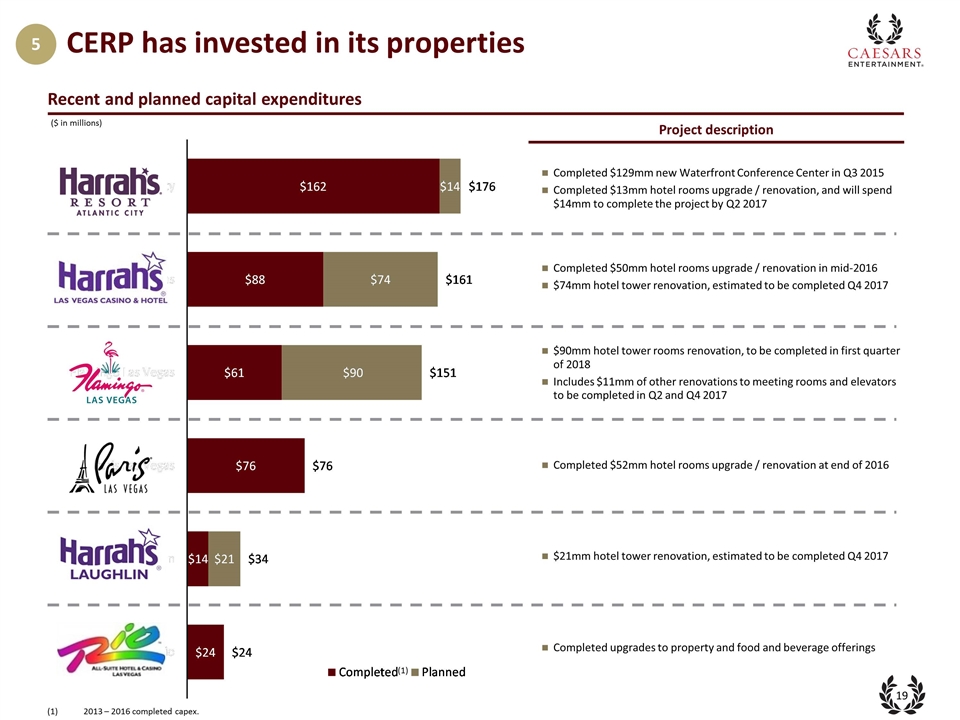
Project description CERP has invested in its properties Recent and planned capital expenditures 5 $90mm hotel tower rooms renovation, to be completed in first quarter of 2018 Includes $11mm of other renovations to meeting rooms and elevators to be completed in Q2 and Q4 2017 Completed $52mm hotel rooms upgrade / renovation at end of 2016 $21mm hotel tower renovation, estimated to be completed Q4 2017 Completed $129mm new Waterfront Conference Center in Q3 2015 Completed $13mm hotel rooms upgrade / renovation, and will spend $14mm to complete the project by Q2 2017 Completed $50mm hotel rooms upgrade / renovation in mid-2016 $74mm hotel tower renovation, estimated to be completed Q4 2017 ($ in millions) Completed upgrades to property and food and beverage offerings (1)2013 – 2016 completed capex. (1)
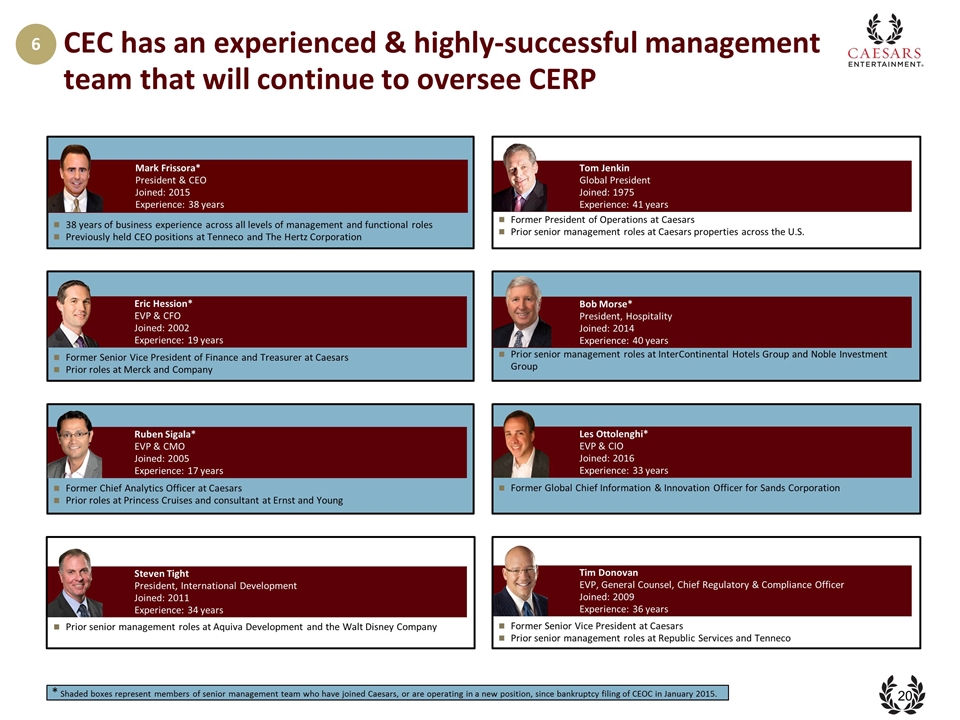
Former President of Operations at Caesars Prior senior management roles at Caesars properties across the U.S. Tom Jenkin Global President Joined: 1975 Experience: 41 years CEC has an experienced & highly-successful management team that will continue to oversee CERP Mark Frissora* President & CEO Joined: 2015 Experience: 38 years 38 years of business experience across all levels of management and functional roles Previously held CEO positions at Tenneco and The Hertz Corporation Former Senior Vice President of Finance and Treasurer at Caesars Prior roles at Merck and Company Eric Hession* EVP & CFO Joined: 2002 Experience: 19 years Steven Tight President, International Development Joined: 2011 Experience: 34 years Prior senior management roles at Aquiva Development and the Walt Disney Company Bob Morse* President, Hospitality Joined: 2014 Experience: 40 years Prior senior management roles at InterContinental Hotels Group and Noble Investment Group Ruben Sigala* EVP & CMO Joined: 2005 Experience: 17 years Former Chief Analytics Officer at Caesars Prior roles at Princess Cruises and consultant at Ernst and Young Les Ottolenghi* EVP & CIO Joined: 2016 Experience: 33 years Former Global Chief Information & Innovation Officer for Sands Corporation Tim Donovan EVP, General Counsel, Chief Regulatory & Compliance Officer Joined: 2009 Experience: 36 years Former Senior Vice President at Caesars Prior senior management roles at Republic Services and Tenneco * Shaded boxes represent members of senior management team who have joined Caesars, or are operating in a new position, since bankruptcy filing of CEOC in January 2015. 6
3.Financial Performance Update
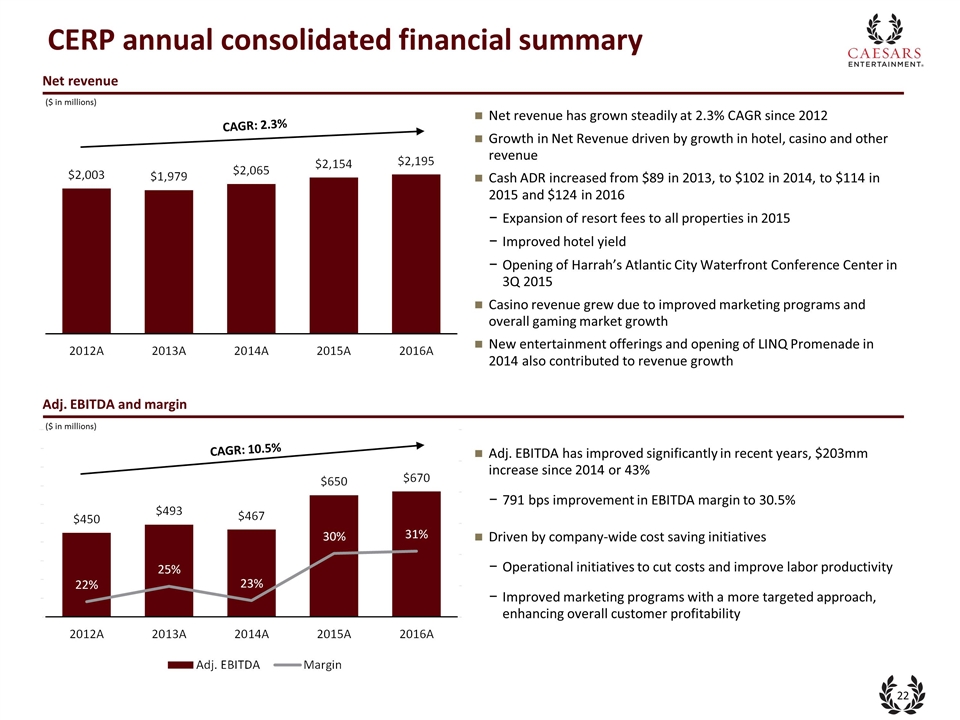
Adj. EBITDA and margin CERP annual consolidated financial summary Net revenue has grown steadily at 2.3% CAGR since 2012 Growth in Net Revenue driven by growth in hotel, casino and other revenue Cash ADR increased from $89 in 2013, to $102 in 2014, to $114 in 2015 and $124 in 2016 Expansion of resort fees to all properties in 2015 Improved hotel yield Opening of Harrah’s Atlantic City Waterfront Conference Center in 3Q 2015 Casino revenue grew due to improved marketing programs and overall gaming market growth New entertainment offerings and opening of LINQ Promenade in 2014 also contributed to revenue growth Net revenue ($ in millions) ($ in millions) Adj. EBITDA has improved significantly in recent years, $203mm increase since 2014 or 43% 791 bps improvement in EBITDA margin to 30.5% Driven by company-wide cost saving initiatives Operational initiatives to cut costs and improve labor productivity Improved marketing programs with a more targeted approach, enhancing overall customer profitability CAGR: 2.3% CAGR: 10.5%
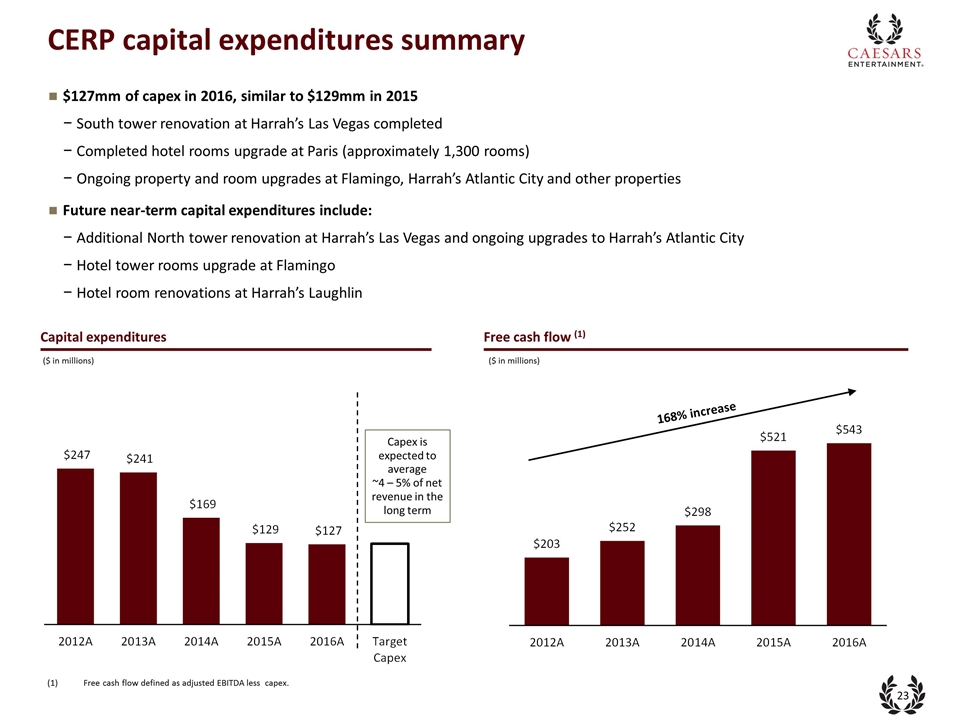
CERP capital expenditures summary Capex is expected to average ~4 – 5% of net revenue in the long term $127mm of capex in 2016, similar to $129mm in 2015 South tower renovation at Harrah’s Las Vegas completed Completed hotel rooms upgrade at Paris (approximately 1,300 rooms) Ongoing property and room upgrades at Flamingo, Harrah’s Atlantic City and other properties Future near-term capital expenditures include: Additional North tower renovation at Harrah’s Las Vegas and ongoing upgrades to Harrah’s Atlantic City Hotel tower rooms upgrade at Flamingo Hotel room renovations at Harrah’s Laughlin Capital expenditures Free cash flow (1) ($ in millions) ($ in millions) (1)Free cash flow defined as adjusted EBITDA less capex. 168% increase
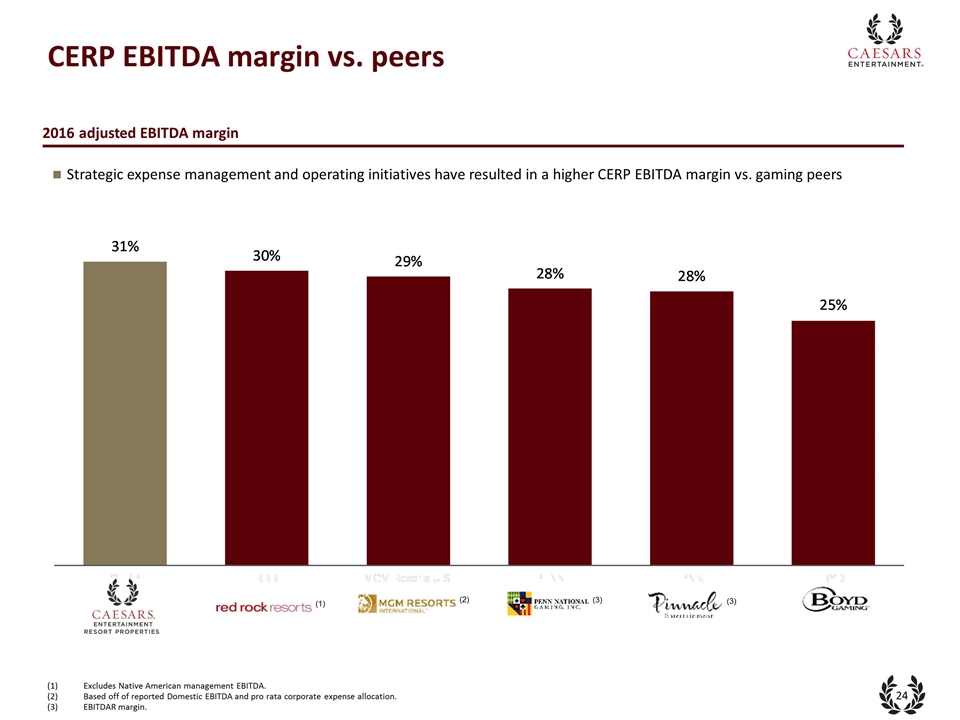
CERP EBITDA margin vs. peers 2016 adjusted EBITDA margin Strategic expense management and operating initiatives have resulted in a higher CERP EBITDA margin vs. gaming peers Excludes Native American management EBITDA. Based off of reported Domestic EBITDA and pro rata corporate expense allocation. EBITDAR margin. (2) (3) (3) (1)
Appendix

Detailed CERP historical financials
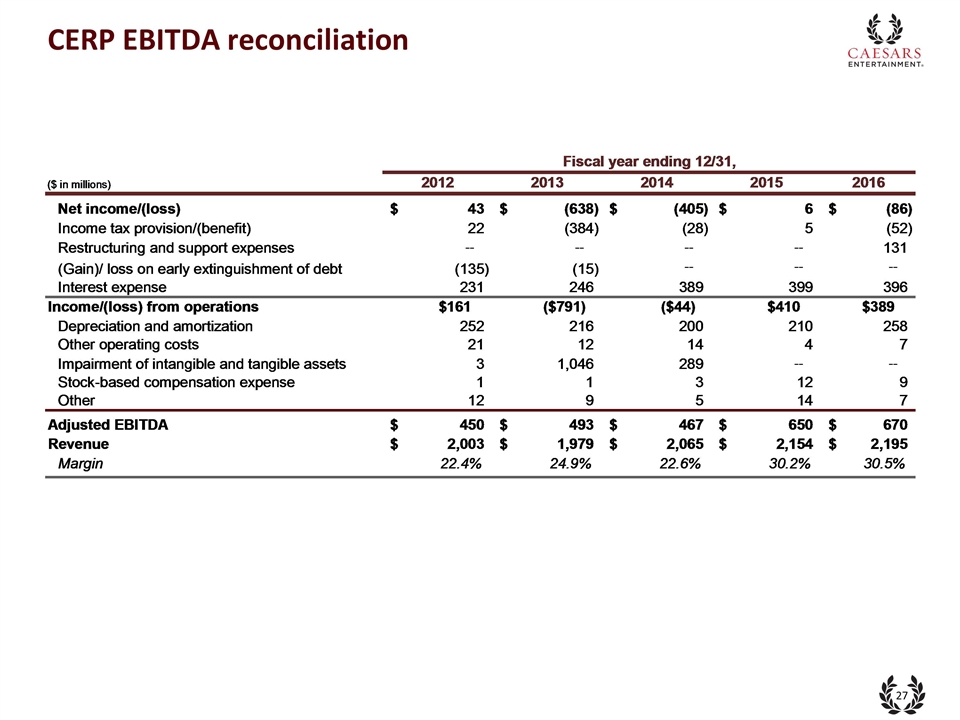
CERP EBITDA reconciliation Note:About nine o'clock the moon was sufficiently bright for me to proceed on my way and I had no difficulty in following the trail at a fast walk, and in some places at a brisk trot until, about midnight, I reached the water hole where Powell had expected to camp. I came upon the spot unexpectedly, finding it entirely deserted, with no signs of having been recently occupied as a camp.
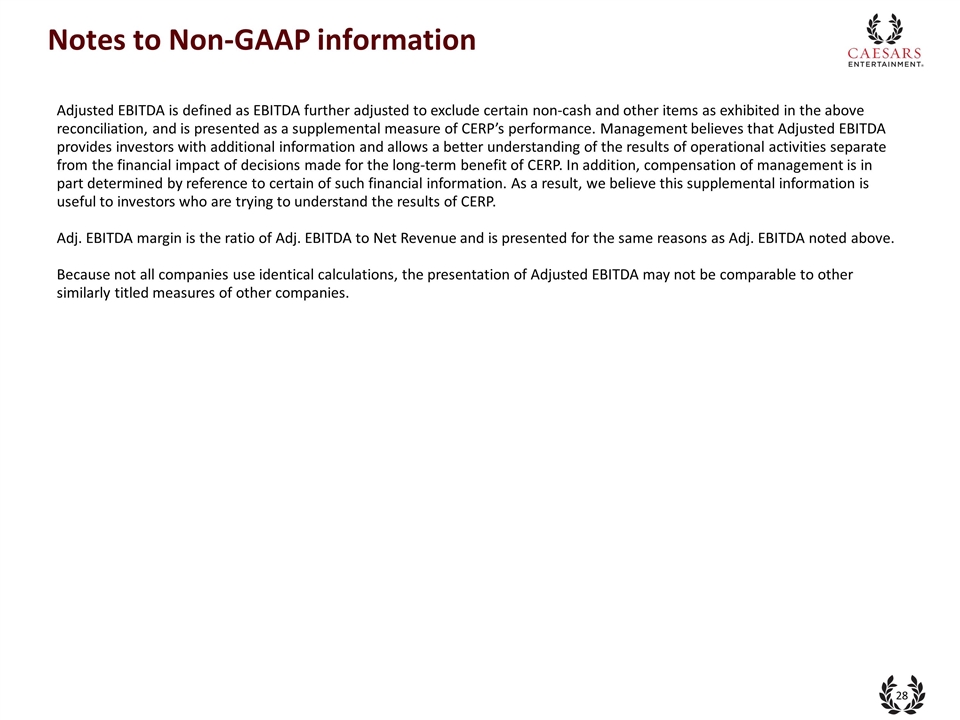
Notes to Non-GAAP information Note:About nine o'clock the moon was sufficiently bright for me to proceed on my way and I had no difficulty in following the trail at a fast walk, and in some places at a brisk trot until, about midnight, I reached the water hole where Powell had expected to camp. I came upon the spot unexpectedly, finding it entirely deserted, with no signs of having been recently occupied as a camp. Adjusted EBITDA is defined as EBITDA further adjusted to exclude certain non-cash and other items as exhibited in the above reconciliation, and is presented as a supplemental measure of CERP’s performance. Management believes that Adjusted EBITDA provides investors with additional information and allows a better understanding of the results of operational activities separate from the financial impact of decisions made for the long-term benefit of CERP. In addition, compensation of management is in part determined by reference to certain of such financial information. As a result, we believe this supplemental information is useful to investors who are trying to understand the results of CERP. Adj. EBITDA margin is the ratio of Adj. EBITDA to Net Revenue and is presented for the same reasons as Adj. EBITDA noted above. Because not all companies use identical calculations, the presentation of Adjusted EBITDA may not be comparable to other similarly titled measures of other companies.


