
WELCOME Exhibit 99.1
Safe Harbor Forward-looking Statement This presentation may include forward-looking statements related to the future business and financial performance of Benefitfocus and future events or developments involving Benefitfocus. These statements may be identified by words such as “expects,” “looks forward to,” “anticipates,” “intends,” “plans,” “believes,” “seeks,” “estimates,” “may,” “might,” “will,” “could,” “would,” “should,” “targets,” “projects” or words of similar meaning. Forward-looking statements can involve a number of risks and uncertainties that could cause actual results to differ materially from those explicit or implicit in the forward-looking statements, including fluctuations in those results, the immature and volatile market for our products and services, general economic risks, our ability to achieve growth targets and manage growth, the need to innovate and deliver useful products and services, our ability to compete effectively, reliance on key personnel, privacy, cybersecurity, regulatory changes, and other risks associated with our business as set forth from time to time in our filings with the SEC. Some of the services, products and other features discussed in this presentation may be works in progress and not yet generally available for sale. Benefitfocus assumes no obligation and does not intend to update any forward-looking statements. Non-GAAP Financial Measures The company uses certain non-GAAP financial measures. Generally, a non-GAAP financial measure is a numerical measure of a company’s performance or financial position that either excludes or includes amounts that are not normally excluded or included in the most directly comparable measure calculated and presented in accordance with GAAP. Please note that other companies might define their non-GAAP financial measures differently than we do. Non-GAAP gross profit excludes stock-based compensation expenses, amortization of acquisition-related intangible assets, transaction costs expensed, if any, and costs not core to our business, if any. We define adjusted EBITDA as net loss before net interest, taxes, and depreciation and amortization expense, adjusted to eliminate stock-based compensation expense, expense related to the impairment of goodwill and intangible assets, transaction costs expensed, and costs not core to our business. We define free cash flow as cash flow from operations less purchase of property and equipment. Management presents these non-GAAP financial measures in this release because it considers them to be important supplemental measures of performance. Management uses these non-GAAP financial measures for planning purposes, including analysis of the company's performance against prior periods, the preparation of operating budgets and to determine appropriate levels of operating and capital investments. Management believes that these non-GAAP financial measures provide additional insight for analysts and investors in evaluating the company's financial and operational performance. Non-GAAP financial measures have limitations as an analytical tool. Investors are encouraged to review the reconciliation of the non-GAAP measures to their most directly comparable GAAP measures provided in this release, including in the accompanying tables.

WELCOME
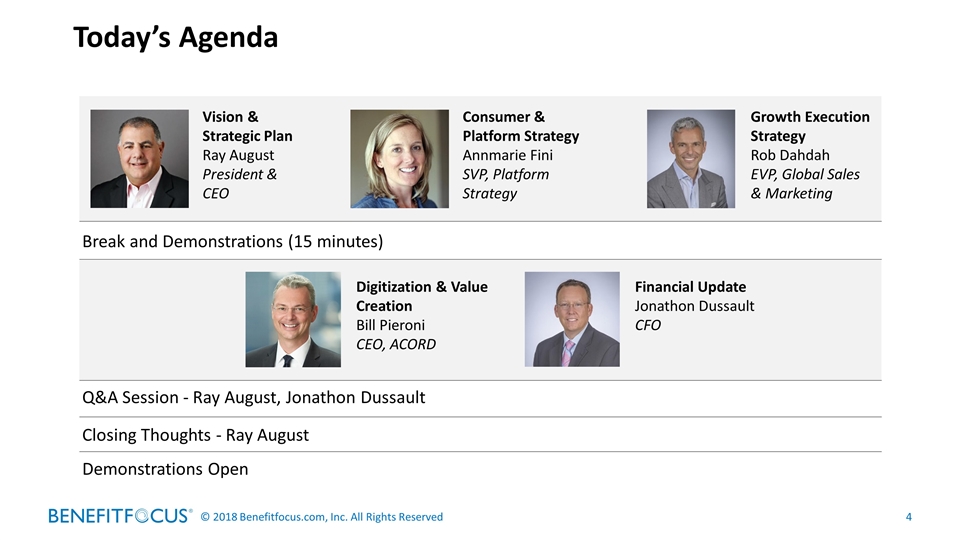
Break and Demonstrations (15 minutes) Q&A Session - Ray August, Jonathon Dussault Closing Thoughts - Ray August Demonstrations Open Today’s Agenda Vision & Strategic Plan Ray August President & CEO Consumer & Platform Strategy Annmarie Fini SVP, Platform Strategy Growth Execution Strategy Rob Dahdah EVP, Global Sales & Marketing Digitization & Value Creation Bill Pieroni CEO, ACORD Financial Update Jonathon Dussault CFO

Vision and Strategy Ray August, President & CEO December 18, 2018

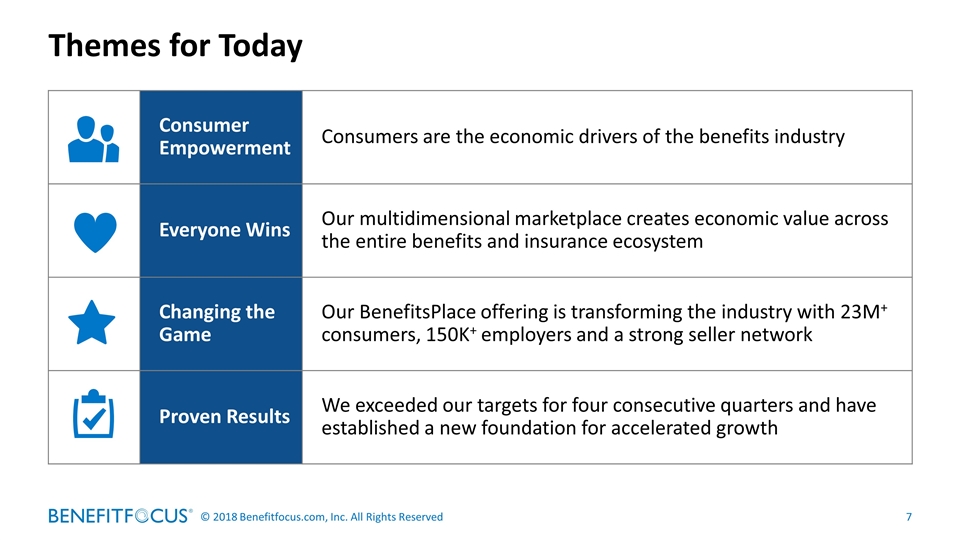
Themes for Today Consumer Empowerment Consumers are the economic drivers of the benefits industry Everyone Wins Our multidimensional marketplace creates economic value across the entire benefits and insurance ecosystem Changing the Game Our BenefitsPlace offering is transforming the industry with 23M+ consumers, 150K+ employers and a strong seller network Proven Results We exceeded our targets for four consecutive quarters and have established a new foundation for accelerated growth
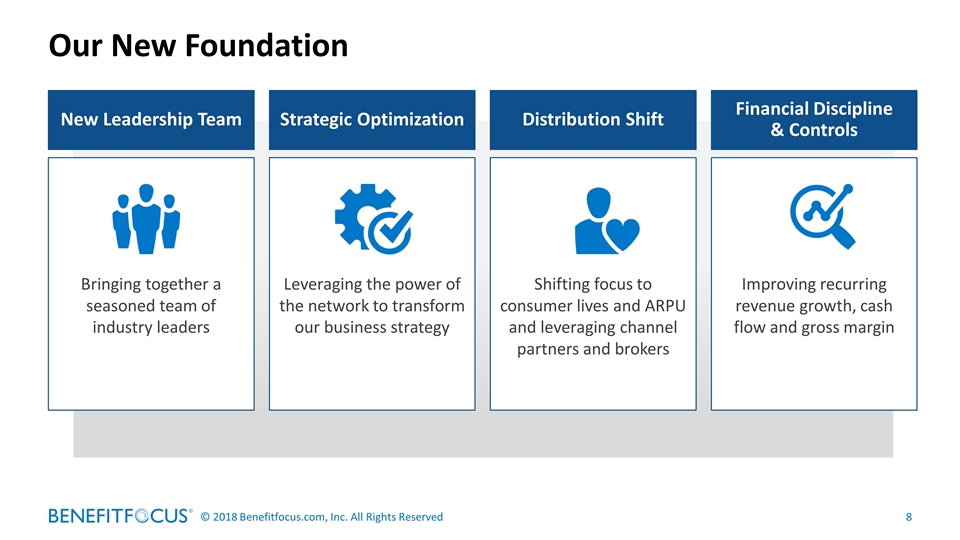
Our New Foundation New Leadership Team Bringing together a seasoned team of industry leaders Strategic Optimization Leveraging the power of the network to transform our business strategy Distribution Shift Shifting focus to consumer lives and ARPU and leveraging channel partners and brokers Financial Discipline & Controls Improving recurring revenue growth, cash flow and gross margin

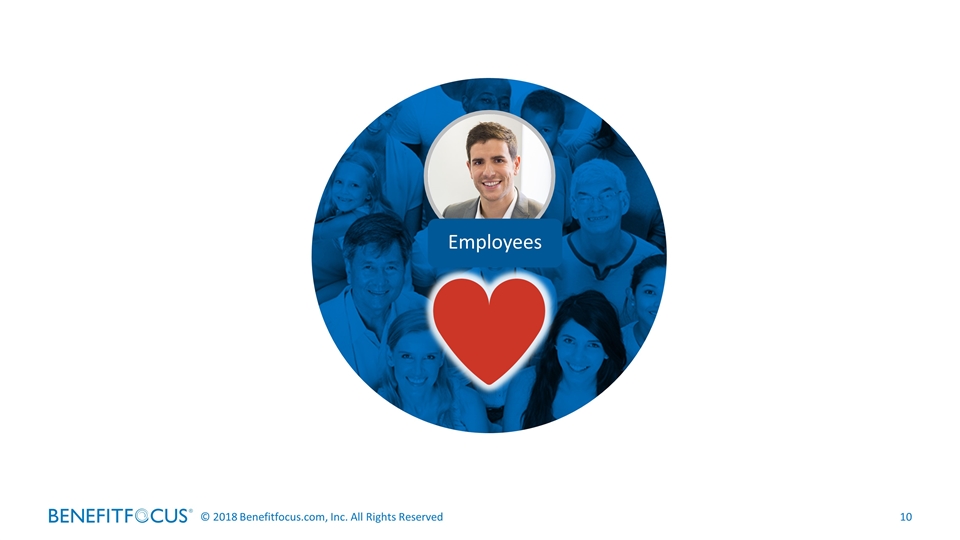
Employees

Brokers Suppliers Medical Carriers Employers Employees
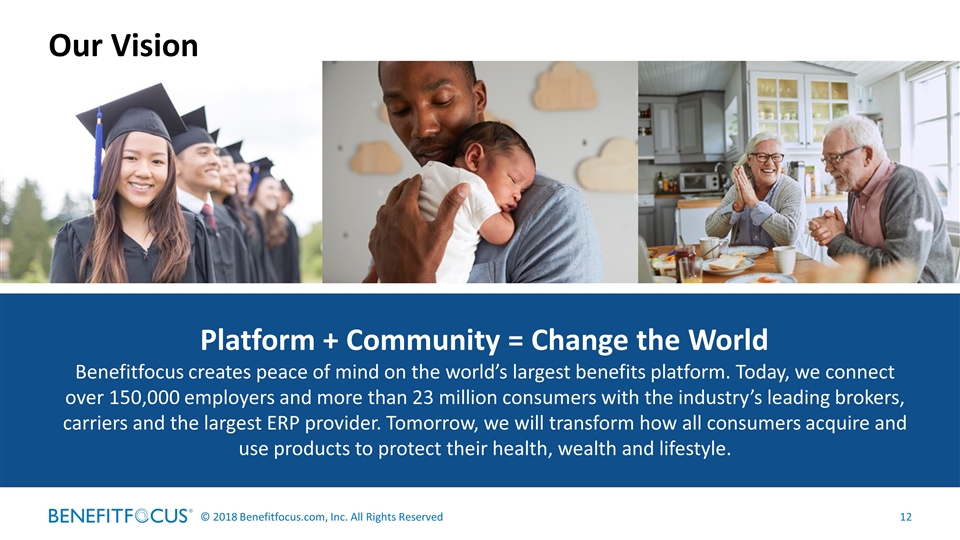
Platform + Community = Change the World Benefitfocus creates peace of mind on the world’s largest benefits platform. Today, we connect over 150,000 employers and more than 23 million consumers with the industry’s leading brokers, carriers and the largest ERP provider. Tomorrow, we will transform how all consumers acquire and use products to protect their health, wealth and lifestyle. Our Vision
The Platform Economy Creates New Opportunities
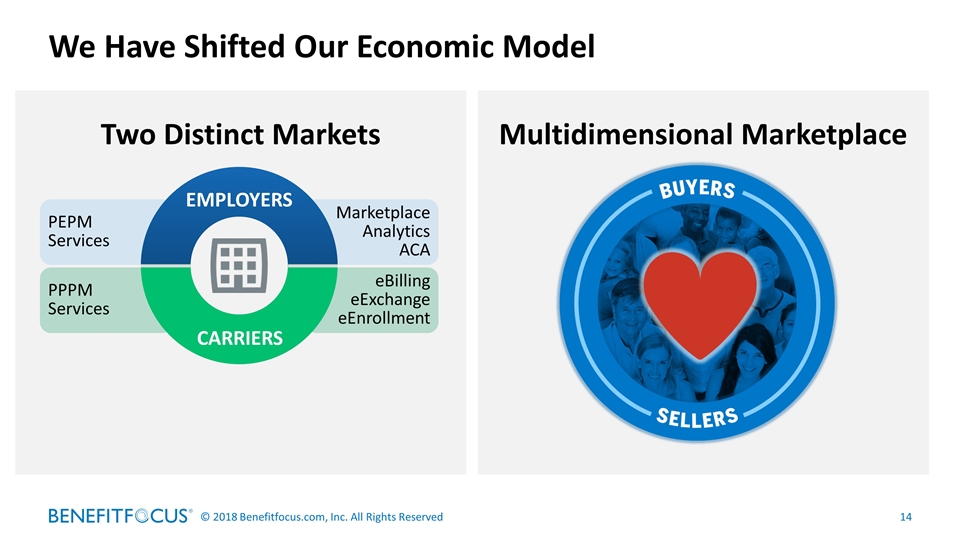
We Have Shifted Our Economic Model Two Distinct Markets PPPM Services eBilling eExchange eEnrollment PEPM Services Marketplace Analytics ACA EMPLOYERS CARRIERS Multidimensional Marketplace
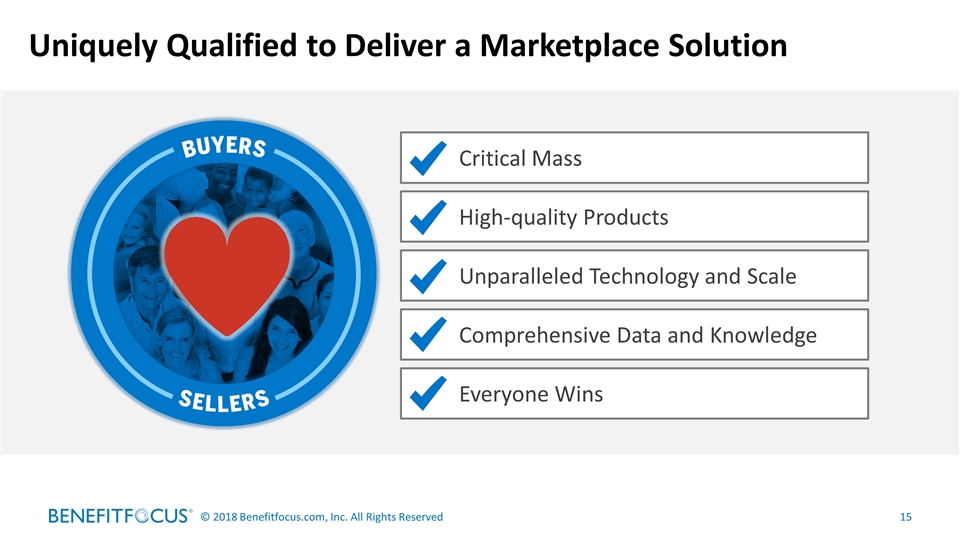
Uniquely Qualified to Deliver a Marketplace Solution Critical Mass High-quality Products Unparalleled Technology and Scale Comprehensive Data and Knowledge Everyone Wins
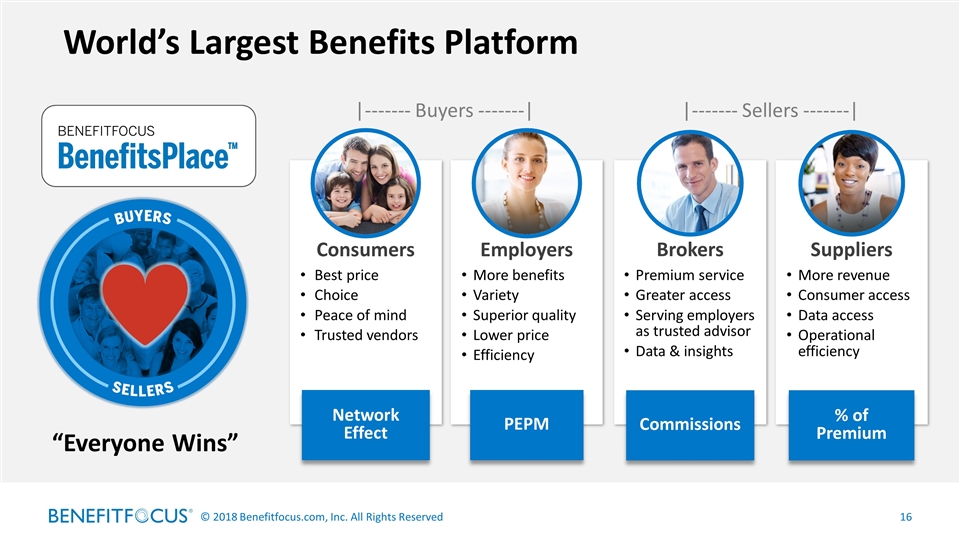
“Everyone Wins” Employers Consumers PEPM Network Effect Best price Choice Peace of mind Trusted vendors More benefits Variety Superior quality Lower price Efficiency Suppliers % of Premium More revenue Consumer access Data access Operational efficiency Brokers Commissions Premium service Greater access Serving employers as trusted advisor Data & insights |------- Sellers -------| |------- Buyers -------| World’s Largest Benefits Platform
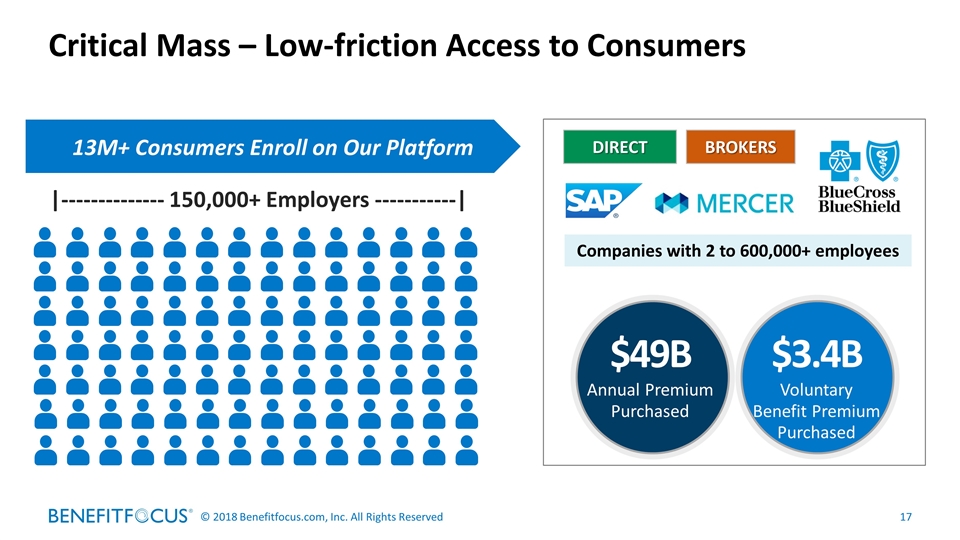
|-------------- 150,000+ Employers -----------| 13M+ Consumers Enroll on Our Platform Critical Mass – Low-friction Access to Consumers DIRECT BROKERS $49B Annual Premium Purchased $3.4B Voluntary Benefit Premium Purchased Companies with 2 to 600,000+ employees
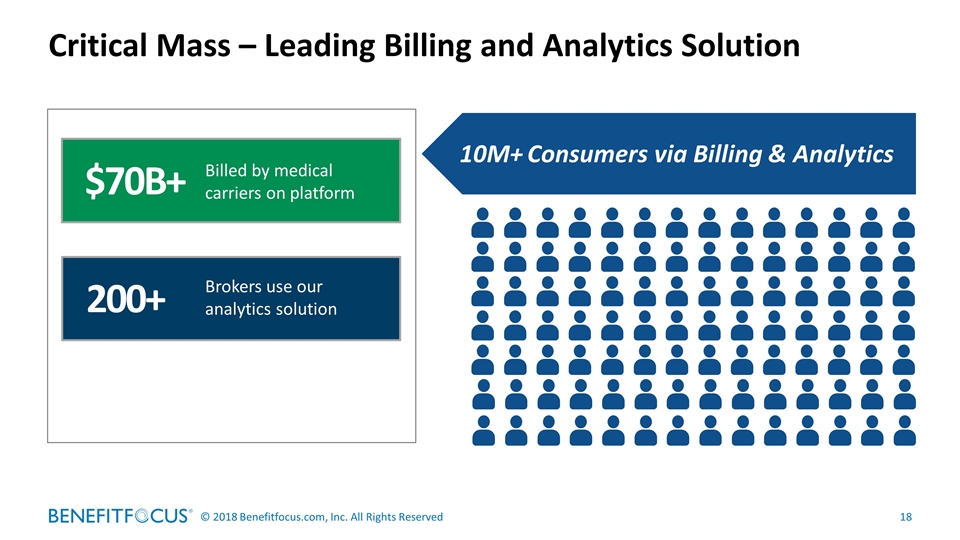
Critical Mass – Leading Billing and Analytics Solution 10M+ Consumers via Billing & Analytics Billed by medical carriers on platform $70B+ Americans with medical & claims data on our platform 6.5M+ Brokers use our analytics solution 200+
The Network Effect in Action
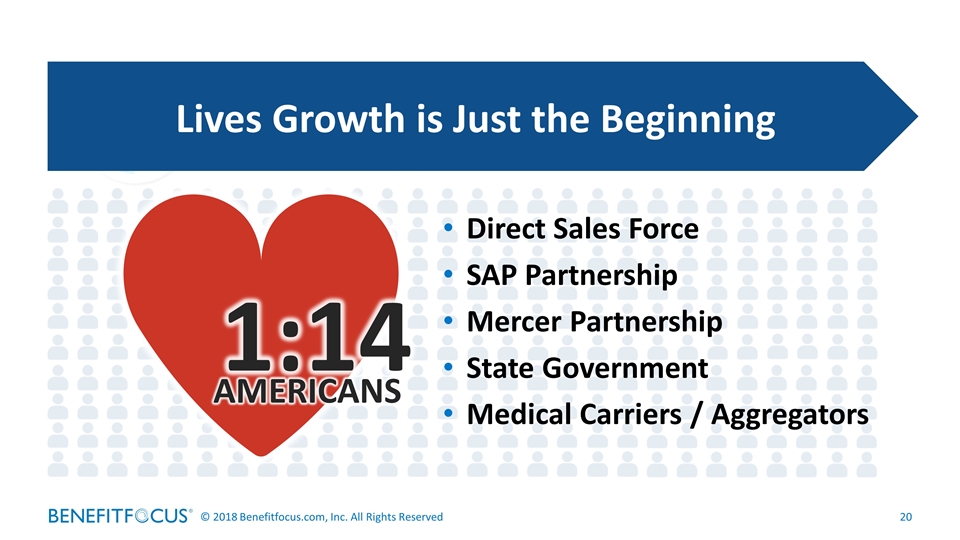
Direct Sales Force SAP Partnership Mercer Partnership State Government Medical Carriers / Aggregators Lives Growth is Just the Beginning 1:14 AMERICANS
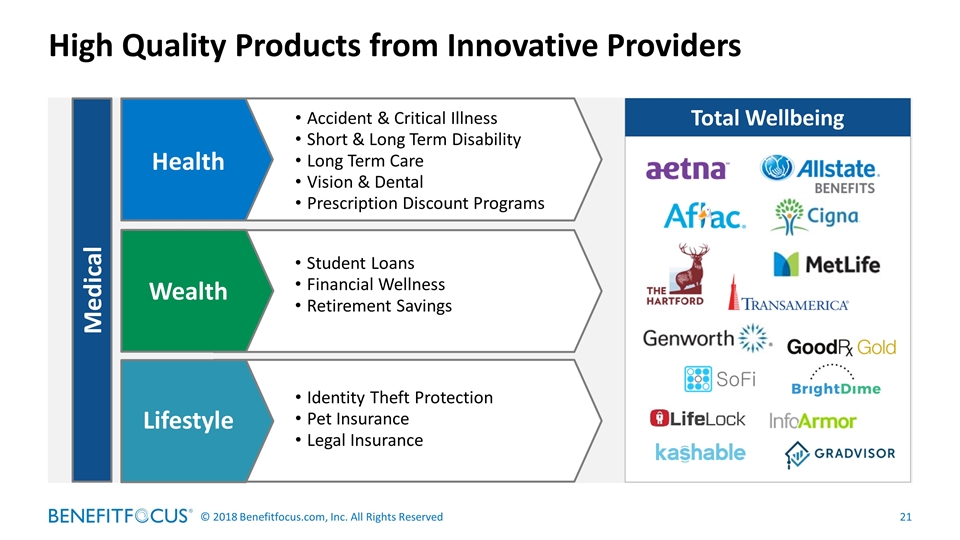
High Quality Products from Innovative Providers Lifestyle Wealth Health Accident & Critical Illness Short & Long Term Disability Long Term Care Vision & Dental Prescription Discount Programs Identity Theft Protection Pet Insurance Legal Insurance Total Wellbeing Student Loans Financial Wellness Retirement Savings Medical
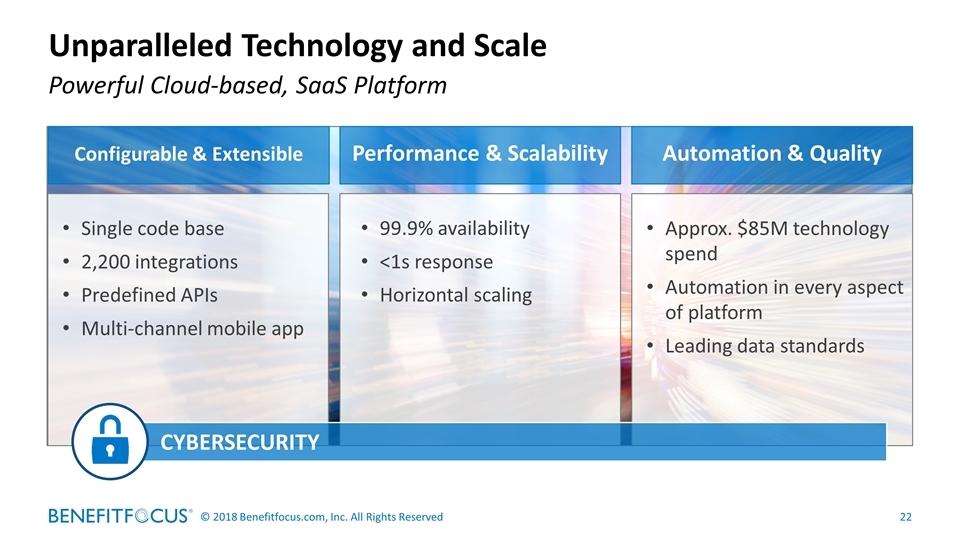
Unparalleled Technology and Scale Powerful Cloud-based, SaaS Platform Configurable & Extensible Single code base 2,200 integrations Predefined APIs Multi-channel mobile app Performance & Scalability Automation & Quality Approx. $85M technology spend Automation in every aspect of platform Leading data standards CYBERSECURITY 99.9% availability <1s response Horizontal scaling
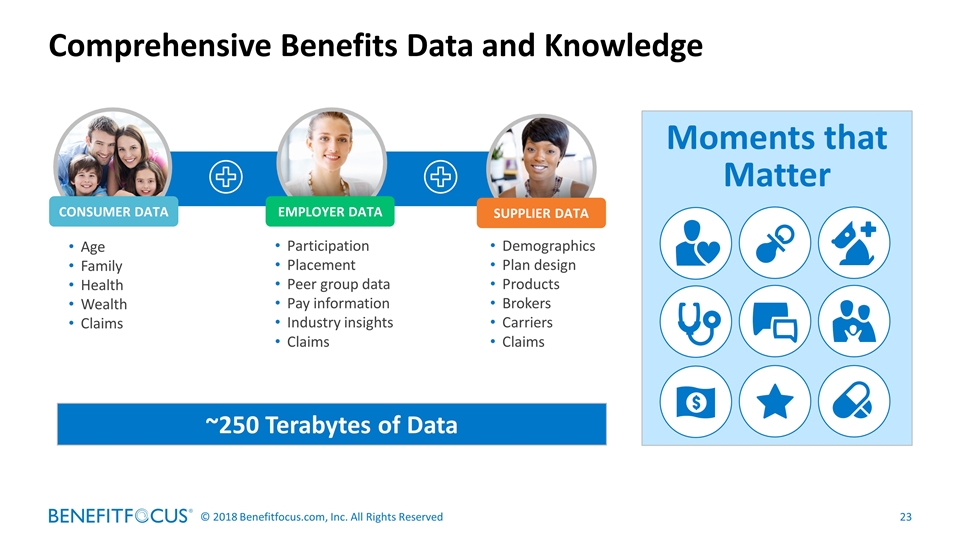
Age Family Health Wealth Claims Participation Placement Peer group data Pay information Industry insights Claims Demographics Plan design Products Brokers Carriers Claims Comprehensive Benefits Data and Knowledge EMPLOYER DATA CONSUMER DATA SUPPLIER DATA Moments that Matter ~250 Terabytes of Data
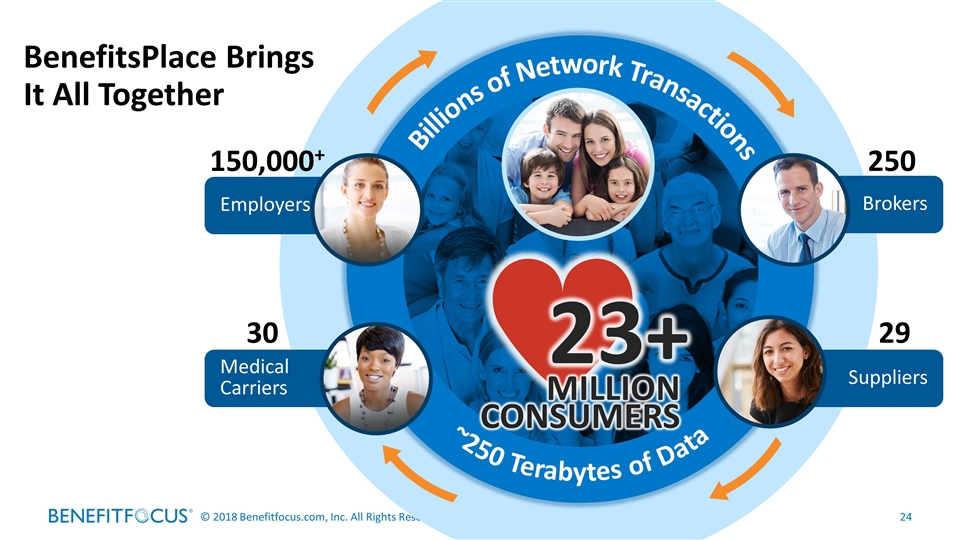
23+ MILLION CONSUMERS 250 Brokers 29 Suppliers 30 Medical Carriers 150,000+ Employers Billions of Network Transactions ~250 Terabytes of Data BenefitsPlace Brings It All Together
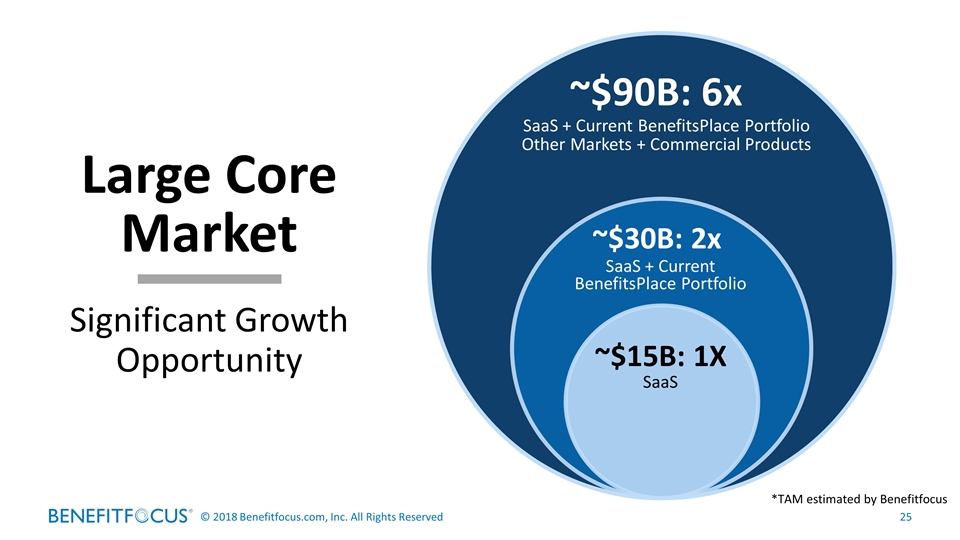
SaaS + Current BenefitsPlace Portfolio Other Markets + Commercial Products ~$90B: 6x SaaS + Current BenefitsPlace Portfolio ~$30B: 2x ~$15B: 1X SaaS Large Core Market Significant Growth Opportunity *TAM estimated by Benefitfocus
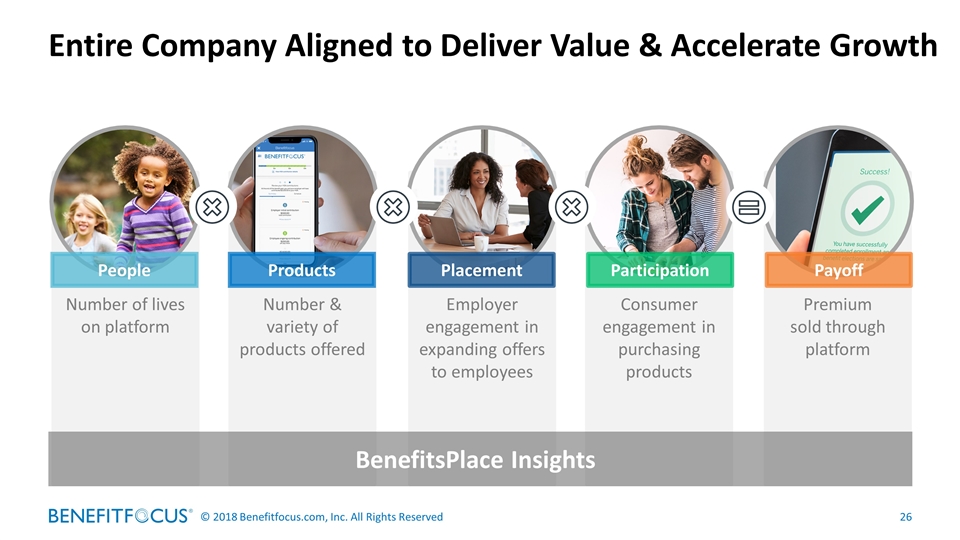
Entire Company Aligned to Deliver Value & Accelerate Growth Consumer engagement in purchasing products Premium sold through platform Number of lives on platform Employer engagement in expanding offers to employees Number & variety of products offered People Products Placement Participation Payoff BenefitsPlace Insights
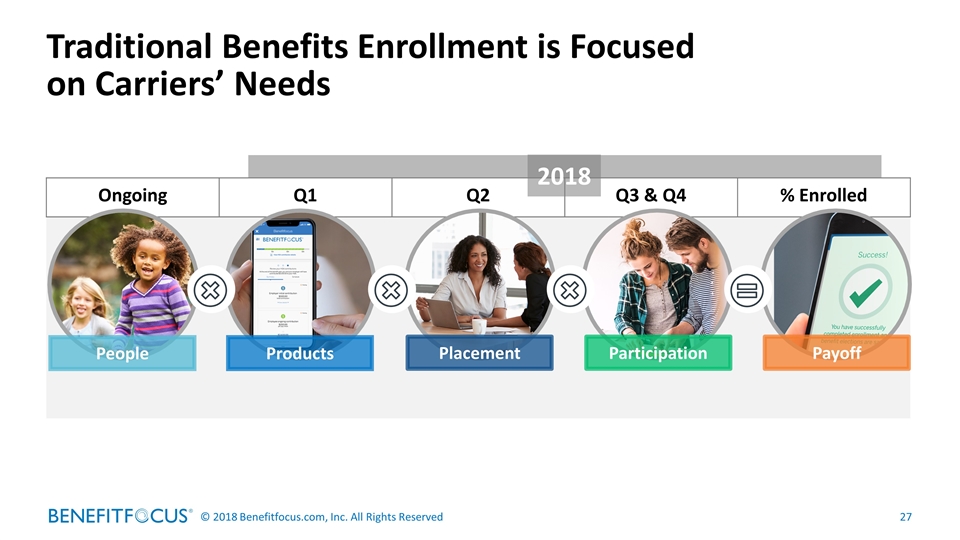
Ongoing Q1 Q2 Q3 & Q4 % Enrolled Traditional Benefits Enrollment is Focused on Carriers’ Needs People Products Placement Participation Payoff 2018
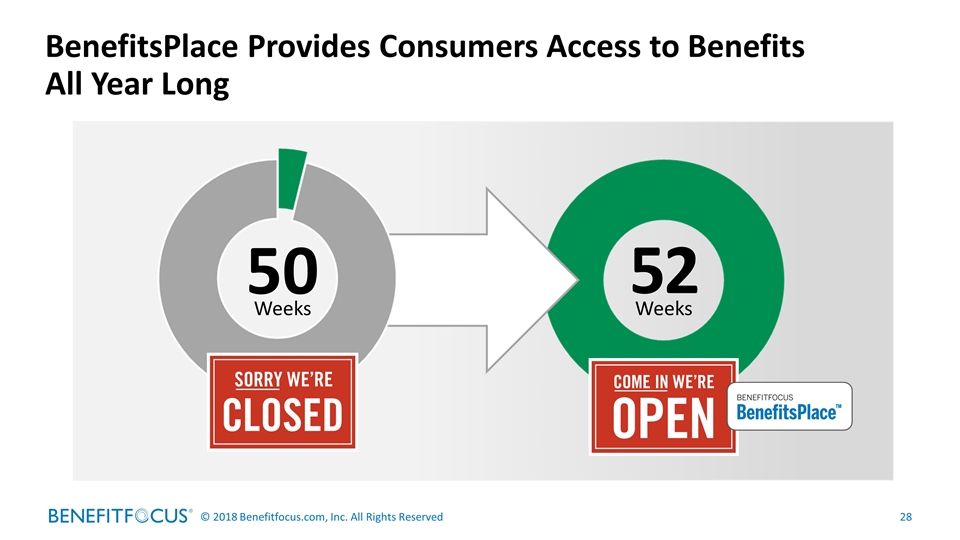
BenefitsPlace Provides Consumers Access to Benefits All Year Long 50 Weeks 52 Weeks
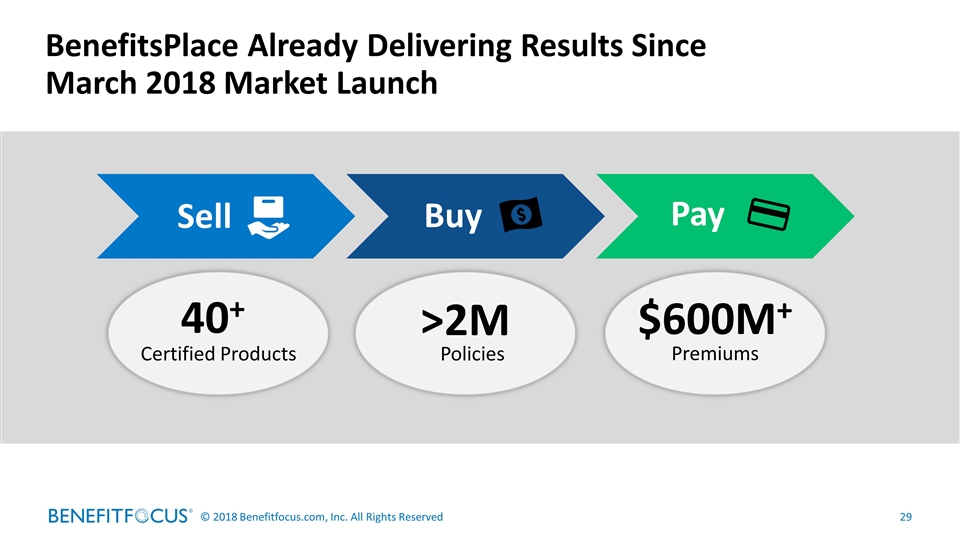
BenefitsPlace Already Delivering Results Since March 2018 Market Launch Sell Buy Pay >2M $600M+ Policies Premiums 40+ Certified Products
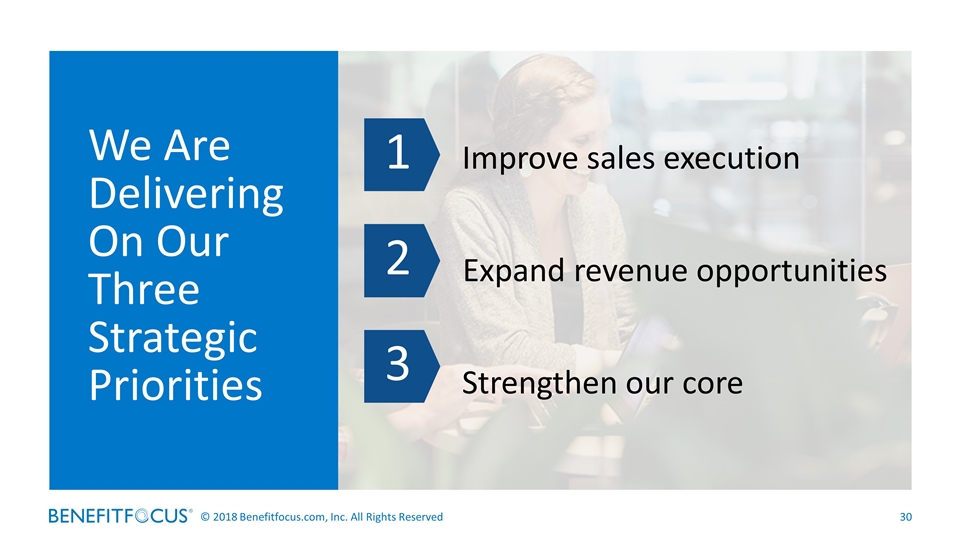
We Are Delivering On Our Three Strategic Priorities 1 2 3 Improve sales execution Expand revenue opportunities Strengthen our core
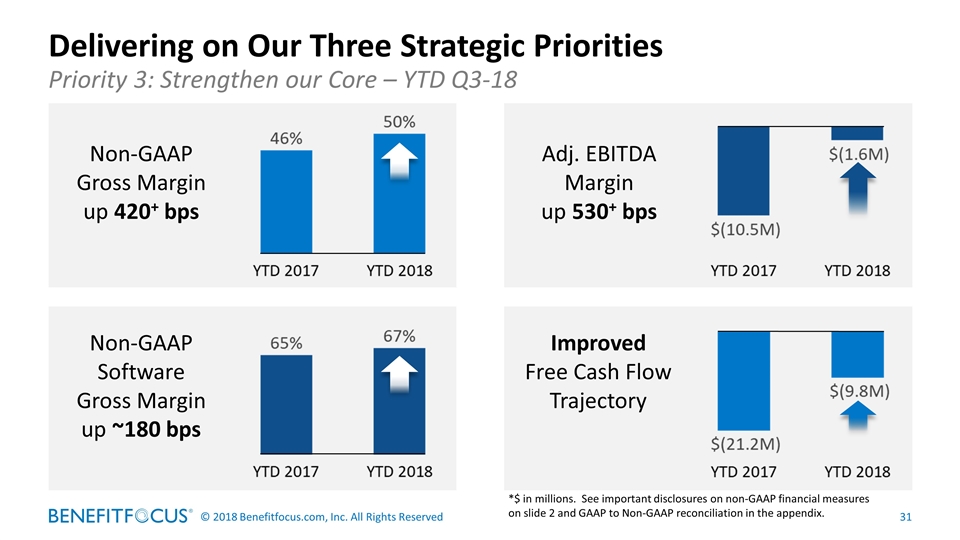
Delivering on Our Three Strategic Priorities Priority 3: Strengthen our Core – YTD Q3-18 Non-GAAP Gross Margin up 420+ bps Non-GAAP Software Gross Margin up ~180 bps Improved Free Cash Flow Trajectory Adj. EBITDA Margin up 530+ bps *$ in millions. See important disclosures on non-GAAP financial measures on slide 2 and GAAP to Non-GAAP reconciliation in the appendix.
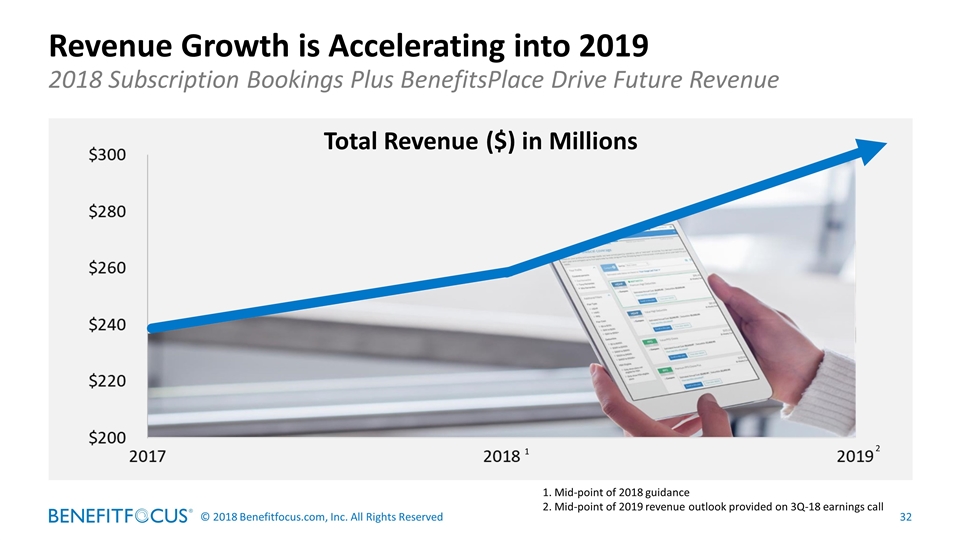
Revenue Growth is Accelerating into 2019 2018 Subscription Bookings Plus BenefitsPlace Drive Future Revenue Total Revenue ($) in Millions 1 2 Mid-point of 2018 guidance Mid-point of 2019 revenue outlook provided on 3Q-18 earnings call
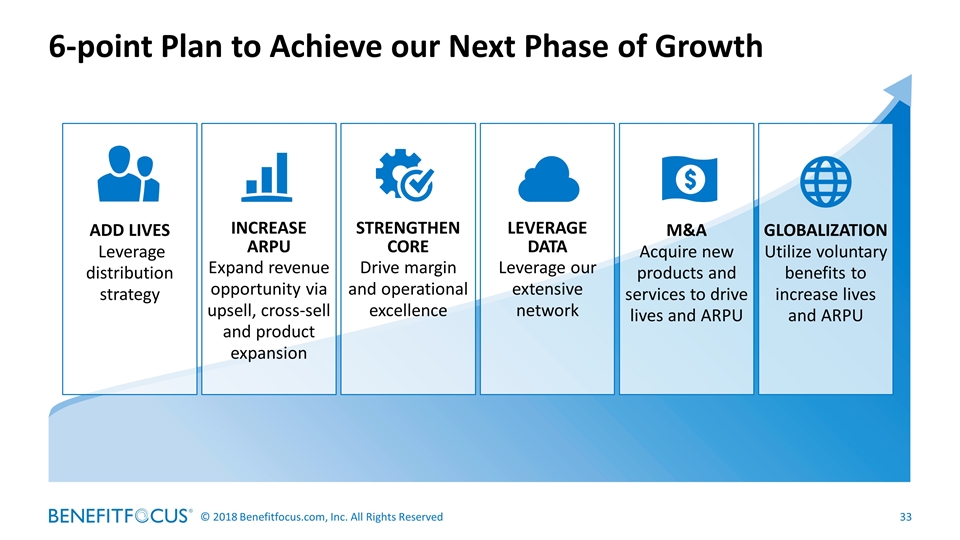
6-point Plan to Achieve our Next Phase of Growth ADD LIVES Leverage distribution strategy INCREASE ARPU Expand revenue opportunity via upsell, cross-sell and product expansion STRENGTHEN CORE Drive margin and operational excellence LEVERAGE DATA Leverage our extensive network M&A Acquire new products and services to drive lives and ARPU GLOBALIZATION Utilize voluntary benefits to increase lives and ARPU

Key Takeaways Building on a solid foundation Changing the game with BenefitsPlace Accelerating growth and performance
Our Consumer and Platform Strategy Annmarie Fini Senior Vice President, Platform Strategy
Key Topics Consumer-centric network Personalizing the consumer experience 1 2 BenefitsPlace value drivers 3
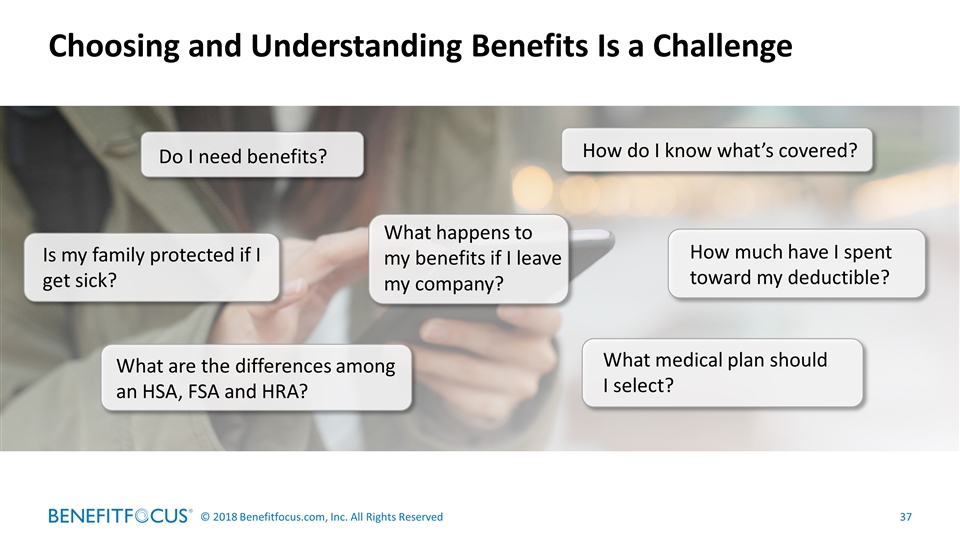
Choosing and Understanding Benefits Is a Challenge Is my family protected if I get sick? How much have I spent toward my deductible? How do I know what’s covered? Do I need benefits? What medical plan should I select? What happens to my benefits if I leave my company? What are the differences among an HSA, FSA and HRA?

We are all driven by the moments that matter.
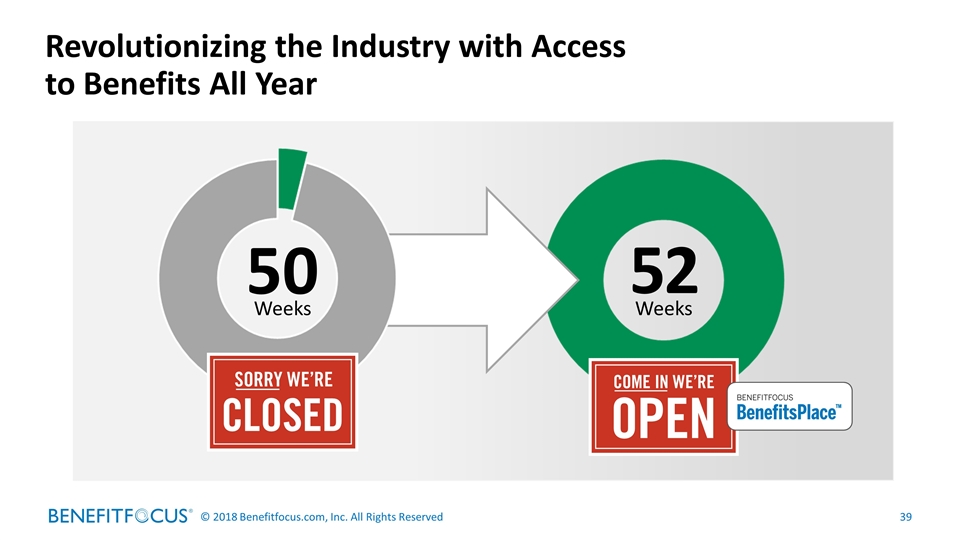
Revolutionizing the Industry with Access to Benefits All Year 50 Weeks 52 Weeks
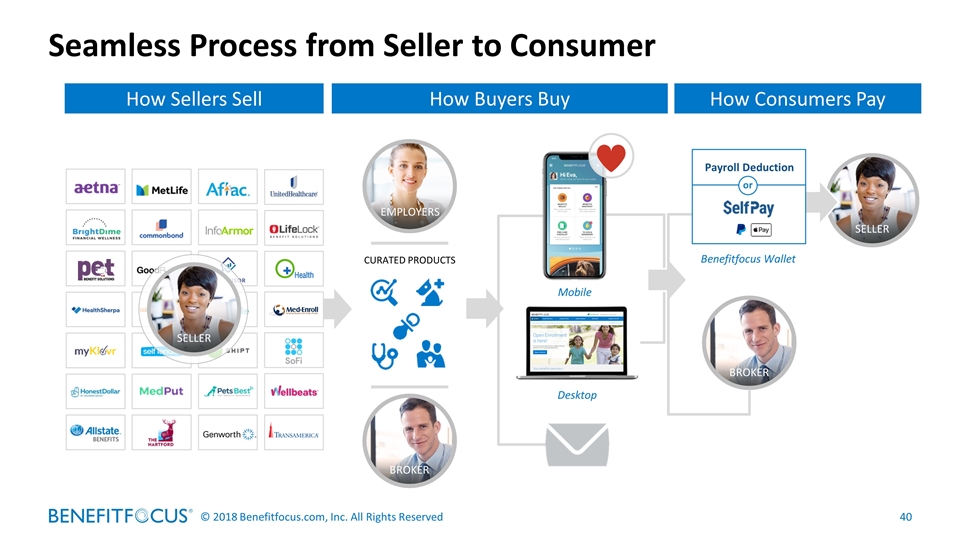
Seamless Process from Seller to Consumer SELLER How Sellers Sell BROKER EMPLOYERS CURATED PRODUCTS Mobile Desktop How Buyers Buy SELLER BROKER Benefitfocus Wallet Payroll Deduction or How Consumers Pay
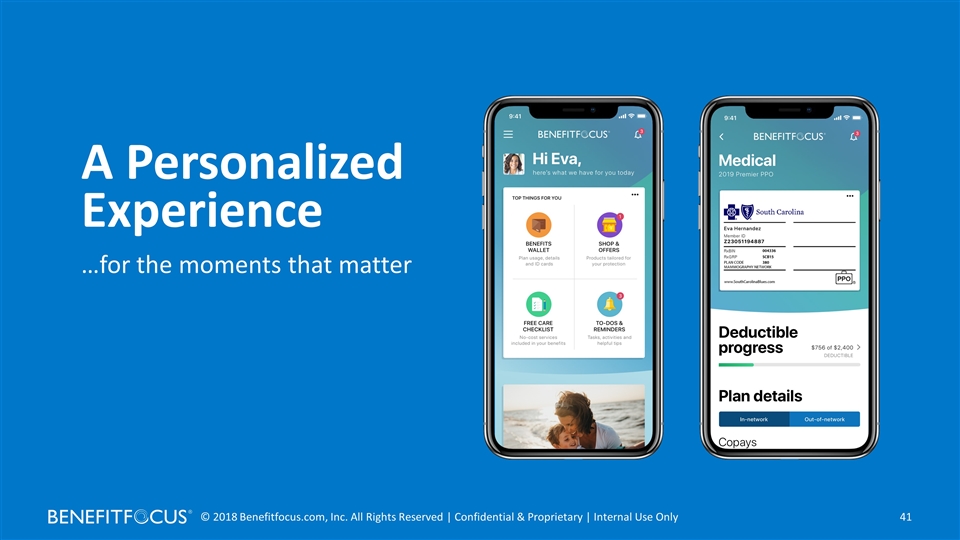
A Personalized Experience …for the moments that matter
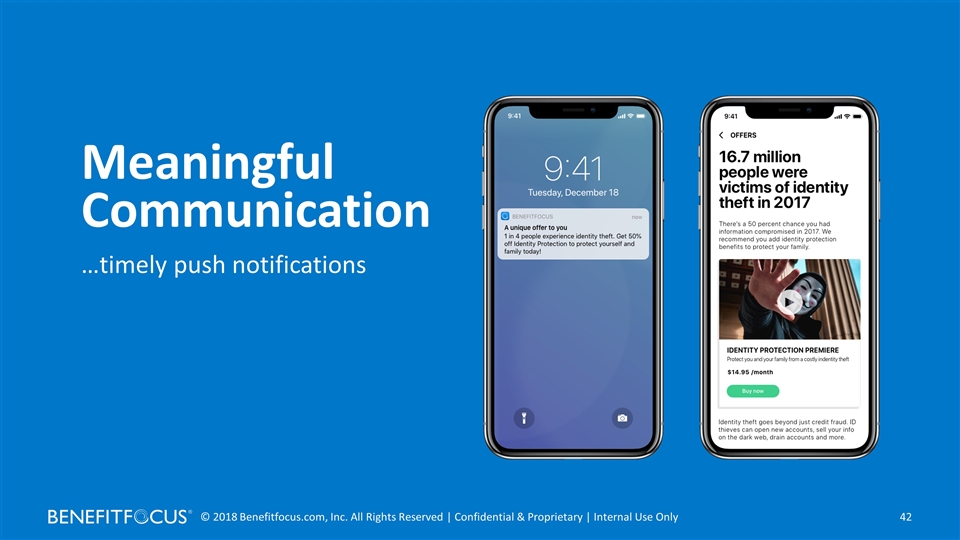
Meaningful Communication …timely push notifications
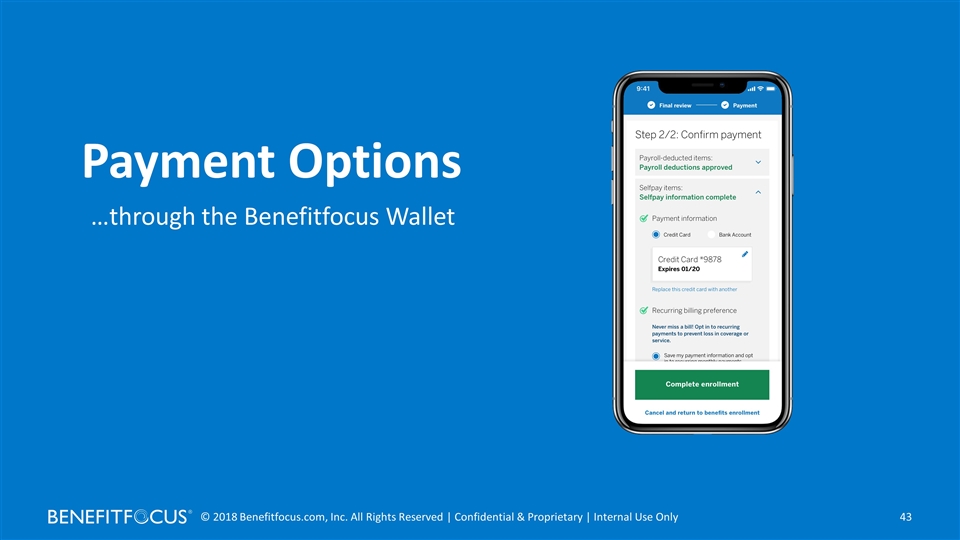
…through the Benefitfocus Wallet Payment Options
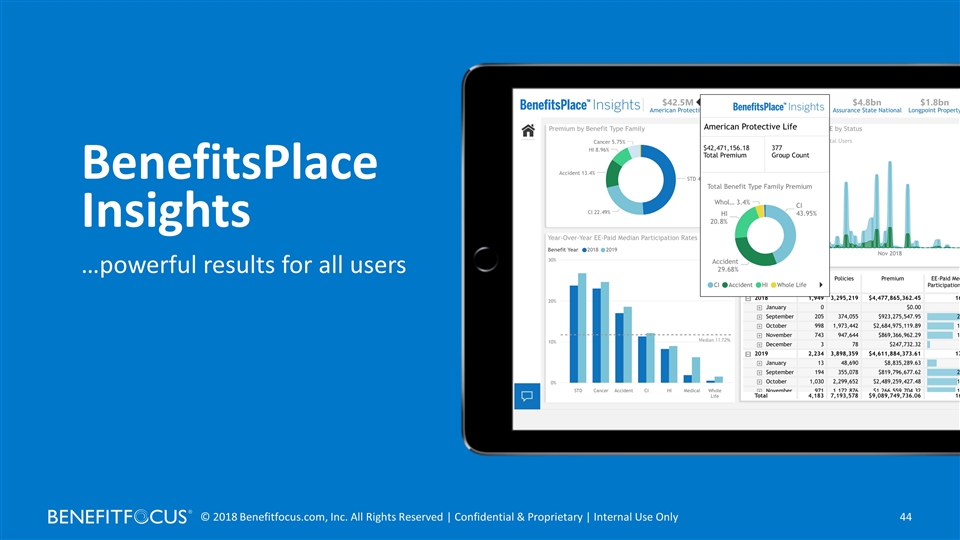
BenefitsPlace Insights …powerful results for all users
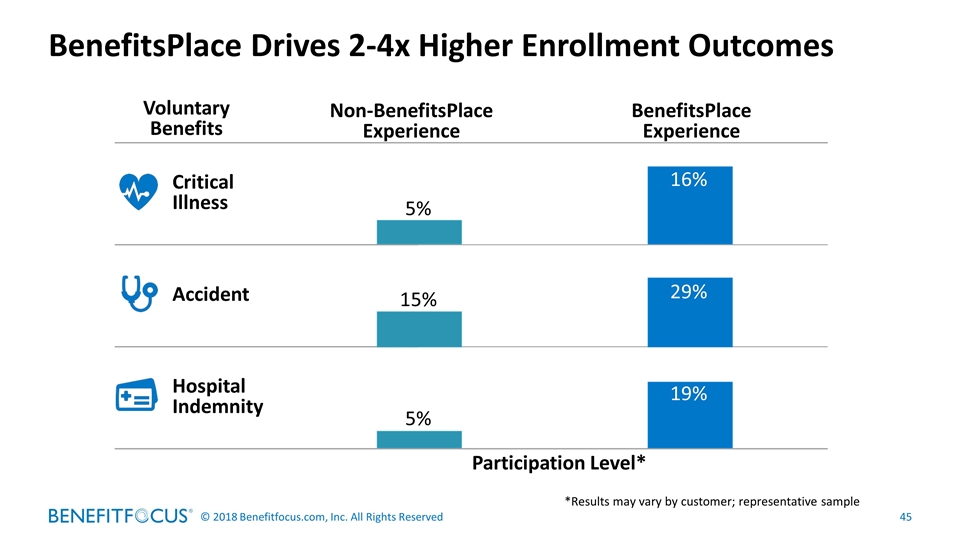
BenefitsPlace Drives 2-4x Higher Enrollment Outcomes Voluntary Benefits Non-BenefitsPlace Experience BenefitsPlace Experience Critical Illness Accident Hospital Indemnity 16% 29% 19% 15% 5% 5% Participation Level* *Results may vary by customer; representative sample
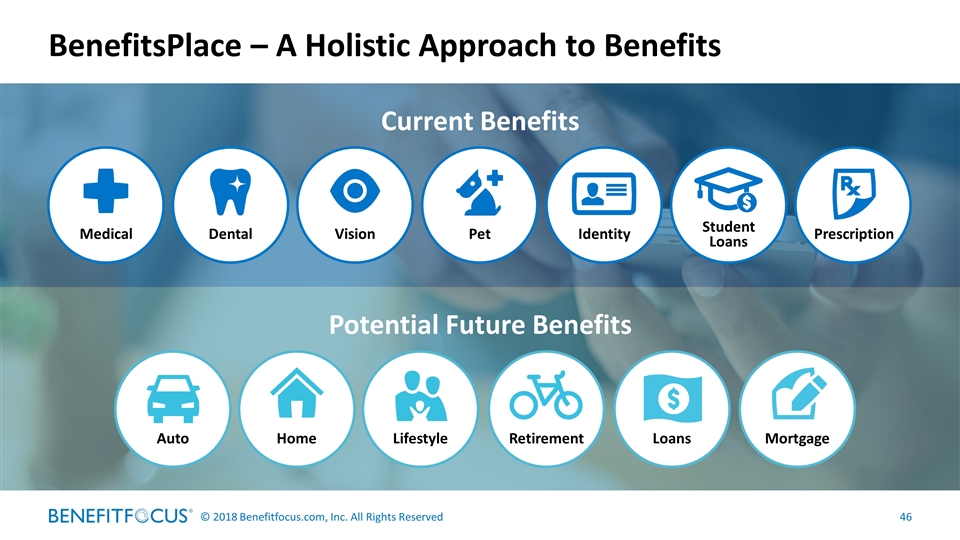
Potential Future Benefits Current Benefits BenefitsPlace – A Holistic Approach to Benefits Identity Medical Dental Vision Pet Student Loans Prescription Auto Lifestyle Home Retirement Mortgage Loans
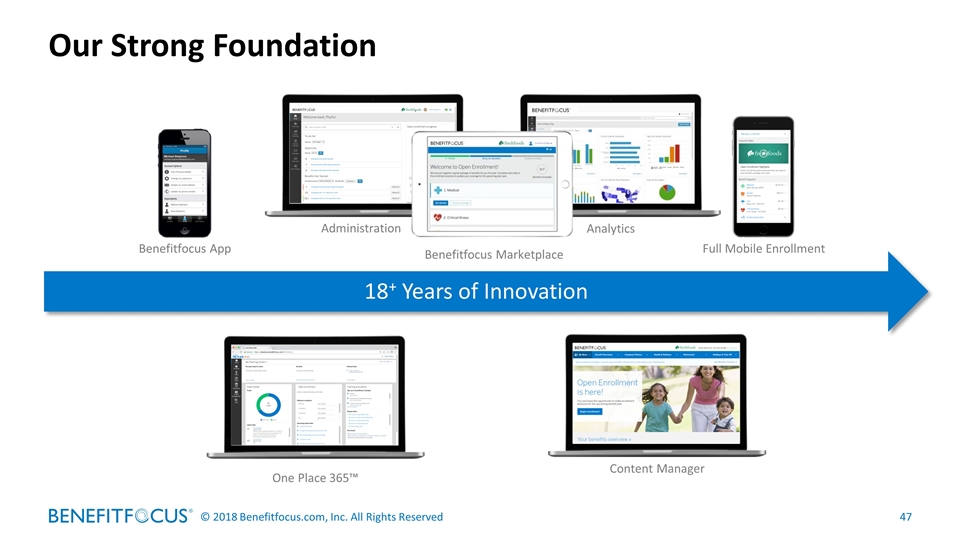
Our Strong Foundation Content Manager One Place 365™ Benefitfocus App Benefitfocus Marketplace Administration Analytics Full Mobile Enrollment 18+ Years of Innovation
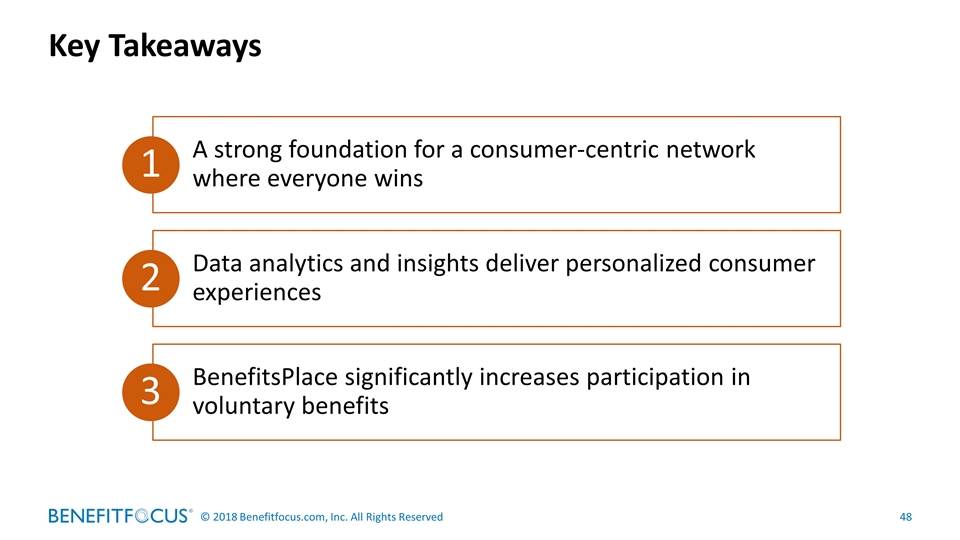
Key Takeaways A strong foundation for a consumer-centric network where everyone wins Data analytics and insights deliver personalized consumer experiences 1 2 BenefitsPlace significantly increases participation in voluntary benefits 3

Growth Execution Strategy Rob Dahdah Executive VP, Global Sales and Marketing
Market strategy and distribution model Strategic pivots and impact to lives and ARPU Differentiated value proposition 1 3 2 Key Topics
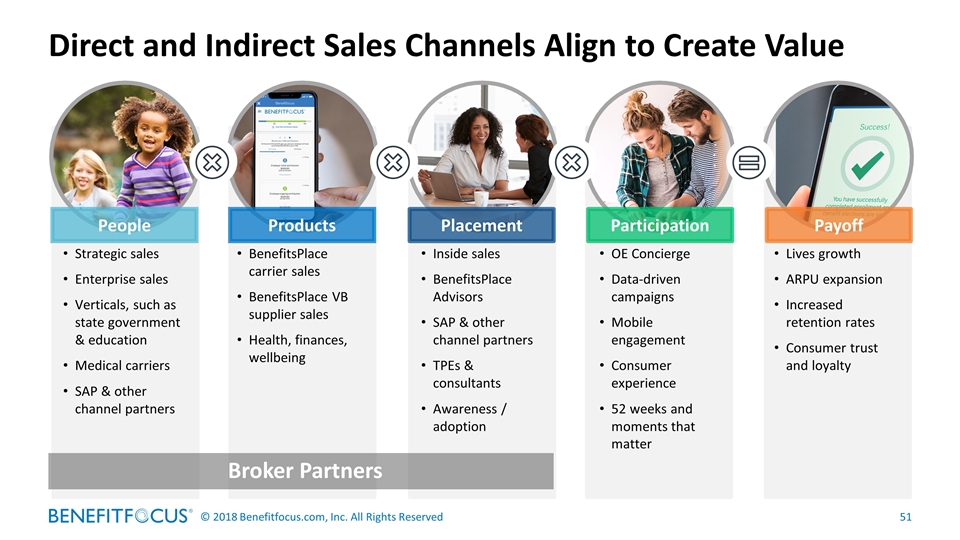
Direct and Indirect Sales Channels Align to Create Value People Products Placement Participation Payoff OE Concierge Data-driven campaigns Mobile engagement Consumer experience 52 weeks and moments that matter Inside sales BenefitsPlace Advisors SAP & other channel partners TPEs & consultants Awareness / adoption BenefitsPlace carrier sales BenefitsPlace VB supplier sales Health, finances, wellbeing Strategic sales Enterprise sales Verticals, such as state government & education Medical carriers SAP & other channel partners Lives growth ARPU expansion Increased retention rates Consumer trust and loyalty Broker Partners
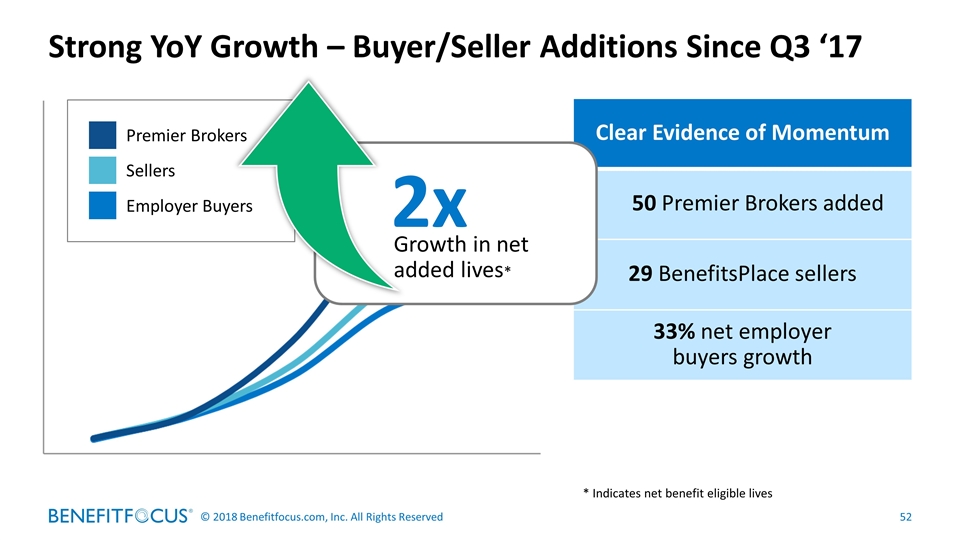
Strong YoY Growth – Buyer/Seller Additions Since Q3 ‘17 Premier Brokers Sellers Employer Buyers Clear Evidence of Momentum 50 Premier Brokers added 29 BenefitsPlace sellers 33% net employer buyers growth 2x Growth in net added lives* * Indicates net benefit eligible lives
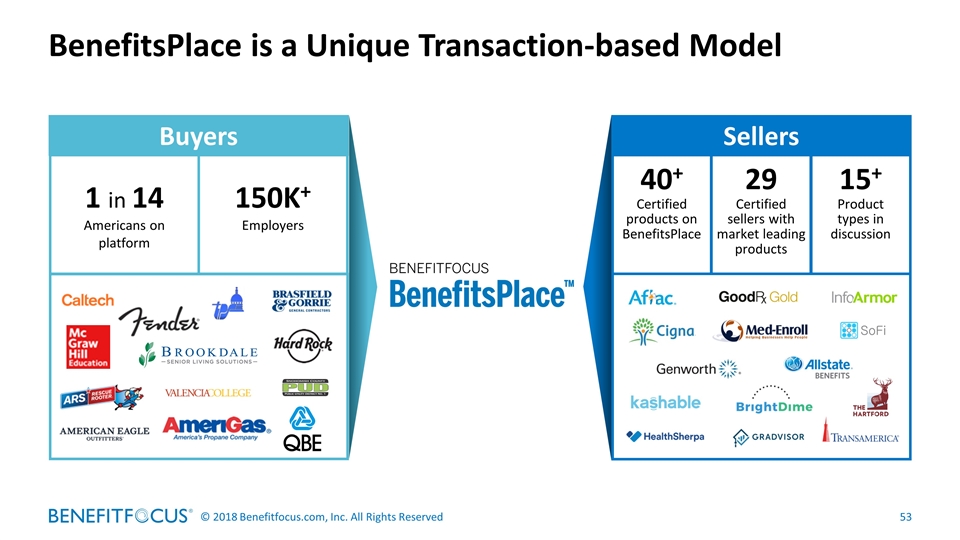
BenefitsPlace is a Unique Transaction-based Model Sellers 29 Certified sellers with market leading products 15+ Product types in discussion 40+ Certified products on BenefitsPlace Buyers 1 in 14 Americans on platform 150K+ Employers
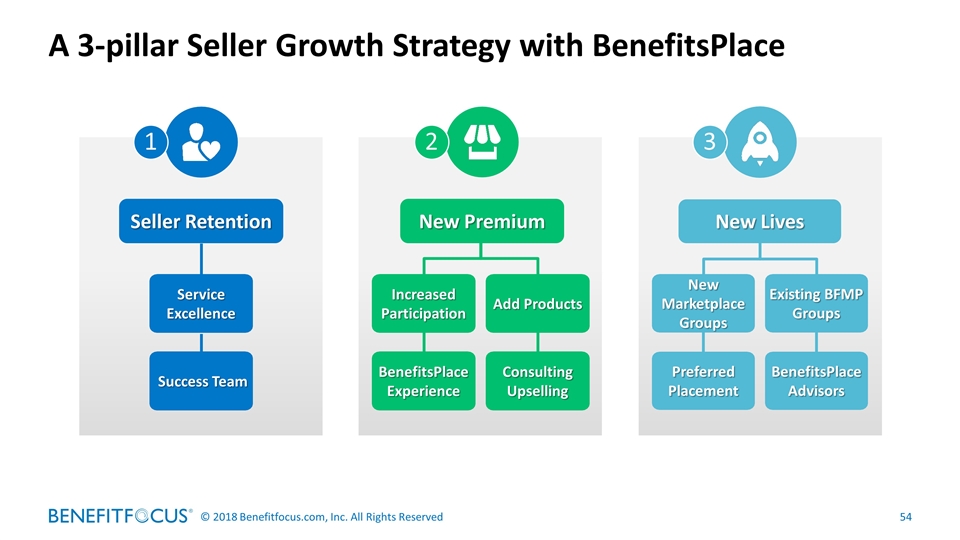
A 3-pillar Seller Growth Strategy with BenefitsPlace Increased Participation New Premium BenefitsPlace Experience Consulting Upselling Add Products Seller Retention Service Excellence Success Team New Lives Existing BFMP Groups New Marketplace Groups Preferred Placement BenefitsPlace Advisors 1 2 3
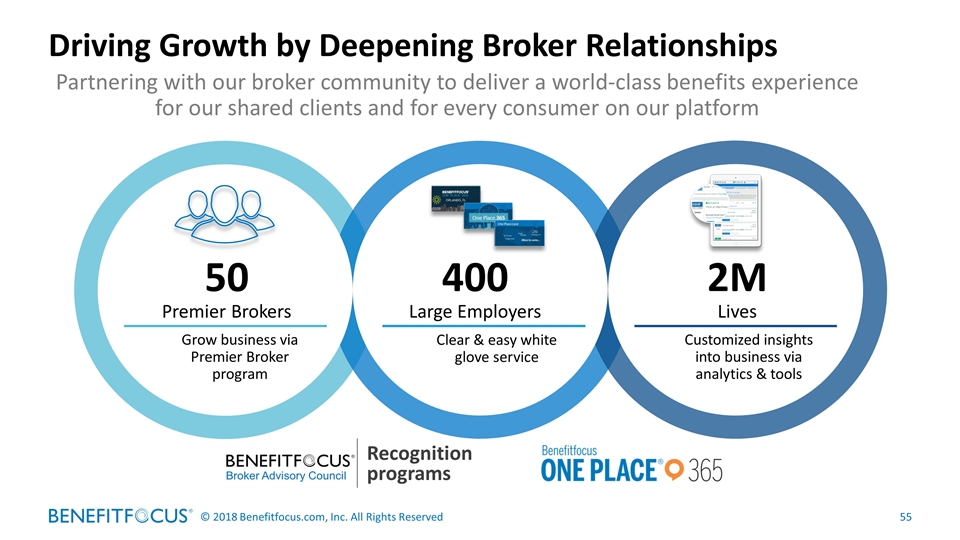
Driving Growth by Deepening Broker Relationships Recognition programs Grow business via Premier Broker program 50 Premier Brokers 2M Lives Customized insights into business via analytics & tools 400 Large Employers Clear & easy white glove service Partnering with our broker community to deliver a world-class benefits experience for our shared clients and for every consumer on our platform
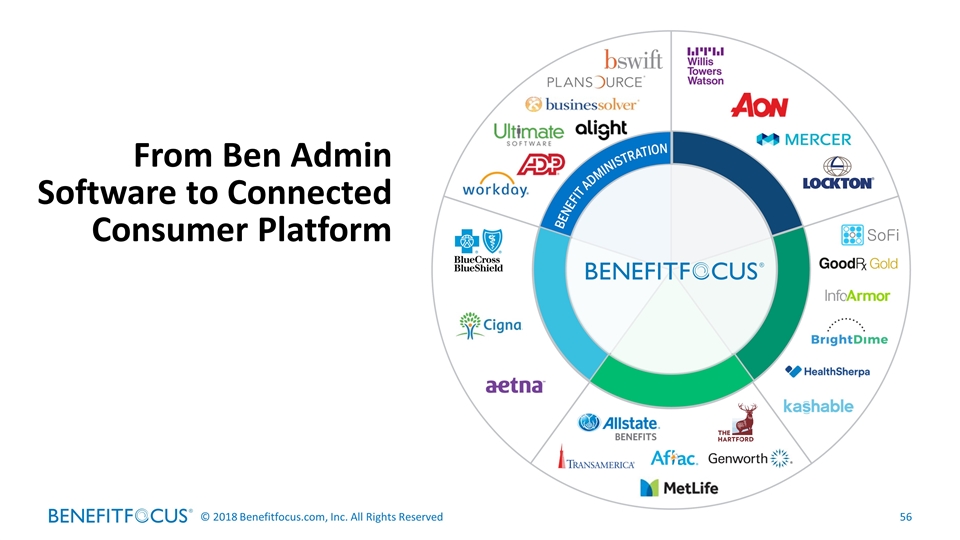
From Ben Admin Software to Connected Consumer Platform
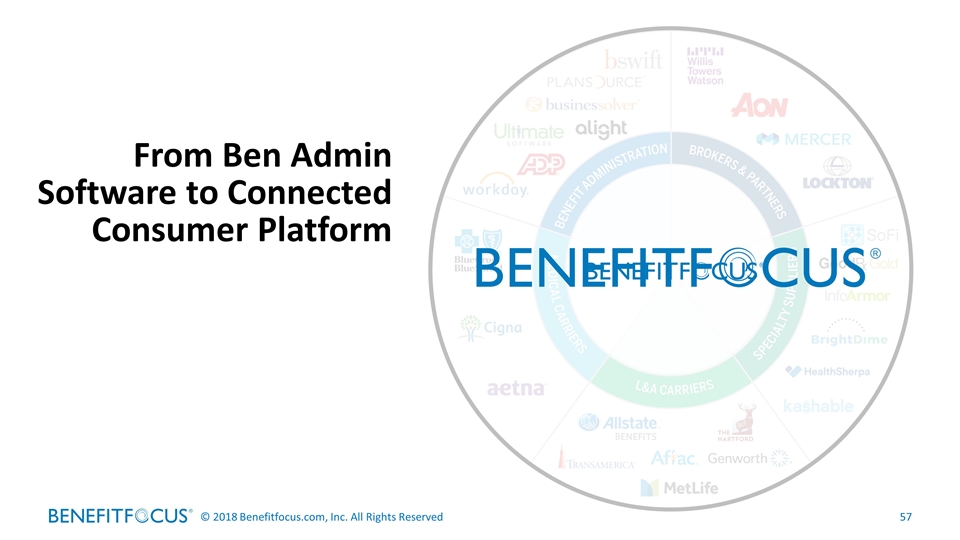
From Ben Admin Software to Connected Consumer Platform
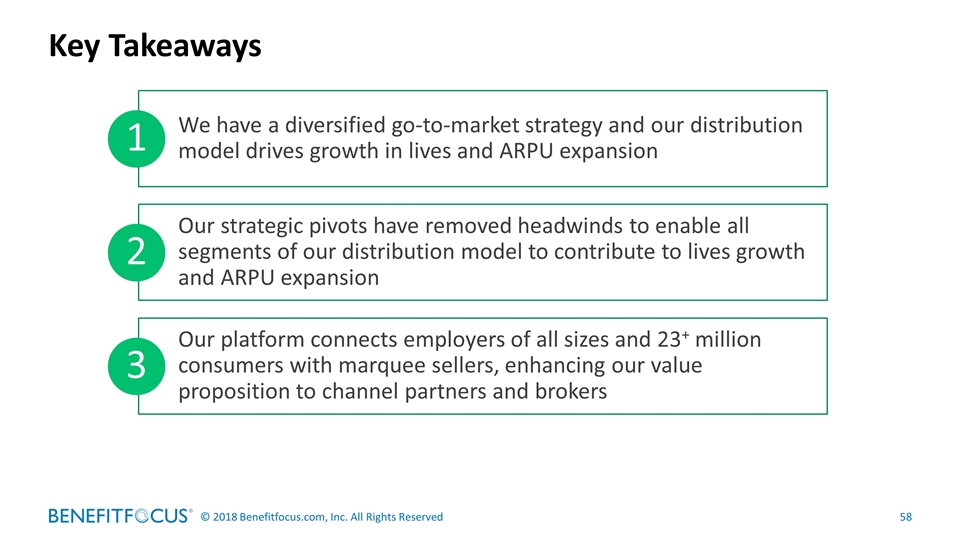
Key Takeaways We have a diversified go-to-market strategy and our distribution model drives growth in lives and ARPU expansion Our strategic pivots have removed headwinds to enable all segments of our distribution model to contribute to lives growth and ARPU expansion Our platform connects employers of all sizes and 23+ million consumers with marquee sellers, enhancing our value proposition to channel partners and brokers 1 3 2


Digitization & Value Creation Bill Pieroni, CEO ACORD

Financial Update Jonathon Dussault, CFO December 18, 2018
Business fundamentals Performance visibility Measuring success 1 3 2 Key Topics
We Are Delivering On Our Three Strategic Priorities 1 2 3 Improve sales execution Expand revenue opportunities Strengthen our core
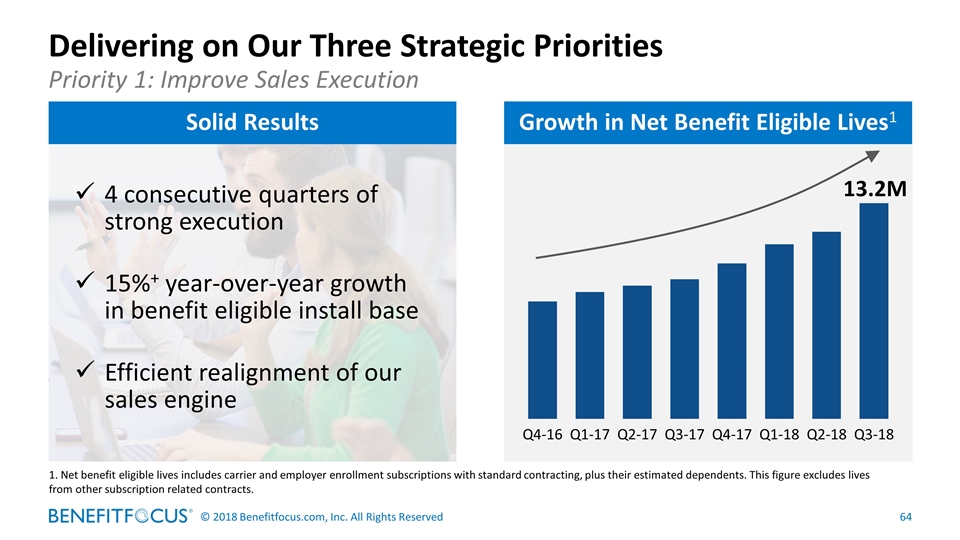
Delivering on Our Three Strategic Priorities Priority 1: Improve Sales Execution Growth in Net Benefit Eligible Lives1 Solid Results 13.2M 4 consecutive quarters of strong execution 15%+ year-over-year growth in benefit eligible install base Efficient realignment of our sales engine 1. Net benefit eligible lives includes carrier and employer enrollment subscriptions with standard contracting, plus their estimated dependents. This figure excludes lives from other subscription related contracts.

Delivering on Our Three Strategic Priorities Priority 2: Expand Revenue Opportunities BenefitsPlace Partners Solid Results YTD 2018 Diversified incremental revenue with BenefitsPlace Increase install base adoption Premier Broker program – signed 50 broker partners
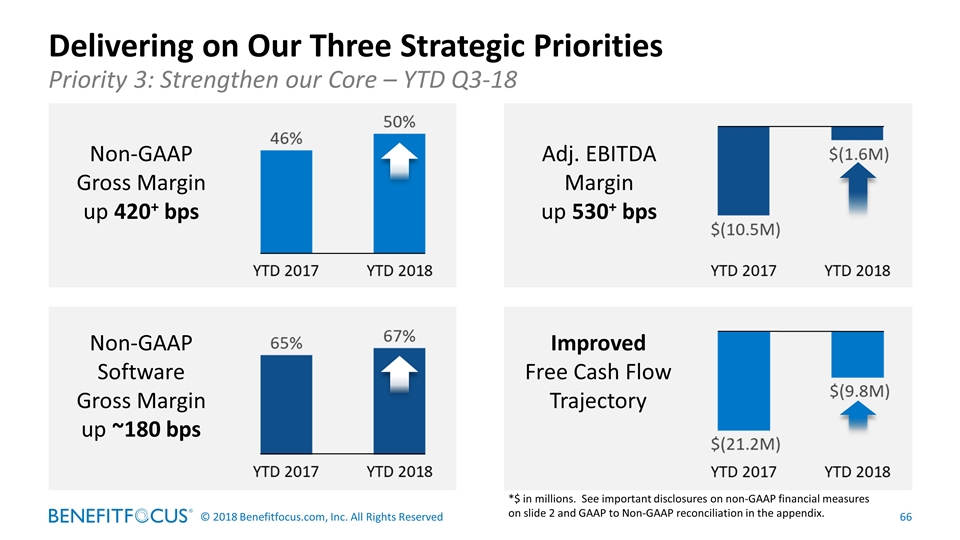
Delivering on Our Three Strategic Priorities Priority 3: Strengthen our Core – YTD Q3-18 Non-GAAP Gross Margin up 420+ bps Non-GAAP Software Gross Margin up ~180 bps Improved Free Cash Flow Trajectory Adj. EBITDA Margin up 530+ bps *$ in millions. See important disclosures on non-GAAP financial measures on slide 2 and GAAP to Non-GAAP reconciliation in the appendix.
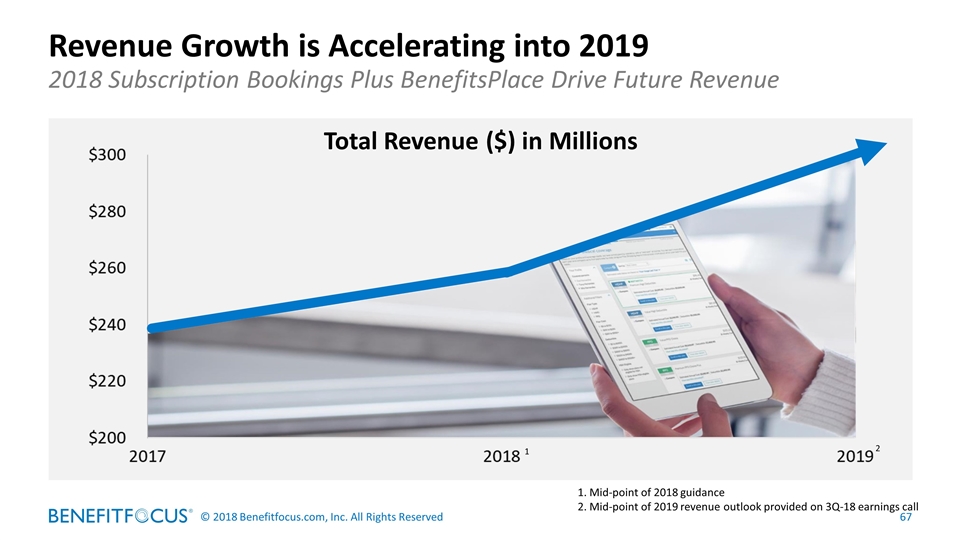
Revenue Growth is Accelerating into 2019 2018 Subscription Bookings Plus BenefitsPlace Drive Future Revenue Total Revenue ($) in Millions 1 2 Mid-point of 2018 guidance Mid-point of 2019 revenue outlook provided on 3Q-18 earnings call
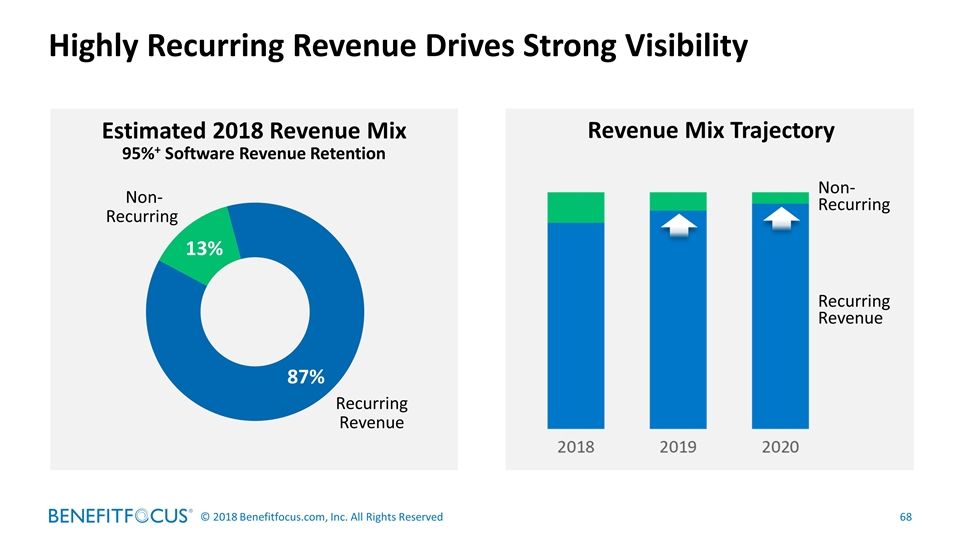
Highly Recurring Revenue Drives Strong Visibility Estimated 2018 Revenue Mix 95%+ Software Revenue Retention Revenue Mix Trajectory Non- Recurring Recurring Revenue Non- Recurring Recurring Revenue
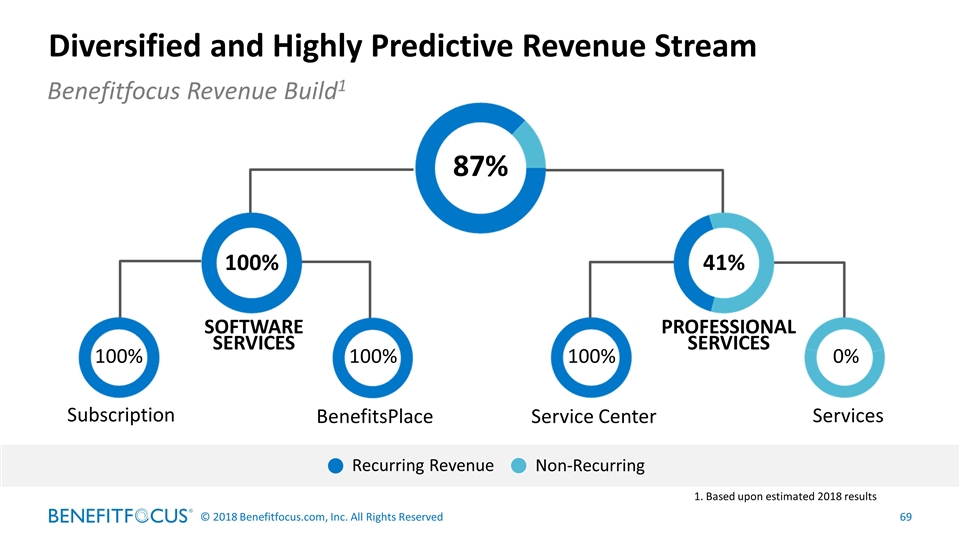
Diversified and Highly Predictive Revenue Stream Benefitfocus Revenue Build1 87% 41% Subscription BenefitsPlace SOFTWARE SERVICES Service Center Services PROFESSIONAL SERVICES 0% 100% 100% 100% 100% Non-Recurring Recurring Revenue 1. Based upon estimated 2018 results
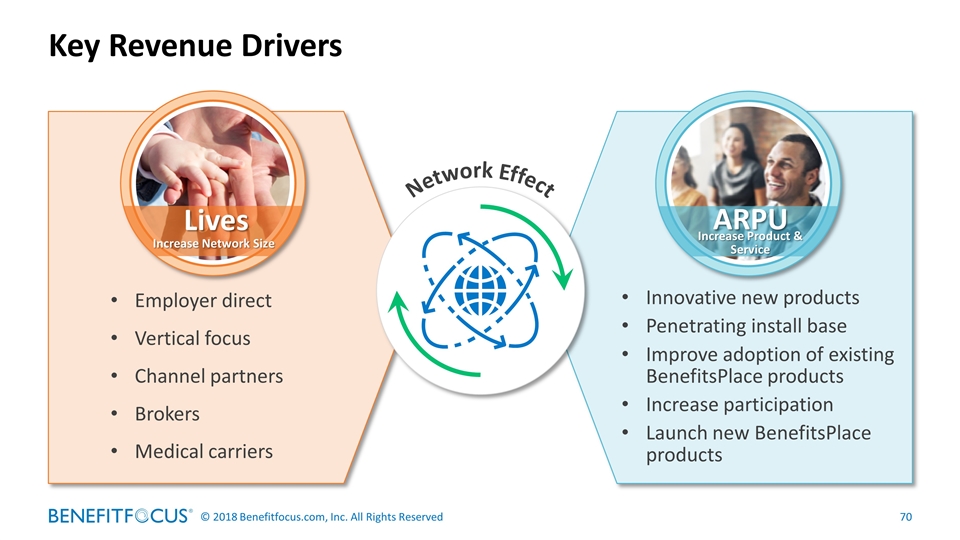
Key Revenue Drivers Employer direct Vertical focus Channel partners Brokers Medical carriers Innovative new products Penetrating install base Improve adoption of existing BenefitsPlace products Increase participation Launch new BenefitsPlace products Lives ARPU Increase Product & Service Increase Network Size Network Effect
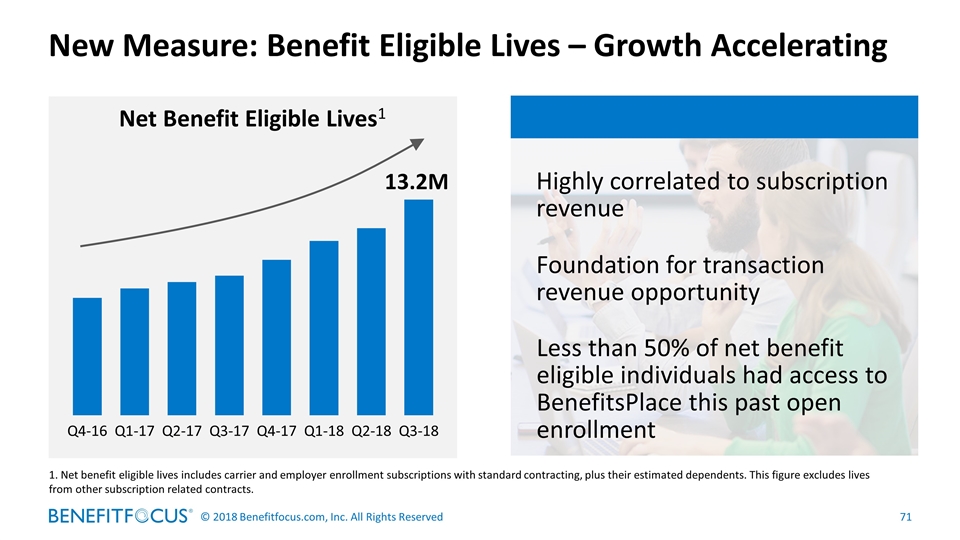
New Measure: Benefit Eligible Lives – Growth Accelerating Net Benefit Eligible Lives1 13.2M Highly correlated to subscription revenue Foundation for transaction revenue opportunity Less than 50% of net benefit eligible individuals had access to BenefitsPlace this past open enrollment 1. Net benefit eligible lives includes carrier and employer enrollment subscriptions with standard contracting, plus their estimated dependents. This figure excludes lives from other subscription related contracts.
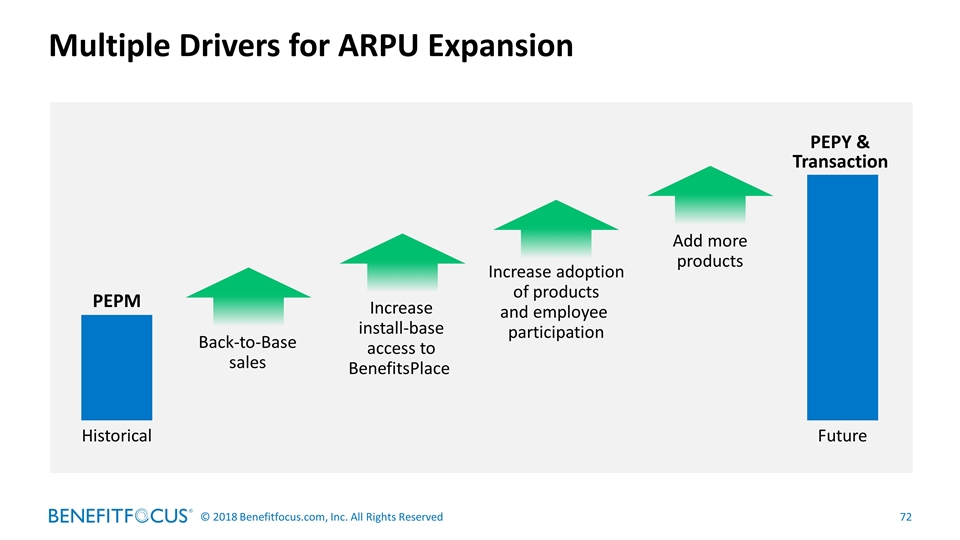
Multiple Drivers for ARPU Expansion Historical PEPM Future PEPY & Transaction Back-to-Base sales Increase install-base access to BenefitsPlace Increase adoption of products and employee participation Add more products

Entire Company Aligned to Deliver Value and Accelerate Growth Consumer engagement in purchasing products Premium sold through platform Number of lives on platform Employer engagement in expanding offers to employees Number & variety of products offered People Products Placement Participation Payoff BenefitsPlace Insights
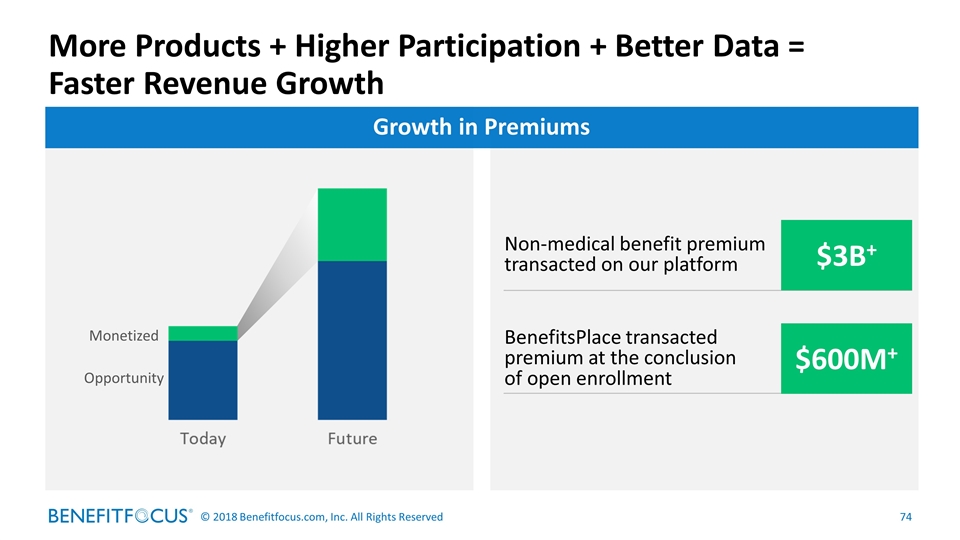
More Products + Higher Participation + Better Data = Faster Revenue Growth Monetized Opportunity Non-medical benefit premium transacted on our platform BenefitsPlace transacted premium at the conclusion of open enrollment $3B+ $600M+ Growth in Premiums
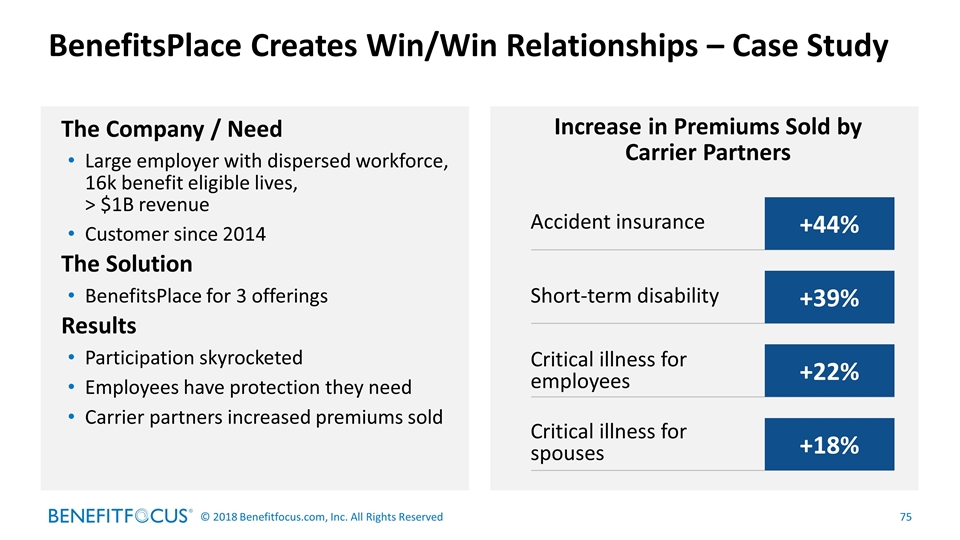
BenefitsPlace Creates Win/Win Relationships – Case Study The Company / Need Large employer with dispersed workforce, 16k benefit eligible lives, > $1B revenue Customer since 2014 The Solution BenefitsPlace for 3 offerings Results Participation skyrocketed Employees have protection they need Carrier partners increased premiums sold Increase in Premiums Sold by Carrier Partners Accident insurance +44% Short-term disability +39% Critical illness for employees +22% Critical illness for spouses +18%
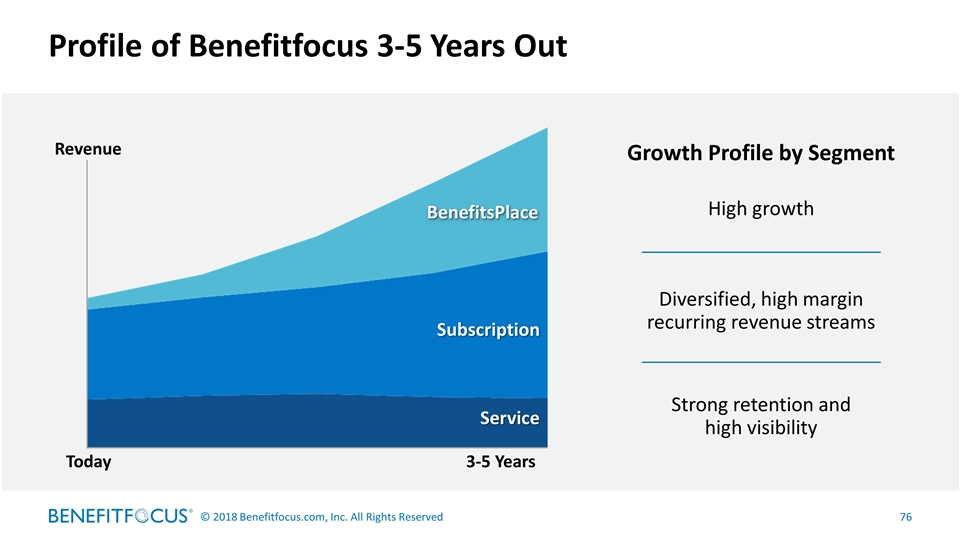
Profile of Benefitfocus 3-5 Years Out Today 3-5 Years Revenue Service Subscription BenefitsPlace Diversified, high margin recurring revenue streams Strong retention and high visibility High growth Growth Profile by Segment
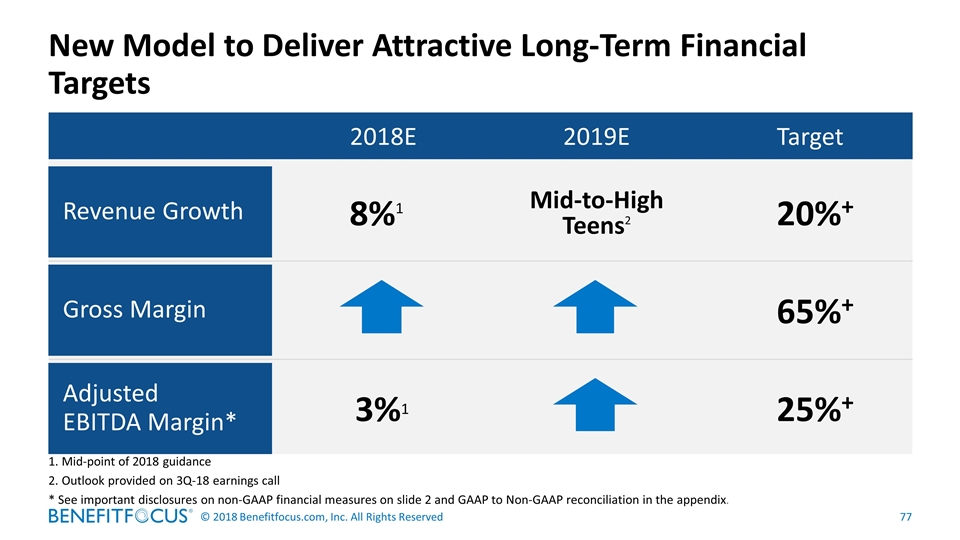
New Model to Deliver Attractive Long-Term Financial Targets 2018E 2019E Target Revenue Growth Gross Margin Adjusted EBITDA Margin* 8%1 3%1 Mid-to-High Teens2 20%+ 65%+ 25%+ 1. Mid-point of 2018 guidance 2. Outlook provided on 3Q-18 earnings call * See important disclosures on non-GAAP financial measures on slide 2 and GAAP to Non-GAAP reconciliation in the appendix.
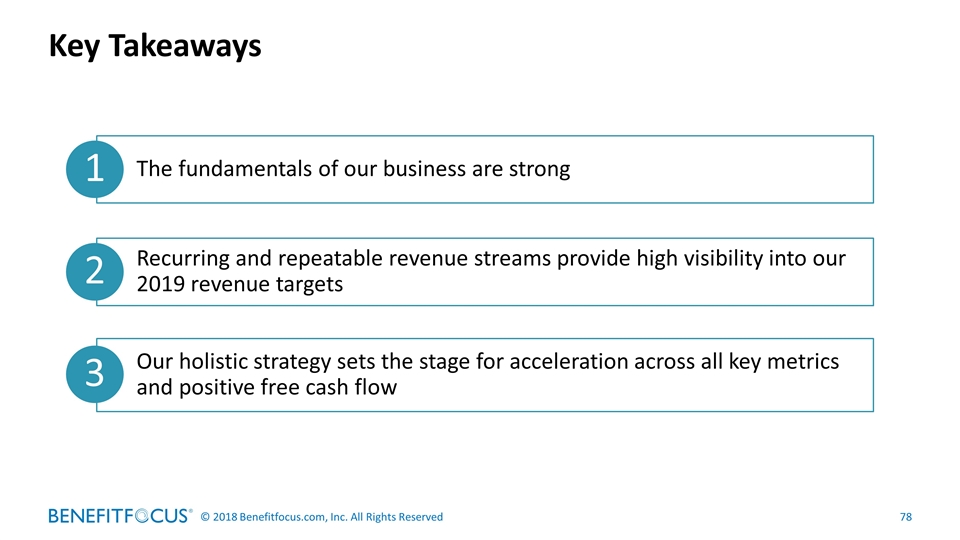
Key Takeaways The fundamentals of our business are strong Recurring and repeatable revenue streams provide high visibility into our 2019 revenue targets Our holistic strategy sets the stage for acceleration across all key metrics and positive free cash flow 1 3 2

Q&A

Closing Thoughts

Thank You

Appendix
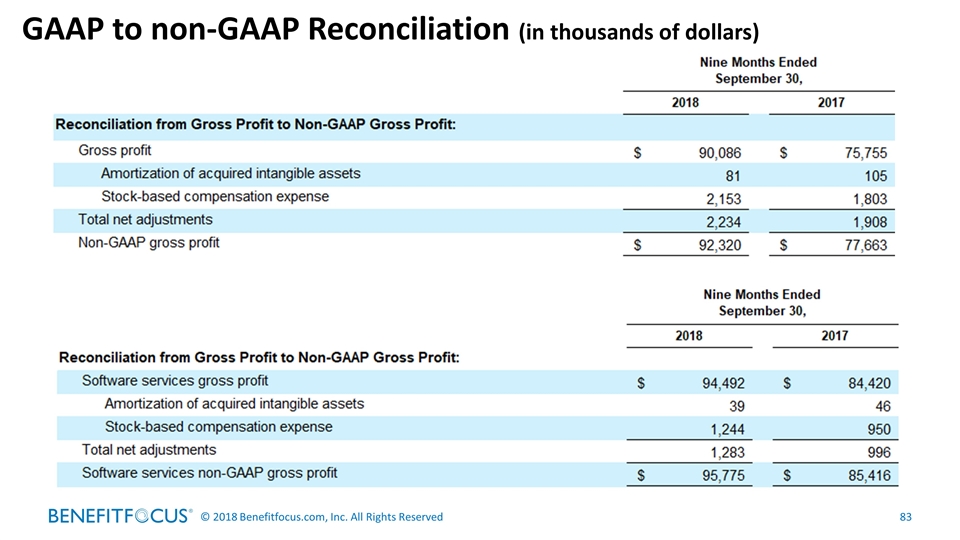
GAAP to non-GAAP Reconciliation (in thousands of dollars)
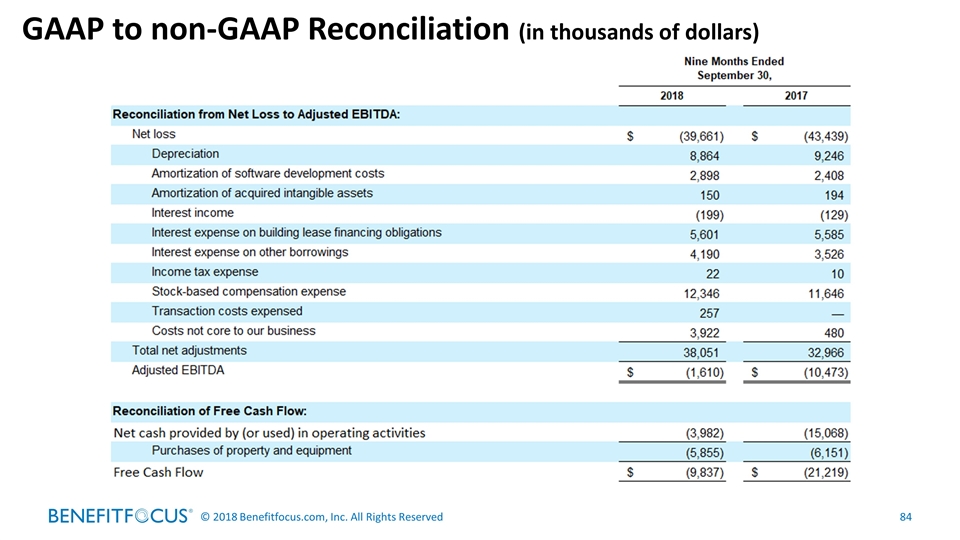
GAAP to non-GAAP Reconciliation (in thousands of dollars)