
Q2 2022 Earnings Presentation August 3, 2022 Exhibit 99.2
Disclaimer Safe Harbor Except for historical information, all of the statements, expectations, and assumptions contained in this presentation are forward-looking statements. Actual results might differ materially from those explicit or implicit in the forward-looking statements. Important factors that could cause actual results to differ materially include: our need to increase sales and achieve consistent GAAP profitability; fluctuations in our financial results; our ability to maintain our culture and recruit, integrate and retain qualified personnel, including on our board of directors; our ability to compete effectively and implement our growth strategy; our reliance on channel partners; market developments and opportunities; the need to innovate and provide useful products and services; risks related to changing healthcare and other applicable regulations; the immature and volatile nature of the market for our products and services; privacy, security and other risks associated with our business; management of growth; volatility and uncertainty in the global economy and financial markets in light of the evolving COVID-19 pandemic and war in Ukraine; and the other risk factors set forth from time to time in our SEC filings, copies of which are available free of charge within the Investor Relations section of the Benefitfocus website at https://investor.benefitfocus.com/sec-filings or upon request from our Investor Relations Department. Benefitfocus assumes no obligation and does not intend to update these forward-looking statements, except as required by law.
Disclaimer Non-GAAP Financial Measures The company uses certain non-GAAP financial measures in this presentation, including non-GAAP gross profit, operating income/loss, net loss/income, net loss/income per common share, adjusted EBITDA and free cash flow. Generally, a non-GAAP financial measure is a numerical measure of a company’s performance or financial position that either excludes or includes amounts that are not normally excluded or included in the most directly comparable measure calculated and presented in accordance with GAAP. Non-GAAP gross profit, operating income/loss, net loss/income and net loss/income per common share exclude stock-based compensation expenses, amortization of acquisition-related intangible assets, transaction and acquisition-related costs expensed, expense related to the impairment of goodwill, intangible assets and long-lived assets, gain or loss on extinguishment of debt, change in fair value of contingently returnable consideration and costs not core to our business. We define adjusted EBITDA as net loss before net interest, taxes, and depreciation and amortization expense, adjusted to eliminate stock-based compensation expense; transaction and acquisition-related costs expensed; restructuring costs; impairment of goodwill, intangible assets and long-lived assets; gain or loss on extinguishment of debt; other costs not core to our business; loss on settlement of lawsuits; and, now, changes in fair value of contingently returnable consideration. The revision to our definition of adjusted EBITDA had no impact on our reported adjusted EBITDA in prior periods. We define free cash flow as cash provided by or used in operating activities less capital expenditures, adjusted to eliminate cash paid for restructuring costs. Please note that other companies might define their non-GAAP financial measures differently than we do. Management presents these non-GAAP financial measures in this presentation because it considers them to be important supplemental measures of performance. Management uses these non-GAAP financial measures for planning purposes, including analysis of the company's performance against prior periods, the preparation of operating budgets and to determine appropriate levels of operating and capital investments. Management believes that these non-GAAP financial measures provide additional insight for analysts and investors in evaluating the company's financial and operational performance. Management also intends to provide these non-GAAP financial measures as part of the company’s future earnings discussions and, therefore, their inclusion should provide consistency in the company’s financial reporting. Non-GAAP financial measures have limitations as an analytical tool. Investors are encouraged to review the reconciliation of the non-GAAP measures to their most directly comparable GAAP measures provided in this presentation, including in the accompanying tables.

Matt Levin Chief Executive Officer
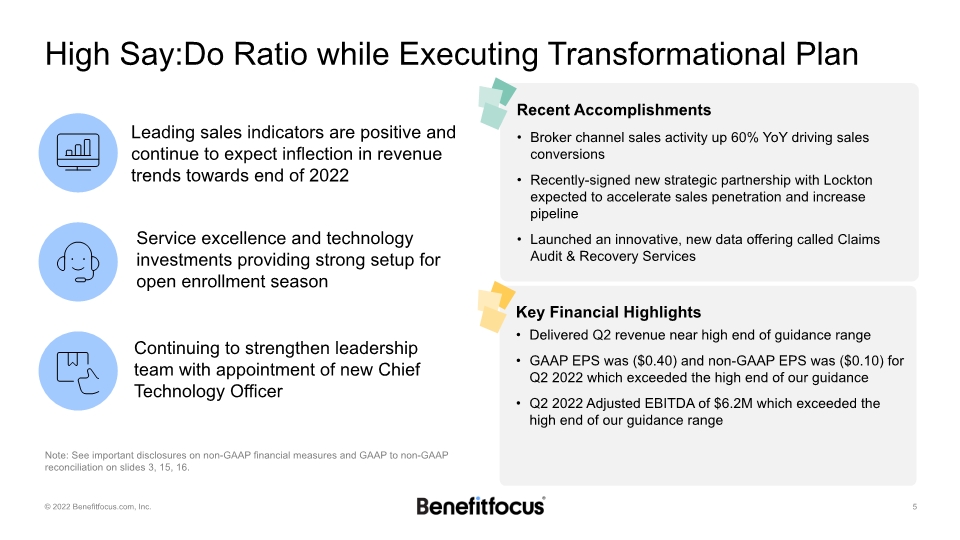
High Say:Do Ratio while Executing Transformational Plan Continuing to strengthen leadership team with appointment of new Chief Technology Officer Recent Accomplishments Broker channel sales activity up 60% YoY driving sales conversions Recently-signed new strategic partnership with Lockton expected to accelerate sales penetration and increase pipeline Launched an innovative, new data offering called Claims Audit & Recovery Services Key Financial Highlights Delivered Q2 revenue near high end of guidance range GAAP EPS was ($0.40) and non-GAAP EPS was ($0.10) for Q2 2022 which exceeded the high end of our guidance Q2 2022 Adjusted EBITDA of $6.2M which exceeded the high end of our guidance range Note: See important disclosures on non-GAAP financial measures and GAAP to non-GAAP reconciliation on slides 3, 15, 16. Leading sales indicators are positive and continue to expect inflection in revenue trends towards end of 2022 Service excellence and technology investments providing strong setup for open enrollment season
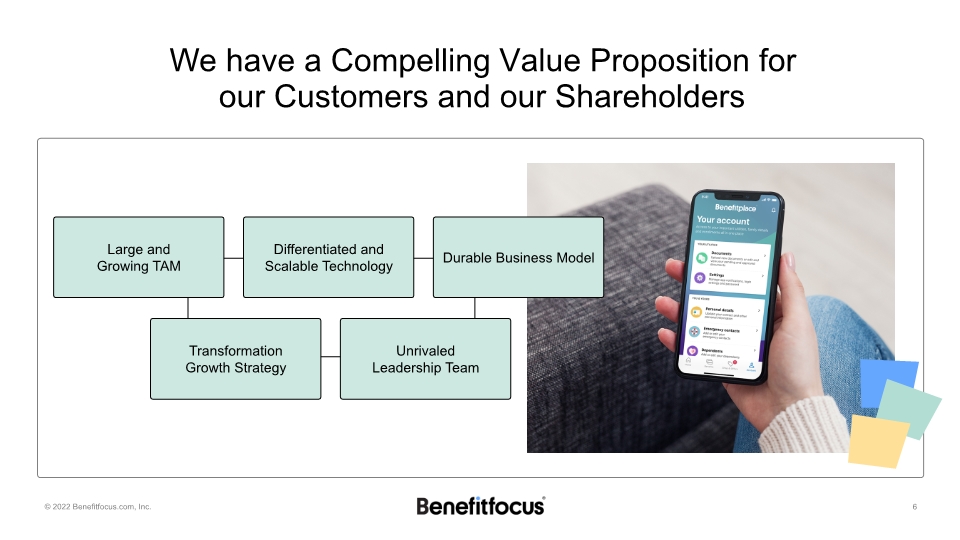
We have a Compelling Value Proposition for our Customers and our Shareholders

Alpana Wegner Chief Financial Officer
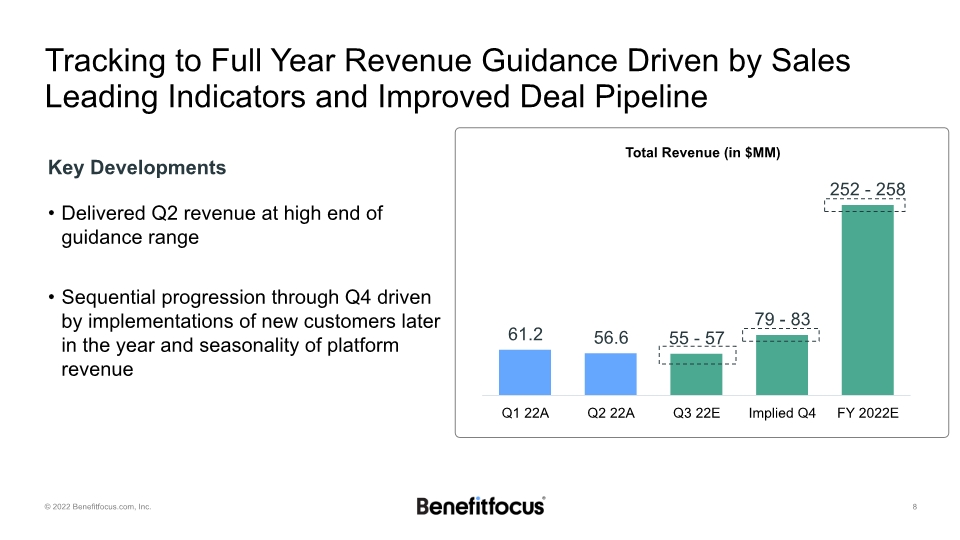
Tracking to Full Year Revenue Guidance Driven by Sales Leading Indicators and Improved Deal Pipeline Key Developments Delivered Q2 revenue at high end of guidance range Sequential progression through Q4 driven by implementations of new customers later in the year and seasonality of platform revenue Total Revenue (in $MM)
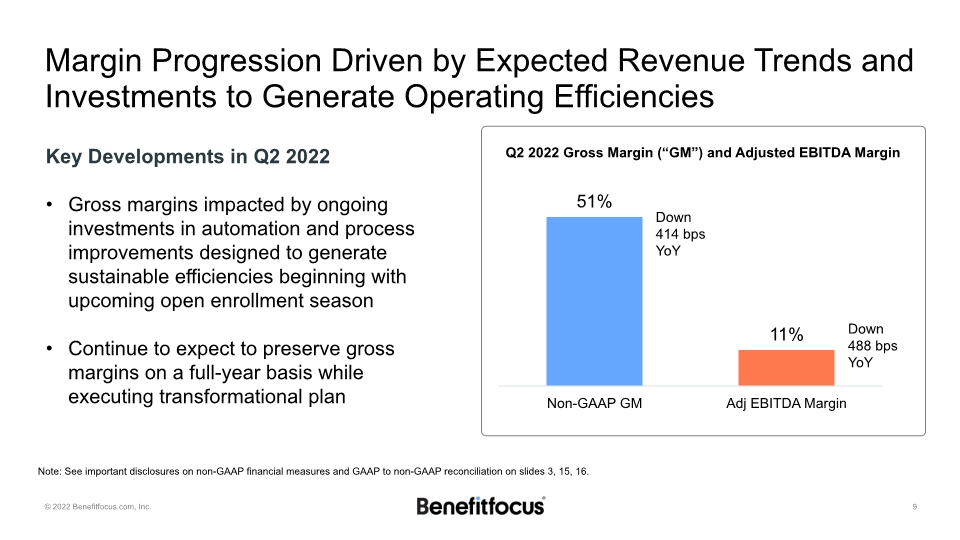
Margin Progression Driven by Expected Revenue Trends and Investments to Generate Operating Efficiencies Note: See important disclosures on non-GAAP financial measures and GAAP to non-GAAP reconciliation on slides 3, 15, 16. Key Developments in Q2 2022 Gross margins impacted by ongoing investments in automation and process improvements designed to generate sustainable efficiencies beginning with upcoming open enrollment season Continue to expect to preserve gross margins on a full-year basis while executing transformational plan Q2 2022 Gross Margin (“GM”) and Adjusted EBITDA Margin Down 414 bps YoY Down 488 bps YoY
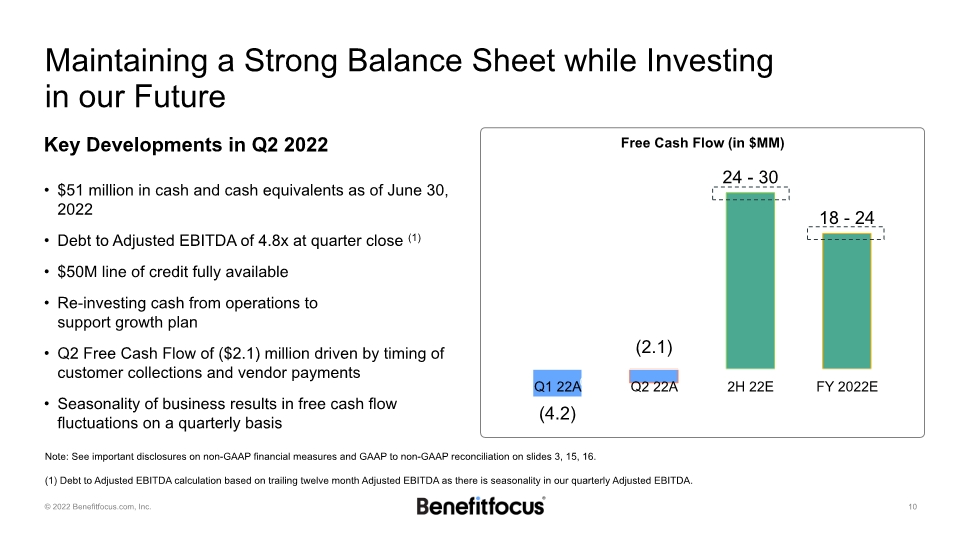
Maintaining a Strong Balance Sheet while Investing in our Future Key Developments in Q2 2022 $51 million in cash and cash equivalents as of June 30, 2022 Debt to Adjusted EBITDA of 4.8x at quarter close (1) $50M line of credit fully available Re-investing cash from operations to support growth plan Q2 Free Cash Flow of ($2.1) million driven by timing of customer collections and vendor payments Seasonality of business results in free cash flow fluctuations on a quarterly basis Note: See important disclosures on non-GAAP financial measures and GAAP to non-GAAP reconciliation on slides 3, 15, 16. (1) Debt to Adjusted EBITDA calculation based on trailing twelve month Adjusted EBITDA as there is seasonality in our quarterly Adjusted EBITDA. Free Cash Flow (in $MM) Q1 A
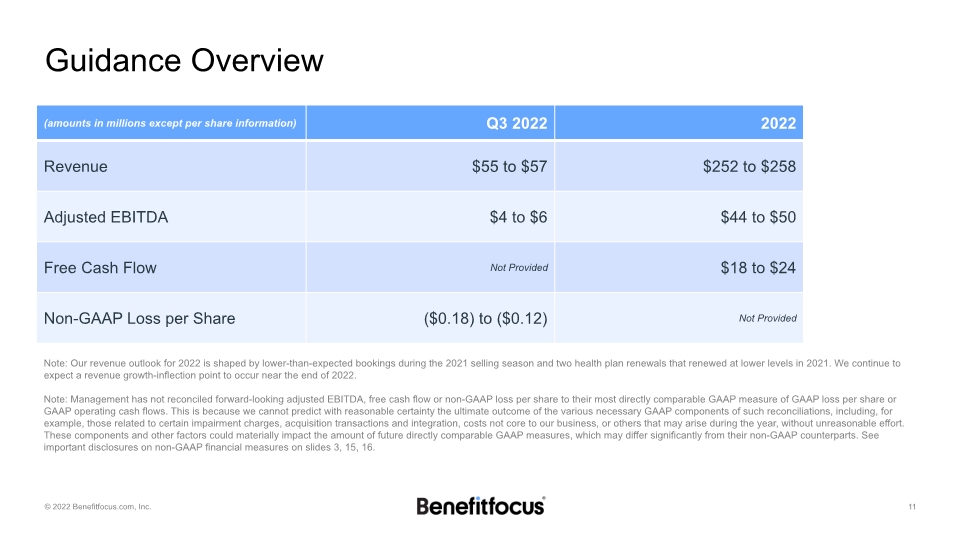
Guidance Overview Note: Our revenue outlook for 2022 is shaped by lower-than-expected bookings during the 2021 selling season and two health plan renewals that renewed at lower levels in 2021. We continue to expect a revenue growth-inflection point to occur near the end of 2022. Note: Management has not reconciled forward-looking adjusted EBITDA, free cash flow or non-GAAP loss per share to their most directly comparable GAAP measure of GAAP loss per share or GAAP operating cash flows. This is because we cannot predict with reasonable certainty the ultimate outcome of the various necessary GAAP components of such reconciliations, including, for example, those related to certain impairment charges, acquisition transactions and integration, costs not core to our business, or others that may arise during the year, without unreasonable effort. These components and other factors could materially impact the amount of future directly comparable GAAP measures, which may differ significantly from their non-GAAP counterparts. See important disclosures on non-GAAP financial measures on slides 3, 15, 16.

Questions?

Appendix
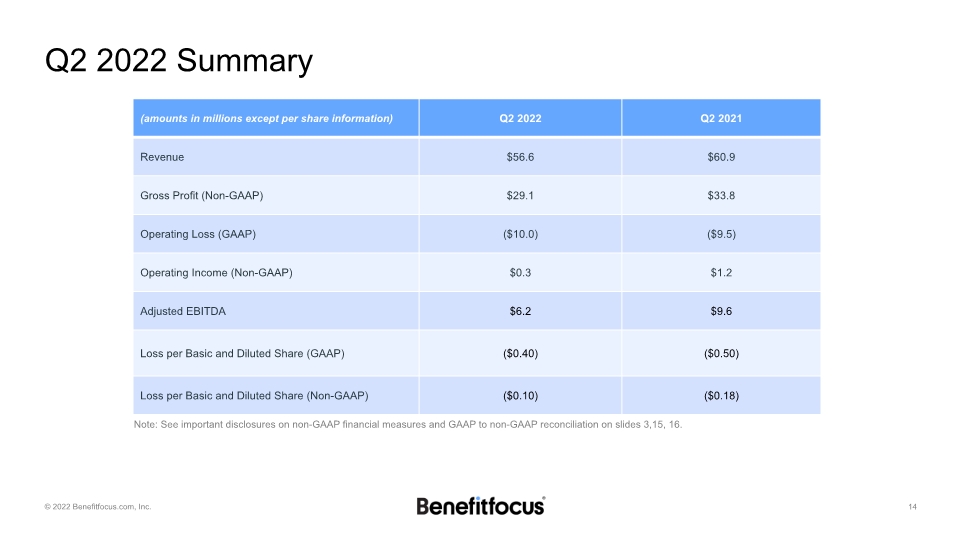
Q2 2022 Summary Note: See important disclosures on non-GAAP financial measures and GAAP to non-GAAP reconciliation on slides 3,15, 16.
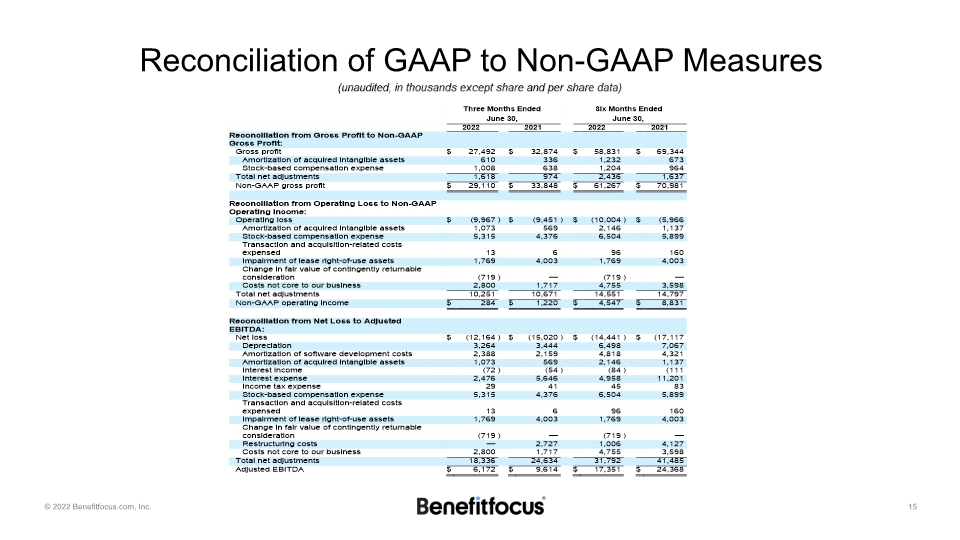
Reconciliation of GAAP to Non-GAAP Measures
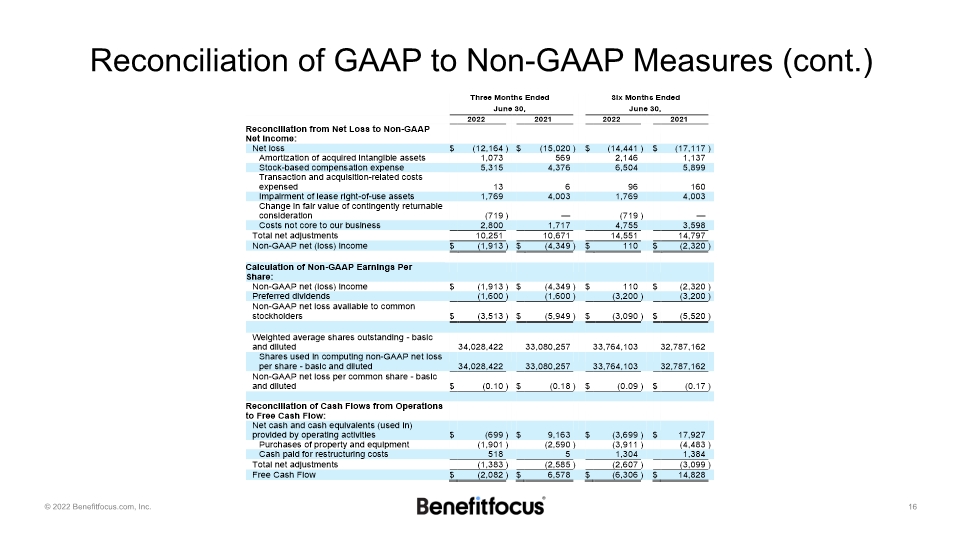
Reconciliation of GAAP to Non-GAAP Measures (cont.)

Q2 2022 Earnings Presentation August 3, 2022


