As filed with the Securities and Exchange Commission on February 1, 2016
UNITED STATES
SECURITIES AND EXCHANGE COMMISSION
WASHINGTON, D.C. 20549
FORM N-CSR
CERTIFIED SHAREHOLDER REPORT OF REGISTERED MANAGEMENT
INVESTMENT COMPANIES
Investment Company Act file number 811-22842
FORUM FUNDS II
Three Canal Plaza, Suite 600
Portland, Maine 04101
Jessica Chase, Principal Executive Officer
Three Canal Plaza, Suite 600
Portland, Maine 04101
207-347-2000
Date of fiscal year end: November 30
Date of reporting period: December 1, 2014 – November 30, 2015
ITEM 1. REPORT TO STOCKHOLDERS.
BAYWOOD SKBA VALUEPLUS FUND A MESSAGE TO OUR SHAREHOLDERS (Unaudited) |
Dear Shareholder,
This annual report marks the second year of the Baywood SKBA ValuePlus Fund (the “Fund”) since its reorganization into a mutual fund on December 2, 2013. We are pleased to report on our economic and financial market perspectives and the investment activities in the Fund for the year ended November 30, 2015. The Fund buys primarily dividend-paying companies traded on U.S. exchanges and uses SKBA’s Relative Dividend Yield (RDY) discipline as the initial valuation framework. We believe RDY points out attractive investment opportunities, not simply among companies with above-average dividend yield, but more importantly among stocks for which low-expectations are already discounted in their valuations at the time of purchase. This provides the potential for attractive capital appreciation opportunities.
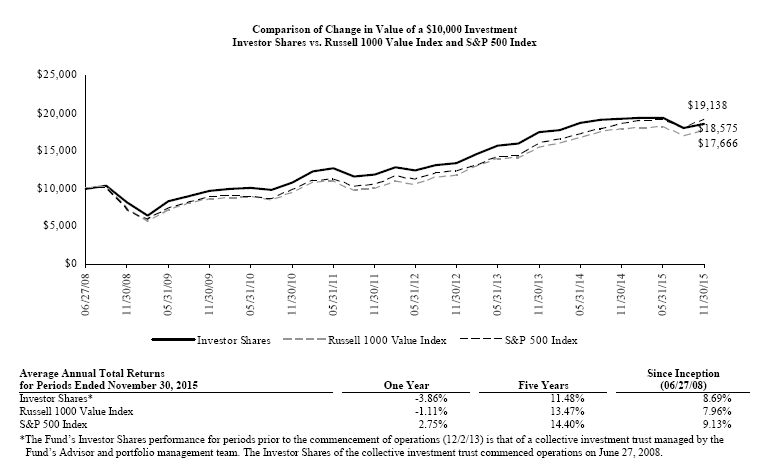
After three years of robust market returns for the year end ended in fiscal 2014 (November 30, 2014) during which the annualized rates of return for each of the S&P 500 and Russell 1000 Value indexes exceeded 20%, this favorable environment came to an end in 2015. For fiscal 2015, the S&P 500, the Russell 1000 Value and the Morningstar Large-Cap Value Funds’ median return equaled 2.75%, -1.11%, and -1.58%, respectively. This is a rather dramatic slowing from the pace of returns from the prior three years, and we believe it signals an environment for more moderate stock market returns going forward. The Fund’s returns are reported in the table on page 3 of this report.
Large-capitalization “Growth-style” funds typically outperformed large-cap “Value-style” funds during the year primarily due to their dramatically lower portfolio weights held in the two weakest sectors held by Value-style benchmarks, Basic Materials and Energy. For the year as a whole, the Fund’s primary benchmark, the Russell 1000 Value, experienced an approximately -13.6% return in the Energy sector and -10.7% in Basic Materials. The plunge in oil prices (using West Texas Intermediate (WTI) prices) to $40 per barrel led to deteriorating earnings fundamentals and weakening investor sentiment, and nearly all commodities (i.e. metals and agricultural commodities) followed suit. Saudi Arabia’s decision within OPEC to keep output high and to let prices fall in order to recapture market share in oil, the slowing growth in China’s economy and commodities consumption, rising worldwide inventories, and the strengthening of exchange value of the U.S. dollar, each contributed to the decline in commodity prices.
Despite the weakness in stock prices, the Fund’s modest underweight in the Energy sector during the year and its focus on the large integrated producers with some of the strongest balance sheets resulted in the sector making the second largest positive relative return contribution to the Fund’s return for the year. The opposite was the case in the Basic Materials sector, as an over-weighted position produced the greatest negative relative return impact on the Fund’s return for the year. In both cases, however, we believe that some of the greatest valuation attraction can be found in dividend-paying companies in these two sectors. We continue to believe that oil prices in the $30-$50 range will not prove to be the new “normal”. For several years, we have believed that the normal price of WTI should be at or above $80 per barrel and that the market will return toward this level over the next two to three years as consumption grows, investment in exploration falls around the globe, and inventories are depleted. Although 2016 could start out being another rocky year for energy and commodities, the year as a whole will undoubtedly present investment opportunities.
In contrast to commodity-related sectors, the largest positive returns for the Fund were reported in Financials, Health Care and Technology. The positive total returns of property/casualty insurer, Chubb, and life insurance company, Symetra, led the way among Financials as their valuation attraction became apparent to other international insurance companies, which made acquisition bids at significant price premiums. Eli Lilly’s drug pipeline developments created significant growth opportunities and investor interest enabling the stock to be the strongest contributor to performance in Health Care. Among Technology stocks, TE Connectivity, Microsoft, and Harris Corp produced the greatest positive contribution to returns. As the Technology sector within the Russell 1000 Value produced approximately a -5.3% return, the overall positive returns of the Fund’s holdings resulted in this sector having the greatest positive contribution.
In the face of slowing worldwide growth, particularly from China, the subpar pace of recovery in the U.S. GDP in 2015 of 2.0-2.5% appeared relatively attractive. Many companies with domestically-focused businesses performed well; yet many companies with large international revenues, whether focused on capital or consumer goods, experienced significant headwinds from the strength in the U.S. dollar (on both revenue translation and price competition). Furthermore, the confusion about when the Federal Reserve Board might finally end its Zero Interest Rate Policy (ZIRP) added uncertainty and volatility to the market’s and individual sector performances. Being underweight the Utilities sector, for example, benefited relative returns in the first half of the year but hurt them in the third quarter. Our view is the Fed has held short-term rates too low for too long, and this has contributed to fixed-income market speculation and excessive stock market valuations. We believe that low interest rates have penalized the net interest margins of banks and insurance companies and that their profits would rise to more normal levels after the Fed ends ZIRP. The Financial sector had generally been a drag on relative performance in recent years but has begun to benefit shareholders in 2015.
BAYWOOD SKBA VALUEPLUS FUND A MESSAGE TO OUR SHAREHOLDERS (Unaudited) |
Furthermore, our position has not changed in that we believe rising rates, at least increases not associated with significant price inflation, will not necessarily be negative for the stock market.
The outlook for the economy in 2016 appears to be “more of the same” subpar growth of the past six years. Strong domestic demand in the automotive and housing markets may, in part, be offset by weakness in the energy sector and impact of slowing worldwide growth on net exports. In the midst of these trends, the looming 2016 presidential election may cloud the horizon or add new excitement to the market movements. In our estimation, slowing earnings growth and heightened equity valuations are likely to produce single-digit returns for the stock market over the next 3-5 years.
As we have previously pointed out, in spite of market gains over the last few years it is still possible to find opportunities with potential to add value and diversification to the Fund. We are confident that patience and attention to diversification will once again prove the proper approach. Investment time horizons may span years and decades, not simply quarters, and we will continue to employ our disciplined approach seeking to take advantage of purchase opportunities should stocks decline meaningfully and will temper our enthusiasm and invest conservatively when valuations appear rich.
For more detailed information on SKBA Capital Management, LLC and our investment process and perspectives, visit our website at www.SKBA.com.
Current and future portfolio holdings are subject to change and risk.
The Morningstar category is used to compare fund performance to its peers. It is not possible to invest directly into an index or category. Past performance is no guarantee of future results.
Risk Considerations: Mutual fund investing involves risk, including the possible loss of principal. The Fund primarily invests in undervalued securities, which may not appreciate in value as anticipated by the Advisor or remain undervalued for longer than anticipated. The Fund may invest in American Depositary Receipts (ADRs), which involves risks relating to political, economic or regulatory conditions in foreign countries and may cause greater volatility and less liquidity. The Fund may also invest in convertible securities and preferred stock, which may be adversely affected as interest rates rise.
BAYWOOD SKBA VALUEPLUS FUND PERFORMANCE CHARTS AND ANALYSIS (Unaudited) |
The following charts reflect the change in the value of a hypothetical $10,000 investment in Investor Shares and $100,000 investment in Institutional Shares, including reinvested dividends and distributions, in Baywood SKBA ValuePlus Fund (the “Fund”) compared with the performance of the primary benchmark, Russell 1000 Value Index, and the secondary benchmark, S&P 500 Index, since inception. The Russell 1000 Value Index is an unmanaged index which measures the performance of the large-cap value segment of the Russell 1000 companies (that is, the 1,000 largest U.S. companies in terms of market capitalization) with lower price-to-book ratios and lower forecasted growth values. The S&P 500 is a broad-based, unmanaged measurement of changes in stock market conditions based on the average of 500 widely held common stocks. The total return of both the Russell 1000 Value Index and S&P 500 Index include the reinvestment of dividends and income. The total return of the Fund includes operating expenses that reduce returns, while the total return of the Russell 1000 Value Index and S&P 500 Index do not include expenses. The Fund is professionally managed while the Russell 1000 Value Index and S&P 500 Index are unmanaged and are not available for investment.
BAYWOOD SKBA VALUEPLUS FUND PERFORMANCE CHART AND ANALYSIS (Unaudited) |

Performance data quoted represents past performance and is no guarantee of future results. Current performance may be lower or higher than the performance data quoted. Investment return and principal value will fluctuate so that shares, when redeemed, may be worth more or less than original cost. For the most recent month-end performance, please call (855) 409-2297. As stated in the Fund's prospectus, the annual operating expense ratios (gross) for Investor Shares and Institutional Shares are 4.51% and 2.49%, respectively. However, the Fund's adviser has agreed to contractually waive its fees and/or reimburse expenses such that total operating expenses (excluding all taxes, interest, portfolio transaction expenses, acquired fund fees and expenses, proxy expenses and extraordinary expenses) do not exceed 0.95% and 0.70% for Investor Shares and Institutional Shares, respectively through March 31, 2017 (the "Expense Cap"). The Fund may repay the Advisor for fees waived and expenses reimbursed pursuant to the expense cap if such payment is made within three years of the fees waived or expense reimbursement, is approved by the Fund's Board of Trustees and does not cause the Fund's net annual operating expenses of that class to exceed the expense cap in place at the time the fees were waived. Performance would have been lower without fee waivers in effect. The performance table and graph do not reflect the deduction of taxes that a shareholder would pay on Fund distributions or the redemption of Fund shares. Returns greater than one year are annualized.
BAYWOOD SKBA VALUEPLUS FUND SCHEDULE OF INVESTMENTS |
| Shares | | Security Description | | Value | |
Common Stock - 97.3% |
Basic Materials - 6.1% |
| | 500 | | Albemarle Corp. | $ | 26,780 | |
| | 1,500 | | Goldcorp, Inc. | | 17,715 | |
| | 300 | | LyondellBasell Industries NV, Class A | | 28,746 | |
| | 2,640 | | The Chemours Co. | | 16,500 | |
| | 600 | | Weyerhaeuser Co. REIT | | 19,302 | |
| | | 109,043 | |
Capital Goods / Industrials - 8.8% |
| | 100 | | Caterpillar, Inc. | | 7,265 | |
| | 600 | | Eaton Corp. PLC | | 34,896 | |
| | 900 | | Republic Services, Inc. | | 39,537 | |
| | 300 | | Stanley Black & Decker, Inc. | | 32,748 | |
| | 300 | | The Boeing Co. | | 43,635 | |
| | | 158,081 | |
Consumer Cyclicals - 4.6% |
| | 2,500 | | Ford Motor Co. | | 35,825 | |
| | 700 | | Mattel, Inc. | | 17,402 | |
| | 400 | | Target Corp. | | 29,000 | |
| | | 82,227 | |
Consumer Staples - 9.0% |
| | 200 | | Molson Coors Brewing Co., Class B | | 18,406 | |
| | 500 | | PepsiCo, Inc. | | 50,080 | |
| | 600 | | The Procter & Gamble Co. | | 44,904 | |
| | 800 | | Wal-Mart Stores, Inc. | | 47,072 | |
| | | 160,462 | |
Energy - 12.7% |
| | 1,300 | | BP PLC, ADR | | 44,980 | |
| | 200 | | Chevron Corp. | | 18,264 | |
| | 300 | | Exxon Mobil Corp. | | 24,498 | |
| | 700 | | National Oilwell Varco, Inc. | | 26,138 | |
| | 700 | | Occidental Petroleum Corp. | | 52,913 | |
| | 400 | | Phillips 66 | | 36,612 | |
| | 300 | | Schlumberger, Ltd. | | 23,145 | |
| | | 226,550 | |
Financials - 23.5% |
| | 1,400 | | BB&T Corp. | | 54,068 | |
| | 200 | | BOK Financial Corp. | | 13,770 | |
| | 500 | | FNF Group | | 17,925 | |
| | 1,000 | | Invesco, Ltd. | | 33,690 | |
| | 400 | | JPMorgan Chase & Co. | | 26,672 | |
| | 500 | | M&T Bank Corp. | | 62,665 | |
| | 1,100 | | MetLife, Inc. | | 56,199 | |
| | 500 | | Symetra Financial Corp. | | 15,740 | |
| | 400 | | The Chubb Corp. | | 52,212 | |
| | 1,100 | | U.S. Bancorp | | 48,279 | |
| | 700 | | Wells Fargo & Co. | | 38,570 | |
| | | 419,790 | |
Health Care - 14.0% |
| | 700 | | AbbVie, Inc. | | 40,705 | |
| | 700 | | Baxalta, Inc. | | 24,066 | |
| | 700 | | Baxter International, Inc. | | 26,355 | |
| | 300 | | Becton Dickinson and Co. | | 45,075 | |
| | 300 | | Cardinal Health, Inc. | | 26,055 | |
| | 700 | | Eli Lilly & Co. | | 57,428 | |
| | 300 | | Johnson & Johnson | | 30,372 | |
| | | 250,056 | |
Technology - 14.9% |
| | 1,800 | | Cisco Systems, Inc. | | 49,050 | |
| | 300 | | Harris Corp. | | 24,939 | |
| | 200 | | International Business Machines Corp. | | 27,884 | |
| | 1,200 | | Microsoft Corp. | | 65,220 | |
| | 600 | | QUALCOMM, Inc. | | 29,274 | |
| | 1,400 | | STMicroelectronics NV, ADR | | 10,164 | |
| Shares | | Security Description | | Value | |
| | 900 | | TE Connectivity, Ltd. | $ | 60,381 | |
| | | 266,912 | |
Telecommunications - 3.1% |
| | 1,200 | | Verizon Communications, Inc. | | 54,540 | |
Utilities - 0.6% |
| | 400 | | Exelon Corp. | | 10,924 | |
| Total Common Stock (Cost $1,643,526) | | 1,738,585 | |
Money Market Fund - 2.6% |
| | 46,887 | | Federated Government Obligations Fund, 0.01% (a) (Cost $46,887) | | 46,887 | |
Total Investments - 99.9% (Cost $1,690,413)* | $ | 1,785,472 | |
| Other Assets & Liabilities, Net – 0.1% | | 2,043 | |
| Net Assets – 100.0% | $ | 1,787,515 | |
| ADR | American Depositary Receipt |
| PLC | Public Limited Company |
| REIT | Real Estate Investment Trust |
| (a) | Variable rate security. Rate presented is as of November 30, 2015. |
| | * Cost for federal income tax purposes is $1,733,675 and net unrealized appreciation consists of: |
| Gross Unrealized Appreciation | | $ | 153,602 | |
| Gross Unrealized Depreciation | | | (101,805 | ) |
| Net Unrealized Appreciation | | $ | 51,797 | |
The following is a summary of the inputs used to value the Fund’s investments as of November 30, 2015.
The inputs or methodology used for valuing securities are not necessarily an indication of the risks associated with investing in those securities. For more information on valuation inputs, and their aggregation into the levels used in the table below, please refer to the Security Valuation section in Note 2 of the accompanying Notes to Financial Statements.
| Valuation Inputs | | Investments in Securities |
| Level 1 - Quoted Prices | | $ | 1,738,585 | |
| Level 2 - Other Significant Observable Inputs | | | 46,887 | |
| Level 3 - Significant Unobservable Inputs | | | - | |
| Total | | $ | 1,785,472 | |
The Level 1 value displayed in this table is Common Stock. The Level 2 value displayed in this table is a Money Market Fund. Refer to this Schedule of Investments for a further breakout of each security by industry.
The Fund utilizes the end of period methodology when determining transfers. There were no transfers among Level 1, Level 2 and Level 3 for the year ended November 30, 2015.
AFA
| PORTFOLIO HOLDINGS | | |
| % of Total Investments | | |
| Basic Materials | 6.1 | % |
| Capital Goods / Industrials | 8.9 | % |
| Consumer Cyclicals | 4.6 | % |
| Consumer Staples | 9.0 | % |
| Energy | 12.7 | % |
| Financials | 23.5 | % |
| Health Care | 14.0 | % |
| Technology | 14.9 | % |
| Telecommunications | 3.1 | % |
| Utilities | 0.6 | % |
| Money Market Fund | 2.6 | % |
| | | |
| | 100.0 | % |
| See Notes to Financial Statements. | 5 | |
BAYWOOD SKBA VALUEPLUS FUND STATEMENT OF ASSETS AND LIABILITIES |
| | | | | | | |
| ASSETS | | | | |
| | Total investments, at value (Cost $1,690,413) | | $ | 1,785,472 | |
| | Receivables: | | | | |
| | | Fund shares sold | | | 2,081 | |
| | | Dividends | | | 7,056 | |
| Advisor | From investment advisor | | | 11,974 | |
| | Prepaid expenses | | | 8,930 | |
| Total Assets | | | 1,815,513 | |
| | | | | | | |
| LIABILITIES | | | | |
| | Accrued Liabilities: | | | | |
| | | Fund services fees | | | 5,947 | |
| | | Other expenses | | | 22,051 | |
| Total Liabilities | | | 27,998 | |
| | | | | | | |
| NET ASSETS | | $ | 1,787,515 | |
| | | | | | | |
| COMPONENTS OF NET ASSETS | | | | |
| | Paid-in capital | | $ | 1,481,066 | |
| | Undistributed net investment income | | | 210,999 | |
| | Accumulated net realized loss | | | 391 | |
| | Net unrealized appreciation | | | 95,059 | |
| NET ASSETS | | $ | 1,787,515 | |
| | | | | | | |
| SHARES OF BENEFICIAL INTEREST AT NO PAR VALUE (UNLIMITED SHARES AUTHORIZED) | | | | |
| | Investor Shares | | | 80,563 | |
| | Institutional Shares | | | 25,057 | |
| | | | | | | |
| NET ASSET VALUE, OFFERING AND REDEMPTION PRICE PER SHARE | | | | |
| | Investor Shares (based on net assets of $1,361,614) | | $ | 16.90 | |
| | Institutional Shares (based on net assets of $425,901) | | $ | 17.00 | |
| See Notes to Financial Statements. | 6 | |
BAYWOOD SKBA VALUEPLUS FUND STATEMENT OF OPERATIONS YEAR ENDED NOVEMBER 30, 2015 |
| | | | | | | | |
| INVESTMENT INCOME | | | | | |
| | Dividend income (Net of foreign withholding taxes of $469) | | $ | 287,641 | | |
| Total Investment Income | | | 287,641 | | |
| Advisor | | | | | |
| EXPENSES | | | | | |
| | Investment advisor fees | | | 49,163 | | |
| | Fund services fees | | | 80,000 | | |
| | Transfer agent fees: | | | | | |
| | Investor Shares | | | 18,180 | | |
| | Institutional Shares | | | 18,180 | | |
| | Distribution fees: | | | | | |
| | Investor Shares | | | 3,514 | | |
| | Custodian fees | | | 5,000 | | |
| | Registration fees: | | | | | |
| | Investor Shares | | | 13,663 | | |
| | Institutional Shares | | | 13,397 | | |
| | Professional fees | | | 34,391 | | |
| | Trustees' fees and expenses | | | 2,587 | | |
| | Miscellaneous expenses | | | 19,822 | | |
| Total Expenses | | | 257,897 | | |
| | Fees waived and expenses reimbursed | | | (185,556 | ) | |
| Net Expenses | | | 72,341 | | |
| | | | | | | | |
| NET INVESTMENT INCOME | | | 215,300 | | |
| | | | | | | | |
| NET REALIZED AND UNREALIZED GAIN (LOSS) | | | | | |
| | Net realized gain on investments | | | 1,216,102 | | |
| | Net change in unrealized appreciation (depreciation) on investments | | | (2,370,562 | ) | |
| NET REALIZED AND UNREALIZED LOSS | | | (1,154,460 | ) | |
| DECREASE IN NET ASSETS RESULTING FROM OPERATIONS | | $ | (939,160 | ) | |
| | | | | | | | |
| See Notes to Financial Statements. | 7 | |
BAYWOOD SKBA VALUEPLUS FUND STATEMENTS OF CHANGES IN NET ASSETS |
| | | | # | | 42338 | # | # | * | | 41973 | |
| | | | | For the Year Ended November 30, 2015 | | | December 2, 2013* Through November 30, 2014 |
| OPERATIONS | | | | | | | | | |
| | Net investment income | | $ | 215,300 | | | | $ | 268,748 | |
| | Net realized gain | | | 1,216,102 | | | | | 900,291 | |
| | Net change in unrealized appreciation (depreciation) | | | (2,370,562 | ) | | | | 93,057 | |
| Increase (Decrease) in Net Assets Resulting from Operations | | | (939,160 | ) | | | | 1,262,096 | |
| | | | | | | | | | | | |
| DISTRIBUTIONS TO SHAREHOLDERS FROM | | | | | | | | | |
| | Net investment income: | | | | | | | | | |
| | | Investor Shares | | | (21,548 | ) | | | | (4,507 | ) |
| | | Institutional Shares | | | (215,813 | ) | | | | (25,497 | ) |
| | Net realized gain: | | | | | | | | | |
| | | Investor Shares | | | (106,575 | ) | | | | - | |
| | | Institutional Shares | | | (795,111 | ) | | | | - | |
| Total Distributions to Shareholders | | | (1,139,047 | ) | | | | (30,004 | ) |
| | | | | | | | | | | | |
| CAPITAL SHARE TRANSACTIONS | | | | | | | | | |
| | Sale of shares: | | | | | | | | | |
| | | Investor Shares | | | - | | | | | 2,156,450 | |
| | | Institutional Shares | | | 1,666,328 | | | | | 12,143,951 | |
| | Reinvestment of distributions: | | | | | | | | | |
| | | Investor Shares | | | 128,123 | | | | | 4,507 | |
| | | Institutional Shares | | | 1,010,924 | | | | | 25,497 | |
| | Redemption of shares: | | | | | | | | | |
| | 1 | Investor Shares | | | (54,025 | ) | | | | (841,210 | ) |
| | 2 | Institutional Shares | | | (11,423,874 | ) | | | | (2,183,041 | ) |
| Increase (Decrease) in Net Assets from Capital Share Transactions | | (8,672,524 | ) | | | | 11,306,154 | |
| Increase (Decrease) in Net Assets | | | (10,750,731 | ) | | | | 12,538,246 | |
| | | | | | | | | | | | |
| NET ASSETS | | | | | | | | | |
| | Beginning of Period | | | 12,538,246 | | | | | - | |
| | End of Period (Including line (a)) | | $ | 1,787,515 | | | | $ | 12,538,246 | |
| | | | | | | | | | | | |
| SHARE TRANSACTIONS | | | | | | | | | |
| | Sale of shares: | | | | | | | | | |
| | | Investor Shares | | | - | | | | | 123,329 | |
| | | Institutional Shares | | | 95,363 | | | | | 687,361 | |
| | Reinvestment of distributions: | | | | | | | | | |
| | | Investor Shares | | | 7,383 | | | | | 254 | |
| | | Institutional Shares | | | 57,782 | | | | | 1,428 | |
| | Redemption of shares: | | | | | | | | | |
| | | Investor Shares | | | (3,097 | ) | | | | (47,306 | ) |
| | | Institutional Shares | | | (697,866 | ) | | | | (119,011 | ) |
| Increase (Decrease) in Shares | | | (540,435 | ) | | | | 646,055 | |
| | | | | | | | | | | | |
| (a) | Undistributed net investment income | | $ | 210,999 | | | | $ | 237,355 | |
| * | Commencement of operations. | | | | | | | | | |
| See Notes to Financial Statements. | 8 | |
BAYWOOD SKBA VALUEPLUS FUND FINANCIAL HIGHLIGHTS |
| These financial highlights reflect selected data for a share outstanding throughout each period. |
| | | For the Year Ended November 30, 2015 | | December 2, 2013 (a) Through November 30, 2014 | |
| INVESTOR SHARES | | | | | | | | |
| NET ASSET VALUE, Beginning of Period | $ | 19.28 | | | $ | 17.47 | | |
| INVESTMENT OPERATIONS | | | | | | | | |
| Net investment income (b) | | 0.34 | | | | 0.36 | | |
| Net realized and unrealized gain (loss) | | (1.06 | ) | | | 1.49 | | |
| Total from Investment Operations | | (0.72 | ) | | | 1.85 | | |
| DISTRIBUTIONS TO SHAREHOLDERS FROM | | | | | | | | |
| Net investment income | | (0.26 | ) | | | (0.04 | ) | |
| Net realized gain | | (1.40 | ) | | | — | | |
| Total Distributions to Shareholders | | (1.66 | ) | | | (0.04 | ) | |
| NET ASSET VALUE, End of Period | $ | 16.90 | | | $ | 19.28 | | |
| TOTAL RETURN | | (3.86 | )% | | 10.59 | %(c) |
| RATIOS/SUPPLEMENTARY DATA | | | | | | | | |
| Net Assets at End of Period (000's omitted) | $1,362 | | | $1,471 | | |
| Ratios to Average Net Assets: | | | | | | | | |
| Net investment income | | 1.97 | % | | 1.98 | %(d) |
| Net expenses | | 0.95 | % | | 0.95 | %(d) |
| Gross expenses (e) | | 5.80 | % | | 4.54 | %(d) |
| PORTFOLIO TURNOVER RATE | | 32 | % | | 35 | %(c) |
| | | | | | | | | | |
| | | | | | | | | | |
| (a) | Commencement of operations. |
| (b) | Calculated based on average shares outstanding during each period. |
| (c) | Not annualized. |
| (d) | Annualized. |
| (e) | Reflects the expense ratio excluding any waivers and/or reimbursements. |
| See Notes to Financial Statements. | 9 | |
BAYWOOD SKBA VALUEPLUS FUND FINANCIAL HIGHLIGHTS |
| These financial highlights reflect selected data for a share outstanding throughout each period. |
| | | For the Year Ended November 30, 2015 | | December 2, 2013 (a) Through November 30, 2014 | |
| INSTITUTIONAL SHARES | | | | | | | | |
| NET ASSET VALUE, Beginning of Period | $ | 19.42 | | | $ | 17.56 | | |
| INVESTMENT OPERATIONS | | | | | | | | |
| Net investment income (b) | | 0.39 | | | | 0.41 | | |
| Net realized and unrealized gain (loss) | | (1.06 | ) | | | 1.50 | | |
| Total from Investment Operations | | (0.67 | ) | | | 1.91 | | |
| DISTRIBUTIONS TO SHAREHOLDERS FROM | | | | | | | | |
| Net investment income | | (0.35 | ) | | | (0.05 | ) | |
| Net realized gain | | (1.40 | ) | | | — | | |
| Total Distributions to Shareholders | | (1.75 | ) | | | (0.05 | ) | |
| NET ASSET VALUE, End of Period | $ | 17.00 | | | $ | 19.42 | | |
| TOTAL RETURN | | (3.58 | )% | | 10.87 | %(c) |
| RATIOS/SUPPLEMENTARY DATA | | | | | | | | |
| Net Assets at End of Period (000's omitted) | $426 | | | $11,067 | | |
| Ratios to Average Net Assets: | | | | | | | | |
| Net investment income | | 2.23 | % | | 2.26 | %(d) |
| Net expenses | | 0.70 | % | | 0.70 | %(d) |
| Gross expenses (e) | | 2.09 | % | | 2.50 | %(d) |
| PORTFOLIO TURNOVER RATE | | 32 | % | | 35 | %(c) |
| | | | | | | | | | |
| | | | | | | | | | |
| (a) | Commencement of operations. |
| (b) | Calculated based on average shares outstanding during each period. |
| (c) | Not annualized. |
| (d) | Annualized. |
| (e) | Reflects the expense ratio excluding any waivers and/or reimbursements. |
| See Notes to Financial Statements. | 10 | |
BAYWOOD SKBA VALUEPLUS FUND NOTES TO FINANCIAL STATEMENTS NOVEMBER 30, 2015 |
Note 1. Organization
The Baywood SKBA ValuePlus Fund (the “Fund”) is a diversified portfolio of Forum Funds II (the “Trust”). The Trust is a Delaware statutory trust that is registered as an open-end, management investment company under the Investment Company Act of 1940 (the “Act”), as amended. Under its Trust Instrument, the Trust is authorized to issue an unlimited number of the Fund’s shares of beneficial interest without par value. The Fund commenced operations on December 2, 2013. The Fund currently offers two classes of shares: Investor Shares and Institutional Shares. The Fund seeks to achieve long-term capital appreciation by investing in undervalued equity securities.
On December 2, 2013, the Fund commenced operations through a reorganization of a collective investment trust into the Fund. The collective investment trust was previously managed by the Fund’s advisor and portfolio management team. This collective investment trust was organized and commenced operations on June 27, 2008. The collective investment trust had an investment objective and strategies that were, in all material respects, identical to those of the Fund. The net assets and unrealized gain received by the Fund from this tax-free reorganization were as follows:
| Date of Contribution | | Net Assets Investor Shares | | Net Assets Institutional Shares | | Shares Issued Investor Shares | | Shares Issued Institutional Shares | | Cost of Investments | | Unrealized Gain on Investments |
| December 2, 2013 | | $2,099,735 | | $10,168,720 | | 120,217 | | 579,166 | | $9,396,973 | | $2,372,564 |
In addition to the securities transferred in, as noted above, $498,918 of cash and other receivables were also transferred in as part of the reorganization.
Note 2. Summary of Significant Accounting Policies
These financial statements are prepared in accordance with accounting principles generally accepted in the United States of America (“GAAP”), which require management to make estimates and assumptions that affect the reported amounts of assets and liabilities, the disclosure of contingent liabilities at the date of the financial statements, and the reported amounts of increases and decreases in net assets from operations during the fiscal year. Actual amounts could differ from those estimates. The following summarizes the significant accounting policies of the Fund:
Security Valuation – Exchange-traded securities and over-the-counter securities are valued using the last quoted trade or official closing price, provided by independent pricing services as of the close of trading on the market or exchange for which they are primarily traded, on each Fund business day. In the absence of a sale, such securities are valued at the mean of the last bid and ask price provided by independent pricing services. Non-exchange-traded securities for which quotations are available are valued using the last quoted sales price, or in the absence of a sale, at the mean of the last bid and ask prices provided by independent pricing services. Shares of open-end mutual funds are valued at net asset value (“NAV”). Short-term investments that mature in 60 days or less may be valued at amortized cost.
The Fund values its investments at fair value pursuant to procedures adopted by the Trust's Board of Trustees (the "Board") if (1) market quotations are insufficient or not readily available or (2) the advisor believes that the values available are unreliable. The Trust’s Valuation Committee, as defined in the Fund’s registration statement, performs certain functions as they relate to the administration and oversight of the Fund’s valuation procedures. Under these procedures, the Valuation Committee convenes on a regular and ad-hoc basis to review such investments and considers a number of factors, including valuation methodologies and significant unobservable inputs, when arriving at fair value.
The Valuation Committee may work with the advisor to provide valuation inputs. In determining fair valuations, inputs may include market-based analytics which may consider related or comparable assets or liabilities, recent transactions, market multiples, book values and other relevant investment information. Advisor inputs may include an income-based approach in which the anticipated future cash flows of the investment are discounted in determining fair value. Discounts may also be applied based on the nature or duration of any restrictions on the disposition of the investments. The Valuation Committee performs regular reviews of valuation methodologies, key inputs and assumptions, disposition analysis and market activity.
Fair valuation is based on subjective factors and, as a result, the fair value price of an investment may differ from the security’s market price and may not be the price at which the asset may be sold. Fair valuation could result in a different NAV than a NAV
BAYWOOD SKBA VALUEPLUS FUND NOTES TO FINANCIAL STATEMENTS NOVEMBER 30, 2015 |
determined by using market quotes.
The Fund has a three-tier fair value hierarchy. The basis of the tiers is dependent upon the various “inputs” used to determine the value of the Fund’s investments. These inputs are summarized in the three broad levels listed below:
Level 1 — quoted prices in active markets for identical assets and liabilities
Level 2 — other significant observable inputs (including quoted prices of similar securities, interest rates, prepayment speeds, credit risk, etc.)
Level 3 — significant unobservable inputs (including the Fund’s own assumptions in determining the fair value of investments)
The aggregate value by input level, as of November 30, 2015, for the Fund’s investments is included at the end of the Fund’s Schedule of Investments.
Security Transactions, Investment Income and Realized Gain and Loss – Investment transactions are accounted for on the trade date. Dividend income is recorded on the ex-dividend date. Foreign dividend income is recorded on the ex-dividend date or as soon as possible after the Fund determines the existence of a dividend declaration after exercising reasonable due diligence. Income and capital gains on some foreign securities may be subject to foreign withholding taxes, which are accrued as applicable. Interest income is recorded on an accrual basis. Premium is amortized and discount is accreted using the effective interest method. Identified cost of investments sold is used to determine the gain and loss for both financial statement and federal income tax purposes.
Distributions to Shareholders – Distributions to shareholders of net investment income, if any, are declared and paid at least annually. Distributions to shareholders of net capital gains, if any, are declared and paid at least annually. Distributions to shareholders are recorded on the ex-dividend date. Distributions are based on amounts calculated in accordance with applicable federal income tax regulations, which may differ from GAAP. These differences are due primarily to differing treatments of income and gain on various investment securities held by the Fund, timing differences and differing characterizations of distributions made by the Fund.
On December 15, 2015, the Fund paid a distribution of $0.3727 in long-term capital gains per share related to the period ended November 30, 2015. On December 30, 2015, the Fund paid distributions of $2.00116 and $2.04339 in net investment income per share for Investor and Institutional Shares, respectively, related to the period ended November 30, 2015.
Federal Taxes – The Fund intends to continue to qualify each year as a regulated investment company under Subchapter M of the Internal Revenue Code and to distribute all of its taxable income to shareholders. In addition, by distributing in each calendar year substantially all of its net investment income and capital gains, if any, the Fund will not be subject to a federal excise tax. Therefore, no federal income or excise tax provision is required. The Fund files a U.S. federal income and excise tax return as required. A fund’s federal income tax returns are subject to examination by the Internal Revenue Service for a period of three fiscal years after they are filed. As of November 30, 2015, there are no uncertain tax positions that would require financial statement recognition, de-recognition or disclosure.
Income and Expense Allocation – The Trust accounts separately for the assets, liabilities and operations of each of its investment portfolios. Expenses that are directly attributable to more than one investment portfolio are allocated among the respective investment portfolios in an equitable manner.
The Fund’s class-specific expenses are charged to the operations of that class of shares. Income and expenses (other than expenses attributable to a specific class) and realized and unrealized gains or losses on investments are allocated to each class of shares based on the class’ respective net assets to the total net assets of the Fund.
Commitments and Contingencies – In the normal course of business, the Fund enters into contracts that provide general indemnifications by the Fund to the counterparty to the contract. The Fund’s maximum exposure under these arrangements is dependent on future claims that may be made against the Fund and, therefore, cannot be estimated; however, based on experience, the risk of loss from such claims is considered remote.
BAYWOOD SKBA VALUEPLUS FUND NOTES TO FINANCIAL STATEMENTS NOVEMBER 30, 2015 |
Note 3. Fees and Expenses
Investment Advisor – SKBA Capital Management, LLC (the “Advisor”) is the investment advisor to the Fund. Pursuant to an investment advisory agreement, the Advisor receives an advisory fee from the Fund at an annual rate of 0.50% of the Fund’s average daily net assets.
Distribution – Foreside Fund Services, LLC serves as the Fund’s distributor (the “Distributor”). The Fund has adopted a Distribution Plan (the “Plan”) in accordance with Rule 12b-1 of the Act. Under the Plan, the Fund may pay the Distributor and/or any other entity as authorized by the Board a fee of up to 0.25% of the Fund’s average daily net assets of Shares for providing distribution and/or shareholder services to the Fund. The Distributor is not affiliated with the Advisor or Atlantic Fund Administration, LLC (d/b/a Atlantic Fund Services) (“Atlantic”) or their affiliates.
Other Service Providers – Atlantic provides fund accounting, fund administration, compliance and transfer agency services to the Fund. Atlantic also provides certain shareholder report production, and EDGAR conversion and filing services. Pursuant to an Atlantic services agreement, the Fund pays Atlantic customary fees for its services. Atlantic provides a Principal Executive Officer, a Principal Financial Officer, a Chief Compliance Officer, and an Anti-Money Laundering Officer to the Fund, as well as certain additional compliance support functions.
Trustees and Officers – The Trust pays each Independent Trustee an annual fee of $16,000 ($21,000 for the Chairman). The Independent Trustees and Chairman may receive additional fees for special Board meetings. The Independent Trustees are also reimbursed for all reasonable out-of-pocket expenses incurred in connection with their duties as Trustees, including travel and related expenses incurred in attending Board meetings. The amount of Independent Trustees’ fees attributable to the Fund is disclosed in the Statement of Operations. Certain officers of the Trust are also officers or employees of the above named service providers, and during their terms of office received no compensation from the Fund.
Note 4. Expenses Reimbursed and Fees Waived
The Advisor has contractually agreed to waive its fee and/or reimburse certain expenses to limit total operating expenses (excluding all taxes, interest, portfolio transaction expenses, acquired fund fees and expenses, proxy expenses and extraordinary expenses) of Investor Shares to 0.95% and Institutional Shares to 0.70% through March 31, 2017. Other Fund service providers have voluntarily agreed to waive and reimburse a portion of their fees. These voluntary fee waivers and reimbursements may be reduced or eliminated at any time. For the year ended November 30, 2015, fees waived and expenses reimbursed were as follows:
| Investment Advisor Fees Waived | | Investment Advisor Expenses Reimbursed | | Other Waivers | | Total Fees Waived and Expenses Reimbursed |
| $ | 49,163 | | $ | 91,393 | | $ | 45,000 | | $ | 185,556 |
| | | | | | | | | | | |
The Fund may repay the Advisor for fees waived and expenses reimbursed pursuant to the expense cap if such payment is made within three years of the fee waiver or expense reimbursement, is approved by the Fund’s Board of Trustees and the reimbursement does not cause the Fund’s net annual operating expenses of that class to exceed the expense cap in place at the time the fees were waived. The amount of fees waived or expenses reimbursed eligible for recoupment are as follows:
| | | Amount of Fees Waived and/or Expenses Reimbursed | | Expiration Date to Recoup Fees Waived and/or Expenses Reimbursed | | Fees Recouped |
| November 30, 2014 | | $ | 201,724 | | November 30, 2017 | | $ | - |
| November 30, 2015 | | $ | 140,556 | | November 30, 2018 | | $ | - |
| | | | | | | | | |
Note 5. Security Transactions
The cost of purchases and proceeds from sales of investment securities (including maturities), other than short-term investments during the year ended November 30, 2015, were $3,006,915 and $12,175,717, respectively.
BAYWOOD SKBA VALUEPLUS FUND NOTES TO FINANCIAL STATEMENTS NOVEMBER 30, 2015 |
Note 6. Federal Income Tax
Distributions paid during the fiscal periods ended as noted were characterized for tax purposes as follows:
| Ordinary Income | | $ | 229,854 | | $ | 30,004 |
| Long-Term Capital Gain | | | 2,129,193 | | | - |
| | | $ | 2,359,047 | | $ | 30,004 |
There are amounts included in the above relating to equalization debits.
As of November 30, 2015, distributable earnings (accumulated loss) on a tax basis were as follows:
| Undistributed Ordinary Income | | $ | 210,999 | |
| Undistributed Long-Term Gain | | | 43,653 | |
| Unrealized Appreciation | | | 51,797 | |
| Total | | $ | 306,449 | |
The difference between components of distributable earnings on a tax basis and the amounts reflected in the Statement of Assets and Liabilities are primarily due to wash sales.
On the Statement of Assets and Liabilities, as a result of permanent book to tax differences, certain amounts have been reclassified for the year ended November 30, 2015. The following reclassification was the result of re-characterized distributions, partnerships and equalization and has no impact on the net assets of the Fund.
| Undistributed Net Investment Income (Loss) | | $ | (4,295 | ) |
| Accumulated Net Realized Gain (Loss) | | | (1,215,705 | ) |
| Paid-in-Capital | | | 1,220,000 | |
Note 7. Recent Accounting Pronouncements
In May 2015, the Financial Accounting Standards Board (“FASB”) issued Accounting Standards Update 2015-07 (“ASU 2015-07”) eliminating the requirement for investments measured at net asset value to be categorized within the fair value hierarchy under GAAP and requiring the disclosure of sufficient information to reconcile the fair value of the remaining assets categorized within the fair value hierarchy to the financial statements. ASU 2015-07 is effective for interim and annual reporting periods beginning after December 15, 2015. Management has reviewed the requirements and believes the adoption of ASU 2015-07 will not have a material impact on the financial statements.
Note 8. Subsequent Events
Subsequent events occurring after the date of this report through the date these financial statements were issued have been evaluated for potential impact and the Fund has had no such events.
REPORT OF INDEPENDENT REGISTERED PUBLIC ACCOUNTING FIRM |
To the Shareholders of Baywood SKBA ValuePlus Fund and the Board of Trustees of Forum Funds II
We have audited the accompanying statement of assets and liabilities of the Baywood SKBA ValuePlus Fund (the "Fund"), a series of shares of beneficial interest in Forum Funds II, including the schedule of investments, as of November 30, 2015, and the related statement of operations for the year then ended and the statements of changes in net assets and the financial highlights for the year then ended and for the period December 2, 2013 (commencement of operations) to November 30, 2014. These financial statements and financial highlights are the responsibility of the Fund’s management. Our responsibility is to express an opinion on these financial statements and financial highlights based on our audits.
We conducted our audits in accordance with the standards of the Public Company Accounting Oversight Board (United States). Those standards require that we plan and perform the audits to obtain reasonable assurance about whether the financial statements and financial highlights are free of material misstatement. An audit includes examining, on a test basis, evidence supporting the amounts and disclosures in the financial statements. Our procedures included confirmation of securities owned as of November 30, 2015 by correspondence with the custodian. An audit also includes assessing the accounting principles used and significant estimates made by management, as well as evaluating the overall financial statement presentation. We believe that our audits provide a reasonable basis for our opinion.
In our opinion, the financial statements and financial highlights referred to above present fairly, in all material respects, the financial position of the Baywood SKBA ValuePlus Fund as of November 30, 2015, the results of its operations for the year then ended, and the changes in its net assets and its financial highlights for the year then ended and for the period December 2, 2013 through November 30, 2014, in conformity with accounting principles generally accepted in the United States of America.
BBD, LLP
Philadelphia, Pennsylvania
January 26, 2016
BAYWOOD SKBA VALUEPLUS FUND ADDITIONAL INFORMATION (Unaudited) NOVEMBER 30, 2015 |
Investment Advisory Agreement Approval
The investment advisory agreement between the investment adviser and the Trust must be approved for initial terms no greater than two years, and must be renewed at least annually thereafter by the in-person vote of the Trustees, including a majority of the Trustees who are not parties to the agreements or “interested persons” of any party thereto (the “Independent Trustees”).
On September 10, 2015, the Trustees met in person with independent legal counsel to the Independent Trustees (“Independent Legal Counsel”), and others, and joined by representatives of the Advisor to consider information related to the approval of the investment advisory agreement between the Trust, on behalf of the Fund, and the Advisor for the performance of investment advisory services to the Fund. A description of the Board’s conclusions in approving the agreement follows.
In preparation for its September meeting of the Board of Trustees of the Trust (“September Meeting”), the Trustees were presented with a range of information to assist in their deliberations. Those materials included information from Lipper, Inc. (“Lipper”), a leading independent source of data about the mutual fund industry, which compared the Fund’s total contractual investment advisory fees, total expenses, and performance with an appropriate group of peer funds that were selected by Lipper. The materials also included a memorandum from Independent Legal Counsel concerning their responsibilities with respect to the approval of the investment advisory agreement, and the Independent Trustees met in executive session with Independent Legal Counsel while deliberating.
The Board also reviewed information provided by the Advisor concerning the following:
| · | the nature and extent of the services provided by the Advisor, including information about the investment objective, policies and strategies applicable to the Fund; |
| · | the personnel of the Advisor, including educational background, experience in the investment management industry, and the ability of the Advisor to retain qualified personnel; |
| · | the compliance program of the Advisor; |
| · | the financial condition and stability of the Advisor; |
| · | the potential for the Advisor to derive benefits that are ancillary to serving as an investment adviser to the Fund; |
| · | the profitability of the Advisor from the advisory fee to be paid by the Fund, including information concerning the advisory fees of funds considered by the Advisor to be comparable; |
| · | the performance of the Fund as compared to an appropriate group of peer funds selected by Lipper; |
| · | the investing philosophy of the Advisor; and |
| · | the terms of the investment advisory agreement, including the fees payable under the agreement, and the commitment of the Advisor to provide expense caps and fee waivers for the Fund. |
At the September Meeting, the Trustees reviewed, evaluated, and discussed among themselves and with the Advisor and Independent Legal Counsel, among other things, the information referenced above. The Trustees also considered the overall reputation, capabilities, and commitment of the Advisor to provide high-quality services to the Fund. The Independent Trustees engaged in discussion and consideration amongst themselves, and with the Advisor and Independent Legal Counsel. The Trustees concluded that the nature and extent of the investment advisory services provided by the Advisor to the Fund were appropriate and consistent with the terms of the investment advisory agreement, including the amount of fees to be paid under the advisory agreement. At the September Meeting, the Board unanimously approved the investment advisory agreement. The Trustees agreed that no single factor was determinative of their decision to approve the investment advisory agreement.
Proxy Voting Information
A description of the policies and procedures that the Fund uses to determine how to vote proxies relating to securities held in the Fund’s portfolio is available, without charge and upon request, by calling (855) 409-2297 and on the U.S. Securities and Exchange Commission’s (the “SEC”) website at www.sec.gov. The Fund’s proxy voting record for the most recent twelve-month period ended June 30 is available, without charge and upon request, by calling (855) 409-2297 and on the SEC’s website at www.sec.gov.
Availability of Quarterly Portfolio Schedules
The Fund files its complete schedule of portfolio holdings with the SEC for the first and third quarters of each fiscal year on Form N-Q. These filings are available, without charge and upon request on the SEC’s website at www.sec.gov or may be reviewed and
BAYWOOD SKBA VALUEPLUS FUND ADDITIONAL INFORMATION (Unaudited) NOVEMBER 30, 2015 |
copied at the SEC’s Public Reference Room in Washington, DC. Information on the operation of the Public Reference Room may be obtained by calling (800) SEC-0330.
Shareholder Expense Example
As a shareholder of the Fund, you incur ongoing costs, including management fees, distribution (12b-1) fees (for Investor Shares only) and other Fund expenses. This example is intended to help you understand your ongoing costs (in dollars) of investing in the Fund and to compare these costs with the ongoing costs of investing in other mutual funds.
The example is based on an investment of $1,000 invested at the beginning of the period and held for the entire period from June 1, 2015, through November 30, 2015.
Actual Expenses – The first line under each share class of the table below provides information about actual account values and actual expenses. You may use the information in this line, together with the amount you invested, to estimate the expenses that you paid over the period. Simply divide your account value by $1,000 (for example, an $8,600 account value divided by $1,000 = 8.6), then multiply the result by the number in the first line under the heading entitled “Expenses Paid During Period” to estimate the expenses you paid on your account during the period.
Hypothetical Example for Comparison Purposes – The second line under each share class of the table below provides information about hypothetical account values and hypothetical expenses based on the Fund’s actual expense ratio and an assumed rate of return of 5% per year before expenses, which is not the Fund’s actual return. The hypothetical account values and expenses may not be used to estimate the actual ending account balance or expenses you paid for the period. You may use this information to compare the ongoing costs of investing in the Fund and other funds. To do so, compare this 5% hypothetical example with the 5% hypothetical examples that appear in the shareholder reports of other funds.
Please note that the expenses shown in the table are meant to highlight your ongoing costs only. Therefore, the second line of the table is useful in comparing ongoing costs only, and will not help you determine the relative total costs of owning different funds.
| | Beginning | | Ending | | Expenses | | Annualized |
| | Account Value | | Account Value | | Paid During | | Expense |
| | June 1, 2015 | | November 30, 2015 | | Period* | | Ratio* |
| Investor Shares | | | | | | | | | | | |
| Actual | $ | 1,000.00 | | $ | 959.14 | | $ | 4.67 | | 0.95 | % |
| Hypothetical (5% return before taxes) | $ | 1,000.00 | | $ | 1,020.31 | | $ | 4.81 | | 0.95 | % |
| Institutional Shares | | | | | | | | | | | |
| Actual | $ | 1,000.00 | | $ | 960.99 | | $ | 3.44 | | 0.70 | % |
| Hypothetical (5% return before taxes) | $ | 1,000.00 | | $ | 1,021.56 | | $ | 3.55 | | 0.70 | % |
| | | | | | | | | | | | |
| | * Expenses are equal to the Fund's annualized expense ratio as indicated above multiplied by the average acount avalue over the period, multiplied by the number of days in the most recent half-year period divided by 365 to reflect the half-year period. |
Federal Tax Status of Dividends Declared during the Fiscal Year
For federal income tax purposes, dividends from short-term capital gains are classified as ordinary income. The Fund designates 100.00% of its income dividend distributed as qualifying for the corporate dividends-received deduction (DRD) and 100.00% for the qualified dividend rate (QDI) as defined in Section 1(h)(11) of the Internal Revenue Code.
Trustees and Officers of the Trust
The Board is responsible for oversight of the management of the Trust’s business affairs and of the exercise of all the Trust’s powers except those reserved for the shareholders. The following table provides information about each Trustee and certain officers of the Trust. Each Trustee and officer holds office until the person resigns, is removed, or is replaced. Unless otherwise noted, the persons have held their principal occupations for more than five years. The address for all Trustees and officers is Three Canal Plaza, Suite 600, Portland, Maine 04101. Mr. Keffer and Mr. Hong are considered Interested Trustees due to their affiliation with Atlantic. The Fund’s Statement of Additional Information includes additional information about the Trustees and is available, without charge and upon request, by calling (855) 409-2297.
BAYWOOD SKBA VALUEPLUS FUND ADDITIONAL INFORMATION (Unaudited) NOVEMBER 30, 2015 |
| Name and Year of Birth | Position with the Trust | Length of Time Served | Principal Occupation(s) During Past Five Years | Number of Series of Fund Complex¹ Overseen by Trustee | Other Directorships Held by Trustee |
Independent Trustees | | | | | |
David Tucker Born: 1958 | Chairman of the Board; Trustee; Chairman, Nominating Committee and Qualified Legal Compliance Committee | Since 2013 | Director, Blue Sky Experience (a charitable endeavor) since 2008; Senior Vice President & General Counsel, American Century Companies 1998-2008. | 38 | Trustee, Forum Funds; Trustee, Forum ETF Trust |
Mark D. Moyer Born: 1959 | Trustee; Chairman, Audit Committee | Since 2013 | Chief Financial Officer, Institute of International Education 2008-2011; Chief Financial Officer and Chief Restructuring Officer, Ziff Davis Media Inc. 2005-2008; Adjunct Professor of Accounting, Fairfield University 2009-2012. | 11 | Trustee, Forum ETF Trust |
Jennifer Brown-Strabley Born: 1964 | Trustee | Since 2013 | Principal, Portland Global Advisors 1996-2010. | 11 | Trustee, Forum ETF Trust |
Interested Trustees | | | | | |
Stacey E. Hong Born: 1966 | Trustee | Since 2013 | President, Atlantic since 2008. | 11 | None |
John Y. Keffer2 Born: 1942 | Trustee | Since 2013 | Chairman, Atlantic since 2008; President, Forum Investment Advisors, LLC since 2011; President, Forum Foundation (a charitable organization) since 2005; President, Forum Trust, LLC (a non-depository trust company chartered in the State of Maine) since 1997. | 38 | Trustee, Forum Funds; Forum ETF Trust and ALTMFX Trust; Director, Wintergreen Fund, Inc. |
Officers | | | | | |
Jessica Chase Born: 1970 | President; Principal Executive Officer | Since 2015 | Senior Vice President, Atlantic since 2008. | N/A | N/A |
Karen Shaw Born: 1972 | Treasurer; Principal Financial Officer | Since 2013 | Senior Vice President, Atlantic since 2008. | N/A | N/A |
Zachary Tackett Born: 1988 | Vice President; Secretary; Anti-Money Laundering Compliance Officer | Since 2014 | Associate Counsel, Atlantic since 2014; Intern Associate, Coakley & Hyde, PLLC, 2010-2013. | N/A | N/A |
Michael J. McKeen Born: 1971 | Vice President | Since 2013 | Senior Vice President, Atlantic since 2008. | N/A | N/A |
Timothy Bowden Born: 1969 | Vice President | Since 2013 | Manager, Atlantic since 2008. | N/A | N/A |
Geoffrey Ney Born: 1975 | Vice President | Since 2013 | Manager, Atlantic since 2013; Senior Fund Accountant, Atlantic, 2008-2013. | N/A | N/A |
Todd Proulx Born: 1978 | Vice President | Since 2013 | Manager, Atlantic since 2013; Senior Fund Accountant, Atlantic, 2008-2013. | N/A | N/A |
1The Fund Complex includes the Trust, Forum Funds and Forum ETF Trust and is overseen by different Boards of Trustees. 2Atlantic is a subsidiary of Forum Holdings Corp. I, a Delaware corporation that is wholly owned by Mr. Keffer. |

The views in this report were those of CVR Dynamic Allocation Fund’s (the “Fund”) adviser as of November 30, 2015, and may not reflect their views on the date this report is first published or any time thereafter. These views are intended to assist shareholders in understanding their investment in the Fund and do not constitute investment advice. None of the information presented should be construed as an offer to sell or recommendation of any security mentioned herein.
All investing involves risk including the possible loss of principal. There can be no assurance the Fund will achieve its investment objective. In addition to the general risks of investing, the Fund is subject to additional risks including commodities risk, derivatives risks, ETF risk, risks of foreign investing and model and data risks. Exposure to the commodities markets may subject the Fund to greater volatility than investments in traditional securities. Derivatives, such as options, futures and swaps, can be volatile, and a small investment in a derivative can have a large impact on the performance of the Fund as derivatives can result in losses in excess of the amount invested. Shares of an ETF may trade at a premium or discount to the net asset value of its portfolio securities. Foreign investments may be subject to additional risks, which include international trade, currency, political, regulatory and diplomatic risks, which may affect their value. Given the complexity of the investments and strategies of the Fund, the Adviser relies heavily on quantitative models and data supplied by third parties. Models and Data may prove to be incorrect or incomplete and expose the Fund to potential risks.
CVR DYNAMIC ALLOCATION FUND A MESSAGE TO OUR SHAREHOLDERS (Unaudited) |
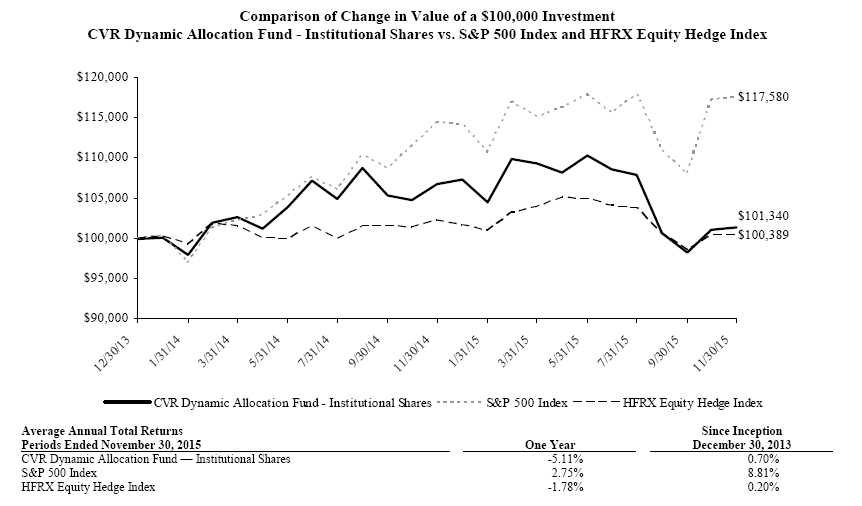
CVR Portfolio Funds is pleased to review the performance of the CVR Dynamic Allocation Fund (the “Fund”) from November 30, 2014 through November 30, 2015. During this period, the Fund returned -5.11% vs. 2.75% for the S&P 500 Index1 (the “S&P 500”) and -1.78% for the HFRX Equity Hedge Index. The investment objective of the Fund is to seek long-term capital appreciation while preserving capital in declining markets.
The Fund pursues its investment objective by investing in three principal investment strategies, each of which is rule-based, leading to an investment process that is unemotional and repeatable. The three strategies are Focused U.S. Equity, Defensive Equity ETF and Absolute Return. We believe that each of the three strategies are subject to different, and in some cases contrary risks such that the value of the Fund’s investments in the aggregate will be subject to less risk, over the long term, than the risk associated with any one of the investment strategies taken by itself.
The interplay of the three strategies provides measureable feedback on market risk that supports rebalancing in the Fund. Focused U.S. Equity provides feedback on equity valuations, Defensive Equity ETF on equity market risk and Absolute Return on correlations across asset classes. The result is a risk managed equity fund that we believe supports better investment outcomes.
The Fund, which typically has 80-90% of its assets exposed to U.S. equity markets through its Focused and Defensive Equity strategies, seeks to capture a majority of equity market performance in risk-on environments and protect against severe drawdowns when markets decline. The Focused U.S. Equity strategy will always stay invested, but both the Defensive Equity ETF and Absolute Return strategies have the potential to protect capital in declining markets. The Defensive Equity ETF strategy utilizes a quantitative model that can raise cash in volatile equity markets and the Absolute Return strategy is designed to be negatively correlated to declining equity markets.
The U.S. equity market was characterized by increasingly narrow performance throughout the year. Much of the positive performance was attributable to a small number of the largest capitalization stocks. This is evident by comparing the S&P 500 ‘market weighted index’ (+2.75%) vs. the S&P 500 ‘equal weighted index’ (-1.50%), a difference of 4.25%. Historically, narrowing market participation has been a negative indicator as concentration of performance in a few names can result in increased equity volatility and deep corrections.
The Fund’s underperformance can be largely attributed to the Focused U.S. Equity strategy. It holds a concentrated basket of 25-30 stocks and we expect periods of underperformance (and outperformance) as a result. Notably, the stocks we own in the Focused U.S. Equity strategy have a combined Return on Assets of 13.51% vs. 7.42% for the S&P 500 index (as of 11/24/15). We believe that consistently holding a portfolio of companies with these profitability attributes will allow us to deliver outsized returns over the long term.
The Defensive Equity strategy performed well during the period. Of note, the risk algorithm associated with the Fund’s Defensive Equity strategy signaled that the Fund should exit its energy exposure (IEO2) in October 2014 and has kept the Fund out of IEO since that time. As a result, the Defensive Equity ETF strategy sidestepped a subsequent decline of more than 22% in energy (as measured by the performance of IEO). We believe this is a good example of how the strategy will respond to protect capital in the event of even broader equity market weakness.
The Absolute Return strategy, due to its modest 10% weight in the portfolio, had a minor contribution to the underperformance of the Fund during the period.
In conclusion, it’s been a challenging year for the equity markets and for the CVR Dynamic Allocation Fund. We’re disappointed by the relative and absolute underperformance of the Fund vs. its benchmarks. As discussed above, underperformance of the Fund was primarily attributable to the Focused U.S. Equity strategy, which has a mid-cap value orientation. Value stocks have now underperformed growth stocks for the past decade, dating to 2006, which is an extended period of underperformance by any measure. History has shown that performance discrepancies between growth and value do not persist indefinitely.
1 The S&P 500 Index is a market capitalization-weighted index of 500 large-capitalization stocks commonly used to represent the U.S. equity market. All returns are total return, reflecting reinvested dividends and capital gain distributions. One cannot invest directly in an index.
2 “IEO” is the ticker for the iShares U.S. Oil & Gas Exploration & Production ETF.
CVR DYNAMIC ALLOCATION FUND A MESSAGE TO OUR SHAREHOLDERS (Unaudited) |
We believe that our risk managed approach to investing the Fund’s assets will provide better investment outcomes over the long term. We are grateful for your support and look forward to the year ahead.
Respectfully submitted,
Pete Higgins & Bill Monaghan
CVR DYNAMIC ALLOCATION FUND PERFORMANCE CHART AND ANAYSIS (Unaudited) |
The following chart reflects the change in the value of a hypothetical $100,000 investment in Institutional Shares, including reinvested dividends and distributions, in the CVR Dynamic Allocation Fund (the “Fund”) compared with the performance of the S&P 500 Index (the "S&P 500") and the HFRX Equity Hedge Index, since inception. The S&P 500 is a broad-based, unmanaged measurement of changes in stock market conditions based on the average of 500 widely held common stocks. The HFRX Equity Hedge Index tracks strategies that maintain positions both long and short in primary equity and equity derivative securities. The total returns of both the S&P 500 and HFRX Equity Hedge Index include the reinvestment of dividends and income. The total return of the Fund includes operating expenses that reduce returns, while the total returns of the S&P 500 and HFRX Equity Hedge Index do not include expenses. The Fund is professionally managed while the S&P 500 and HFRX Equity Hedge Index are unmanaged and are not available for investment.
Performance data quoted represents past performance and is no guarantee of future results. Current performance may be lower or higher than the performance data quoted. Investment return and principal value will fluctuate so that shares, when redeemed, may be worth more or less than original cost. For the most recent month-end performance, please call (855) 328-7691. As stated in the Fund's prospectus, the annual operating expense ratio (gross) for Institutional Shares is 3.32%. However, the Fund's adviser has agreed to contractually waive its fees and/or reimburse Fund expenses to limit total annual Fund operating expenses (excluding all taxes, interest, portfolio transaction expenses, proxy expenses and extraordinary expenses) of Institutional Shares to 1.65%, through March 31, 2016. The Fund may repay the Adviser for fees waived and expenses reimbursed pursuant to the expense cap if such payment is made within three years of the fees waived or reimbursed, is approved by the Fund’s Board of Trustees and the reimbursement does not cause the Fund’s net annual operating expenses of that class to exceed the expense cap in place at the time the fees were waived. The performance table and graph do not reflect the deduction of taxes that a shareholder would pay on Fund distributions or the redemption of Fund shares. Returns greater than one year are annualized.
CVR DYNAMIC ALLOCATION FUND SCHEDULE OF INVESTMENTS |
| | Shares | | Security Description | | Value | |
Common Stock - 79.0% |
Aerospace & Defense - 4.3% |
| | 1,064 | | Curtiss-Wright Corp. | | $ | 74,916 | |
| | 1,042 | | General Dynamics Corp. | | 152,611 | |
| | 1,467 | | HEICO Corp. | | 75,521 | |
| | 599 | | L-3 Communications Holdings, Inc. | | 73,324 | |
| | 666 | | Lockheed Martin Corp. | | 145,961 | |
| | 868 | | Orbital ATK, Inc. | | 74,570 | |
| | 824 | | Rockwell Collins, Inc. | | 76,368 | |
| | 826 | | Teledyne Technologies, Inc. (a) | | 76,413 | |
| | 1,016 | | The Boeing Co. | | 147,777 | |
| | 320 | | TransDigm Group, Inc. (a) | | 75,082 | |
| | | 972,543 | |
Apparel, Shoes, etc. - 2.6% |
| | 29,116 | | Francesca's Holdings Corp. (a) | | 434,702 | |
| | 547 | | NIKE, Inc., Class B | | 72,357 | |
| | 1,034 | | The TJX Cos., Inc. | | 73,000 | |
| | | 580,059 | |
Auto - 0.3% |
| | 4,970 | | Ford Motor Co. | | 71,220 | |
Basic Materials - 6.7% |
| | 1,080 | | Air Products & Chemicals, Inc. | | 147,841 | |
| | 1,700 | | CF Industries Holdings, Inc. | | 78,438 | |
| | 2,273 | | E.I. du Pont de Nemours & Co. | | 153,064 | |
| | 1,268 | | Ecolab, Inc. | | 151,095 | |
| | 1,819 | | International Paper Co. | | 76,089 | |
| | 1,612 | | LyondellBasell Industries NV, Class A | | 154,462 | |
| | 1,574 | | Monsanto Co. | | 149,782 | |
| | 1,438 | | PPG Industries, Inc. | | 152,054 | |
| | 1,314 | | Praxair, Inc. | | 148,219 | |
| | 2,838 | | The Dow Chemical Co. | | 147,945 | |
| | 2,428 | | The Mosaic Co. | | 76,822 | |
| | 275 | | The Sherwin-Williams Co. | | 75,919 | |
| | | 1,511,730 | |
Biotechnology - 2.4% |
| | 1,095 | | Celgene Corp. (a) | | 119,848 | |
| | 1,270 | | Gilead Sciences, Inc. | | 134,569 | |
| | 422 | | Incyte Corp., Ltd. (a) | | 48,209 | |
| | 247 | | Regeneron Pharmaceuticals, Inc. (a) | | 134,492 | |
| | 333 | | United Therapeutics Corp. (a) | | 50,826 | |
| | 406 | | Vertex Pharmaceuticals, Inc. (a) | | 52,520 | |
| | | 540,464 | |
Building - Heavy Construction - 1.9% |
| | 8,840 | | Fluor Corp. | | 429,624 | |
Chemicals - 4.5% |
| | 16,115 | | Chemtura Corp. (a) | | 495,053 | |
| | 9,160 | | Innospec, Inc. | | 534,944 | |
| | | 1,029,997 | |
| | Shares | | Security Description | | Value | |
Commercial Services - 4.0% |
| | 25,707 | | Navigant Consulting, Inc. (a) | | $ | 449,872 | |
| | 6,293 | | Omnicom Group, Inc. | | 465,179 | |
| | | 915,051 | |
Communications - 2.7% |
| | 13,335 | | Comtech Telecommunications Corp. | | 293,770 | |
| | 34,833 | | TiVo, Inc. (a) | | 313,149 | |
| | | 606,919 | |
Financials - 4.9% |
| | 6,077 | | Bank of America Corp. | | 105,922 | |
| | 845 | | Capital One Financial Corp. | | 66,341 | |
| | 1,962 | | Citigroup, Inc. | | 106,125 | |
| | 5,741 | | Huntington Bancshares, Inc. | | 67,112 | |
| | 1,590 | | JPMorgan Chase & Co. | | 106,021 | |
| | 535 | | M&T Bank Corp. | | 67,052 | |
| | 673 | | MasterCard, Inc., Class A | | 65,900 | |
| | 2,421 | | PayPal Holdings, Inc. (a) | | 85,364 | |
| | 1,537 | | SunTrust Banks, Inc. | | 66,737 | |
| | 1,122 | | The PNC Financial Services Group, Inc. | | 107,162 | |
| | 2,412 | | U.S. Bancorp | | 105,863 | |
| | 837 | | Visa, Inc., Class A | | 66,131 | |
| | 1,920 | | Wells Fargo & Co. | | 105,792 | |
| | | 1,121,522 | |
Food - 2.7% |
| | 3,362 | | Cal-Maine Foods, Inc. | | 183,263 | |
| | 5,737 | | Sanderson Farms, Inc. | | 429,185 | |
| | | 612,448 | |
Health Care - 2.9% |
| | 462 | | Aetna, Inc. | | 47,470 | |
| | 520 | | AmerisourceBergen Corp. | | 51,293 | |
| | 630 | | Amsurg Corp. (a) | | 52,958 | |
| | 838 | | Centene Corp. (a) | | 48,394 | |
| | 268 | | CR Bard, Inc. | | 50,068 | |
| | 321 | | Edwards Lifesciences Corp. (a) | | 52,323 | |
| | 576 | | Express Scripts Holding Co. (a) | | 49,236 | |
| | 329 | | Henry Schein, Inc. (a) | | 51,482 | |
| | 721 | | IDEXX Laboratories, Inc. (a) | | 51,061 | |
| | 333 | | Illumina, Inc. (a) | | 61,239 | |
| | 460 | | Sirona Dental Systems, Inc. (a) | | 49,901 | |
| | 377 | | Thermo Fisher Scientific, Inc. | | 52,177 | |
| | 409 | | Universal Health Services, Inc., Class B | | 49,702 | |
| | | 667,304 | |
Industrials - 0.7% |
| | 2,027 | | Graco, Inc. | | 152,957 | |
| See Notes to Financial Statements. | 4 | |
CVR DYNAMIC ALLOCATION FUND SCHEDULE OF INVESTMENTS |
| | Shares | | Security Description | | Value | |
Internet - 12.1% |
| | 954 | | Alphabet, Inc., Class A (a) | | $ | 727,759 | |
| | 445 | | Amazon.com, Inc. (a) | | 295,836 | |
| | 3,143 | | eBay, Inc. (a) | | 93,001 | |
| | 302 | | Equinix, Inc. REIT | | 89,543 | |
| | 4,050 | | Expedia, Inc. | | 498,596 | |
| | 1,387 | | Facebook, Inc., Class A (a) | | 144,581 | |
| | 372 | | LinkedIn Corp., Class A (a) | | 90,437 | |
| | 29,326 | | Liquidity Services, Inc. (a) | | 200,003 | |
| | 1,917 | | Netflix, Inc. (a) | | 236,424 | |
| | 155 | | The Priceline Group, Inc. (a) | | 193,572 | |
| | 1,077 | | TripAdvisor, Inc. (a) | | 88,712 | |
| | 1,096 | | VeriSign, Inc. (a) | | 98,026 | |
| | | 2,756,490 | |
Media - 5.7% |
| | 13,679 | | Discovery Communications, Inc., Class A (a) | | 425,964 | |
| | 1,209 | | The Walt Disney Co. | | 137,185 | |
| | 1,026 | | Time Warner, Inc. | | 71,800 | |
| | 19,206 | | Time, Inc. | | 319,588 | |
| | 26,430 | | Tribune Publishing Co. | | 269,057 | |
| | 2,413 | | Twenty-First Century Fox, Inc., Class A | | 71,208 | |
| | | 1,294,802 | |
Pharmaceutical - 0.7% |
| | 164 | | Allergan PLC (a) | | 51,478 | |
| | 771 | | Bristol-Myers Squibb Co. | | 51,665 | |
| | 315 | | Perrigo Co PLC | | 47,058 | |
| | | 150,201 | |
Retail - Restaurant - 0.8% |
| | 1,019 | | McDonald's Corp. | | 116,329 | |
| | 1,170 | | Starbucks Corp. | | 71,826 | |
| | | 188,155 | |
Retail - Wholesale/Building - 0.8% |
| | 958 | | Lowe's Cos., Inc. | | 73,383 | |
| | 892 | | The Home Depot, Inc. | | 119,421 | |
| | | 192,804 | |
Technology - 10.3% |
| | 4,289 | | Accenture PLC, Class A | | 459,867 | |
| | 12,698 | | CA, Inc. | | 356,941 | |
| | 9,097 | | CGI Group, Inc., Class A (a) | | 395,719 | |
| | 16,055 | | NeuStar, Inc., Class A (a) | | 404,586 | |
| | 25,500 | | RPX Corp. (a) | | 353,685 | |
| | 1,131 | | Salesforce.com, Inc. (a) | | 90,129 | |
| | 9,300 | | Teradata Corp. (a) | | 278,163 | |
| | | 2,339,090 | |
Telecommunications - 1.4% |
| | 16,652 | | Inteliquent, Inc. | | 319,885 | |
| | | | |
| | Shares | | Security Description | | Value | |
Telecommunications - Cable - 0.9% |
| | 2,076 | | Comcast Corp., Class A | | $ | 126,345 | |
| | 393 | | Time Warner Cable, Inc. | | 72,615 | |
| | | 198,960 | |
Transportation - Freight - 0.3% |
| | 729 | | United Parcel Service, Inc., Class B | | 75,094 | |
Transportation - Logistics - 4.7% |
| | 7,604 | | CH Robinson Worldwide, Inc. | | 512,738 | |
| | 11,475 | | Expeditors International of Washington, Inc. | | 556,996 | |
| | | 1,069,734 | |
Transportation - Rails - 0.7% |
| | 1,756 | | Union Pacific Corp. | | 147,416 | |
Total Common Stock (Cost $18,275,535) | | 17,944,469 | |
Investment Companies - 8.5% |
| | 15,574 | | iShares North American Tech-Software ETF | | 1,643,524 | |
| | 4,062 | | SPDR S&P Insurance ETF | | 293,967 | |
Total Investment Companies (Cost $1,798,328) | | 1,937,491 | |
Money Market Fund - 2.1% |
| | 467,467 | | Fidelity Institutional Cash Money Market Fund, 0.12% (b) (Cost $467,467) | | 467,467 | |
Total Investments - 89.6% (Cost $20,541,330)* | | $ | 20,349,427 | |
| Other Assets & Liabilities, Net – 10.4% | | 2,363,950 | |
| Net Assets – 100.0% | | $ | 22,713,377 | |
| See Notes to Financial Statements | 5 | |
CVR DYNAMIC ALLOCATION FUND NOTES TO SCHEDULE OF INVESTMENTS |
| PLC | Public Limited Company |
| REIT | Real Estate Investment Trust |
| (a) | Non-income producing security. |
| (b) | Variable rate security. Rate presented is as of November 30, 2015. |
| | * Cost for federal income tax purposes is $20,587,781 and net unrealized depreciation consists of: |
| Gross Unrealized Appreciation | | $ | 943,673 | |
| Gross Unrealized Depreciation | | | (1,182,027 | ) |
| Net Unrealized Depreciation | | $ | (238,354 | ) |
| | As of November 30, 2015, the Fund had the following forward currency contracts outstanding: |
| Counterparty | | Contracts to Purchase/(Sell) | | Settlement Date | | Settlement Value | | Net Unrealized Appreciation (Depreciation) |
| Jefferies & Co., Inc. | | (140,000 | ) | | Australian Dollar | | 12/03/15 | | $ | 100,726 | | | $ | (505 | ) |
| | | (120,000 | ) | | Australian Dollar | | 12/03/15 | | | 84,518 | | | | (2,251 | ) |
| | | (100,000 | ) | | Australian Dollar | | 12/03/15 | | | 70,072 | | | | (2,236 | ) |
| | | (100,000 | ) | | Australian Dollar | | 12/03/15 | | | 72,615 | | | | 307 | |
| | | (80,000 | ) | | Australian Dollar | | 12/03/15 | | | 57,846 | | | | - | |
| | | (63,000 | ) | | Australian Dollar | | 12/03/15 | | | 45,225 | | | | (329 | ) |
| | | (60,000 | ) | | Australian Dollar | | 12/03/15 | | | 42,411 | | | | (974 | ) |
| | | (14,000 | ) | | Australian Dollar | | 12/03/15 | | | 9,982 | | | | (141 | ) |
| | | 60,000 | | | Australian Dollar | | 12/03/15 | | | (41,841 | ) | | | 1,544 | |
| | | 63,000 | | | Australian Dollar | | 12/03/15 | | | (44,747 | ) | | | 807 | |
| | | 63,000 | | | Australian Dollar | | 12/03/15 | | | (44,701 | ) | | | 853 | |
| | | 80,000 | | | Australian Dollar | | 12/03/15 | | | (58,541 | ) | | | (695 | ) |
| | | 80,000 | | | Australian Dollar | | 12/03/15 | | | (57,867 | ) | | | (21 | ) |
| | | 84,000 | | | Australian Dollar | | 12/03/15 | | | (58,976 | ) | | | 1,762 | |
| | | 100,000 | | | Australian Dollar | | 12/03/15 | | | (71,219 | ) | | | 1,089 | |
| | | 147,000 | | | Australian Dollar | | 12/03/15 | | | (106,222 | ) | | | 70 | |
| | | (147,000 | ) | | Australian Dollar | | 03/03/16 | | | 105,733 | | | | (72 | ) |
| | | 63,000 | | | Australian Dollar | | 03/03/16 | | | (45,451 | ) | | | (106 | ) |
| | | 63,000 | | | Australian Dollar | | 03/03/16 | | | (45,135 | ) | | | 210 | |
| | | 126,000 | | | Australian Dollar | | 03/03/16 | | | (90,500 | ) | | | 190 | |
| | | (1,940,000 | ) | | Brazilian Real | | 12/03/15 | | | 460,152 | | | | (40,794 | ) |
| | | (1,365,000 | ) | | Brazilian Real | | 12/03/15 | | | 367,925 | | | | 15,455 | |
| | | 12,000 | | | Brazilian Real | | 12/03/15 | | | (3,079 | ) | | | 19 | |
| | | 168,000 | | | Brazilian Real | | 12/03/15 | | | (44,884 | ) | | | (1,503 | ) |
| | | 180,000 | | | Brazilian Real | | 12/03/15 | | | (46,142 | ) | | | 338 | |
| | | 180,000 | | | Brazilian Real | | 12/03/15 | | | (45,113 | ) | | | 1,367 | |
| | | 210,000 | | | Brazilian Real | | 12/03/15 | | | (54,567 | ) | | | (341 | ) |
| | | 210,000 | | | Brazilian Real | | 12/03/15 | | | (54,959 | ) | | | (733 | ) |
| | | 240,000 | | | Brazilian Real | | 12/03/15 | | | (62,762 | ) | | | (789 | ) |
| | | 252,000 | | | Brazilian Real | | 12/03/15 | | | (66,081 | ) | | | (1,010 | ) |
| | | 260,000 | | | Brazilian Real | | 12/03/15 | | | (64,951 | ) | | | 2,186 | |
| | | 273,000 | | | Brazilian Real | | 12/03/15 | | | (71,503 | ) | | | (1,009 | ) |
| | | 300,000 | | | Brazilian Real | | 12/03/15 | | | (74,056 | ) | | | 3,410 | |
| | | 340,000 | | | Brazilian Real | | 12/03/15 | | | (84,936 | ) | | | 2,858 | |
| | | 340,000 | | | Brazilian Real | | 12/03/15 | | | (87,912 | ) | | | (117 | ) |
| | | 340,000 | | | Brazilian Real | | 12/03/15 | | | (86,845 | ) | | | 949 | |
| | | 1,365,000 | | | Brazilian Real | | 03/03/16 | | | (357,714 | ) | | | (15,261 | ) |
| | | (140,000 | ) | | Canadian Dollars | | 12/03/15 | | | 104,439 | | | | (394 | ) |
| | | (126,000 | ) | | Canadian Dollars | | 12/03/15 | | | 94,678 | | | | 328 | |
| | | (120,000 | ) | | Canadian Dollars | | 12/03/15 | | | 90,971 | | | | 1,114 | |
| See Notes to Financial Statements | 6 | |
CVR DYNAMIC ALLOCATION FUND NOTES TO SCHEDULE OF INVESTMENTS |
| Counterparty | | Contracts to Purchase/(Sell) | | Settlement Date | | Settlement Value | | Net Unrealized Appreciation (Depreciation) |
| Jefferies & Co., Inc. – (continued) | | (120,000 | ) | | Canadian Dollars | | 12/03/15 | | $ | 91,441 | | | $ | 1,584 | |
| | | (100,000 | ) | | Canadian Dollars | | 12/03/15 | | | 75,983 | | | | 1,102 | |
| | | (100,000 | ) | | Canadian Dollars | | 12/03/15 | | | 77,312 | | | | 2,431 | |
| | | (84,000 | ) | | Canadian Dollars | | 12/03/15 | | | 63,238 | | | | 338 | |
| | | (80,000 | ) | | Canadian Dollars | | 12/03/15 | | | 60,399 | | | | 494 | |
| | | (63,000 | ) | | Canadian Dollars | | 12/03/15 | | | 47,282 | | | | 107 | |
| | | (63,000 | ) | | Canadian Dollars | | 12/03/15 | | | 47,427 | | | | 251 | |
| | | (60,000 | ) | | Canadian Dollars | | 12/03/15 | | | 46,208 | | | | 1,279 | |
| | | (60,000 | ) | | Canadian Dollars | | 12/03/15 | | | 44,766 | | | | (162 | ) |
| | | (60,000 | ) | | Canadian Dollars | | 12/03/15 | | | 45,319 | | | | 391 | |
| | | (40,000 | ) | | Canadian Dollars | | 12/03/15 | | | 30,645 | | | | 692 | |
| | | 61,000 | | | Canadian Dollars | | 12/03/15 | | | (46,583 | ) | | | (906 | ) |
| | | 105,000 | | | Canadian Dollars | | 12/03/15 | | | (80,350 | ) | | | (1,725 | ) |
| | | 1,050,000 | | | Canadian Dollars | | 12/03/15 | | | (787,756 | ) | | | (1,505 | ) |
| | | (1,050,000 | ) | | Canadian Dollars | | 03/03/16 | | | 787,656 | | | | 1,423 | |
| | | (105,000 | ) | | Canadian Dollars | | 03/03/16 | | | 78,579 | | | | (45 | ) |
| | | (84,000 | ) | | Canadian Dollars | | 03/03/16 | | | 62,902 | | | | 3 | |
| | | (42,000,000 | ) | | Chilean Peso | | 12/03/15 | | | 59,272 | | | | 190 | |
| | | (42,000,000 | ) | | Chilean Peso | | 12/03/15 | | | 59,769 | | | | 687 | |
| | | (42,000,000 | ) | | Chilean Peso | | 12/03/15 | | | 58,676 | | | | (406 | ) |
| | | (40,000,000 | ) | | Chilean Peso | | 12/03/15 | | | 57,204 | | | | 936 | |
| | | (40,000,000 | ) | | Chilean Peso | | 12/03/15 | | | 58,182 | | | | 1,913 | |
| | | (21,000,000 | ) | | Chilean Peso | | 12/03/15 | | | 29,494 | | | | (47 | ) |
| | | (21,000,000 | ) | | Chilean Peso | | 12/03/15 | | | 30,501 | | | | 960 | |
| | | (20,000,000 | ) | | Chilean Peso | | 12/03/15 | | | 28,431 | | | | 297 | |
| | | 8,000,000 | | | Chilean Peso | | 12/03/15 | | | (11,524 | ) | | | (270 | ) |
| | | 20,000,000 | | | Chilean Peso | | 12/03/15 | | | (28,843 | ) | | | (709 | ) |
| | | 40,000,000 | | | Chilean Peso | | 12/03/15 | | | (57,912 | ) | | | (1,644 | ) |
| | | 60,000,000 | | | Chilean Peso | | 12/03/15 | | | (87,311 | ) | | | (2,908 | ) |
| | | 60,000,000 | | | Chilean Peso | | 12/03/15 | | | (87,559 | ) | | | (3,156 | ) |
| | | 80,000,000 | | | Chilean Peso | | 12/03/15 | | | (112,931 | ) | | | (393 | ) |
| | | (21,000,000 | ) | | Chilean Peso | | 03/03/16 | | | 29,215 | | | | (38 | ) |
| | | 42,000,000 | | | Chilean Peso | | 03/03/16 | | | (58,435 | ) | | | 71 | |
| | | (231,000,000 | ) | | Colombian Peso | | 12/03/15 | | | 75,564 | | | | 2,114 | |
| | | (220,000,000 | ) | | Colombian Peso | | 12/03/15 | | | 69,797 | | | | (156 | ) |
| | | (126,000,000 | ) | | Colombian Peso | | 12/03/15 | | | 41,002 | | | | 938 | |
| | | 9,000,000 | | | Colombian Peso | | 12/03/15 | | | (3,136 | ) | | | (274 | ) |
| | | 21,000,000 | | | Colombian Peso | | 12/03/15 | | | (7,119 | ) | | | (441 | ) |
| | | 147,000,000 | | | Colombian Peso | | 12/03/15 | | | (52,444 | ) | | | (5,703 | ) |
| | | 160,000,000 | | | Colombian Peso | | 12/03/15 | | | (54,385 | ) | | | (3,510 | ) |
| | | 240,000,000 | | | Colombian Peso | | 12/03/15 | | | (83,016 | ) | | | (6,704 | ) |
| | | (273,000,000 | ) | | Colombian Peso | | 03/03/16 | | | 85,849 | | | | (169 | ) |
| | | 126,000,000 | | | Colombian Peso | | 03/03/16 | | | (40,645 | ) | | | (945 | ) |
| | | (3,600,000 | ) | | Czechoslovakian Koruna | | 12/03/15 | | | 148,408 | | | | 7,696 | |
| | | (2,400,000 | ) | | Czechoslovakian Koruna | | 12/03/15 | | | 98,664 | | | | 4,856 | |
| | | (2,000,000 | ) | | Czechoslovakian Koruna | | 12/03/15 | | | 81,276 | | | | 3,103 | |
| | | (1,600,000 | ) | | Czechoslovakian Koruna | | 12/03/15 | | | 65,338 | | | | 2,799 | |
| | | (1,470,000 | ) | | Czechoslovakian Koruna | | 12/03/15 | | | 59,149 | | | | 1,691 | |
| | | (1,400,000 | ) | | Czechoslovakian Koruna | | 12/03/15 | | | 58,023 | | | | 3,301 | |
| | | (410,000 | ) | | Czechoslovakian Koruna | | 12/03/15 | | | 16,713 | | | | 687 | |
| | | 1,200,000 | | | Czechoslovakian Koruna | | 12/03/15 | | | (50,352 | ) | | | (3,448 | ) |
| | | 1,600,000 | | | Czechoslovakian Koruna | | 12/03/15 | | | (65,626 | ) | | | (3,087 | ) |
| | | 10,080,000 | | | Czechoslovakian Koruna | | 12/03/15 | | | (397,038 | ) | | | (3,044 | ) |
| See Notes to Financial Statements | 7 | |
CVR DYNAMIC ALLOCATION FUND NOTES TO SCHEDULE OF INVESTMENTS |
| Counterparty | | Contracts to Purchase/(Sell) | | Settlement Date | | Settlement Value | | Net Unrealized Appreciation (Depreciation) |
| Jefferies & Co., Inc. – (continued) | | (10,080,000 | ) | | Czechoslovakian Koruna | | 03/03/16 | | $ | 398,671 | | | $ | 2,745 | |
| | | (1,470,000 | ) | | Czechoslovakian Koruna | | 03/03/16 | | | 57,833 | | | | 94 | |
| | | (340,000 | ) | | European Union Euro | | 12/03/15 | | | 381,509 | | | | 22,243 | |
| | | (84,000 | ) | | European Union Euro | | 12/03/15 | | | 90,578 | | | | 1,818 | |
| | | (63,000 | ) | | European Union Euro | | 12/03/15 | | | 67,380 | | | | 810 | |
| | | (63,000 | ) | | European Union Euro | | 12/03/15 | | | 67,252 | | | | 682 | |
| | | (40,000 | ) | | European Union Euro | | 12/03/15 | | | 45,539 | | | | 3,273 | |
| | | 40,000 | | | European Union Euro | | 12/03/15 | | | (44,938 | ) | | | (2,671 | ) |
| | | 40,000 | | | European Union Euro | | 12/03/15 | | | (44,259 | ) | | | (1,992 | ) |
| | | 40,000 | | | European Union Euro | | 12/03/15 | | | (44,673 | ) | | | (2,407 | ) |
| | | 40,000 | | | European Union Euro | | 12/03/15 | | | (44,300 | ) | | | (2,033 | ) |
| | | 42,000 | | | European Union Euro | | 12/03/15 | | | (44,701 | ) | | | (321 | ) |
| | | 42,000 | | | European Union Euro | | 12/03/15 | | | (45,697 | ) | | | (1,317 | ) |
| | | 42,000 | | | European Union Euro | | 12/03/15 | | | (44,927 | ) | | | (547 | ) |
| | | 63,000 | | | European Union Euro | | 12/03/15 | | | (67,775 | ) | | | (1,205 | ) |
| | | 115,000 | | | European Union Euro | | 12/03/15 | | | (127,105 | ) | | | (5,588 | ) |
| | | 126,000 | | | European Union Euro | | 12/03/15 | | | (137,792 | ) | | | (4,652 | ) |
| | | (42,000 | ) | | European Union Euro | | 03/03/16 | | | 44,816 | | | | 314 | |
| | | (26,600,000 | ) | | Hungarian Forint | | 12/03/15 | | | 93,844 | | | | 3,442 | |
| | | (23,100,000 | ) | | Hungarian Forint | | 12/03/15 | | | 79,126 | | | | 619 | |
| | | (16,000,000 | ) | | Hungarian Forint | | 12/03/15 | | | 56,650 | | | | 2,273 | |
| | | (16,000,000 | ) | | Hungarian Forint | | 12/03/15 | | | 58,340 | | | | 3,963 | |
| | | (12,600,000 | ) | | Hungarian Forint | | 12/03/15 | | | 43,113 | | | | 291 | |
| | | (10,000,000 | ) | | Hungarian Forint | | 12/03/15 | | | 35,815 | | | | 1,830 | |
| | | 12,000,000 | | | Hungarian Forint | | 12/03/15 | | | (42,980 | ) | | | (2,198 | ) |
| | | 12,000,000 | | | Hungarian Forint | | 12/03/15 | | | (44,004 | ) | | | (3,222 | ) |
| | | 12,600,000 | | | Hungarian Forint | | 12/03/15 | | | (43,038 | ) | | | (216 | ) |
| | | 32,000,000 | | | Hungarian Forint | | 12/03/15 | | | (114,363 | ) | | | (5,608 | ) |
| | | 35,700,000 | | | Hungarian Forint | | 12/03/15 | | | (121,698 | ) | | | (369 | ) |
| | | (35,700,000 | ) | | Hungarian Forint | | 03/03/16 | | | 121,627 | | | | 315 | |
| | | (29,400,000 | ) | | Indian Rupee | | 12/03/15 | | | 442,771 | | | | 1,351 | |
| | | (10,500,000 | ) | | Indian Rupee | | 12/03/15 | | | 160,037 | | | | 2,386 | |
| | | (4,200,000 | ) | | Indian Rupee | | 12/03/15 | | | 62,987 | | | | (73 | ) |
| | | (4,200,000 | ) | | Indian Rupee | | 12/03/15 | | | 63,205 | | | | 145 | |
| | | (4,200,000 | ) | | Indian Rupee | | 12/03/15 | | | 63,607 | | | | 547 | |
| | | (2,100,000 | ) | | Indian Rupee | | 12/03/15 | | | 31,920 | | | | 390 | |
| | | (2,000,000 | ) | | Indian Rupee | | 12/03/15 | | | 30,665 | | | | 637 | |
| | | 2,000,000 | | | Indian Rupee | | 12/03/15 | | | (30,441 | ) | | | (413 | ) |
| | | 2,000,000 | | | Indian Rupee | | 12/03/15 | | | (30,558 | ) | | | (529 | ) |
| | | 2,100,000 | | | Indian Rupee | | 12/03/15 | | | (31,842 | ) | | | (312 | ) |
| | | 4,000,000 | | | Indian Rupee | | 12/03/15 | | | (61,312 | ) | | | (1,255 | ) |
| | | 4,000,000 | | | Indian Rupee | | 12/03/15 | | | (60,359 | ) | | | (302 | ) |
| | | 4,000,000 | | | Indian Rupee | | 12/03/15 | | | (60,790 | ) | | | (733 | ) |
| | | 4,000,000 | | | Indian Rupee | | 12/03/15 | | | (60,615 | ) | | | (558 | ) |
| | | 4,000,000 | | | Indian Rupee | | 12/03/15 | | | (61,153 | ) | | | (1,096 | ) |
| | | 6,000,000 | | | Indian Rupee | | 12/03/15 | | | (90,676 | ) | | | (590 | ) |
| | | 6,000,000 | | | Indian Rupee | | 12/03/15 | | | (90,772 | ) | | | (686 | ) |
| | | 8,000,000 | | | Indian Rupee | | 12/03/15 | | | (119,743 | ) | | | 372 | |
| | | 10,500,000 | | | Indian Rupee | | 12/03/15 | | | (159,019 | ) | | | (1,369 | ) |
| | | (6,300,000 | ) | | Indian Rupee | | 03/03/16 | | | 93,541 | | | | 216 | |
| | | 29,400,000 | | | Indian Rupee | | 03/03/16 | | | (436,720 | ) | | | (1,203 | ) |
| | | (7,980,000,000 | ) | | Indonesian Rupiah | | 12/03/15 | | | 583,333 | | | | 8,965 | |
| | | (6,400,000,000 | ) | | Indonesian Rupiah | | 12/03/15 | | | 422,164 | | | | (38,483 | ) |
| See Notes to Financial Statements | 8 | |
CVR DYNAMIC ALLOCATION FUND NOTES TO SCHEDULE OF INVESTMENTS |
| Counterparty | | Contracts to Purchase/(Sell) | | Settlement Date | | Settlement Value | | Net Unrealized Appreciation (Depreciation) |
| Jefferies & Co., Inc. – (continued) | | (840,000,000 | ) | | Indonesian Rupiah | | 12/03/15 | | $ | 61,856 | | | $ | 1,396 | |
| | | (640,000,000 | ) | | Indonesian Rupiah | | 12/03/15 | | | 46,461 | | | | 396 | |
| | | 400,000,000 | | | Indonesian Rupiah | | 12/03/15 | | | (28,881 | ) | | | (90 | ) |
| | | 630,000,000 | | | Indonesian Rupiah | | 12/03/15 | | | (45,785 | ) | | | (440 | ) |
| | | 630,000,000 | | | Indonesian Rupiah | | 12/03/15 | | | (46,154 | ) | | | (809 | ) |
| | | 840,000,000 | | | Indonesian Rupiah | | 12/03/15 | | | (61,561 | ) | | | (1,101 | ) |
| | | 1,000,000,000 | | | Indonesian Rupiah | | 12/03/15 | | | (73,529 | ) | | | (1,553 | ) |
| | | 1,050,000,000 | | | Indonesian Rupiah | | 12/03/15 | | | (75,894 | ) | | | (320 | ) |
| | | 1,400,000,000 | | | Indonesian Rupiah | | 12/03/15 | | | (96,319 | ) | | | 4,447 | |
| | | 1,600,000,000 | | | Indonesian Rupiah | | 12/03/15 | | | (108,659 | ) | | | 6,503 | |
| | | 1,600,000,000 | | | Indonesian Rupiah | | 12/03/15 | | | (113,114 | ) | | | 2,047 | |
| | | 1,600,000,000 | | | Indonesian Rupiah | | 12/03/15 | | | (114,490 | ) | | | 671 | |
| | | 2,310,000,000 | | | Indonesian Rupiah | | 12/03/15 | | | (169,107 | ) | | | (2,842 | ) |
| | | 2,800,000,000 | | | Indonesian Rupiah | | 12/03/15 | | | (199,786 | ) | | | 1,747 | |
| | | 840,000,000 | | | Indonesian Rupiah | | 03/03/16 | | | (60,000 | ) | | | (795 | ) |
| | | 7,980,000,000 | | | Indonesian Rupiah | | 03/03/16 | | | (570,611 | ) | | | (8,165 | ) |
| | | (8,400,000 | ) | | Japanese Yen | | 12/03/15 | | | 68,229 | | | | (17 | ) |
| | | (8,400,000 | ) | | Japanese Yen | | 12/03/15 | | | 68,905 | | | | 659 | |
| | | (8,000,000 | ) | | Japanese Yen | | 12/03/15 | | | 66,781 | | | | 1,785 | |
| | | (8,000,000 | ) | | Japanese Yen | | 12/03/15 | | | 66,844 | | | | 1,848 | |
| | | (6,300,000 | ) | | Japanese Yen | | 12/03/15 | | | 51,175 | | | | (9 | ) |
| | | (6,300,000 | ) | | Japanese Yen | | 12/03/15 | | | 51,177 | | | | (8 | ) |
| | | (6,000,000 | ) | | Japanese Yen | | 12/03/15 | | | 49,880 | | | | 1,133 | |
| | | (6,000,000 | ) | | Japanese Yen | | 12/03/15 | | | 50,429 | | | | 1,681 | |
| | | (6,000,000 | ) | | Japanese Yen | | 12/03/15 | | | 50,208 | | | | 1,460 | |
| | | (4,000,000 | ) | | Japanese Yen | | 12/03/15 | | | 33,338 | | | | 840 | |
| | | 6,000,000 | | | Japanese Yen | | 12/03/15 | | | (50,121 | ) | | | (1,374 | ) |
| | | 6,000,000 | | | Japanese Yen | | 12/03/15 | | | (49,931 | ) | | | (1,184 | ) |
| | | 26,000,000 | | | Japanese Yen | | 12/03/15 | | | (217,072 | ) | | | (5,834 | ) |
| | | 29,400,000 | | | Japanese Yen | | 12/03/15 | | | (239,980 | ) | | | (1,119 | ) |
| | | (29,400,000 | ) | | Japanese Yen | | 03/03/16 | | | 240,546 | | | | 1,099 | |
| | | 8,400,000 | | | Japanese Yen | | 03/03/16 | | | (68,643 | ) | | | (229 | ) |
| | | (1,890,000 | ) | | Mexican Peso | | 12/03/15 | | | 114,859 | | | | 879 | |
| | | (1,200,000 | ) | | Mexican Peso | | 12/03/15 | | | 71,793 | | | | (575 | ) |
| | | (1,000,000 | ) | | Mexican Peso | | 12/03/15 | | | 60,150 | | | | (156 | ) |
| | | (840,000 | ) | | Mexican Peso | | 12/03/15 | | | 50,031 | | | | (627 | ) |
| | | (840,000 | ) | | Mexican Peso | | 12/03/15 | | | 50,381 | | | | (276 | ) |
| | | (630,000 | ) | | Mexican Peso | | 12/03/15 | | | 37,530 | | | | (463 | ) |
| | | (600,000 | ) | | Mexican Peso | | 12/03/15 | | | 36,421 | | | | 237 | |
| | | 120,000 | | | Mexican Peso | | 12/03/15 | | | (7,261 | ) | | | (24 | ) |
| | | 800,000 | | | Mexican Peso | | 12/03/15 | | | (48,068 | ) | | | 178 | |
| | | 840,000 | | | Mexican Peso | | 12/03/15 | | | (49,998 | ) | | | 660 | |
| | | 840,000 | | | Mexican Peso | | 12/03/15 | | | (50,832 | ) | | | (175 | ) |
| | | 4,400,000 | | | Mexican Peso | | 12/03/15 | | | (257,883 | ) | | | 7,467 | |
| | | 840,000 | | | Mexican Peso | | 03/03/16 | | | (50,440 | ) | | | (83 | ) |
| | | 1,260,000 | | | Mexican Peso | | 03/03/16 | | | (75,523 | ) | | | 12 | |
| | | 1,890,000 | | | Mexican Peso | | 03/03/16 | | | (114,210 | ) | | | (906 | ) |
| | | (504,000 | ) | | New Romanian Lei | | 12/03/15 | | | 123,803 | | | | 4,314 | |
| | | (441,000 | ) | | New Romanian Lei | | 12/03/15 | | | 106,483 | | | | 1,931 | |
| | | (221,000 | ) | | New Romanian Lei | | 12/03/15 | | | 54,893 | | | | 2,499 | |
| | | (210,000 | ) | | New Romanian Lei | | 12/03/15 | | | 50,357 | | | | 571 | |
| | | (160,000 | ) | | New Romanian Lei | | 12/03/15 | | | 39,681 | | | | 1,748 | |
| | | 180,000 | | | New Romanian Lei | | 12/03/15 | | | (46,104 | ) | | | (3,430 | ) |
| See Notes to Financial Statements | 9 | |
CVR DYNAMIC ALLOCATION FUND NOTES TO SCHEDULE OF INVESTMENTS |
| Counterparty | | Contracts to Purchase/(Sell) | | Settlement Date | | Settlement Value | | Net Unrealized Appreciation (Depreciation) |
| Jefferies & Co., Inc. – (continued) | | 200,000 | | | New Romanian Lei | | 12/03/15 | | $ | (51,653 | ) | | $ | (4,237 | ) |
| | | 336,000 | | | New Romanian Lei | | 12/03/15 | | | (80,383 | ) | | | (724 | ) |
| | | 820,000 | | | New Romanian Lei | | 12/03/15 | | | (207,679 | ) | | | (13,274 | ) |
| | | (336,000 | ) | | New Romanian Lei | | 03/03/16 | | | 80,406 | | | | 694 | |
| | | (210,000 | ) | | New Romanian Lei | | 03/03/16 | | | 50,030 | | | | 210 | |
| | | (4,000,000 | ) | | New Taiwan Dollar | | 12/03/15 | | | 120,373 | | | | (2,171 | ) |
| | | (2,600,000 | ) | | New Taiwan Dollar | | 12/03/15 | | | 79,015 | | | | (638 | ) |
| | | (2,400,000 | ) | | New Taiwan Dollar | | 12/03/15 | | | 73,858 | | | | 331 | |
| | | (1,890,000 | ) | | New Taiwan Dollar | | 12/03/15 | | | 57,657 | | | | (245 | ) |
| | | (1,800,000 | ) | | New Taiwan Dollar | | 12/03/15 | | | 54,512 | | | | (632 | ) |
| | | (1,680,000 | ) | | New Taiwan Dollar | | 12/03/15 | | | 51,494 | | | | 26 | |
| | | (1,680,000 | ) | | New Taiwan Dollar | | 12/03/15 | | | 51,227 | | | | (241 | ) |
| | | (1,600,000 | ) | | New Taiwan Dollar | | 12/03/15 | | | 49,413 | | | | 396 | |
| | | (1,470,000 | ) | | New Taiwan Dollar | | 12/03/15 | | | 45,231 | | | | 196 | |
| | | (1,400,000 | ) | | New Taiwan Dollar | | 12/03/15 | | | 43,317 | | | | 426 | |
| | | (1,400,000 | ) | | New Taiwan Dollar | | 12/03/15 | | | 43,143 | | | | 253 | |
| | | 1,760,000 | | | New Taiwan Dollar | | 12/03/15 | | | (54,109 | ) | | | (190 | ) |
| | | 20,160,000 | | | New Taiwan Dollar | | 12/03/15 | | | (618,975 | ) | | | (1,354 | ) |
| | | (20,160,000 | ) | | New Taiwan Dollar | | 03/03/16 | | | 619,736 | | | | 1,977 | |
| | | (2,310,000 | ) | | New Taiwan Dollar | | 03/03/16 | | | 70,707 | | | | (78 | ) |
| | | 2,730,000 | | | New Taiwan Dollar | | 03/03/16 | | | (84,039 | ) | | | (384 | ) |
| | | (2,310,000 | ) | | New Turkish Lira | | 12/03/15 | | | 803,758 | | | | 11,597 | |
| | | (240,000 | ) | | New Turkish Lira | | 12/03/15 | | | 77,469 | | | | (4,833 | ) |
| | | (120,000 | ) | | New Turkish Lira | | 12/03/15 | | | 40,049 | | | | (1,102 | ) |
| | | 59,000 | | | New Turkish Lira | | 12/03/15 | | | (20,793 | ) | | | (560 | ) |
| | | 105,000 | | | New Turkish Lira | | 12/03/15 | | | (36,703 | ) | | | (696 | ) |
| | | 120,000 | | | New Turkish Lira | | 12/03/15 | | | (40,728 | ) | | | 423 | |
| | | 120,000 | | | New Turkish Lira | | 12/03/15 | | | (40,285 | ) | | | 867 | |
| | | 160,000 | | | New Turkish Lira | | 12/03/15 | | | (51,891 | ) | | | 2,978 | |
| | | 180,000 | | | New Turkish Lira | | 12/03/15 | | | (60,930 | ) | | | 797 | |
| | | 189,000 | | | New Turkish Lira | | 12/03/15 | | | (65,801 | ) | | | (988 | ) |
| | | 210,000 | | | New Turkish Lira | | 12/03/15 | | | (72,551 | ) | | | (537 | ) |
| | | 210,000 | | | New Turkish Lira | | 12/03/15 | | | (73,640 | ) | | | (1,626 | ) |
| | | 220,000 | | | New Turkish Lira | | 12/03/15 | | | (71,421 | ) | | | 4,023 | |
| | | 240,000 | | | New Turkish Lira | | 12/03/15 | | | (78,990 | ) | | | 3,313 | |
| | | 240,000 | | | New Turkish Lira | | 12/03/15 | | | (77,745 | ) | | | 4,557 | |
| | | 260,000 | | | New Turkish Lira | | 12/03/15 | | | (85,319 | ) | | | 3,842 | |
| | | 357,000 | | | New Turkish Lira | | 12/03/15 | | | (124,666 | ) | | | (2,241 | ) |
| | | (105,000 | ) | | New Turkish Lira | | 03/03/16 | | | 35,042 | | | | (47 | ) |
| | | 2,310,000 | | | New Turkish Lira | | 03/03/16 | | | (783,197 | ) | | | (11,243 | ) |
| | | (126,000 | ) | | New Zealand Dollar | | 12/03/15 | | | 82,354 | | | | (567 | ) |
| | | (100,000 | ) | | New Zealand Dollar | | 12/03/15 | | | 67,779 | | | | 1,969 | |
| | | (100,000 | ) | | New Zealand Dollar | | 12/03/15 | | | 68,413 | | | | 2,602 | |
| | | (82,000 | ) | | New Zealand Dollar | | 12/03/15 | | | 55,286 | | | | 1,322 | |
| | | (80,000 | ) | | New Zealand Dollar | | 12/03/15 | | | 52,688 | | | | 40 | |
| | | (80,000 | ) | | New Zealand Dollar | | 12/03/15 | | | 53,370 | | | | 722 | |
| | | (63,000 | ) | | New Zealand Dollar | | 12/03/15 | | | 41,439 | | | | (22 | ) |
| | | 60,000 | | | New Zealand Dollar | | 12/03/15 | | | (40,492 | ) | | | (1,006 | ) |
| | | 60,000 | | | New Zealand Dollar | | 12/03/15 | | | (38,887 | ) | | | 599 | |
| | | 80,000 | | | New Zealand Dollar | | 12/03/15 | | | (54,315 | ) | | | (1,667 | ) |
| | | 84,000 | | | New Zealand Dollar | | 12/03/15 | | | (54,868 | ) | | | 413 | |
| | | 100,000 | | | New Zealand Dollar | | 12/03/15 | | | (67,099 | ) | | | (1,289 | ) |
| | | 100,000 | | | New Zealand Dollar | | 12/03/15 | | | (67,162 | ) | | | (1,352 | ) |
| See Notes to Financial Statements | 10 | |
CVR DYNAMIC ALLOCATION FUND NOTES TO SCHEDULE OF INVESTMENTS |
| Counterparty | | Contracts to Purchase/(Sell) | | Settlement Date | | Settlement Value | | Net Unrealized Appreciation (Depreciation) |
| Jefferies & Co., Inc. – (continued) | | 147,000 | | | New Zealand Dollar | | 12/03/15 | | $ | (97,414 | ) | | $ | (673 | ) |
| | | 84,000 | | | New Zealand Dollar | | 03/03/16 | | | (54,537 | ) | | | 411 | |
| | | 105,000 | | | New Zealand Dollar | | 03/03/16 | | | (68,553 | ) | | | 132 | |
| | | 126,000 | | | New Zealand Dollar | | 03/03/16 | | | (81,867 | ) | | | 555 | |
| | | (1,000,000 | ) | | Norwegian Krone | | 12/03/15 | | | 117,782 | | | | 2,720 | |
| | | (600,000 | ) | | Norwegian Krone | | 12/03/15 | | | 71,702 | | | | 2,664 | |
| | | (420,000 | ) | | Norwegian Krone | | 12/03/15 | | | 49,319 | | | | 992 | |
| | | (420,000 | ) | | Norwegian Krone | | 12/03/15 | | | 49,235 | | | | 909 | |
| | | (400,000 | ) | | Norwegian Krone | | 12/03/15 | | | 49,171 | | | | 3,146 | |
| | | (400,000 | ) | | Norwegian Krone | | 12/03/15 | | | 47,135 | | | | 1,110 | |
| | | (400,000 | ) | | Norwegian Krone | | 12/03/15 | | | 48,900 | | | | 2,875 | |
| | | 210,000 | | | Norwegian Krone | | 12/03/15 | | | (24,270 | ) | | | (107 | ) |
| | | 410,000 | | | Norwegian Krone | | 12/03/15 | | | (48,437 | ) | | | (1,261 | ) |
| | | 420,000 | | | Norwegian Krone | | 12/03/15 | | | (48,892 | ) | | | (566 | ) |
| | | 800,000 | | | Norwegian Krone | | 12/03/15 | | | (95,949 | ) | | | (3,899 | ) |
| | | 800,000 | | | Norwegian Krone | | 12/03/15 | | | (93,900 | ) | | | (1,850 | ) |
| | | 1,000,000 | | | Norwegian Krone | | 12/03/15 | | | (117,594 | ) | | | (2,531 | ) |
| | | (210,000 | ) | | Norwegian Krone | | 03/03/16 | | | 24,245 | | | | 104 | |
| | | (336,000 | ) | | Peruvian Inti | | 12/03/15 | | | 101,205 | | | | 1,615 | |
| | | (294,000 | ) | | Peruvian Inti | | 12/03/15 | | | 88,581 | | | | 1,440 | |
| | | (273,000 | ) | | Peruvian Inti | | 12/03/15 | | | 80,985 | | | | 68 | |
| | | (168,000 | ) | | Peruvian Inti | | 12/03/15 | | | 50,725 | | | | 930 | |
| | | (140,000 | ) | | Peruvian Inti | | 12/03/15 | | | 42,586 | | | | 1,090 | |
| | | (131,000 | ) | | Peruvian Inti | | 12/03/15 | | | 39,637 | | | | 809 | |
| | | 140,000 | | | Peruvian Inti | | 12/03/15 | | | (42,592 | ) | | | (1,096 | ) |
| | | 160,000 | | | Peruvian Inti | | 12/03/15 | | | (48,915 | ) | | | (1,491 | ) |
| | | 462,000 | | | Peruvian Inti | | 12/03/15 | | | (136,686 | ) | | | 249 | |
| | | 580,000 | | | Peruvian Inti | | 12/03/15 | | | (175,492 | ) | | | (3,581 | ) |
| | | (462,000 | ) | | Peruvian Inti | | 03/03/16 | | | 134,420 | | | | (338 | ) |
| | | (3,600,000 | ) | | Philippines Peso | | 12/03/15 | | | 78,603 | | | | 2,324 | |
| | | (2,800,000 | ) | | Philippines Peso | | 12/03/15 | | | 60,267 | | | | 939 | |
| | | (2,400,000 | ) | | Philippines Peso | | 12/03/15 | | | 51,535 | | | | 683 | |
| | | (2,200,000 | ) | | Philippines Peso | | 12/03/15 | | | 47,210 | | | | 596 | |
| | | (2,200,000 | ) | | Philippines Peso | | 12/03/15 | | | 47,722 | | | | 1,108 | |
| | | (1,800,000 | ) | | Philippines Peso | | 12/03/15 | | | 38,643 | | | | 504 | |
| | | (840,000 | ) | | Philippines Peso | | 12/03/15 | | | 17,834 | | | | 36 | |
| | | (290,000 | ) | | Philippines Peso | | 12/03/15 | | | 6,174 | | | | 29 | |
| | | 1,890,000 | | | Philippines Peso | | 12/03/15 | | | (40,247 | ) | | | (201 | ) |
| | | 2,000,000 | | | Philippines Peso | | 12/03/15 | | | (42,585 | ) | | | (208 | ) |
| | | 2,310,000 | | | Philippines Peso | | 12/03/15 | | | (49,091 | ) | | | (146 | ) |
| | | 2,400,000 | | | Philippines Peso | | 12/03/15 | | | (51,195 | ) | | | (342 | ) |
| | | 2,730,000 | | | Philippines Peso | | 12/03/15 | | | (57,617 | ) | | | 228 | |
| | | 4,800,000 | | | Philippines Peso | | 12/03/15 | | | (101,997 | ) | | | (293 | ) |
| | | 840,000 | | | Philippines Peso | | 03/03/16 | | | (17,725 | ) | | | (32 | ) |
| | | 2,100,000 | | | Philippines Peso | | 03/03/16 | | | (44,304 | ) | | | (71 | ) |
| | | 2,310,000 | | | Philippines Peso | | 03/03/16 | | | (48,678 | ) | | | (21 | ) |
| | | 2,730,000 | | | Philippines Peso | | 03/03/16 | | | (57,668 | ) | | | (165 | ) |
| | | 5,670,000 | | | Philippines Peso | | 03/03/16 | | | (119,444 | ) | | | (15 | ) |
| | | (273,000 | ) | | Polish Zloty | | 12/03/15 | | | 68,278 | | | | 726 | |
| | | (260,000 | ) | | Polish Zloty | | 12/03/15 | | | 67,021 | | | | 2,685 | |
| | | (260,000 | ) | | Polish Zloty | | 12/03/15 | | | 68,956 | | | | 4,621 | |
| | | (220,000 | ) | | Polish Zloty | | 12/03/15 | | | 58,063 | | | | 3,625 | |
| | | (200,000 | ) | | Polish Zloty | | 12/03/15 | | | 53,811 | | | | 4,323 | |
| See Notes to Financial Statements | 11 | |
CVR DYNAMIC ALLOCATION FUND NOTES TO SCHEDULE OF INVESTMENTS |
| Counterparty | | Contracts to Purchase/(Sell) | | Settlement Date | | Settlement Value | | Net Unrealized Appreciation (Depreciation) |
| Jefferies & Co., Inc. – (continued) | | (180,000 | ) | | Polish Zloty | | 12/03/15 | | $ | 47,866 | | | $ | 3,327 | |
| | | (160,000 | ) | | Polish Zloty | | 12/03/15 | | | 42,187 | | | | 2,596 | |
| | | (147,000 | ) | | Polish Zloty | | 12/03/15 | | | 36,695 | | | | 321 | |
| | | 9,000 | | | Polish Zloty | | 12/03/15 | | | (2,331 | ) | | | (104 | ) |
| | | 180,000 | | | Polish Zloty | | 12/03/15 | | | (48,179 | ) | | | (3,639 | ) |
| | | 231,000 | | | Polish Zloty | | 12/03/15 | | | (58,467 | ) | | | (1,307 | ) |
| | | 1,280,000 | | | Polish Zloty | | 12/03/15 | | | (338,140 | ) | | | (21,413 | ) |
| | | (189,000 | ) | | Polish Zloty | | 03/03/16 | | | 46,788 | | | | 104 | |
| | | 147,000 | | | Polish Zloty | | 03/03/16 | | | (36,630 | ) | | | (321 | ) |
| | | (80,000 | ) | | Pounds Sterling | | 12/03/15 | | | 121,137 | | | | 647 | |
| | | (80,000 | ) | | Pounds Sterling | | 12/03/15 | | | 121,259 | | | | 769 | |
| | | (63,000 | ) | | Pounds Sterling | | 12/03/15 | | | 95,654 | | | | 768 | |
| | | (60,000 | ) | | Pounds Sterling | | 12/03/15 | | | 90,812 | | | | 445 | |
| | | (40,000 | ) | | Pounds Sterling | | 12/03/15 | | | 61,163 | | | | 918 | |
| | | (40,000 | ) | | Pounds Sterling | | 12/03/15 | | | 60,632 | | | | 387 | |
| | | (40,000 | ) | | Pounds Sterling | | 12/03/15 | | | 60,728 | | | | 483 | |
| | | (20,000 | ) | | Pounds Sterling | | 12/03/15 | | | 30,370 | | | | 247 | |
| | | (8,000 | ) | | Pounds Sterling | | 12/03/15 | | | 12,375 | | | | 326 | |
| | | 20,000 | | | Pounds Sterling | | 12/03/15 | | | (30,566 | ) | | | (443 | ) |
| | | 40,000 | | | Pounds Sterling | | 12/03/15 | | | (61,289 | ) | | | (1,044 | ) |
| | | 40,000 | | | Pounds Sterling | | 12/03/15 | | | (60,794 | ) | | | (549 | ) |
| | | 40,000 | | | Pounds Sterling | | 12/03/15 | | | (61,858 | ) | | | (1,613 | ) |
| | | 42,000 | | | Pounds Sterling | | 12/03/15 | | | (64,614 | ) | | | (1,356 | ) |
| | | 60,000 | | | Pounds Sterling | | 12/03/15 | | | (92,045 | ) | | | (1,677 | ) |
| | | 84,000 | | | Pounds Sterling | | 12/03/15 | | | (127,021 | ) | | | (506 | ) |
| | | 105,000 | | | Pounds Sterling | | 12/03/15 | | | (158,109 | ) | | | 34 | |
| | | (105,000 | ) | | Pounds Sterling | | 03/03/16 | | | 158,143 | | | | (26 | ) |
| | | (84,000 | ) | | Pounds Sterling | | 03/03/16 | | | 126,381 | | | | (155 | ) |
| | | (42,000 | ) | | Pounds Sterling | | 03/03/16 | | | 63,369 | | | | 101 | |
| | | (42,000 | ) | | Pounds Sterling | | 03/03/16 | | | 63,119 | | | | (149 | ) |
| | | (10,000,000 | ) | | Russian Rouble | | 12/03/15 | | | 149,231 | | | | (1,396 | ) |
| | | 2,000,000 | | | Russian Rouble | | 12/03/15 | | | (31,621 | ) | | | (1,495 | ) |
| | | 2,000,000 | | | Russian Rouble | | 12/03/15 | | | (31,847 | ) | | | (1,722 | ) |
| | | 2,000,000 | | | Russian Rouble | | 12/03/15 | | | (31,731 | ) | | | (1,605 | ) |
| | | 4,000,000 | | | Russian Rouble | | 12/03/15 | | | (59,189 | ) | | | 1,062 | |
| | | (1,730,000 | ) | | S. African Rand (Fin) | | 12/03/15 | | | 124,892 | | | | 5,291 | |
| | | (1,680,000 | ) | | S. African Rand (Fin) | | 12/03/15 | | | 121,221 | | | | 5,077 | |
| | | (1,680,000 | ) | | S. African Rand (Fin) | | 12/03/15 | | | 120,000 | | | | 3,856 | |
| | | (1,050,000 | ) | | S. African Rand (Fin) | | 12/03/15 | | | 73,507 | | | | 917 | |
| | | (1,000,000 | ) | | S. African Rand (Fin) | | 12/03/15 | | | 71,124 | | | | 1,991 | |
| | | (840,000 | ) | | S. African Rand (Fin) | | 12/03/15 | | | 60,234 | | | | 2,162 | |
| | | (800,000 | ) | | S. African Rand (Fin) | | 12/03/15 | | | 58,448 | | | | 3,142 | |
| | | (800,000 | ) | | S. African Rand (Fin) | | 12/03/15 | | | 57,168 | | | | 1,862 | |
| | | (630,000 | ) | | S. African Rand (Fin) | | 12/03/15 | | | 43,943 | | | | 389 | |
| | | (630,000 | ) | | S. African Rand (Fin) | | 12/03/15 | | | 44,007 | | | | 453 | |
| | | (400,000 | ) | | S. African Rand (Fin) | | 12/03/15 | | | 28,815 | | | | 1,162 | |
| | | 400,000 | | | S. African Rand (Fin) | | 12/03/15 | | | (29,392 | ) | | | (1,739 | ) |
| | | 600,000 | | | S. African Rand (Fin) | | 12/03/15 | | | (43,392 | ) | | | (1,912 | ) |
| | | 800,000 | | | S. African Rand (Fin) | | 12/03/15 | | | (59,707 | ) | | | (4,401 | ) |
| | | 800,000 | | | S. African Rand (Fin) | | 12/03/15 | | | (58,775 | ) | | | (3,469 | ) |
| | | 800,000 | | | S. African Rand (Fin) | | 12/03/15 | | | (60,572 | ) | | | (5,265 | ) |
| | | 800,000 | | | S. African Rand (Fin) | | 12/03/15 | | | (59,175 | ) | | | (3,868 | ) |
| | | 840,000 | | | S. African Rand (Fin) | | 12/03/15 | | | (60,351 | ) | | | (2,279 | ) |
| See Notes to Financial Statements | 12 | |
CVR DYNAMIC ALLOCATION FUND NOTES TO SCHEDULE OF INVESTMENTS |
| Counterparty | | Contracts to Purchase/(Sell) | | Settlement Date | | Settlement Value | | Net Unrealized Appreciation (Depreciation) |
| Jefferies & Co., Inc. – (continued) | | 1,000,000 | | | S. African Rand (Fin) | | 12/03/15 | | $ | (74,395 | ) | | $ | (5,262 | ) |
| | | 1,000,000 | | | S. African Rand (Fin) | | 12/03/15 | | | (75,412 | ) | | | (6,279 | ) |
| | | 1,000,000 | | | S. African Rand (Fin) | | 12/03/15 | | | (75,568 | ) | | | (6,434 | ) |
| | | 1,000,000 | | | S. African Rand (Fin) | | 12/03/15 | | | (75,325 | ) | | | (6,192 | ) |
| | | 2,200,000 | | | S. African Rand (Fin) | | 12/03/15 | | | (161,885 | ) | | | (9,792 | ) |
| | | 840,000 | | | S. African Rand (Fin) | | 03/03/16 | | | (57,851 | ) | | | (726 | ) |
| | | 1,050,000 | | | S. African Rand (Fin) | | 03/03/16 | | | (73,451 | ) | | | (2,044 | ) |
| | | 1,680,000 | | | S. African Rand (Fin) | | 03/03/16 | | | (118,060 | ) | | | (3,810 | ) |
| | | (168,000 | ) | | Singapore Dollar | | 12/03/15 | | | 118,871 | | | | (219 | ) |
| | | (80,000 | ) | | Singapore Dollar | | 12/03/15 | | | 57,021 | | | | 311 | |
| | | (60,000 | ) | | Singapore Dollar | | 12/03/15 | | | 41,888 | | | | (644 | ) |
| | | (60,000 | ) | | Singapore Dollar | | 12/03/15 | | | 43,158 | | | | 626 | |
| | | 3,000 | | | Singapore Dollar | | 12/03/15 | | | (2,139 | ) | | | (12 | ) |
| | | 60,000 | | | Singapore Dollar | | 12/03/15 | | | (43,528 | ) | | | (996 | ) |
| | | 105,000 | | | Singapore Dollar | | 12/03/15 | | | (75,072 | ) | | | (641 | ) |
| | | 200,000 | | | Singapore Dollar | | 12/03/15 | | | (144,524 | ) | | | (2,751 | ) |
| | | 168,000 | | | Singapore Dollar | | 03/03/16 | | | (118,493 | ) | | | 216 | |
| | | (105,000,000 | ) | | South Korean Won | | 12/03/15 | | | 89,836 | | | | (662 | ) |
| | | (105,000,000 | ) | | South Korean Won | | 12/03/15 | | | 90,799 | | | | 302 | |
| | | (84,000,000 | ) | | South Korean Won | | 12/03/15 | | | 72,302 | | | | (96 | ) |
| | | (80,000,000 | ) | | South Korean Won | | 12/03/15 | | | 69,686 | | | | 736 | |
| | | (63,000,000 | ) | | South Korean Won | | 12/03/15 | | | 53,672 | | | | (627 | ) |
| | | (63,000,000 | ) | | South Korean Won | | 12/03/15 | | | 53,961 | | | | (337 | ) |
| | | (63,000,000 | ) | | South Korean Won | | 12/03/15 | | | 54,616 | | | | 318 | |
| | | (63,000,000 | ) | | South Korean Won | | 12/03/15 | | | 55,191 | | | | 892 | |
| | | (60,000,000 | ) | | South Korean Won | | 12/03/15 | | | 52,484 | | | | 771 | |
| | | (60,000,000 | ) | | South Korean Won | | 12/03/15 | | | 51,998 | | | | 285 | |
| | | (40,000,000 | ) | | South Korean Won | | 12/03/15 | | | 35,149 | | | | 674 | |
| | | (40,000,000 | ) | | South Korean Won | | 12/03/15 | | | 34,372 | | | | (104 | ) |
| | | (4,000,000 | ) | | South Korean Won | | 12/03/15 | | | 3,508 | | | | 61 | |
| | | 200,000,000 | | | South Korean Won | | 12/03/15 | | | (166,959 | ) | | | 5,417 | |
| | | 630,000,000 | | | South Korean Won | | 12/03/15 | | | (546,401 | ) | | | (3,416 | ) |
| | | (630,000,000 | ) | | South Korean Won | | 03/03/16 | | | 544,912 | | | | 3,306 | |
| | | 105,000,000 | | | South Korean Won | | 03/03/16 | | | (91,447 | ) | | | (1,181 | ) |
| | | 126,000,000 | | | South Korean Won | | 03/03/16 | | | (108,921 | ) | | | (600 | ) |
| | | (600,000 | ) | | Swedish Krona | | 12/03/15 | | | 71,371 | | | | 2,568 | |
| | | (600,000 | ) | | Swedish Krona | | 12/03/15 | | | 72,160 | | | | 3,357 | |
| | | (400,000 | ) | | Swedish Krona | | 12/03/15 | | | 48,264 | | | | 2,396 | |
| | | (400,000 | ) | | Swedish Krona | | 12/03/15 | | | 46,853 | | | | 984 | |
| | | (400,000 | ) | | Swedish Krona | | 12/03/15 | | | 48,102 | | | | 2,234 | |
| | | (50,000 | ) | | Swedish Krona | | 12/03/15 | | | 5,882 | | | | 149 | |
| | | 600,000 | | | Swedish Krona | | 12/03/15 | | | (73,786 | ) | | | (4,983 | ) |
| | | 800,000 | | | Swedish Krona | | 12/03/15 | | | (97,240 | ) | | | (5,503 | ) |
| | | 1,050,000 | | | Swedish Krona | | 12/03/15 | | | (121,052 | ) | | | (648 | ) |
| | | 420,000 | | | Swedish Krona | | 03/03/16 | | | (48,237 | ) | | | 77 | |
| | | (105,000 | ) | | Swiss Franc | | 12/03/15 | | | 103,265 | | | | 1,182 | |
| | | (80,000 | ) | | Swiss Franc | | 12/03/15 | | | 81,877 | | | | 4,099 | |
| | | (80,000 | ) | | Swiss Franc | | 12/03/15 | | | 81,443 | | | | 3,665 | |
| | | (63,000 | ) | | Swiss Franc | | 12/03/15 | | | 62,074 | | | | 824 | |
| | | (42,000 | ) | | Swiss Franc | | 12/03/15 | | | 41,176 | | | | 342 | |
| | | (40,000 | ) | | Swiss Franc | | 12/03/15 | | | 40,481 | | | | 1,592 | |
| | | 8,000 | | | Swiss Franc | | 12/03/15 | | | (8,125 | ) | | | (347 | ) |
| | | 40,000 | | | Swiss Franc | | 12/03/15 | | | (42,085 | ) | | | (3,196 | ) |
| See Notes to Financial Statements | 13 | |
CVR DYNAMIC ALLOCATION FUND NOTES TO SCHEDULE OF INVESTMENTS |
| Counterparty | | Contracts to Purchase/(Sell) | | Settlement Date | | Settlement Value | | Net Unrealized Appreciation (Depreciation) |
| Jefferies & Co., Inc. – (continued) | | 42,000 | | | Swiss Franc | | 12/03/15 | | $ | (42,217 | ) | | $ | (1,383 | ) |
| | | 60,000 | | | Swiss Franc | | 12/03/15 | | | (62,223 | ) | | | (3,889 | ) |
| | | 60,000 | | | Swiss Franc | | 12/03/15 | | | (61,711 | ) | | | (3,378 | ) |
| | | 60,000 | | | Swiss Franc | | 12/03/15 | | | (63,164 | ) | | | (4,830 | ) |
| | | 140,000 | | | Swiss Franc | | 12/03/15 | | | (144,452 | ) | | | (8,340 | ) |
| | | (63,000 | ) | | Swiss Franc | | 03/03/16 | | | 61,451 | | | | (138 | ) |
| | | 105,000 | | | Swiss Franc | | 03/03/16 | | | (103,774 | ) | | | (1,125 | ) |
| | | (4,830,000 | ) | | Thailand Baht | | 12/03/15 | | | 134,992 | | | | 241 | |
| | | (1,400,000 | ) | | Thailand Baht | | 12/03/15 | | | 39,392 | | | | 334 | |
| | | (1,200,000 | ) | | Thailand Baht | | 12/03/15 | | | 32,658 | | | | (821 | ) |
| | | 230,000 | | | Thailand Baht | | 12/03/15 | | | (6,447 | ) | | | (30 | ) |
| | | 2,200,000 | | | Thailand Baht | | 12/03/15 | | | (62,465 | ) | | | (1,088 | ) |
| | | 5,000,000 | | | Thailand Baht | | 12/03/15 | | | (140,647 | ) | | | (1,154 | ) |
| | | 1,680,000 | | | Thailand Baht | | 03/03/16 | | | (46,823 | ) | | | (72 | ) |
| | | 4,830,000 | | | Thailand Baht | | 03/03/16 | | | (134,465 | ) | | | (57 | ) |
| | | | | | | | | | | | | | | | |
| | | | | | | | | | | | | | $ | (104,585 | ) |
AFA
| | At November 30, 2015, the Fund held the following futures contracts: |
| Contracts | | Type | | Expiration Date | | Notional Contract Value | | Net Unrealized Appreciation (Depreciation) |
| 2 | | | Australian 10-year Bond Future | | 12/20/15 | | $ | 183,062 | | | $ | (79 | ) |
| 24 | | | EURO-BOBL Future | | 12/14/15 | | | 3,367,538 | | | | 6,362 | |
| 6 | | | EURO-BUND Future | | 12/14/15 | | | 1,016,482 | | | | 2,636 | |
| 8 | | | EURO-STOXX 50 Future | | 12/22/15 | | | 297,534 | | | | 6,761 | |
| 1 | | | FTSE 100 Index Future | | 12/22/15 | | | 95,968 | | | | (373 | ) |
| 4 | | | Long Gilt Future | | 04/04/16 | | | 710,788 | | | | 2,082 | |
| 2 | | | NASDAQ 100 Emini Future | | 12/22/15 | | | 181,817 | | | | 4,933 | |
| 3 | | | U.S. 10-year Treasury Note Future | | 04/06/16 | | | 378,994 | | | | 319 | |
| 1 | | | U.S. 5-year Treasury Note Future | | 04/11/16 | | | 118,691 | | | | (11 | ) |
| 2 | | | Yen Denom Nikkei 225 Future | | 12/14/15 | | | 160,886 | | | | 327 | |
| (2 | ) | | ASX SPI 200 Index Future | | 12/22/15 | | | (184,624 | ) | | | (1,034 | ) |
| (2 | ) | | Gold 100 oz. Future | | 03/04/16 | | | (214,862 | ) | | | 1,802 | |
| (1 | ) | | S&P 500 Emini Future | | 12/22/15 | | | (102,896 | ) | | | (1,091 | ) |
| (3 | ) | | Silver Future | | 02/04/16 | | | (211,742 | ) | | | 857 | |
AFA
| See Notes to Financial Statements | 14 | |
CVR DYNAMIC ALLOCATION FUND NOTES TO SCHEDULE OF INVESTMENTS |
The following is a summary of the inputs used to value the Fund’s investments and other financial instruments and liabilities as of November 30, 2015.
The inputs or methodology used for valuing securities are not necessarily an indication of the risks associated with investing in those securities. For more information on valuation inputs, and their aggregation into the levels used in the table below, please refer to the Security Valuation section in Note 2 of the accompanying Notes to Financial Statements.
| | Level 1 | | Level 2 | | Level 3 | | Total |
| Assets |
| Investments At Value |
| Common Stock | | | | | | | | | | | | | | | | |
| Aerospace & Defense | | $ | 972,543 | | | $ | - | | | $ | - | | | $ | 972,543 | |
| Apparel, Shoes, etc. | | | 580,059 | | | | - | | | | - | | | | 580,059 | |
| Auto | | | 71,220 | | | | - | | | | - | | | | 71,220 | |
| Basic Materials | | | 1,511,730 | | | | - | | | | - | | | | 1,511,730 | |
| Biotechnology | | | 540,464 | | | | - | | | | - | | | | 540,464 | |
| Building – Heavy Construction | | | 429,624 | | | | - | | | | - | | | | 429,624 | |
| Chemicals | | | 1,029,997 | | | | - | | | | - | | | | 1,029,997 | |
| Commercial Services | | | 915,051 | | | | - | | | | - | | | | 915,051 | |
| Communications | | | 606,919 | | | | - | | | | - | | | | 606,919 | |
| Financials | | | 1,121,522 | | | | - | | | | - | | | | 1,121,522 | |
| Food | | | 612,448 | | | | - | | | | - | | | | 612,448 | |
| Health Care | | | 667,304 | | | | - | | | | - | | | | 667,304 | |
| Industrials | | | 152,957 | | | | - | | | | - | | | | 152,957 | |
| Internet | | | 2,756,490 | | | | - | | | | - | | | | 2,756,490 | |
| Media | | | 1,294,802 | | | | - | | | | - | | | | 1,294,802 | |
| Pharmaceutical | | | 150,201 | | | | - | | | | - | | | | 150,201 | |
| Retail - Restaurant | | | 188,155 | | | | - | | | | - | | | | 188,155 | |
| Retail - Wholesale/Building | | | 192,804 | | | | - | | | | - | | | | 192,804 | |
| Technology | | | 2,339,090 | | | | - | | | | - | | | | 2,339,090 | |
| Telecommunications | | | 319,885 | | | | - | | | | - | | | | 319,885 | |
| Telecommunications - Cable | | | 198,960 | | | | - | | | | - | | | | 198,960 | |
| Transportation - Freight | | | 75,094 | | | | - | | | | - | | | | 75,094 | |
| Transportation - Logistics | | | 1,069,734 | | | | | | | | | | | | 1,069,734 | |
| Transportation - Rails | | | 147,416 | | | | - | | | | - | | | | 147,416 | |
| Investment Companies | | | 1,937,491 | | | | - | | | | - | | | | 1,937,491 | |
| Money Market Fund | | | - | | | | 467,467 | | | | - | | | | 467,467 | |
| Total Investments At Value | | $ | 19,881,960 | | | $ | 467,467 | | | $ | - | | | $ | 20,349,427 | |
| Other Financial Instruments** | | | | | | | | | | | | | | | | |
| Forward Currency Contracts | | | - | | | | 350,733 | | | | - | | | | 350,733 | |
| Futures | | | 26,079 | | | | - | | | | - | | | | 26,079 | |
| Total Other Financial Instruments** | | $ | 26,079 | | | $ | 350,733 | | | $ | - | | | $ | 376,812 | |
| Total Assets | | $ | 19,908,039 | | | $ | 818,200 | | | $ | - | | | $ | 20,726,239 | |
Liabilities Other Financial Instruments** | | | | | | | | | | | | | | | | |
| Forward Currency Contracts | | | - | | | | (455,318 | ) | | | - | | | | (455,318 | ) |
| Futures | | | (2,588 | ) | | | - | | | | - | | | | (2,588 | ) |
| Total Other Financial Instruments** | | $ | (2,588 | ) | | $ | (455,318 | ) | | $ | - | | | $ | (457,906 | ) |
**Other Financial Instruments are derivatives not reflected in the Schedule of Investments, such as forward currency contracts and futures, which are valued at the unrealized appreciation (depreciation) at year end.
The Fund utilizes the end of period methodology when determining transfers. There were no transfers among Level 1, Level 2 and Level 3 for the year ended November 30, 2015.
| See Notes to Financial Statements | 15 | |
CVR DYNAMIC ALLOCATION FUND NOTES TO SCHEDULE OF INVESTMENTS |
| PORTFOLIO HOLDINGS | | |
| % of Total Investments | | |
| Aerospace & Defense | 4.8 | % |
| Apparel, Shoes, etc. | 2.8 | % |
| Auto | 0.3 | % |
| Basic Materials | 7.4 | % |
| Biotechnology | 2.7 | % |
| Building - Heavy Construction | 2.1 | % |
| Chemicals | 5.1 | % |
| Commercial Services | 4.5 | % |
| Communications | 3.0 | % |
| Financials | 5.5 | % |
| Food | 3.0 | % |
| Health Care | 3.3 | % |
| Industrials | 0.8 | % |
| Internet | 13.5 | % |
| Media | 6.4 | % |
| Pharmaceutical | 0.7 | % |
| Retail - Restaurant | 0.9 | % |
| Retail - Wholesale/Building | 0.9 | % |
| Technology | 11.5 | % |
| Telecommunications | 1.6 | % |
| Telecommunications - Cable | 1.0 | % |
| Transportation - Freight | 0.4 | % |
| Transportation - Logistics | 5.3 | % |
| Transportation - Rails | 0.7 | % |
| Investment Companies | 9.5 | % |
| Money Market Fund | 2.3 | % |
| | 100.0 | % |
| See Notes to Financial Statements | 16 | |
CVR DYNAMIC ALLOCATION FUND STATEMENT OF ASSETS AND LIABILITIES |
| ASSETS | | | | |
| | Total investments, at value (Cost $20,541,330) | | $ | 20,349,427 | |
| | Deposits with brokers | | | 257,974 | |
| | Cash | | | 1,906,964 | |
| | Receivables: | | | | |
| | | Fund shares sold | | | 50,000 | |
| | | Investment securities sold | | | 269,894 | |
| | | Dividends | | | 27,462 | |
| | Unrealized gain on forward currency contracts | | | 350,733 | |
| | Prepaid expenses | | | 3,906 | |
| Total Assets | | | 23,216,360 | |
| | | | | | | |
| LIABILITIES | | | | |
| | Unrealized loss on forward currency contracts | | | 455,318 | |
| | Payables: | | | | |
| | | Variation margin | | | 6,854 | |
| | Accrued Liabilities: | | | | |
| | Investment adviser fees | | | 8,848 | |
| | | Fund services fees | | | 8,282 | |
| | | Other expenses | | | 23,681 | |
| Total Liabilities | | | 502,983 | |
| | | | | | | |
| NET ASSETS | | $ | 22,713,377 | |
| | | | | | | |
| COMPONENTS OF NET ASSETS | | | | |
| | Paid-in capital | | $ | 23,097,352 | |
| | Accumulated net investment loss | | | (10,275 | ) |
| | Accumulated net realized loss | | | (100,624 | ) |
| | Net Unrealized depreciation | | | (273,076 | ) |
| NET ASSETS | | $ | 22,713,377 | |
| | | | | | | |
| SHARES OF BENEFICIAL INTEREST AT NO PAR VALUE (UNLIMITED SHARES AUTHORIZED) | | | | |
| | Institutional Shares | | | 2,255,412 | |
| | | | | | | |
| NET ASSET VALUE, OFFERING AND REDEMPTION PRICE PER SHARE | | | | |
| | Institutional Shares (based on net assets of $22,713,377) | | $ | 10.07 | |
| See Notes to Financial Statements | 17 | |
CVR DYNAMIC ALLOCATION FUND STATEMENT OF OPERATIONS YEAR ENDED NOVEMBER 30, 2015 |
| INVESTMENT INCOME | | | | |
| | Dividend income | | $ | 245,294 | |
| | Interest income | | | 142 | |
| Total Investment Income | | | 245,436 | |
| | | | | |
| EXPENSES | | | | |
| | Investment adviser fees | | | 242,304 | |
| | Fund services fees | | | 135,880 | |
| | Custodian fees | | | 5,000 | |
| | Registration fees | | | 11,265 | |
| | Professional fees | | | 49,399 | |
| | Trustees' fees and expenses | | | 3,953 | |
| | Offering costs | | | 5,471 | |
| | Miscellaneous expenses | | | 44,971 | |
| Total Expenses | | | 498,243 | |
| | Fees waived and expenses reimbursed | | | (162,333 | ) |
| Net Expenses | | | 335,910 | |
| | | | | | | |
| NET INVESTMENT LOSS | | | (90,474 | ) |
| | | | | | | |
| NET REALIZED AND UNREALIZED GAIN (LOSS) | | | | |
| | Net realized gain (loss) on: | | | | |
| | Investments | | | 114,866 | |
| | Foreign currency transactions | | | (5,568 | ) |
| | Futures | | | 32,324 | |
| | Net realized gain | | | 141,622 | |
| | Net change in unrealized appreciation (depreciation) on: | | | | |
| | Investments | | | (1,150,149 | ) |
| | Foreign currency translations | | | (104,262 | ) |
| | Futures | | | (83,695 | ) |
| | Net change in unrealized appreciation (depreciation) | | | (1,338,106 | ) |
| NET REALIZED AND UNREALIZED LOSS | | | (1,196,484 | ) |
| DECREASE IN NET ASSETS RESULTING FROM OPERATIONS | | $ | (1,286,958 | ) |
| | | | | | | |
| See Notes to Financial Statements | 18 | |
CVR DYNAMIC ALLOCATION FUND STATEMENT OF CHANGES IN NET ASSETS |
| | | | | For the Year Ended November 30, 2015 | | | December 30, 2013* Through November 30, 2014 |
| OPERATIONS | | | | | | | | | |
| | Net investment loss | | $ | (90,474 | ) | | | $ | (87,063 | ) |
| | Net realized gain | | | 141,622 | | | | | 47,160 | |
| | Net change in unrealized appreciation (depreciation) | | | (1,338,106 | ) | | | | 1,065,030 | |
| Increase (Decrease) in Net Assets Resulting from Operations | | | (1,286,958 | ) | | | | 1,025,127 | |
| | | | | | | | | | | | |
| DISTRIBUTIONS TO SHAREHOLDERS FROM | | | | | | | | | |
| | Net realized gain: | | | | | | | | | |
| | | Institutional Shares | | | (122,144 | ) | | | | - | |
| | | | | | | | | | | | |
| CAPITAL SHARE TRANSACTIONS | | | | | | | | | |
| | Sale of shares: | | | | | | | | | |
| | | Institutional Shares | | | 6,744,306 | | | | | 18,743,634 | |
| | Reinvestment of distributions: | | | | | | | | | |
| | | Institutional Shares | | | 122,144 | | | | | - | |
| | Redemption of shares: | | | | | | | | | |
| | 2 | Institutional Shares | | | (2,236,223 | ) | | | | (276,509 | ) |
| Increase in Net Assets from Capital Share Transactions | | | 4,630,227 | | | | | 18,467,125 | |
| Increase in Net Assets | | | 3,221,125 | | | | | 19,492,252 | |
| | | | | | | | | | | | |
| NET ASSETS | | | | | | | | | |
| | Beginning of Period | | | 19,492,252 | | | | | - | |
| | End of Period (Including line (a)) | | $ | 22,713,377 | | | | $ | 19,492,252 | |
| | | | | | | | | | | | |
| SHARE TRANSACTIONS | | | | | | | | | |
| | Sale of shares: | | | | | | | | | |
| | | Institutional Shares | | | 638,603 | | | | | 1,851,891 | |
| | Reinvestment of distributions: | | | | | | | | | |
| | | Institutional Shares | | | 11,745 | | | | | - | |
| | Redemption of shares: | | | | | | | | | |
| | | Institutional Shares | | | (219,467 | ) | | | | (27,360 | ) |
| Increase in Shares | | | 430,881 | | | | | 1,824,531 | |
| | | | | | | | | | | | |
| (a) | Accumulated net investment loss | | $ | (10,275 | ) | | | $ | (1,702 | ) |
| * | Commencement of operations. | | | | | | | | | |
| See Notes to Financial Statements | 19 | |
CVR DYNAMIC ALLOCATION FUND FINANCIAL HIGHLIGHTS |
| These financial highlights reflect selected data for a share outstanding throughout each period. |
| | | For the Year Ended November 30, 2015 | | December 30, 2013 (a) Through November 30, 2014 | |
| INSTITUTIONAL SHARES | | | | | | | | |
| NET ASSET VALUE, Beginning of Period | $ | 10.68 | | | $ | 10.00 | | |
| INVESTMENT OPERATIONS | | | | | | | | |
| Net investment loss (b) | | (0.04 | ) | | | (0.07 | ) | |
| Net realized and unrealized gain (loss) | | (0.50 | ) | | | 0.68 | | |
| Net gain from contribution by affiliate | | - | | | | 0.07 | | |
| Total from Investment Operations | | (0.54 | ) | | | 0.68 | | |
| | | | | | | | | |
| DISTRIBUTIONS TO SHAREHOLDERS FROM | | | | | | | | |
| Net realized gain | | (0.07 | ) | | | — | | |
| NET ASSET VALUE, End of Period | $ | 10.07 | | | $ | 10.68 | | |
| TOTAL RETURN | | (5.11 | )% | | 6.80 | %(c)(d) |
| | | | | | | | | |
| RATIOS/SUPPLEMENTARY DATA | | | | | | | | |
| Net Assets at End of Period (000's omitted) | $22,713 | | | $19,492 | | |
| Ratios to Average Net Assets:(e) | | | | | | | | |
| Net investment loss | | (0.41 | )% | | (0.70 | )%(f) |
| Net expenses (g) | | 1.52 | % | | 1.47 | %(f) |
| Gross expenses (h) | | 2.26 | % | | 3.14 | %(f) |
| PORTFOLIO TURNOVER RATE | | 129 | % | | 157 | %(d) |
| | | | | | | | | | |
| | | | | | | | | | |
| (a) | Commencement of operations. |
| (b) | Calculated based on average shares outstanding during each period. |
| (c) | Calculation includes affiliate reimbursements and gains incurred on the contribution of capital. Excluding the effect of the net reimbursements from the Fund's ending net asset value per share, total return for the period ending November 30, 2014, would have been 6.10%. |
| (d) | Not annualized. |
| (e) | The ratios of expenses and net investment loss to average net assets do not reflect the Fund's proportionate share of income and expenses of underlying investment companies in which the Fund invests. |
| (f) | Annualized. |
| (g) | Net expenses include reimbursement of indirect fees by the Adviser, such as acquired fund fees and expenses. |
| (h) | Reflects the expense ratio excluding any waivers and/or reimbursements. |
| See Notes to Financial Statements | 20 | |
CVR DYNAMIC ALLOCATION FUND NOTES TO FINANCIAL STATEMENTS NOVEMBER 30, 2015 |
Note 1. Organization
The CVR Dynamic Allocation Fund (the “Fund”) is a diversified portfolio of Forum Funds II (the “Trust”). The Trust is a Delaware statutory trust that is registered as an open-end, management investment company under the Investment Company Act of 1940 (the “Act”), as amended. Under its Trust Instrument, the Trust is authorized to issue an unlimited number of the Fund’s shares of beneficial interest without par value. The Fund commenced operations on December 30, 2013. The Fund currently offers two classes of shares: Institutional Shares and Investor Shares. As of November 30, 2015, Investor Shares had not commenced operations. The Fund seeks long-term capital appreciation while preserving capital in declining markets.
Note 2. Summary of Significant Accounting Policies
These financial statements are prepared in accordance with accounting principles generally accepted in the United States of America (“GAAP”), which require management to make estimates and assumptions that affect the reported amounts of assets and liabilities, the disclosure of contingent liabilities at the date of the financial statements, and the reported amounts of increases and decreases in net assets from operations during the fiscal year. Actual amounts could differ from those estimates. The following summarizes the significant accounting policies of the Fund:
Security Valuation – Exchange-traded securities (such as shares of exchange-traded funds) and over-the-counter securities are valued using the last quoted trade or official closing price, provided by independent pricing services as of the close of trading on the market or exchange for which they are primarily traded, on each Fund business day. In the absence of a sale, such securities are valued at the mean of the last bid and ask price provided by independent pricing services. Non-exchange-traded securities for which quotations are available are valued using the last quoted sales price, or in the absence of a sale, at the mean of the last bid and ask prices provided by independent pricing services. Futures contracts listed for trading on a securities exchange or board of trade shall be valued at the last quoted sales price or in the absence of a sale at the mean of the last bid and asked prices. Forward currency contracts are generally valued at the mean of bid and ask prices for the time period interpolated from rates reported by an independent pricing service for proximate time periods.
Shares of non-exchange traded open-end mutual funds are valued at net asset value (“NAV”). Short-term investments that mature in 60 days or less may be valued at amortized cost.
The Fund values its investments at fair value pursuant to procedures adopted by the Trust's Board of Trustees (the "Board") if (1) market quotations are insufficient or not readily available or (2) the adviser believes that the values available are unreliable. The Trust’s Valuation Committee, as defined in the Fund’s registration statement, performs certain functions as they relate to the administration and oversight of the Fund’s valuation procedures. Under these procedures, the Valuation Committee convenes on a regular and ad-hoc basis to review such investments and considers a number of factors, including valuation methodologies and significant unobservable inputs, when arriving at fair value.
The Valuation Committee may work with the adviser to provide valuation inputs. In determining fair valuations, inputs may include market-based analytics which may consider related or comparable assets or liabilities, recent transactions, market multiples, book values and other relevant investment information. Adviser inputs may include an income-based approach in which the anticipated future cash flows of the investment are discounted in determining fair value. Discounts may also be applied based on the nature or duration of any restrictions on the disposition of the investments. The Valuation Committee performs regular reviews of valuation methodologies, key inputs and assumptions, disposition analysis and market activity.
Fair valuation is based on subjective factors and, as a result, the fair value price of an investment may differ from the security’s market price and may not be the price at which the asset may be sold. Fair valuation could result in a different NAV than a NAV determined by using market quotes.
The Fund has a three-tier fair value hierarchy. The basis of the tiers is dependent upon the various “inputs” used to determine the value of the Fund’s investments. These inputs are summarized in the three broad levels listed below:
Level 1 — quoted prices in active markets for identical assets and liabilities
Level 2 — other significant observable inputs (including quoted prices of similar securities, interest rates, prepayment speeds, credit risk, etc.)
Level 3 — significant unobservable inputs (including the Fund’s own assumptions in determining the fair value of investments)
CVR DYNAMIC ALLOCATION FUND NOTES TO FINANCIAL STATEMENTS NOVEMBER 30, 2015 |
The aggregate value by input level, as of November 30, 2015, for the Fund’s investments is included in the Fund’s Schedule of Investments.
Security Transactions, Investment Income and Realized Gain and Loss – Investment transactions are accounted for on the trade date. Dividend income is recorded on the ex-dividend date. Foreign dividend income is recorded on the ex-dividend date or as soon as possible after the Fund determines the existence of a dividend declaration after exercising reasonable due diligence. Income and capital gains on some foreign securities may be subject to foreign withholding taxes, which are accrued as applicable. Interest income is recorded on an accrual basis. Premium is amortized and discount is accreted using the effective interest method. Identified cost of investments sold is used to determine the gain and loss for both financial statement and federal income tax purposes.
Foreign Currency Translations – Foreign currency amounts are translated into U.S. dollars as follows: (1) assets and liabilities at the rate of exchange at the end of the respective period; and (2) purchases and sales of securities and income and expenses at the rate of exchange prevailing on the dates of such transactions. The portion of the results of operations arising from changes in the exchange rates and the portion due to fluctuations arising from changes in the market prices of securities are not isolated. Such fluctuations are included with the net realized and unrealized gain or loss on investments.
Foreign Currency Transactions – The Fund may enter into transactions to purchase or sell foreign currency contracts and options on foreign currency. Forward currency contracts are agreements to exchange one currency for another at a future date and at a specified price. A fund may use forward currency contracts to facilitate transactions in foreign securities, to manage a fund’s foreign currency exposure and to protect the U.S. dollar value of its underlying portfolio securities against the effect of possible adverse movements in foreign exchange rates. These contracts are intrinsically valued daily based on forward rates, and a fund’s net equity therein, representing unrealized gain or loss on the contracts as measured by the difference between the forward foreign exchange rates at the dates of entry into the contracts and the forward rates at the reporting date, is recorded as a component of net asset value. These instruments involve market risk, credit risk, or both kinds of risks, in excess of the amount recognized in the Statement of Assets and Liabilities. Risks arise from the possible inability of counterparties to meet the terms of their contracts and from movement in currency and securities values and interest rates. Due to the risks associated with these transactions, a fund could incur losses up to the entire contract amount, which may exceed the net unrealized value included in its net asset value.
The values of each individual forward currency contract outstanding as of November 30, 2015, are disclosed in the Fund’s Schedule of Investments.
Futures Contracts – The Fund may purchase futures contracts to gain exposure to market changes, which may be more efficient or cost effective than actually buying the securities. A futures contract is an agreement between parties to buy or sell a security at a set price on a future date. Upon entering into such a contract, a fund is required to pledge to the broker an amount of cash, U.S. Government obligations or other high-quality debt securities equal to the minimum “initial margin” requirements of the exchange on which the futures contract is traded. Pursuant to the contract, the fund agrees to receive from or pay to the broker an amount of cash equal to the daily fluctuation in the value of the contract. Such receipts or payments are known as “variation margin” and are recorded by the fund as unrealized gains or losses. When the contract is closed, the fund records a realized gain or loss equal to the difference between the value of the contract at the time it was opened and value at the time it was closed. Risks of entering into futures contracts include the possibility that there may be an illiquid market and that a change in the value of the contract may not correlate with changes in the value of the underlying securities.
Notional amounts of each individual futures contract outstanding as of November 30, 2015, for the Fund, are disclosed in the Schedule of Investments.
Distributions to Shareholders – Distributions to shareholders of net investment income, if any, are declared and paid at least annually. Distributions to shareholders of net capital gains, if any, are declared and paid at least annually. Distributions to shareholders are recorded on the ex-dividend date. Distributions are based on amounts calculated in accordance with applicable federal income tax regulations, which may differ from GAAP. These differences are due primarily to differing treatments of income and gain on various investment securities held by the Fund, timing differences and differing characterizations of distributions made by the Fund.
On December 15, 2015, the Fund paid distributions of $0.003370 in long-term capital gains per share related to the period ended November 30, 2015.
Federal Taxes – The Fund intends to continue to qualify each year as a regulated investment company under Subchapter M of the Internal Revenue Code and to distribute all of its taxable income to shareholders. In addition, by distributing in each calendar year
CVR DYNAMIC ALLOCATION FUND NOTES TO FINANCIAL STATEMENTS NOVEMBER 30, 2015 |
substantially all of its net investment income and capital gains, if any, the Fund will not be subject to a federal excise tax. Therefore, no federal income or excise tax provision is required. The Fund files a U.S. federal income and excise tax return as required. A fund’s federal income tax returns are subject to examination by the Internal Revenue Service for a period of three fiscal years after they are filed. As of November 30, 2015, there are no uncertain tax positions that would require financial statement recognition, de-recognition or disclosure.
Income and Expense Allocation – The Trust accounts separately for the assets, liabilities and operations of each of its investment portfolios. Expenses that are directly attributable to more than one investment portfolio are allocated among the respective investment portfolios in an equitable manner.
Offering Costs – Offering costs for the Fund of $65,650 consisted of fees related to the mailing and printing of the initial prospectus, certain startup legal costs, and initial registration filings. Such costs are amortized over a twelve-month period beginning with the commencement of operations of the Fund.
Commitments and Contingencies – In the normal course of business, the Fund enters into contracts that provide general indemnifications by the Fund to the counterparty to the contract. The Fund’s maximum exposure under these arrangements is dependent on future claims that may be made against the Fund and, therefore, cannot be estimated; however, based on experience, the risk of loss from such claims is considered remote.
Note 3. Cash – Concentration in Uninsured Account
For cash management purposes the Fund may concentrate cash with the Fund’s custodian. This typically results in cash balances exceeding the Federal Deposit Insurance Corporation (“FDIC”) insurance limits. As of November 30, 2015, the Fund held $1,656,964 as cash reserves at MUFG Union Bank, N.A. that exceeded the FDIC insurance limit.
Note 4. Fees and Expenses
Investment Adviser – CVR Portfolio Funds LLC (the “Adviser”) is the investment adviser to the Fund. Pursuant to an investment advisory agreement, the Adviser receives an advisory fee from the Fund at an annual rate of 1.10% of the Fund’s average daily net assets.
The Adviser has employed a sub-adviser to manage a portion of the Fund's assets. The sub-advisory fee, calculated as a percentage of the Fund’s average daily net assets, is paid by the Adviser.
Distribution – Foreside Fund Services, LLC serves as the Fund’s distributor (the “Distributor”). The Fund has adopted a Distribution Plan (the “Plan”) in accordance with Rule 12b-1 of the Act. Under the Plan, the Fund may pay the Distributor and/or any other entity as authorized by the Board a fee of up to 0.25% of the Fund’s average daily net assets of Investor Shares for providing distribution and/or shareholder services to the Fund. The Distributor is not affiliated with the Adviser or Atlantic Fund Administration, LLC (d/b/a Atlantic Fund Services) (“Atlantic”) or their affiliates.
Other Service Providers – Atlantic provides fund accounting, fund administration, compliance and transfer agency services to the Fund. Atlantic also provides certain shareholder report production, and EDGAR conversion and filing services. Pursuant to an Atlantic services agreement, the Fund pays Atlantic customary fees for its services. Atlantic provides a Principal Executive Officer, a Principal Financial Officer, a Chief Compliance Officer, and an Anti-Money Laundering Officer to the Fund, as well as certain additional compliance support functions.
Trustees and Officers – The Trust pays each Independent Trustee an annual fee of $16,000 ($21,000 for the Chairman). The Independent Trustees and Chairman may receive additional fees for special Board meetings. The Independent Trustees are also reimbursed for all reasonable out-of-pocket expenses incurred in connection with their duties as Trustees, including travel and related expenses incurred in attending Board meetings. The amount of Independent Trustees’ fees attributable to the Fund is disclosed in the Statement of Operations. Certain officers of the Trust are also officers or employees of the above named service providers, and during their terms of office received no compensation from the Fund.
Note 5. Expenses Reimbursed and Fees Waived
The Adviser has contractually agreed to waive its fee and/or reimburse certain expenses to limit total annual operating expenses (excluding all taxes, interest, portfolio transaction expenses, proxy expenses and extraordinary expenses) to 1.65% for Institutional Shares through March 31, 2016. Other fund service providers have voluntarily agreed to waive and reimburse a portion of their fees.
CVR DYNAMIC ALLOCATION FUND NOTES TO FINANCIAL STATEMENTS NOVEMBER 30, 2015 |
These voluntary fee waivers and reimbursements may be reduced or eliminated at any time. For the year ended November 30, 2015, fees waived and expenses reimbursed were as follows:
| Investment Adviser Fees Waived | | Acquired Fund Fees and Expenses Reimbursed by Adviser | | Other Waivers | | Total Fees Waived and Expenses Reimbursed |
| $ | 98,788 | | $ | 27,545 | | $ | 36,000 | | $ | 162,333 |
The Fund may repay the Adviser for fees waived and expenses reimbursed pursuant to the expense cap if such payment is made within three years of the fee waiver or expense reimbursement, is approved by the Fund’s Board of Trustees and does not cause the net annual fund operating expenses of a class to exceed the expense cap in place at the time the fees were waived. As of November 30, 2015, the following amounts are subject to recapture by the Adviser:
| | | Amount of Fees Waived and/or Expenses Reimbursed | | Expiration Date to Recoup Fees Waived and/or Expenses Reimbursed | | Fees Recouped |
| November 30, 2014 | | $ | 160,247 | | November 30, 2017 | | $ | - |
| November 30, 2015 | | $ | 126,333 | | November 30, 2018 | | $ | - |
Note 6. Security Transactions
The cost of purchases and proceeds from sales of investment securities (including maturities), other than short-term investments during the year ended November 30, 2015, were $28,124,140 and $21,716,070, respectively.
Note 7. Summary of Derivative Activity
The volume of open derivative positions may vary on a daily basis as the Fund transacts derivative contracts in order to achieve the exposure desired by the Adviser. The notional value of activity for the year ended November 30, 2015, for any derivative type that was held during the year is as follows:
| Forward Currency Contracts | | $ | 37,722,501 | |
| Futures Contracts | | $ | 106,697,410 | |
The Fund’s use of derivatives during the year ended November 30, 2015, was limited to forward currency contracts and futures contracts.
Following is a summary of the effect of derivatives on the Statement of Assets and Liabilities as of November 30, 2015:
| Location: | | Interest Risk | | Commodity Risk | | Currency Risk | | Equity Risk | | Total |
| Asset derivatives: | | | | | | | | | | | | | | | | | | | | |
| Unrealized gain on forward currency contracts | | $ | - | | | $ | - | | | $ | 350,733 | | | $ | - | | | $ | - | |
| Liability derivatives: | | | | | | | | | | | | | | | | | | | | |
| Unrealized loss on forward currency contracts | | $ | - | | | $ | - | | | $ | (455,318 | ) | | $ | - | | | $ | - | |
| Payable – variation margin | | | (5,350 | ) | | | (2,390 | ) | | | - | | | | 886 | | | | (6,854 | ) |
Realized and unrealized gains and losses on derivatives contracts during the year ended November 30, 2015, by the Fund are recorded in the following locations on the Statement of Operations:
| Location: | | Interest Risk | | Commodity Risk | | Currency Risk | | Equity Risk | | Total |
| Net realized gain (loss) on: | | | | | | | | | | | | | | | | | | | | |
| Futures | | $ | 36,939 | | | $ | 26,651 | | | $ | (63,255 | ) | | $ | 31,989 | | | $ | 32,324 | |
| Total net realized gain (loss) | | $ | 36,939 | | | $ | 26,651 | | | $ | (63,255 | ) | | $ | 31,989 | | | $ | 32,324 | |
| | | | | | | | | | | | | | | | | | | | | |
| Net change in unrealized appreciation (depreciation) on: | | | | | | | | | | | | | | | | | | | | |
| Forward Currency Contracts | | $ | - | | | $ | - | | | $ | (104,585 | ) | | $ | - | | | $ | (104,585 | ) |
| Futures | | | (31,978 | ) | | | 2,660 | | | | (21,519 | ) | | | (32,858 | ) | | | (83,695 | ) |
| Total net change in unrealized appreciation (depreciation) | | $ | (31,978 | ) | | $ | 2,660 | | | $ | (126,104 | ) | | $ | (32,858 | ) | | $ | (188,280 | ) |
Asset (Liability) amounts shown in the table below represent amounts for derivative related investments at November 30, 2015. These amounts may be collateralized by cash or financial instruments.
CVR DYNAMIC ALLOCATION FUND NOTES TO FINANCIAL STATEMENTS NOVEMBER 30, 2015 |
| | | Gross Asset (Liability) as Presented in the Statement of Assets and Liabilities | | Financial Instruments (Received) Pledged** | | Cash Collateral (Received) Pledged** | | Net Amount |
| Assets: | | | | | | | | | | | | | | | | |
| Over-the-counter derivatives* | | $ | 350,733 | | | $ | (350,733 | ) | | $ | - | | | $ | - | |
| Liabilities: | | | | | | | | | | | | | | | | |
| Over-the-counter derivatives* | | $ | (462,172 | ) | | $ | 350,733 | | | $ | 111,439 | | | $ | - | |
| | * Over-the-counter derivatives consists of forward currency contracts and futures contracts. The amounts disclosed above represent the exposure to one or more counterparties. For further detail on individual derivative contracts and the corresponding unrealized appreciation (depreciation), see the Schedule of Investments. |
| | ** The actual financial instruments and cash collateral (received) pledged may be in excess of the amounts shown in the table. The table only reflects collateral amounts up to the amount of the financial instrument disclosed on the Statement of Assets and Liabilities. |
Note 8. Federal Income Tax
Distributions paid during the fiscal year ended as noted were characterized for tax purposes as follows:
| | | 2015 |
| Ordinary Income | | $ | 62,110 |
| Long-Term Capital Gain | | | 60,034 |
| | | $ | 122,144 |
As of November 30, 2015, distributable earnings (accumulated loss) on a tax basis were as follows:
| Undistributed Long-Term Gain | | $ | 7,335 | |
| Capital and Other Losses | | | (105,434 | ) |
| Unrealized Depreciation | | | (285,876 | ) |
| Total | | $ | (383,975 | ) |
The difference between components of distributable earnings on a tax basis and the amounts reflected in the Statement of Assets and Liabilities are primarily due to wash sales and mark to market on section 988 currency contracts and section 1256 futures contracts.
For tax purposes, the current year post-October loss was $47,983 and the current deferred late year ordinary loss was $57,451 (realized during the period November 1, 2015 through November 30, 2015). These losses will be recognized for tax purposes on the first business day of the Fund’s next fiscal year, December 1, 2015.
On the Statement of Assets and Liabilities, as a result of permanent book to tax differences, certain amounts have been reclassified for the year ended November 30, 2015. The following reclassification was the result of currency gain/loss and section 988 transactions, and has no impact on the net assets of the Fund.
| Accumulated Net Investment Loss | | $ | 81,901 | |
| Accumulated Net Realized Loss | | | (81,901 | ) |
Note 9. Recent Accounting Pronouncements
In May 2015, the Financial Accounting Standards Board (“FASB”) issued Accounting Standards Update 2015-07 (“ASU 2015-07”) eliminating the requirement for investments measured at net asset value to be categorized within the fair value hierarchy under GAAP and requiring the disclosure of sufficient information to reconcile the fair value of the remaining assets categorized within the fair value hierarchy to the financial statements. ASU 2015-07 is effective for interim and annual reporting periods beginning after December 15, 2015. Management has reviewed the requirements and believes the adoption of ASU 2015-07 will not have a material impact on the financial statements.
Note 10. Subsequent Events
Subsequent events occurring after the date of this report through the date these financial statements were issued have been evaluated for potential impact and the Fund has had no such events.
REPORT OF REGISTERED INDEPENDENT PUBLIC ACCOUNTING FIRM |
To the Board of Trustees of Forum Funds II and the Shareholders of
CVR Dynamic Allocation Fund
We have audited the accompanying statement of assets and liabilities of the CVR Dynamic Allocation Fund (the "Fund"), a series of shares of beneficial interest in Forum Funds II, including the schedule of investments, as of November 30, 2015, and the related statement of operations for the year then ended and the statements of changes in net assets and the financial highlights for the year then ended and for the period December 30, 2013 (commencement of operations) to November 30, 2014. These financial statements and financial highlights are the responsibility of the Fund’s management. Our responsibility is to express an opinion on these financial statements and financial highlights based on our audits.
We conducted our audits in accordance with the standards of the Public Company Accounting Oversight Board (United States). Those standards require that we plan and perform the audits to obtain reasonable assurance about whether the financial statements and financial highlights are free of material misstatement. An audit includes examining, on a test basis, evidence supporting the amounts and disclosures in the financial statements. Our procedures included confirmation of securities owned as of November 30, 2015 by correspondence with the custodian and brokers and by other appropriate auditing procedures where responses from brokers were not received. An audit also includes assessing the accounting principles used and significant estimates made by management, as well as evaluating the overall financial statement presentation. We believe that our audits provide a reasonable basis for our opinion.
In our opinion, the financial statements and financial highlights referred to above present fairly, in all material respects, the financial position of the CVR Dynamic Allocation Fund as of November 30, 2015, the results of its operations for the year then ended, and the changes in its net assets and its financial highlights for the year then ended and for the period December 30, 2013 through November 30, 2014, in conformity with accounting principles generally accepted in the United States of America.
BBD, LLP
Philadelphia, Pennsylvania
January 26, 2016
CVR DYNAMIC ALLOCATION FUND ADDITIONAL INFORMATION (Unaudited) NOVEMBER 30, 2015 |
Investment Advisory Agreement Approval
The Trust’s investment advisory agreements with its investment advisers and the investment subadvisory agreements between its investment advisers and investment subadvisers must be approved for initial terms no greater than two years, and must be renewed at least annually thereafter by the vote of the Trustees, including a majority of the Trustees who are not parties to the agreements or “interested persons” of any party thereto (the “Independent Trustees”).
On June 11, 2015, the Trustees met in person with independent legal counsel to the Independent Trustees (“Independent Legal Counsel”), representatives of the Adviser, ROW Asset Management, LLC (the “Subadviser”), and others to consider information related to the approval of the investment subadvisory agreement between the Adviser and Subadviser for the performance of investment subadvisory services to the Fund. A description of the Board’s conclusions in approving the agreement follows.
In preparation for its June meeting of the Board of Trustees of the Trust (“June Meeting”), the Trustees were presented with a range of information to assist in their deliberations. Those materials included a copy of the proposed investment subadvisory agreement and other information regarding the proposed subadvisory fee arrangement. The Trustees also received a memorandum from Independent Legal Counsel concerning their responsibilities with respect to the approval of the investment subadvisory agreement. The Independent Trustees met in executive session with Independent Legal Counsel while deliberating.
The Board also reviewed information provided by the Subadviser concerning the following:
| · | The nature and extent of the services to be provided by the Subadviser, including information about the investment strategy to be employed with respect to the assets allocated to the Subadviser; |
| · | The personnel of the Subadviser, including educational background, experience in the investment management industry, and the ability of the Subadviser to retain qualified personnel; |
| · | The compliance program of the Subadviser; |
| · | The financial condition and stability of the Subadviser; |
| · | The potential for the Subadviser to derive benefits that are ancillary to serving as an investment subadviser to the Fund; |
| · | The investment performance of the Subadviser with respect to its similarly managed accounts; |
| · | The investing philosophy of the Subadviser; and |
| · | The terms of the proposed investment subadvisory agreement. The Board did not consider information regarding the costs of services provided or profits realized by the Subadviser from its relationship with the Fund, noting instead the arms-length nature of the relationship between the Adviser and subadviser with respect to the negotiation of the advisory fee rate on behalf of the Fund and that the Adviser, and not the Fund, was responsible for paying the subadvisory fee due under the subadvisory agreement. |
At the June Meeting, the Trustees reviewed, evaluated, and discussed among themselves and with the Adviser, Subadviser, and Independent Legal Counsel, among other things, the information referenced above. The Trustees also considered the overall reputation, capabilities, and commitment of the Subadviser to provide high-quality services to the Fund. The Independent Trustees engaged in discussion and consideration amongst themselves, and with the Adviser, Subadviser, and Independent Legal Counsel. The Trustees noted in particular the Adviser’s recommendation to appoint the Subadviser and concluded that the nature and extent of the investment subadvisory services to be provided by the Subadviser to the Fund would be appropriate and consistent with the terms of the investment subadvisory agreement. At the June Meeting, the Board unanimously approved the investment subadvisory agreement. The Trustees agreed that no single factor was determinative of their decision to approve the investment subadvisory agreement.
Proxy Voting Information
A description of the policies and procedures that the Fund uses to determine how to vote proxies relating to securities held in the Fund’s portfolio is available, without charge and upon request, by calling (855) 328-7691 and on the U.S. Securities and Exchange Commission’s (the “SEC”) website at www.sec.gov. The Fund’s proxy voting record for the most recent twelve-month period ended June 30 is available, without charge and upon request, by calling (855) 328-7691 and on the SEC’s website at www.sec.gov.
CVR DYNAMIC ALLOCATION FUND ADDITIONAL INFORMATION (Unaudited) NOVEMBER 30, 2015 |
Availability of Quarterly Portfolio Schedules
The Fund files its complete schedule of portfolio holdings with the SEC for the first and third quarters of each fiscal year on Form N-Q. These filings are available, without charge and upon request on the SEC’s website at www.sec.gov or may be reviewed and copied at the SEC’s Public Reference Room in Washington, DC. Information on the operation of the Public Reference Room may be obtained by calling (800) SEC-0330.
Shareholder Expense Example
As a shareholder of the Fund, you incur ongoing costs, including management fees, distribution and/or service (12b-1) fees (for Investor Shares only), and other Fund expenses. This example is intended to help you understand your ongoing costs (in dollars) of investing in the Fund and to compare these costs with the ongoing costs of investing in other mutual funds.
The example is based on an investment of $1,000 invested at the beginning of the period and held for the entire period from June 1, 2015, through November 30, 2015.
Actual Expenses – The first line of the table below provides information about actual account values and actual expenses. You may use the information in this line, together with the amount you invested, to estimate the expenses that you paid over the period. Simply divide your account value by $1,000 (for example, an $8,600 account value divided by $1,000 = 8.6), then multiply the result by the number in the first line under the heading entitled “Expenses Paid During Period” to estimate the expenses you paid on your account during the period.
Hypothetical Example for Comparison Purposes – The second line of the table below provides information about hypothetical account values and hypothetical expenses based on the Fund’s actual expense ratio and an assumed rate of return of 5% per year before expenses, which is not the Fund’s actual return. The hypothetical account values and expenses may not be used to estimate the actual ending account balance or expenses you paid for the period. You may use this information to compare the ongoing costs of investing in the Fund and other funds. To do so, compare this 5% hypothetical example with the 5% hypothetical examples that appear in the shareholder reports of other funds.
Please note that the expenses shown in the table are meant to highlight your ongoing costs only. Therefore, the second line of the table is useful in comparing ongoing costs only, and will not help you determine the relative total costs of owning different funds.
| | Beginning | | Ending | | Expenses | | Annualized |
| | Account Value | | Account Value | | Paid During | | Expense |
| | June 1, 2015 | | November 30, 2015 | | Period* | | Ratio* |
| Institutional Shares | | | | | | | | | | | |
| Actual | $ | 1,000.00 | | $ | 918.80 | | $ | 7.22 | | 1.50 | % |
| Hypothetical (5% return before taxes) | $ | 1,000.00 | | $ | 1,017.55 | | $ | 7.59 | | 1.50 | % |
| * | Expenses are equal to the Fund’s annualized expense ratio multiplied by the average account value over the period, multiplied by the number of days in the most recent fiscal half-year divided by 365 to reflect the half-year period. |
Federal Tax Status of Dividends Declared during the Fiscal Year
For federal income tax purposes, dividends from short-term capital gains are classified as ordinary income. The Fund designates 100.00% of its income dividend distributed as qualifying for the corporate dividends-received deduction (DRD) and 100.00% for the qualified dividend rate (QDI) as defined in Section 1(h)(11) of the Internal Revenue Code. The Fund also designates 100.00% as short-term capital gain dividends exempt from U.S. tax for foreign shareholders (QSD).
CVR DYNAMIC ALLOCATION FUND ADDITIONAL INFORMATION (Unaudited) NOVEMBER 30, 2015 |
Trustees and Officers of the Trust
The Board is responsible for oversight of the management of the Trust’s business affairs and of the exercise of all the Trust’s powers except those reserved for the shareholders. The following table provides information about each Trustee and certain officers of the Trust. Each Trustee and officer holds office until the person resigns, is removed, or is replaced. Unless otherwise noted, the persons have held their principal occupations for more than five years. The address for all Trustees and officers is Three Canal Plaza, Suite 600, Portland, Maine 04101. Mr. Keffer and Mr. Hong are considered Interested Trustees due to their affiliation with Atlantic. The Fund’s Statement of Additional Information includes additional information about the Trustees and is available, without charge and upon request, by calling (855) 328-7691.
| Name and Year of Birth | Position with the Trust | Length of Time Served | Principal Occupation(s) During Past Five Years | Number of Series of Fund Complex¹ Overseen by Trustee | Other Directorships Held by Trustee |
Independent Trustees | | | | | |
David Tucker Born: 1958 | Chairman of the Board; Trustee; Chairman, Nominating Committee and Qualified Legal Compliance Committee | Since 2013 | Director, Blue Sky Experience (a charitable endeavor) since 2008; Senior Vice President & General Counsel, American Century Companies 1998-2008. | 38 | Trustee, Forum Funds; Trustee, Forum ETF Trust |
Mark D. Moyer Born: 1959 | Trustee; Chairman, Audit Committee | Since 2013 | Chief Financial Officer, Institute of International Education 2008-2011; Chief Financial Officer and Chief Restructuring Officer, Ziff Davis Media Inc. 2005-2008; Adjunct Professor of Accounting, Fairfield University 2009-2012. | 11 | Trustee, Forum ETF Trust |
Jennifer Brown-Strabley Born: 1964 | Trustee | Since 2013 | Principal, Portland Global Advisors 1996-2010. | 11 | Trustee, Forum ETF Trust |
Interested Trustees | | | | | |
Stacey E. Hong Born: 1966 | Trustee | Since 2013 | President, Atlantic since 2008. | 11 | None |
John Y. Keffer2 Born: 1942 | Trustee | Since 2013 | Chairman, Atlantic since 2008; President, Forum Investment Advisors, LLC since 2011; President, Forum Foundation (a charitable organization) since 2005; President, Forum Trust, LLC (a non-depository trust company chartered in the State of Maine) since 1997. | 38 | Trustee, Forum Funds, Forum ETF Trust and ALTMFX Trust; Director, Wintergreen Fund, Inc. |
Officers | | | | | |
Jessica Chase Born: 1970 | President; Principal Executive Officer | Since 2015 | Senior Vice President, Atlantic since 2008. | N/A | N/A |
Karen Shaw Born: 1972 | Treasurer; Principal Financial Officer | Since 2013 | Senior Vice President, Atlantic since 2008. | N/A | N/A |
Zachary Tackett Born: 1988 | Vice President; Secretary; Anti-Money Laundering Compliance Officer | Since 2014 | Associate Counsel, Atlantic since 2014; Intern Associate, Coakley & Hyde, PLLC, 2010-2013. | N/A | N/A |
Michael J. McKeen Born: 1971 | Vice President | Since 2013 | Senior Vice President, Atlantic since 2008. | N/A | N/A |
Timothy Bowden Born: 1969 | Vice President | Since 2013 | Manager, Atlantic since 2008. | N/A | N/A |
Geoffrey Ney Born: 1975 | Vice President | Since 2013 | Manager, Atlantic since 2013; Senior Fund Accountant, Atlantic, 2008-2013. | N/A | N/A |
Todd Proulx Born: 1978 | Vice President | Since 2013 | Manager, Atlantic since 2013; Senior Fund Accountant, Atlantic, 2008-2013. | N/A | N/A |
1The Fund Complex includes the Trust, Forum Funds and Forum ETF Trust and is overseen by different Boards of Trustees. 2Atlantic is a subsidiary of Forum Holdings Corp. I, a Delaware corporation that is wholly owned by Mr. Keffer. |
CVR DYNAMIC ALLOCATION FUND
FOR MORE INFORMATION:
P.O. Box 588
Portland, ME 04112
(855) 328-7691 (toll free)
INVESTMENT ADVISER
CVR Portfolio Funds LLC
One Bromfield Street, Suite 5100
Boston, MA 02108
TRANSFER AGENT
Atlantic Fund Services
P.O. Box 588
Portland, ME 04112
www.atlanticfundservices.com
DISTRIBUTOR
Foreside Fund Services, LLC
Three Canal Plaza, Suite 100
Portland, Maine 04101
www.foreside.com
This report is submitted for the general information of the shareholders of the Fund. It is not authorized for distribution to prospective investors unless preceded or accompanied by an effective prospectus, which includes information regarding the Fund’s risks, objectives, fees and expenses, experience of its management, and other information.
219-ANR-1115
ITEM 2. CODE OF ETHICS.
| (a) | As of the end of the period covered by this report, Forum Funds II (the “Registrant”) has adopted a code of ethics, which applies to its Principal Executive Officer and Principal Financial Officer (the “Code of Ethics”). |
| (c) | There have been no amendments to the Registrant’s Code of Ethics during the period covered by this report. |
| (d) | There have been no waivers to the Registrant’s Code of Ethics during the period covered by this report. |
(e) Not applicable.
(f) (1) A copy of the Code of Ethics is being filed under Item 12(a) hereto.
ITEM 3. AUDIT COMMITTEE FINANCIAL EXPERT.
The Board of Trustees has delegated Mr. Mark Moyer as an "audit committee financial expert" as that term is defined under applicable regulatory guidelines. Mr. Moyer is a non- “interested” Trustee (as defined in Section 2(a)(19) under the Investment Company Act of 1940, as amended (the “Act”)), and serves as Chairman of the Audit Committee.
ITEM 4. PRINCIPAL ACCOUNTANT FEES AND SERVICES.
(a) Audit Fees - The aggregate fees billed for each of the last two fiscal years (the “Reporting Periods”) for professional services rendered by the Registrant’s principal accountant for the audit of the Registrant’s annual financial statements, or services that are normally provided by the principal accountant in connection with the statutory and regulatory filings or engagements for the Reporting Periods, were $20,640 in 2014 and $25,800 in 2015.
(b) Audit-Related Fees – The aggregate fees billed in the Reporting Periods for assurance and related services rendered by the principal accountant that were reasonably related to the performance of the audit of the Registrant’s financial statements and are not reported under paragraph (a) of this Item 4 were $0 in 2014 and $0 in 2015.
(c) Tax Fees - The aggregate fees billed in the Reporting Periods for professional services rendered by the principal accountant to the Registrant for tax compliance, tax advice and tax planning were $6,000 in 2014 and $6,000 in 2015. These services consisted of review or preparation of U.S. federal, state, local and excise tax returns.
(d) All Other Fees - The aggregate fees billed in the Reporting Periods for products and services provided by the principal accountant to the Registrant, other than the services reported in paragraphs (a) through (c) of this Item, were $0 in 2014 and $0 in 2015.
(e) (1) The Audit Committee reviews and approves in advance all audit and “permissible non-audit services” (as that term is defined by the rules and regulations of the Securities and Exchange Commission) to be rendered to a series of the Registrant (each, a “Series”). In addition, the Audit Committee reviews and approves in advance all “permissible non-audit services” to be provided to an investment adviser (not including any sub-adviser) of a Series, or an affiliate of such investment adviser, that is controlling, controlled by or under common control with the investment adviser and provides on-going services to the Registrant (“Affiliate”), by the Series’ principal accountant if the engagement relates directly to the operations and financial reporting of the Series. The Audit Committee considers whether fees paid by a Series’ investment adviser or an Affiliate to the Series’ principal accountant for audit and permissible non-audit services are consistent with the principal accountant’s independence.
(e) (2) No services included in (b) - (d) above were approved pursuant to paragraph (c)(7)(i)(C) of Rule 2-01 of Regulation S-X.
(f) Not applicable
(g) The aggregate non-audit fees billed by the principal accountant for services rendered to the Registrant for the Reporting Periods were $0 in 2013 and $0 in 2014. There were no fees billed in either of the Reporting Periods for non-audit services rendered by the principal accountant to the Registrant’s investment adviser or any Affiliate.
(h) During the Reporting Period, the Registrant's principal accountant provided no non-audit services to the investment advisers or any entity controlling, controlled by or under common control with the investment advisers to the series of the Registrant to which this report relates.
ITEM 5. AUDIT COMMITTEE OF LISTED REGISTRANTS.
Not applicable
ITEM 6. INVESTMENTS.
| (a) | Included as part of report to shareholders under Item 1. |
ITEM 7. DISCLOSURE OF PROXY VOTING POLICIES AND PROCEDURES FOR CLOSED-END
MANAGEMENT INVESTMENT COMPANIES.
Not applicable.
ITEM 8. PORTFOLIO MANAGERS OF CLOSED-END MANAGEMENT INVESTMENT COMPANIES.
Not applicable.
ITEM 9. PURCHASES OF EQUITY SECURITIES BY CLOSED-END MANAGEMENT INVESTMENT COMPANY AND AFFILIATED PURCHASERS.
Not applicable.
ITEM 10. SUBMISSION OF MATTERS TO A VOTE OF SECURITY HOLDERS
The Registrant does not accept nominees to the board of trustees from shareholders.
ITEM 11. CONTROLS AND PROCEDURES
(a) The Registrant’s Principal Executive Officer and Principal Financial Officer have concluded that the Registrant’s disclosure controls and procedures (as defined in Rule 30a-3(c) under the Act are effective, based on their evaluation of the controls and procedures required by Rule 30a-3(b) under the Act and Rules 13a-15(b) or 15d-15(b) under the Securities Exchange Act of 1934, as of a date within 90 days of the filing date of this report.
(b) There were no changes in the Registrant’s internal control over financial reporting (as defined in
Rule 30a-3(d) under the Act) that occurred during the second fiscal quarter of the period covered by this report that have materially affected, or are reasonably likely to materially affect, the Registrant’s internal control over financial reporting.
ITEM 12. EXHIBITS.
(a)(1) Code of Ethics (Exhibit filed herewith).
(a)(2) Certifications pursuant to Rule 30a-2(a) of the Act, and Section 302 of the Sarbanes-Oxley Act of 2002. (Exhibits filed herewith)
(a)(3) Not applicable.
(b) Certifications pursuant to Rule 30a-2(b) of the Act, and Section 906 of the Sarbanes-Oxley Act of 2002. (Exhibit filed herewith)
SIGNATURES
Pursuant to the requirements of the Securities Exchange Act of 1934 and the Investment Company Act of 1940, the Registrant has duly caused this report to be signed on its behalf by the undersigned, thereunto duly authorized.
Registrant Forum Funds II
By /s/ Jessica Chase
Jessica Chase, Principal Executive Officer
Date January 14, 2016
Pursuant to the requirements of the Securities Exchange Act of 1934 and the Investment Company Act of 1940, this report has been signed below by the following persons on behalf of the Registrant and in the capacities and on the dates indicated.
By /s/ Jessica Chase
Jessica Chase, Principal Executive Officer
Date January 14, 2016
By /s/ Karen Shaw
Karen Shaw, Principal Financial Officer
Date January 14, 2016