As filed with the Securities and Exchange Commission on May 27, 2016
UNITED STATES
SECURITIES AND EXCHANGE COMMISSION
WASHINGTON, D.C. 20549
FORM N-CSR
CERTIFIED SHAREHOLDER REPORT OF REGISTERED MANAGEMENT
INVESTMENT COMPANIES
Investment Company Act file number 811-22842
FORUM FUNDS II
Three Canal Plaza, Suite 600
Portland, Maine 04101
Jessica Chase, Principal Executive Officer
Three Canal Plaza, Suite 600
Portland, Maine 04101
207-347-2000
Date of fiscal year end: September 30
Date of reporting period: October 1, 2015 – March 31, 2016
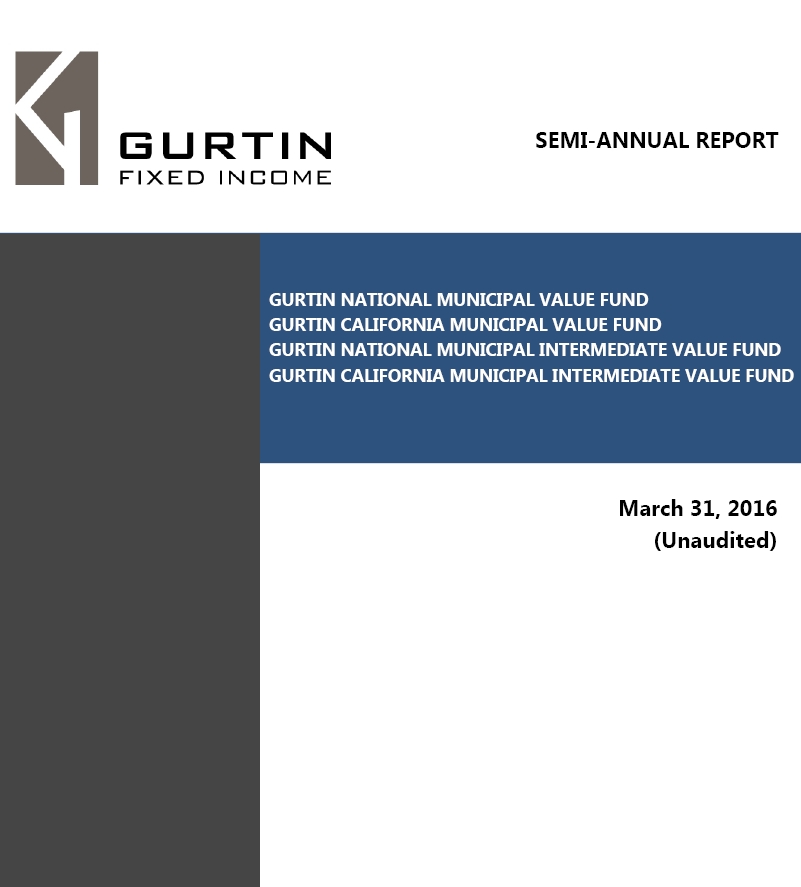
TABLE OF CONTENTS |
Gurtin National Municipal Value Fund | ||
A Message to Our Shareholders | 3 | |
Performance Chart and Analysis | 5 | |
Schedule of Investments | 7 | |
Statement of Assets and Liabilities | 11 | |
Statement of Operations | 12 | |
Statements of Changes in Net Assets | 13 | |
Financial Highlights | 14 |
Gurtin California Municipal Value Fund |
A Message to Our Shareholders | 15 | |
Performance Chart and Analysis | 17 | |
Schedule of Investments | 19 | |
Statement of Assets and Liabilities | 24 | |
Statement of Operations | 25 | |
Statements of Changes in Net Assets | 26 | |
Financial Highlights | 27 |
Gurtin National Municipal Intermediate Value Fund |
A Message to Our Shareholders | 28 | |
Performance Chart and Analysis | 30 | |
Schedule of Investments | 31 | |
Statement of Assets and Liabilities | 35 | |
Statement of Operations | 36 | |
Statements of Changes in Net Assets | 37 | |
Financial Highlights | 38 |
Gurtin California Municipal Intermediate Value Fund |
A Message to Our Shareholders | 39 | |
Performance Chart and Analysis | 41 | |
Schedule of Investments | 42 | |
Statement of Assets and Liabilities | 46 | |
Statement of Operations | 47 | |
Statements of Changes in Net Assets | 48 | |
Financial Highlights | 49 |
Notes to Financial Statements | 50 | |
Additional Information | 54 |
Dear Shareholders:
While uncertainty regarding the future path of interest rate hikes has continued to inundate the Federal Reserve's commentary, we have sustained a consistent theme in our management of the Gurtin National Municipal Value Fund and the Gurtin California Municipal Value Fund (the Gurtin Value Funds): Our strict adherence to our disciplined investment approach of opportunistically deploying capital only as attractive investments become available.
Given that bonds meeting our targets have been in shorter supply over the past six months as interest rates have continued to fall and spreads have continued to narrow, we have chosen to remain conservatively positioned in our management of the Gurtin Value Funds, with the belief that the current lack of absolute value in the market is temporary, and the knowledge that in general, municipal yields rise and spreads widen when Treasury yields rise, and municipal yields and spreads narrow when Treasury yields fall. As we patiently wait for the mirror image of the current market – namely, rising yields and widening spreads – we are:
| · | Maintaining our discipline |
We continue to maintain our discipline of only extending duration for high quality bonds meeting our yield targets in order to potentially maximize risk-adjusted, long-term income. As nimble, contrarian investors with conservatively short positioning in the current investment environment, we remain poised to take advantage of opportunities to buy in the event of increased market volatility, rising interest rates, or widening credit spreads.
| · | Purchasing shorter duration structures |
In the final quarter of 2015, we had the opportunity to exploit idiosyncratic mispriced credits with attractive yields and longer duration. Given the more limited nature of opportunities seen in the first quarter of 2016, we will continue this approach when possible, while also purchasing shorter duration structures, rather than extending duration to buy lower yielding bonds that do not provide appropriate compensation for the extension risk assumed. This approach will allow us to reinvest opportunistically in the event that yields rise and spreads widen.
| · | Increasing swappable cash equivalents |
Long-term municipal yields have continued a downward trend despite the Federal Reserve's decision to raise rates by 25 basis points to a target range between 0.25% and 0.5% on Dec. 16, 2015. This has contributed to our decision to increase our swappable cash equivalents, which will increase cash availability when opportunities do arise in a rising yield and widening spread environment.
We believe that our conservative positioning enables us to remain nimble, and look forward to being able to deploy available cash and swap out of cash equivalents and into higher yielding investments as opportunities arise.
Sincerely,

William R. Gurtin
CEO, CIO, Managing Partner
Gurtin Fixed Income Management, LLC
CEO, CIO, Managing Partner
Gurtin Fixed Income Management, LLC
Important Information:
There can be no guarantee that any strategy (risk management) or otherwise will be successful. All investing involves risk, including the potential loss of principal.
Bonds: Investing in the bond market is subject to certain risks including market, interest-rate, issuer, credit and inflation risk; investments may be worth more or less than the original cost when redeemed. Income from municipal bonds may be subject to state and local taxes and at times the alternative minimum tax; a strategy concentrating in a single or limited number of states is subject to greater risk of adverse economic conditions and regulatory changes. The value of most bond funds and fixed income securities is impacted by changes in interest rates. Bonds and bond funds with longer durations tend to be more sensitive and more volatile than securities with shorter durations; bond prices generally fall as interest rates rise. Credit risk refers to an issuer's ability to make interest and principal payments when due.
The following chart reflects the change in the value of a hypothetical $250,000 investment in Institutional Shares, including reinvested dividends and distributions, in Gurtin National Municipal Value Fund (the "Fund") compared with the performance of the benchmark, Bank of America Merrill Lynch Municipal Miscellaneous Index 7-12 Years ("BAML Muni Misc 7-12") and the Bank of America Merrill Lynch Municipal Blended Index ("BAML Muni Blended"), since inception. The BAML Muni Misc 7-12 was formerly known as the Merrill Lynch Municipal Miscellaneous 7-12 Years Index and measures the performance of municipal securities with a remaining term to final maturity greater than or equal to 7 years and less than 12 years. The BAML Muni Blended is a blend of 75% of The Bank of America Merrill Lynch 7-12 Year US Large Cap Municipal Securities Index, a subset of the Bank of America Merrill Lynch US Large Cap Municipal Securities Index including all securities with a remaining term to final maturity greater than or equal to 7 years and less than 12 years, and 25% of the Bank of America Merrill Lynch 12-22 Year US Large Cap Municipal Securities Index, a subset of the Bank of America Merrill Lynch US Large Cap Municipal Securities Index including all securities with a remaining term to final maturity greater than or equal to 12 years and less than 22 years. The total returns of both the BAML Muni Misc 7-12 and the BAML Muni Blended includes the reinvestment of dividends and income. The total return of the Fund includes operating expenses that reduce returns, while the total returns of the BAML Muni Misc 7-12 and the BAML Muni Blended does not include expenses. The Fund is professionally managed while the BAML Muni Misc 7-12 and the BAML Muni Blended are unmanaged and are not available for investment.
Performance data quoted represents past performance and is no guarantee of future results. Current performance may be lower or higher than the performance data quoted. Investment return and principal value will fluctuate so that shares, when redeemed, may be worth more or less than original cost. For the most recent month-end performance, please call (844) 342-5763. As stated in the Fund's current prospectus, the annual operating expense ratio (gross) is 0.93%. However, the Fund's adviser has contractually agreed to waive its fee and/or reimburse expenses to limit total operating expenses(excluding all taxes, interest, portfolio transaction expenses, acquired fund fees and expenses, proxy expenses and extraordinary expenses) to 0.60%, through January 28, 2017. During the period, certain fees were waived and/or expenses reimbursed; otherwise, returns would have been lower. The performance table and graph do not reflect the deduction of taxes that a shareholder would pay on Fund distributions or the redemption of Fund shares. Returns greater than one year are annualized.
| $ | 1,000,000 | Natomas Unified School District, California General Obligation Bond (a) | 5.14 | % | 08/01/27 | $ | 567,550 | ||||
| 130,000 | State of California, General Obligation Bond, Series 07 | 5.13 | 10/01/27 | 130,532 | |||||||
| 1,500,000 | Stockton East Water District, California Certificate of Participation, Series B (a) | 5.96-5.97 | 04/01/20 | 1,186,755 | |||||||
| 2,200,000 | Stockton East Water District, California Certificate of Participation, Series B (a) | 6.09 | 04/01/26 | 1,207,602 | |||||||
| 250,000 | Victor Valley Community College District, California General Obligation Bond, Series A | 5.38 | 08/01/29 | 285,162 | |||||||
| 13,195,301 | |||||||||||
| Connecticut - 13.2% | |||||||||||
| 2,800,000 | Connecticut State Health & Educational Facility Authority, Connecticut Revenue Bond | 5.00 | 07/01/36 | 2,830,548 | |||||||
| 5,370,000 | Connecticut State Health & Educational Facility Authority, Connecticut Revenue Bond, Series Z-1 | 5.00 | 07/01/42 | 5,428,855 | |||||||
| 3,000,000 | State of Connecticut, Connecticut General Obligation Bond, Series A (b) | 1.35 | 03/01/24 | 2,910,900 | |||||||
| 2,125,000 | State of Connecticut, Connecticut General Obligation Bond, Series F | 5.00 | 12/01/21 | 2,191,449 | |||||||
| 1,000,000 | University of Connecticut, Connecticut Revenue Bond, Series A | 5.00 | 02/15/18 | 1,002,570 | |||||||
| 14,364,322 | |||||||||||
| Florida - 8.9% | |||||||||||
| 2,775,000 | County of Miami-Dade Transit System, Florida Revenue Bond | 5.00 | 07/01/32 | 2,990,978 | |||||||
| Principal | Security Description | Rate | Maturity | Value |
| $ | 1,145,000 | Highlands County Health Facilities Authority, Florida Revenue Bond, Series G | 5.13 | % | 11/15/22 | $ | 1,177,392 | ||||
| 2,000,000 | South Florida Water Management District, Florida Certificate of Participation | 5.00 | 10/01/20 | 2,044,740 | |||||||
| 675,000 | South Florida Water Management District, Florida Certificate of Participation | 5.00 | 10/01/36 | 690,100 | |||||||
| 2,675,000 | South Miami Health Facilities Authority, Florida Revenue Bond | 5.00 | 08/15/32 | 2,791,577 | |||||||
| 9,694,787 | |||||||||||
| Illinois - 12.5% | |||||||||||
| 500,000 | Chicago Park District, Illinois General Obligation Bond, Series A | 5.00 | 01/01/27 | 539,185 | |||||||
| 525,000 | Chicago Park District, Illinois General Obligation Bond, Series A | 5.50 | 01/01/33 | 604,937 | |||||||
| 980,000 | Chicago Park District, Illinois General Obligation Bond, Series A | 5.00 | 01/01/33 | 1,042,308 | |||||||
| 1,475,000 | Chicago Park District, Illinois General Obligation Bond, Series A | 5.75 | 01/01/38 | 1,731,281 | |||||||
| 1,975,000 | Chicago Park District, Illinois General Obligation Bond, Series A | 5.00 | 01/01/40 | 2,113,526 | |||||||
| 1,500,000 | Chicago Park District, Illinois General Obligation Bond, Series C | 5.00 | 01/01/27 | 1,626,975 | |||||||
| 900,000 | Chicago Park District, Illinois General Obligation Bond, Series C | 5.00 | 01/01/29 | 976,545 | |||||||
| 1,250,000 | Illinois Finance Authority, Illinois Revenue Bond | 5.00 | 07/01/46 | 1,317,087 | |||||||
| 525,000 | Illinois Finance Authority, Illinois Revenue Bond, Series D | 6.25 | 11/01/28 | 596,747 | |||||||
| Principal | Security Description | Rate | Maturity | Value |
| $ | 1,030,000 | University of Illinois, Illinois Revenue Bond, Series A | 5.13 | % | 04/01/36 | $ | 1,147,626 | ||||
| 900,000 | University of Illinois, Illinois Revenue Bond, Series A | 5.00 | 04/01/39 | 1,006,812 | |||||||
| 825,000 | Will Grundy Etc Counties Community College District No. 525, Illinois General Obligation Bond, Series B | 5.25 | 06/01/36 | 964,178 | |||||||
| 13,667,207 | |||||||||||
| Indiana - 2.0% | |||||||||||
| 1,950,000 | Indiana Finance Authority, Indiana Revenue Bond, Series A | 5.00 | 05/01/42 | 2,163,018 | |||||||
| Kansas - 1.8% | |||||||||||
| 2,000,000 | State of Kansas Department of Transportation, Kansas Revenue Bond, Series B-3 (b) | 0.53 | 09/01/17 | 1,992,680 | |||||||
| Maryland - 0.6% | |||||||||||
| 625,000 | Montgomery County Housing Opportunites Commission, Maryland Revenue Bond, Series C | 5.00 | 07/01/31 | 677,619 | |||||||
| Massachusetts - 1.1% | |||||||||||
| 1,130,000 | Massachusetts Housing Finance Agency, Massachusetts Revenue Bond, Series C | 5.00 | 12/01/30 | 1,190,240 | |||||||
| Michigan - 2.2% | |||||||||||
| 550,000 | Michigan State Building Authority, Michigan Revenue Bond, Series A | 5.20 | 10/15/31 | 640,299 | |||||||
| 1,760,000 | Michigan State Housing Development Authority, Michigan Revenue Bond, Series A | 5.15 | 10/01/29 | 1,769,082 | |||||||
| 2,409,381 | |||||||||||
| Principal | Security Description | Rate | Maturity | Value |
| Nebraska - 2.8% | ||||||||||
| $ | 3,050,000 | Douglas County School District No. 17, Nebraska General Obligation Bond | 3.00 | % | 06/15/16 | $ | 3,066,531 | |||
| Nevada - 6.3% | ||||||||||
| 3,100,000 | County of Clark Department of Aviation, Nevada Revenue Bond, Series D | 5.00 | 07/01/16 | 3,135,340 | ||||||
| 1,150,000 | County of Clark, Nevada General Obligation Bond | 4.75 | 11/01/30 | 1,154,209 | ||||||
| 2,375,000 | County of Clark, Nevada General Obligation Bond | 4.75 | 11/01/35 | 2,383,692 | ||||||
| 145,000 | Nevada Housing Division, Nevada Revenue Bond, Series A | 5.85 | 10/01/20 | 145,638 | ||||||
| 6,818,879 | ||||||||||
| New York - 5.1% | ||||||||||
| 1,000,000 | Metropolitan Transportation Authority, New York Revenue Bond, Series A | 5.00 | 11/15/31 | 1,028,390 | ||||||
| 1,000,000 | New York State Dormitory Authority, New York Revenue Bond | 5.00 | 08/01/17 | 1,009,320 | ||||||
| 1,725,000 | New York State Dormitory Authority, New York Revenue Bond | 5.00 | 07/01/30 | 1,744,734 | ||||||
| 50,000 | New York State Dormitory Authority, New York Revenue Bond, Series D | 5.75 | 02/15/19 | 50,223 | ||||||
| 1,410,000 | Schenectady Metroplex Development Authority, New York Revenue Bond, Series A | 5.50 | 08/01/33 | 1,685,514 | ||||||
| 5,518,181 | ||||||||||
| Ohio - 3.8% | ||||||||||
| 2,950,000 | American Municipal Power, Inc., Ohio Revenue Bond, Series B | 5.00 | 02/15/37 | 3,336,597 | ||||||
| 825,000 | Gallia County Local School District, Ohio General Obligation Bond | 5.00 | 12/01/30 | 831,328 | ||||||
| 4,167,925 | ||||||||||
| Principal | Security Description | Rate | Maturity | Value |
| Pennsylvania - 9.1% | |||||||||||
| $ | 7,500,000 | Pennsylvania Turnpike Commission, Pennsylvania Revenue Bond, Series A-2 (b) | 0.55 | % | 05/01/16 | $ | 7,499,925 | ||||
| 2,325,000 | Swarthmore Borough Authority, Pennsylvania Revenue Bond, Series A | 5.00 | 09/15/30 | 2,372,337 | |||||||
| 9,872,262 | |||||||||||
| Texas - 7.7% | |||||||||||
| 1,425,000 | City Public Service Board of San Antonio, Texas Revenue Bond | 5.00 | 02/01/32 | 1,477,183 | |||||||
| 1,600,000 | County of Harris, Texas Revenue Bond (b) | 1.08 | 08/15/35 | 1,424,768 | |||||||
| 1,000,000 | Eagle Mountain & Saginaw Independent School District, Texas General Obligation Bond | 4.50 | 08/15/33 | 1,013,170 | |||||||
| 1,375,000 | Lamar Consolidated Independent School District, Texas General Obligation Bond | 5.00 | 02/15/38 | 1,427,608 | |||||||
| 2,000,000 | Northside Independent School District, Texas General Obligation Bond | 5.00 | 06/15/35 | 2,018,780 | |||||||
| 1,000,000 | Red River Education Financing Corp., Texas Revenue Bond | 5.00 | 03/15/38 | 1,041,660 | |||||||
| 8,403,169 | |||||||||||
| Washington - 5.3% | |||||||||||
| 1,715,000 | Central Puget Sound Regional Transit Authority, Washington Revenue Bond | 4.75 | 02/01/28 | 1,788,831 | |||||||
| 2,000,000 | City of Seattle Drainage & Wastewater Revenue, Washington Revenue Bond | 5.00 | 06/01/38 | 2,164,060 | |||||||
| 1,455,000 | Everett Housing Authority, Washington Revenue Bond (b) | 4.89 | 06/01/37 | 1,489,469 | |||||||
| Principal | Security Description | Rate | Maturity | Value |
| $ | 250,000 | State of Washington, Washington Certificate of Participation, Series D | 5.45 | % | 07/01/28 | $ | 276,357 | ||||
| 5,718,717 | |||||||||||
Total Municipal Bonds (Cost $101,585,065) | 104,456,564 |
| Shares | Security Description | Value |
| Money Market Fund - 3.2% | |||||||
| 3,452,996 | Fidelity Government Money Market Fund, 0.23% (b) (Cost $3,452,996) | 3,452,996 | |||||
Total Investments - 99.1% (Cost $105,038,061)* | $ | 107,909,560 |
| Other Assets & Liabilities, Net – 0.9% | 984,072 | ||
| Net Assets – 100.0% | $ | 108,893,632 |
| (a) | Zero coupon bond. Interest rate presented is yield to maturity. |
| (b) | Variable rate security. Rate presented is as of March 31, 2016. |
* Cost for federal income tax purposes is substantially the same as for financial statement purposes and net unrealized appreciation consists of:
| Gross Unrealized Appreciation | $ | 2,881,552 | ||
| Gross Unrealized Depreciation | (10,053 | ) | ||
| Net Unrealized Appreciation | $ | 2,871,499 |
The inputs or methodology used for valuing securities are not necessarily an indication of the risks associated with investing in those securities. For more information on valuation inputs, and their aggregation into the levels used in the table below, please refer to the Security Valuation section in Note 2 of the accompanying Notes to Financial Statements.
The following is a summary of the inputs used to value the Fund's investments as of March 31, 2016.
| Valuation Inputs | Investments in Securities |
| Level 1 - Quoted Prices | $ | - | ||
| Level 2 - Other Significant Observable Inputs | 107,909,560 | |||
| Level 3 - Significant Unobservable Inputs | - | |||
| Total | $ | 107,909,560 |
The Level 2 value displayed in this table includes Municipal Bonds and a Money Market Fund. Refer to this Schedule of Investments for a further breakout of each Municipal Bond security by state.
The Fund utilizes the end of period methodology when determining transfers. There were no transfers among Level 1, Level 2 and Level 3 for the period ended March 31, 2016.
AFA
| PORTFOLIO HOLDINGS | ||
| % of Total Investments | ||
| Municipal Bonds | 96.8 | % |
| Money Market Fund | 3.2 | % |
| 100.0 | % |
| ASSETS | ||||||
| Total investments, at value (Cost $105,038,061) | $ | 107,909,560 | ||||
| Receivables: | ||||||
| Dividends and interest | 1,136,351 | |||||
| Prepaid expenses | 9,972 | |||||
| Total Assets | 109,055,883 | |||||
| LIABILITIES | ||||||
| Payables: | ||||||
| Fund shares redeemed | 64,609 | |||||
| Distributions payable | 17,328 | |||||
| Accrued Liabilities: | ||||||
| Investment adviser fees | 35,021 | |||||
| Trustees' fees and expenses | 1,591 | |||||
| Fund services fees | 11,685 | |||||
| Other expenses | 32,017 | |||||
| Total Liabilities | 162,251 | |||||
| NET ASSETS | $ | 108,893,632 | ||||
| COMPONENTS OF NET ASSETS | ||||||
| Paid-in capital | $ | 105,813,075 | ||||
| Accumulated net realized gain | 209,058 | |||||
| Net unrealized appreciation | 2,871,499 | |||||
| NET ASSETS | $ | 108,893,632 | ||||
| SHARES OF BENEFICIAL INTEREST AT NO PAR VALUE (UNLIMITED SHARES AUTHORIZED) | 10,789,287 | |||||
| NET ASSET VALUE, OFFERING AND REDEMPTION PRICE PER SHARE | $ | 10.09 | ||||
| INVESTMENT INCOME | |||||||
| Dividend income | . | $ | 5,677 | ||||
| Interest income | 1,307,601 | ||||||
| Total Investment Income | 1,313,278 | ||||||
| EXPENSES | |||||||
| Investment adviser fees | 232,942 | ||||||
| Fund services fees | 70,679 | ||||||
| Non 12b-1 shareholder servicing fees | 10,251 | ||||||
| Custodian fees | 5,281 | ||||||
| Registration fees | 8,158 | ||||||
| Professional fees | 26,519 | ||||||
| Trustees' fees and expenses | 6,964 | ||||||
| Offering costs | 5,655 | ||||||
| Miscellaneous expenses | 24,671 | ||||||
| Total Expenses | 391,120 | ||||||
| Fees waived and expenses reimbursed | (80,531 | ) | |||||
| Net Expenses | 310,589 | ||||||
| NET INVESTMENT INCOME | 1,002,689 | ||||||
| NET REALIZED AND UNREALIZED GAIN (LOSS) | |||||||
| Net realized gain on investments | 225,169 | ||||||
| Net change in unrealized appreciation (depreciation) on investments | 614,902 | ||||||
| NET REALIZED AND UNREALIZED GAIN | 840,071 | ||||||
| INCREASE IN NET ASSETS RESULTING FROM OPERATIONS | $ | 1,842,760 | |||||
* | |||||||||||
For the Six Months Ended March 31, 2016 | November 3, 2014* through September 30, 2015 | ||||||||||
| OPERATIONS | |||||||||||
| Net investment income | $ | 1,002,689 | $ | 1,301,681 | |||||||
| Net realized gain (loss) | 225,169 | (16,111 | ) | ||||||||
| Net change in unrealized appreciation (depreciation) | 614,902 | 171,293 | |||||||||
| Increase in Net Assets Resulting from Operations | 1,842,760 | 1,456,863 | |||||||||
| DISTRIBUTIONS TO SHAREHOLDERS FROM | |||||||||||
| Net investment income | (1,002,694 | ) | (1,301,676 | ) | |||||||
| Total Distributions to Shareholders | (1,002,694 | ) | (1,301,676 | ) | |||||||
| CAPITAL SHARE TRANSACTIONS | |||||||||||
| Sale of shares | 20,169,035 | 106,706,244 | |||||||||
| Reinvestment of distributions | 895,653 | 1,136,510 | |||||||||
| Redemption of shares | (4,742,939 | ) | (16,266,124 | ) | |||||||
| Increase in Net Assets from Capital Share Transactions | 16,321,749 | 91,576,630 | |||||||||
| Increase in Net Assets | 17,161,815 | 91,731,817 | |||||||||
| NET ASSETS | |||||||||||
| Beginning of Period | 91,731,817 | - | |||||||||
| End of Period (Including line (a)) | $ | 108,893,632 | $ | 91,731,817 | |||||||
| SHARE TRANSACTIONS | |||||||||||
| Sale of shares | 2,009,124 | 10,678,702 | |||||||||
| Reinvestment of distributions | 88,961 | 113,588 | |||||||||
| Redemption of shares | (472,207 | ) | (1,628,881 | ) | |||||||
| Increase in Shares | 1,625,878 | 9,163,409 | |||||||||
| (a) | Undistributed net investment income | $ | - | $ | 5 | ||||||
| * | Commencement of operations. | ||||||||||
| These financial highlights reflect selected data for a share outstanding throughout each period. | |||||||||
| For the Six Months Ended March 31, 2016 | November 3, 2014 (a) through September 30, 2015 | ||||||||
| INSTITUTIONAL CLASS | |||||||||
| NET ASSET VALUE, Beginning of Period | $ | 10.01 | $ | 10.00 | |||||
| INVESTMENT OPERATIONS | |||||||||
| Net investment income (b) | 0.10 | 0.20 | |||||||
| Net realized and unrealized gain (loss) | 0.08 | 0.02 | |||||||
| Total from Investment Operations | 0.18 | 0.22 | |||||||
| DISTRIBUTIONS TO SHAREHOLDERS FROM | |||||||||
| Net investment income | (0.10 | ) | (0.21 | ) | |||||
| NET ASSET VALUE, End of Period | $ | 10.09 | $ | 10.01 | |||||
| TOTAL RETURN | 1.78 | %(c) | 2.18 | %(c) | |||||
| RATIOS/SUPPLEMENTARY DATA | |||||||||
| Net Assets at End of Period (000's omitted) | $108,894 | $91,732 | |||||||
| Ratios to Average Net Assets: | |||||||||
| Net investment income | 1.94 | %(d) | 2.21 | %(d) | |||||
| Net expenses | 0.60 | %(d) | 0.60 | %(d) | |||||
| Gross expenses (e) | 0.76 | %(d) | 0.93 | %(d) | |||||
| PORTFOLIO TURNOVER RATE | 35 | %(c) | 32 | %(c) | |||||
| (a) | Commencement of operations. | ||||||||
| (b) | Calculated based on average shares outstanding during each period. | ||||||||
| (c) | Not annualized. | ||||||||
| (d) | Annualized. | ||||||||
| (e) | Reflects the expense ratio excluding any waivers and/or reimbursements. | ||||||||
Dear Shareholders:
While uncertainty regarding the future path of interest rate hikes has continued to inundate the Federal Reserve's commentary, we have sustained a consistent theme in our management of the Gurtin National Municipal Value Fund and the Gurtin California Municipal Value Fund (the Gurtin Value Funds): Our strict adherence to our disciplined investment approach of opportunistically deploying capital only as attractive investments become available.
Given that bonds meeting our targets have been in shorter supply over the past six months as interest rates have continued to fall and spreads have continued to narrow, we have chosen to remain conservatively positioned in our management of the Gurtin Value Funds, with the belief that the current lack of absolute value in the market is temporary, and the knowledge that in general, municipal yields rise and spreads widen when Treasury yields rise, and municipal yields and spreads narrow when Treasury yields fall. As we patiently wait for the mirror image of the current market – namely, rising yields and widening spreads – we are:
| · | Maintaining our discipline |
We continue to maintain our discipline of only extending duration for high quality bonds meeting our yield targets in order to potentially maximize risk-adjusted, long-term income. As nimble, contrarian investors with conservatively short positioning in the current investment environment, we remain poised to take advantage of opportunities to buy in the event of increased market volatility, rising interest rates, or widening credit spreads.
| · | Purchasing shorter duration structures |
In the final quarter of 2015, we had the opportunity to exploit idiosyncratic mispriced credits with attractive yields and longer duration. Given the more limited nature of opportunities seen in the first quarter of 2016, we will continue this approach when possible, while also purchasing shorter duration structures, rather than extending duration to buy lower yielding bonds that do not provide appropriate compensation for the extension risk assumed. This approach will allow us to reinvest opportunistically in the event that yields rise and spreads widen.
| · | Increasing swappable cash equivalents |
Long-term municipal yields have continued a downward trend despite the Federal Reserve's decision to raise rates by 25 basis points to a target range between 0.25% and 0.5% on Dec. 16, 2015. This has contributed to our decision to increase our swappable cash equivalents, which will increase cash availability when opportunities do arise in a rising yield and widening spread environment.
We believe that our conservative positioning enables us to remain nimble, and look forward to being able to deploy available cash and swap out of cash equivalents and into higher yielding investments as opportunities arise.
Sincerely,
William R. Gurtin
CEO, CIO, Managing Partner
Gurtin Fixed Income Management, LLC
CEO, CIO, Managing Partner
Gurtin Fixed Income Management, LLC
Important Information:
There can be no guarantee that any strategy (risk management) or otherwise will be successful. All investing involves risk, including the potential loss of principal.
Bonds: Investing in the bond market is subject to certain risks including market, interest-rate, issuer, credit and inflation risk; investments may be worth more or less than the original cost when redeemed. Income from municipal bonds may be subject to state and local taxes and at times the alternative minimum tax; a strategy concentrating in a single or limited number of states is subject to greater risk of adverse economic conditions and regulatory changes. The value of most bond funds and fixed income securities is impacted by changes in interest rates. Bonds and bond funds with longer durations tend to be more sensitive and more volatile than securities with shorter durations; bond prices generally fall as interest rates rise. Credit risk refers to an issuer's ability to make interest and principal payments when due.
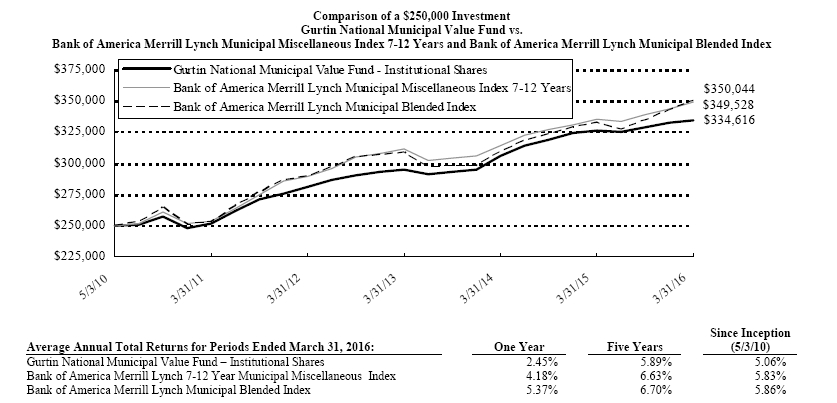
The following chart reflects the change in the value of a hypothetical $250,000 investment in Institutional Shares, including reinvested dividends and distributions, in Gurtin California Municipal Value Fund (the "Fund") compared with the performance of the benchmark, Bank of America Merrill Lynch Municipal Miscellaneous Index 7-12 Years ("BAML Muni Misc 7-12") and the Bank of America Merrill Lynch Municipal Blended Index ("BAML Muni Blended"), since inception. The BAML Muni Misc 7-12 was formerly known as the Merrill Lynch Municipal Miscellaneous 7-12 Years Index and measures the performance of municipal securities with a remaining term to final maturity greater than or equal to 7 years and less than 12 years. The BAML Muni Blended is a blend of 75% of The Bank of America Merrill Lynch 7-12 Year US Large Cap Municipal Securities Index, a subset of the Bank of America Merrill Lynch US Large Cap Municipal Securities Index including all securities with a remaining term to final maturity greater than or equal to 7 years and less than 12 years, and 25% of the Bank of America Merrill Lynch 12-22 Year US Large Cap Municipal Securities Index, a subset of the Bank of America Merrill Lynch US Large Cap Municipal Securities Index including all securities with a remaining term to final maturity greater than or equal to 12 years and less than 22 years. The total returns of both the BAML Muni Misc 7-12 and the BAML Muni Blended includes the reinvestment of dividends and income. The total return of the Fund includes operating expenses that reduce returns, while the total returns of the BAML Muni Misc 7-12 and the BAML Muni Blended does not include expenses. The Fund is professionally managed while the BAML Muni Misc 7-12 and the BAML Muni Blended are unmanaged and are not available for investment.
Performance data quoted represents past performance and is no guarantee of future results. Current performance may be lower or higher than the performance data quoted. Investment return and principal value will fluctuate so that shares, when redeemed, may be worth more or less than original cost. For the most recent month-end performance, please call (844) 342-5763. As stated in the Fund's current prospectus, the annual operating expense ratio (gross) is 0.79%. However, the Fund's adviser has contractually agreed to waive its fee and/or reimburse expenses to limit total operating expenses (excluding all taxes, interest, portfolio transaction expenses, acquired fund fees and expenses, proxy expenses and extraordinary expenses) to 0.60%, through January 28, 2017. During the period, certain fees were waived and/or expenses reimbursed; otherwise, returns would have been lower. The performance table and graph do not reflect the deduction of taxes that a shareholder would pay on Fund distributions or the redemption of Fund shares. Returns greater than one year are annualized.
| Principal | Security Description | Rate | Maturity | Value |
| Municipal Bonds - 99.1% | ||||||||||
| California - 90.9% | ||||||||||
| $ | 1,000,000 | Abag Finance Authority for Nonprofit Corps, California Revenue Bond | 5.00 | % | 01/01/33 | $ | 1,169,610 | |||
| 1,160,000 | Alameda Public Financing Authority, California Revenue Bond, Series A | 5.25 | 07/01/29 | 1,325,567 | ||||||
| 5,000,000 | Bay Area Toll Authority, California Revenue Bond, Series A (a) | 1.00 | 04/01/47 | 5,011,350 | ||||||
| 290,000 | Bret Harte Union High School District, California Certificate of Participation | 4.25 | 09/01/20 | 294,193 | ||||||
| 1,675,000 | California Health Facilities Financing Authority, California Revenue Bond | 5.00 | 07/01/36 | 1,694,346 | ||||||
| 700,000 | California Infrastructure & Economic Development Bank, California Revenue Bond | 5.00 | 08/15/23 | 766,311 | ||||||
| 500,000 | California Infrastructure & Economic Development Bank, California Revenue Bond | 5.75 | 08/15/29 | 581,025 | ||||||
| 3,465,000 | California Infrastructure & Economic Development Bank, California Revenue Bond, Series A2 (a) | 0.68 | 10/01/47 | 3,464,931 | ||||||
| 500,000 | California State Public Works Board, California Revenue Bond, Series B | 6.00 | 04/01/27 | 577,610 | ||||||
| 500,000 | California State Public Works Board, California Revenue Bond, Series B1 | 5.40 | 03/01/26 | 577,495 | ||||||
| 500,000 | California State Public Works Board, California Revenue Bond, Series G | 5.00 | 11/01/31 | 512,880 | ||||||
| Principal | Security Description | Rate | Maturity | Value |
| $ | 4,100,000 | California State Public Works Board, California Revenue Bond, Series G | 5.00 | % | 11/01/37 | $ | 4,772,646 | |||
| 1,000,000 | California State Public Works Board, California Revenue Bond, Series G1 | 5.75 | 10/01/30 | 1,162,220 | ||||||
| 600,000 | California State Public Works Board, California Revenue Bond, Series I-1 | 6.13 | 11/01/29 | 712,356 | ||||||
| 1,000,000 | Centinela Valley Union High School District, California General Obligation Bond, Series B | 5.75 | 08/01/30 | 1,284,460 | ||||||
| 1,910,000 | Centinela Valley Union High School District, California General Obligation Bond, Series B | 5.75 | 08/01/33 | 2,427,591 | ||||||
| 7,790,000 | Chabot-Las Positas Community College District, California General Obligation Bond, Series C (b) | 4.92 | 08/01/36 | 2,838,053 | ||||||
| 1,000,000 | Chino Valley Unified School District, California General Obligation Bond (b) | 5.85 | 08/01/26 | 620,330 | ||||||
| 3,000,000 | Chino Valley Unified School District, California General Obligation Bond (b) | 4.62 | 08/01/29 | 1,607,550 | ||||||
| 4,260,000 | City & County of San Francisco, California Certificate of Participation, Series B | 5.00 | 09/01/16 | 4,341,068 | ||||||
| 2,000,000 | City of Fairfield, California Certificate of Participation, Series A (b) | 6.55 | 04/01/30 | 1,185,620 | ||||||
| 1,000,000 | City of Fresno CA Water System, California Revenue Bond, Series A | 5.25 | 06/01/18 | 1,004,190 | ||||||
| 1,690,000 | City of Vallejo Water Revenue, California Revenue Bond | 5.00 | 05/01/18 | 1,696,236 |
| Principal | Security Description | Rate | Maturity | Value |
| $ | 2,575,000 | Coachella Valley Unified School District, California General Obligation Bond, Series D | 5.00 | % | 08/01/37 | $ | 3,002,321 | |||
| 250,000 | Corona Public Financing Authority, California Revenue Bond, Series C | 5.00 | 09/01/21 | 254,613 | ||||||
| 1,400,000 | County of San Bernardino, California Certificate of Participation, Series C | 5.00 | 08/01/28 | 1,404,074 | ||||||
| 1,275,000 | County of San Bernardino, California Certificate of Participation, Series C | 4.75 | 08/01/28 | 1,279,934 | ||||||
| 2,835,000 | Dublin Unified School District, California General Obligation Bond, Series D (b) | 5.73 | 08/01/34 | 1,042,259 | ||||||
| 1,500,000 | Elk Grove Finance Authority, California Special Tax Bond | 5.00 | 09/01/38 | 1,721,925 | ||||||
| 1,600,000 | Fresno Unified School District, California General Obligation Bond, Series G (b) | 6.10 | 08/01/41 | 355,824 | ||||||
| 6,250,000 | Golden Empire Schools Financing Authority, California Revenue Bond (a) | 0.60 | 05/01/16 | 6,248,500 | ||||||
| 125,000 | Golden State Tobacco Securitization Corp., California Revenue Bond, Series A | 4.60 | 06/01/23 | 133,589 | ||||||
| 1,000,000 | Los Angeles Community Redevelopment Agency, California Revenue Bond | 5.00 | 09/01/37 | 1,003,430 | ||||||
| 2,500,000 | Los Angeles County Regional Financing Authority, California Revenue Bond, Series B-1 | 3.00 | 11/15/21 | 2,505,625 |
| Principal | Security Description | Rate | Maturity | Value |
| $ | 1,050,000 | Los Angeles County Schools Regionalized Business Services Corp., California Certificate of Participation, Series B | 4.75 | % | 06/01/27 | $ | 1,100,809 | |||
| 5,140,000 | Los Angeles Department of Water & Power, California Revenue Bond, Series A-1 | 5.00 | 07/01/39 | 5,407,280 | ||||||
| 6,000,000 | Los Angeles Department of Water, California Revenue Bond | 5.00 | 07/01/38 | 6,294,600 | ||||||
| 4,900,000 | Los Angeles Department of Water, California Revenue Bond, Series A2 | 5.00 | 07/01/35 | 4,957,869 | ||||||
| 2,000,000 | Los Angeles Municipal Improvement Corp., California Revenue Bond | 5.00 | 08/01/23 | 2,007,700 | ||||||
| 2,750,000 | Los Angeles Unified School District, California General Obligation Bond, Series B | 4.75 | 07/01/21 | 2,780,057 | ||||||
| 8,575,000 | Metropolitan Water District of Southern California, California Revenue Bond | 5.00 | 07/01/37 | 9,018,156 | ||||||
| 5,000,000 | Metropolitan Water District of Southern California, California Revenue Bond, Series A4 (a) | 0.78 | 07/01/36 | 4,980,300 | ||||||
| 2,175,000 | Metropolitan Water District of Southern California, California Revenue Bond, Series C | 5.00 | 07/01/32 | 2,199,838 | ||||||
| 1,000,000 | Metropolitan Water District of Southern California, California Revenue Bond, Series C | 5.00 | 07/01/35 | 1,010,990 |
| Principal | Security Description | Rate | Maturity | Value |
| $ | 3,185,000 | Modesto Irrigation District Financing Authority, California Revenue Bond (a) | 1.01 | % | 09/01/27 | $ | 3,062,983 | |||
| 1,600,000 | Modesto Irrigation District Financing Authority, California Revenue Bond (a) | 1.06 | 09/01/37 | 1,435,072 | ||||||
| 1,500,000 | New Haven Unified School District, California General Obligation Bond, Series A (b) | 5.05 | 08/01/24 | 981,735 | ||||||
| 1,785,000 | New Haven Unified School District, California General Obligation Bond, Series A (b) | 5.20 | 08/01/27 | 986,123 | ||||||
| 5,625,000 | Northern California Transmission Agency, California Revenue Bond (a) | 0.98 | 05/01/24 | 5,617,969 | ||||||
| 2,650,000 | Oakland Unified School District/Alameda County, California General Obligation Bond | 6.63 | 08/01/38 | 3,233,238 | ||||||
| 770,000 | Oxnard School District, California General Obligation Bond, Series A | 5.75 | 08/01/30 | 952,683 | ||||||
| 3,000,000 | Pleasanton-Suisun City Home Financing Authority, California Revenue Bond (b) | 0.46 | 10/01/16 | 2,991,930 | ||||||
| 2,500,000 | Port of Oakland, California Revenue Bond, Series P | 5.00 | 05/01/33 | 2,822,025 | ||||||
| 5,120,000 | Regents of the University of California Medical Center Pooled Revenue, California Revenue Bond, Series C2 (a) | 1.15 | 05/15/43 | 4,418,765 | ||||||
| 1,690,000 | Riverside County Asset Leasing Corp., California General Obligation Bond | 5.00 | 06/01/16 | 1,703,013 |
| Principal | Security Description | Rate | Maturity | Value |
| $ | 7,575,000 | Sacramento County Sanitation Districts Financing Authority, California Revenue Bond, Series B (a) | 0.96 | % | 12/01/35 | $ | 7,004,299 | |||
| 2,000,000 | Sacramento County Water Financing Authority, California Revenue Bond, Series B (a) | 0.98 | 06/01/34 | 1,857,680 | ||||||
| 5,475,000 | San Bernardino City Unified School District, California General Obligation Bond, Series C | 5.00 | 08/01/40 | 6,368,082 | ||||||
| 2,000,000 | San Bernardino Community College District, California General Obligation Bond, Series C | 5.00 | 08/01/31 | 2,030,420 | ||||||
| 135,000 | San Bernardino Municipal Water Department, California Certificate of Participation | 5.00 | 02/01/17 | 135,416 | ||||||
| 1,000,000 | San Diego Public Facilities Financing Authority, California Revenue Bond, Series A | 5.25 | 04/15/29 | 1,163,250 | ||||||
| 2,715,000 | San Diego Regional Building Authority, California Revenue Bond, Series A | 4.00 | 10/15/16 | 2,766,395 | ||||||
| 2,500,000 | San Jose Redevelopment Agency, California Tax Allocation Bond, Series D | 5.00 | 08/01/21 | 2,629,975 | ||||||
| 2,275,000 | San Jose Unified School District, California General Obligation Bond, Series D | 5.00 | 08/01/32 | 2,500,430 | ||||||
| 1,000,000 | San Mateo Union High School District, California General Obligation Bond, Series A (b) | 6.01 | 09/01/25 | 716,210 | ||||||
| 2,355,000 | Sierra View Local Health Care District, California Revenue Bond | 5.25 | 07/01/37 | 2,490,224 |
| Principal | Security Description | Rate | Maturity | Value |
| $ | 1,000,000 | Southern California Public Power, California Revenue Bond | 5.00 | % | 07/01/16 | $ | 1,011,500 | ||||
| 5,000 | State of California, California General Obligation Bond | 5.00 | 10/01/28 | 5,020 | |||||||
| 3,350,000 | State of California, California General Obligation Bond | 5.00 | 11/01/37 | 3,572,004 | |||||||
| 85,000 | State of California, California General Obligation Bond, Series 2007 | 5.75 | 05/01/30 | 85,371 | |||||||
| 135,000 | State of California, General Obligation Bond, Series 07 | 5.13 | 10/01/27 | 135,552 | |||||||
| 3,300,000 | Stockton East Water District, California Certificate of Participation, Series B (b) | 5.96-6.00 | 04/01/21 | 2,457,840 | |||||||
| 2,000,000 | Stockton East Water District, California Certificate of Participation, Series B (b) | 6.08 | 04/01/25 | 1,166,880 | |||||||
| 775,000 | Stockton Unified School District, California General Obligation Bond | 5.00 | 07/01/27 | 924,250 | |||||||
| 1,600,000 | Tulare County Board of Education, California Certificate of Participation | 5.38 | 05/01/33 | 1,879,296 | |||||||
| 1,000,000 | University of California, California Revenue Bond | 5.00 | 05/15/41 | 1,015,410 | |||||||
| 250,000 | Victor Valley Community College District, California General Obligation Bond, Series A | 5.38 | 08/01/29 | 285,163 | |||||||
| 168,743,534 | |||||||||||
| Illinois - 8.2% | |||||||||||
| 1,000,000 | Chicago Park District, Illinois General Obligation Bond, Series A | 5.00 | 01/01/30 | 1,104,570 | |||||||
| 1,000,000 | Chicago Park District, Illinois General Obligation Bond, Series A | 5.00 | 01/01/35 | 1,081,240 | |||||||
| Principal | Security Description | Rate | Maturity | Value |
| $ | 2,325,000 | Chicago Park District, Illinois General Obligation Bond, Series A | 5.00 | % | 01/01/40 | $ | 2,488,075 | ||||
| 1,755,000 | Chicago Park District, Illinois General Obligation Bond, Series B | 5.00 | 01/01/26 | 1,984,379 | |||||||
| 1,000,000 | Chicago Park District, Illinois General Obligation Bond, Series B | 5.00 | 01/01/26 | 1,130,700 | |||||||
| 1,580,000 | Chicago Park District, Illinois General Obligation Bond, Series C | 5.00 | 01/01/23 | 1,769,600 | |||||||
| 1,600,000 | Chicago Park District, Illinois General Obligation Bond, Series C | 5.25 | 01/01/37 | 1,743,392 | |||||||
| 3,580,000 | Chicago Park District, Illinois General Obligation Bond, Series C | 5.25 | 01/01/40 | 3,884,407 | |||||||
| 15,186,363 | |||||||||||
Total Municipal Bonds (Cost $177,140,582) | 183,929,897 |
| Shares | Security Description | Value |
| Money Market Fund - 0.2% | |||||||
| 420,993 | Fidelity Government Money Market Fund, 0.23% (a) (Cost $420,993) | 420,993 | |||||
Total Investments - 99.3% (Cost $177,561,575)* | $ | 184,350,890 |
| Other Assets & Liabilities, Net – 0.7% | 1,250,724 | ||
| Net Assets – 100.0% | $ | 185,601,614 |
| (a) | Variable rate security. Rate presented is as of March 31, 2016. |
| (b) | Zero coupon bond. Interest rate presented is yield to maturity. |
* Cost for federal income tax purposes is substantially the same as for financial statement purposes and net unrealized appreciation consists of:
| Gross Unrealized Appreciation | $ | 6,961,711 | ||
| Gross Unrealized Depreciation | (172,396 | ) | ||
| Net Unrealized Appreciation | $ | 6,789,315 |
The inputs or methodology used for valuing securities are not necessarily an indication of the risks associated with investing in those securities. For more information on valuation inputs, and their aggregation into the levels used in the table below, please refer to the Security Valuation section in Note 2 of the accompanying Notes to Financial Statements.
The following is a summary of the inputs used to value the Fund's investments as of March 31, 2016.
| Valuation Inputs | Investments in Securities |
| Level 1 - Quoted Prices | $ | - | ||
| Level 2 - Other Significant Observable Inputs | 184,350,890 | |||
| Level 3 - Significant Unobservable Inputs | - | |||
| Total | $ | 184,350,890 |
The Level 2 value displayed in this table includes Municipal Bonds and a Money Market Fund. Refer to this Schedule of Investments for a further breakout of each Municipal Bond security by state.
The Fund utilizes the end of period methodology when determining transfers. There were no transfers among Level 1, Level 2 and Level 3 for the period ended March 31, 2016.
AFA
| PORTFOLIO HOLDINGS | ||
| % of Total Investments | ||
| Municipal Bonds | 99.8 | % |
| Money Market Fund | 0.2 | % |
| 100.0 | % |
| ASSETS | ||||||
| Total investments, at value (Cost $177,561,575) | $ | 184,350,890 | ||||
| Receivables: | ||||||
| Dividends and interest | 1,479,994 | |||||
| Prepaid expenses | 1,085 | |||||
| Total Assets | 185,831,969 | |||||
| LIABILITIES | ||||||
| Payables: | ||||||
| Fund shares redeemed | 81,844 | |||||
| Distributions payable | 17,307 | |||||
| Accrued Liabilities: | ||||||
| Investment adviser fees | 68,179 | |||||
| Trustees' fees and expenses | 2,996 | |||||
| Fund services fees | 14,649 | |||||
| Other expenses | 45,380 | |||||
| Total Liabilities | 230,355 | |||||
| NET ASSETS | $ | 185,601,614 | ||||
| COMPONENTS OF NET ASSETS | ||||||
| Paid-in capital | $ | 178,602,028 | ||||
| Accumulated net realized gain | 210,271 | |||||
| Net unrealized appreciation | 6,789,315 | |||||
| NET ASSETS | $ | 185,601,614 | ||||
| SHARES OF BENEFICIAL INTEREST AT NO PAR VALUE (UNLIMITED SHARES AUTHORIZED) | 18,254,522 | |||||
| NET ASSET VALUE, OFFERING AND REDEMPTION PRICE PER SHARE | $ | 10.17 | ||||
| INVESTMENT INCOME | |||||||
| Dividend income | . | $ | 4,745 | ||||
| Interest income | 2,388,568 | ||||||
| Total Investment Income | 2,393,313 | ||||||
| EXPENSES | |||||||
| Investment adviser fees | 397,318 | ||||||
| Fund services fees | 102,908 | ||||||
| Non 12b-1 shareholder servicing fees | 22,489 | ||||||
| Custodian fees | 9,226 | ||||||
| Registration fees | 2,637 | ||||||
| Professional fees | 32,221 | ||||||
| Trustees' fees and expenses | 11,296 | ||||||
| Offering costs | 5,079 | ||||||
| Miscellaneous expenses | 34,034 | ||||||
| Total Expenses | 617,208 | ||||||
| Fees waived and expenses reimbursed | (87,453 | ) | |||||
| Net Expenses | 529,755 | ||||||
| NET INVESTMENT INCOME | 1,863,558 | ||||||
| NET REALIZED AND UNREALIZED GAIN (LOSS) | |||||||
| Net realized gain on investments | 297,613 | ||||||
| Net change in unrealized appreciation (depreciation) on investments | 1,553,708 | ||||||
| NET REALIZED AND UNREALIZED GAIN | 1,851,321 | ||||||
| INCREASE IN NET ASSETS RESULTING FROM OPERATIONS | $ | 3,714,879 | |||||
For the Six Months Ended March 31, 2016 | November 3, 2014* through September 30, 2015 | ||||||||||
| OPERATIONS | |||||||||||
| Net investment income | $ | 1,863,558 | $ | 2,313,780 | |||||||
| Net realized gain (loss) | 297,613 | (87,342 | ) | ||||||||
| Net change in unrealized appreciation (depreciation) | 1,553,708 | 830,284 | |||||||||
| Increase in Net Assets Resulting from Operations | 3,714,879 | 3,056,722 | |||||||||
| DISTRIBUTIONS TO SHAREHOLDERS FROM | |||||||||||
| Net investment income | (1,863,575 | ) | (2,313,763 | ) | |||||||
| Total Distributions to Shareholders | (1,863,575 | ) | (2,313,763 | ) | |||||||
| CAPITAL SHARE TRANSACTIONS | |||||||||||
| Sale of shares | 24,677,799 | 181,959,715 | |||||||||
| Reinvestment of distributions | 1,751,177 | 2,119,555 | |||||||||
| Redemption of shares | (5,143,793 | ) | (22,357,102 | ) | |||||||
| Increase in Net Assets from Capital Share Transactions | 21,285,183 | 161,722,168 | |||||||||
| Increase in Net Assets | 23,136,487 | 162,465,127 | |||||||||
| NET ASSETS | |||||||||||
| Beginning of Period | 162,465,127 | - | |||||||||
| End of Period (Including line (a)) | $ | 185,601,614 | $ | 162,465,127 | |||||||
| SHARE TRANSACTIONS | |||||||||||
| Sale of shares | 2,441,463 | 18,169,038 | |||||||||
| Reinvestment of distributions | 172,799 | 211,373 | |||||||||
| Redemption of shares | (508,109 | ) | (2,232,042 | ) | |||||||
| Increase in Shares | 2,106,153 | 16,148,369 | |||||||||
| (a) | Undistributed net investment income | $ | - | $ | 17 | ||||||
| * | Commencement of operations. | ||||||||||
These financial highlights reflect selected data for a share outstanding throughout each period. | |||||||||
| For the Six Months Ended March 31, 2016 | November 3, 2014 (a) through September 30, 2015 | ||||||||
| INSTITUTIONAL CLASS | |||||||||
| NET ASSET VALUE, Beginning of Period | $ | 10.06 | $ | 10.00 | |||||
| INVESTMENT OPERATIONS | |||||||||
| Net investment income (b) | 0.11 | 0.19 | |||||||
| Net realized and unrealized gain (loss) | 0.11 | 0.07 | |||||||
| Total from Investment Operations | 0.22 | 0.26 | |||||||
| DISTRIBUTIONS TO SHAREHOLDERS FROM | |||||||||
| Net investment income | (0.11 | ) | (0.20 | ) | |||||
| NET ASSET VALUE, End of Period | $ | 10.17 | $ | 10.06 | |||||
| TOTAL RETURN | 2.17 | %(c) | 2.55 | %(c) | |||||
| RATIOS/SUPPLEMENTARY DATA | |||||||||
| Net Assets at End of Period (000's omitted) | $185,602 | $162,465 | |||||||
| Ratios to Average Net Assets: | |||||||||
| Net investment income | 2.11 | %(d) | 2.09 | %(d) | |||||
| Net expenses | 0.60 | %(d) | 0.60 | %(d) | |||||
| Gross expenses (e) | 0.70 | %(d) | 0.79 | %(d) | |||||
| PORTFOLIO TURNOVER RATE | 27 | %(c) | 83 | %(c) | |||||
| (a) | Commencement of operations. | ||||||||
| (b) | Calculated based on average shares outstanding during each period. | ||||||||
| (c) | Not annualized. | ||||||||
| (d) | Annualized. | ||||||||
| (e) | Reflects the expense ratio excluding any waivers and/or reimbursements. | ||||||||
Dear Shareholders:
We are pleased to present to you the first report for the Gurtin National Municipal Intermediate Value Fund and Gurtin California Municipal Intermediate Value Fund (the Gurtin Intermediate Value Funds). Having launched these funds in November 2015 with an objective of maximizing risk-adjusted long-term income while seeking to preserve capital and liquidity, we believe our ability to do so lies in our ability to execute on opportunistic purchases of generally misunderstood and mispriced municipal bond structures and high quality credits.
In looking back at the initial months of performance of the Gurtin Intermediate Value Funds, we are extremely pleased with our ability to get cash invested and identify opportunities to generate value in an environment of falling interest rates and narrowing spreads, even as money market funds – in which a significant portion of the funds was invested as we looked for higher yielding opportunities – were essentially earning zero at a yield of 0.34% as of Dec. 31, 2015.1 Notably, the Gurtin National Municipal Intermediate Value Fund and Gurtin California Municipal Intermediate Value Fund averaged 20.68% and 29.48% investment in money market funds, respectively, over the course of the funds' first month of operation as compared to the benchmark indexes, which were both more fully invested with less than 0.6% maturing in less than one year as of Dec. 31, 2015.2 Holding higher levels of cash in such a market environment could negatively affect funds, making it difficult to perform in line with the benchmark indexes. Yet, having diligently worked over the past five months to get initial cash invested, the Gurtin Intermediate Value Funds have performed almost in line with their benchmark indexes in spite of higher cash levels, while generating yields (income) in excess of those of the index yields, as shown below as of March 31, 2016.
Fund3 | Yield-to-Maturity4 at Market | Yield-to-Worst5 at Market | 30-Day SEC Yield (Subsidized/Unsubsidized) 6 | |||
| Gurtin National Municipal Intermediate Value Fund (GNMVX) | 2.37% | 1.76% | 1.79%/1.09% | |||
| Gurtin California Municipal Intermediate Value Fund (GCMVX) | 2.34% | 1.68% | 1.72%/0.22% | |||
Merrill Lynch 1-15 Year Blend Index7 | 2.22% | 1.53% | N/A | |||
| Merrill Lynch 1-12 Year Index | 1.82% | 1.35% | N/A |
Past performance does not guarantee future results. The performance data quoted represents past performance and current returns may be lower or higher. Share prices and investment returns fluctuate and an investor's shares may be worth more or less than original cost upon redemption. For performance data current to the most recent month-end please call (844) 342-5763. Returns for performance under one year are cumulative, not annualized. Short-term performance, in particular, is not a good indication of the fund's future performance, and an investment should not be made based solely on returns. Because of ongoing market volatility, fund performance may be subject to substantial short-term changes.
In our management of the Gurtin Intermediate Value Funds, we have taken advantage of a number of exploitable inefficiencies in the municipal market to help generate the above-market income levels noted above. In addition, we have been able to maximize risk-adjusted long-term income through the achievement of the following goals:
Bond structure optimization. By taking advantage of inefficiencies in the market due to mispriced structures and misunderstood credits, we were able to purchase what we identified as optimal bond structures at attractive levels
1 Source: Fidelity, data as of December 31, 2015.
2 Source: Merrill Lynch, data as of December 31, 2015. http://www.mlindex.ml.com/GISPublic/bin/IndexDistOlap.asp?AppCode=0&hdnDate=12/31/2015&txtSSCUSIP=U0T0
3 Data current as of 3/31/2016.
4 Yield-to-Maturity: Average anticipated rate of return for the portfolio's positions if held to maturity.
5 Yield-to-Worst: The average rate of return of the portfolio at current market prices, adjusting for optionality.
6 The 30-Day SEC Yield is computed under an SEC standardized formula based on net income earned over the past 30 days. It is a "subsidized" yield, which means it includes contractual expense reimbursements and it would be lower without those reimbursements. The Unsubsidized 30-Day SEC Yield is computed under an SEC standardized formula based on net income earned over the past 30 days. It excludes contractual expense reimbursements, resulting in a lower yield.
7 The Merrill Lynch 1-15 Year Blend is calculated as a 15%/85% blend of the Merrill Lynch 1-3 and 3-15 Year indices, respectively. The benchmarks reflect no deduction for fees, expenses or taxes. These indices track the performance of tax-exempt investment grade debt publicly issued by U.S. states and territories, and their political subdivisions, years remaining term to maturity. Bonds must have a fixed coupon schedule and an investment grade rating. You cannot invest directly into an index.
| · | without sacrificing the structural integrity of the fund. |
| · | Fund diversification. We did not overweight any particular credit for any reason, providing us with the diversification we desired, which included credit quality distribution, sector allocation, and duration distribution. |
| · | Opportunistic buying. Historically, when interest rates move higher, spreads tend to widen, creating opportunities to buy at more attractive levels. Over the past six months, in instances where such opportunities were presented, we were able to use our cash position to take advantage of them. |
We continue to anticipate opportunities and are eager to act when they are presented.
We believe the future is bright.
Sincerely,
William R. Gurtin
CEO, CIO, Managing Partner
Gurtin Fixed Income Management, LLC
CEO, CIO, Managing Partner
Gurtin Fixed Income Management, LLC
Important Information:
There can be no guarantee that any strategy (risk management) or otherwise will be successful. All investing involves risk, including the potential loss of principal. The Fund is newly formed. Investors in the Fund bear the risk that the Adviser may not be successful in implementing the Fund's investment strategy and the Fund may not achieve scale.
Bonds: Investing in the bond market is subject to certain risks including market, interest-rate, issuer, credit and inflation risk; investments may be worth more or less than the original cost when redeemed. Income from municipal bonds may be subject to state and local taxes and at times the alternative minimum tax; a strategy concentrating in a single or limited number of states is subject to greater risk of adverse economic conditions and regulatory changes. The value of most bond funds and fixed income securities are impacted by changes in interest rates. Bonds and bond funds with longer durations tend to be more sensitive and more volatile than securities with shorter durations; bond prices generally fall as interest rates rise. Credit risk refers to an issuers ability to make interest and principal payments when due.
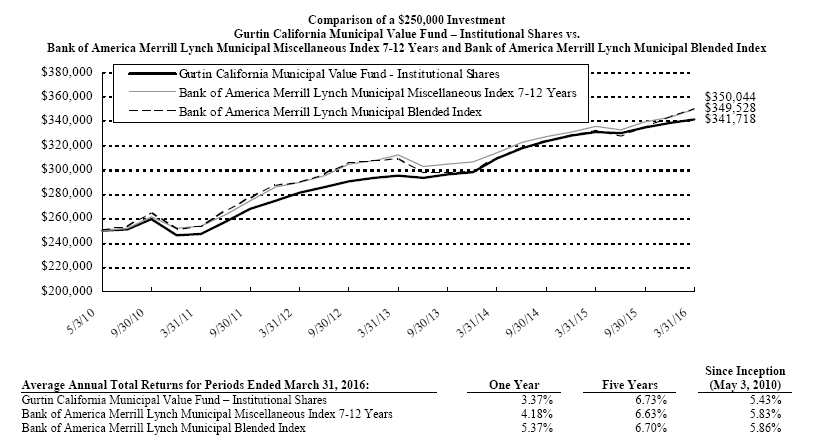
The following chart reflects the change in the value of a hypothetical $250,000 investment in Institutional Shares, including reinvested dividends and distributions, in Gurtin National Municipal Intermediate Value Fund (the "Fund") compared with the performance of the benchmark, Bank of America Merrill Lynch Municipal Blended 85% Index ("BAML Muni Blended 85%") and the Bank of America Merrill Lynch 1-12 Year Municipal Index ("BAML 1-2 Muni Index"), since inception. The BAML Muni Blended 85% is a blend of 85% of the Bank of America Merrill Lynch 3-15 Year US Municipal Securities Index, a subset of the Bank of America Merrill Lynch US Municipal Securities Index including all securities with a remaining term to final maturity greater than or equal to three years and less than twelve years, and 15% of the Bank of America Merrill Lynch 1-3 Year US Municipal Securities Index, a subset of the Bank of America Merrill Lynch US Municipal Securities Index including all securities with a remaining term to final maturity greater than or equal to one year and less than three years. BAML 1-12 Year Muni is an unmanaged, market-weighted index that includes investment-grade municipal bonds with maturities greater than one year but less than twelve years. The total returns of both the BAML Muni Blended 85% and the BAML Muni Index 1-12 includes the reinvestment of dividends and income. The total return of the Fund includes operating expenses that reduce returns, while the total returns of the BAML Muni Blended 85% and the BAML Muni Index 1-12 does not include expenses. The Fund is professionally managed while the BAML Muni Blended 85% and the BAML Muni Index 1-12 are unmanaged and are not available for investment.
Performance data quoted represents past performance and is no guarantee of future results. Current performance may be lower or higher than the performance data quoted. Investment return and principal value will fluctuate so that shares, when redeemed, may be worth more or less than original cost. For the most recent month-end performance, please call (844) 342-5763. As stated in the Fund's current prospectus, the annual operating expense ratio (gross) is 1.04%. However, the Fund's adviser has contractually agreed to waive its fee and/or reimburse expenses to limit total operating expenses(excluding all taxes, interest, portfolio transaction expenses, acquired fund fees and expenses, proxy expenses and extraordinary expenses) to 0.39%, through January 28, 2017. During the period, certain fees were waived and/or expenses reimbursed; otherwise, returns would have been lower. The performance table and graph do not reflect the deduction of taxes that a shareholder would pay on Fund distributions or the redemption of Fund shares.
| Principal | Security Description | Rate | Maturity | Value |
| Municipal Bonds - 97.2% |
| Arkansas - 1.2% | ||||||||||
| $ | 400,000 | Bentonville School District No. 6, Arkansas General Obligation Bond | 4.50 | % | 06/01/30 | $ | 417,188 | |||
| California - 8.5% | ||||||||||
| 520,000 | Centinela Valley Union High School District, California General Obligation Bond, Series B | 5.75 | 08/01/30 | 667,919 | ||||||
| 350,000 | Compton Unified School District, California General Obligation Bond, Series D (a) | 1.42 | 06/01/18 | 339,164 | ||||||
| 335,000 | Inglewood Public Financing Authority, California Revenue Bond | 5.00 | 08/01/19 | 373,977 | ||||||
| 275,000 | Placentia-Yorba Linda Unified School District, California Certificate of Participation, Series A | 4.00 | 10/01/30 | 301,758 | ||||||
| 1,070,000 | Solano County Community College District, California General Obligation Bond (a) | 1.39 | 08/01/29 | 912,763 | ||||||
| 400,000 | Stockton Unified School District, California General Obligation Bond, Series A | 5.00 | 08/01/18 | 438,136 | ||||||
| 3,033,717 | ||||||||||
| Colorado - 0.7% | ||||||||||
| 250,000 | County of Adams, Colorado Certificate of Participation | 4.00 | 12/01/18 | 269,638 | ||||||
| Connecticut - 1.2% | ||||||||||
| 200,000 | State of Connecticut, Connecticut General Obligation Bond, Series E | 4.00 | 12/15/19 | 204,934 | ||||||
| 195,000 | State of Connecticut, Connecticut General Obligation Bond, Series F | 5.00 | 11/15/28 | 236,342 | ||||||
| 441,276 | ||||||||||
| Principal | Security Description | Rate | Maturity | Value |
| Illinois - 13.5% | |||||||||||
| $ | 310,000 | Chicago Park District, Illinois General Obligation Bond, Series A | 4.00 | % | 01/01/20 | $ | 319,359 | ||||
| 540,000 | Chicago Park District, Illinois General Obligation Bond, Series A | 5.00 | 01/01/28 | 602,689 | |||||||
| 395,000 | Chicago Park District, Illinois General Obligation Bond, Series B | 4.00 | 01/01/22 | 417,100 | |||||||
| 235,000 | Cook County Community Consolidated School District No. 15 Palatine, Illinois General Obligation Bond | 5.00 | 12/01/23 | 285,229 | |||||||
| 635,000 | Cook County Community High School District No. 218 Dwight D. Eisenhower, Illinois General Obligation Bond | 4.25 | 12/01/24 | 715,766 | |||||||
| 240,000 | Cook County School District No. 29 Sunset Ridge, Illinois Revenue Bond, Series A | 3.00 | 12/01/20 | 256,051 | |||||||
| 500,000 | Illinois Finance Authority, Illinois Revenue Bond | 5.00 | 11/15/25 | 575,145 | |||||||
| 575,000 | Illinois Finance Authority, Illinois Revenue Bond, Series C | 4.50 | 11/15/32 | 586,540 | |||||||
| 250,000 | Kane County Community Unit School District No. 304 Geneva, Illinois General Obligation Bond, Series A | 5.00 | 01/01/26 | 257,870 | |||||||
| 700,000 | University of Illinois, Illinois Revenue Bond, Series A | 5.00 | 04/01/30 | 825,888 | |||||||
| 4,841,637 | |||||||||||
| Indiana - 1.6% | |||||||||||
| 545,000 | South Madison Middle School Building Corp., Indiana Revenue Bond | 2.00 | 07/15/18 | 558,347 | |||||||
| Principal | Security Description | Rate | Maturity | Value |
| Kansas - 1.3% | |||||||||||
| $ | 375,000 | Kansas Development Finance Authority, Kansas Revenue Bond, Series G | 5.00 | % | 04/01/25 | $ | 451,823 | ||||
| Kentucky - 13.4% | |||||||||||
| 300,000 | Boone County School District Finance Corp., Kentucky Revenue Bond | 3.00 | 04/01/25 | 313,506 | |||||||
| 400,000 | Corbin Independent School District Finance Corp., Kentucky Revenue Bond | 2.00 | 02/01/22 | 407,464 | |||||||
| 425,000 | Corbin Independent School District Finance Corp., Kentucky Revenue Bond | 3.00 | 02/01/25 | 454,703 | |||||||
| 630,000 | Corbin Independent School District Finance Corp., Kentucky Revenue Bond | 3.00 | 02/01/26 | 668,166 | |||||||
| 420,000 | Grant County School District Finance Corp., Washington Revenue Bond | 3.00 | 04/01/24 | 444,684 | |||||||
| 280,000 | Kenton County School District Finance Corp., Kentucky Revenue Bond | 3.00 | 02/01/26 | 292,233 | |||||||
| 775,000 | Madison County School District Finance Corp., Kentucky Revenue Bond | 5.00 | 05/01/22 | 914,864 | |||||||
| 630,000 | Madison County School District Finance Corp., Kentucky Revenue Bond | 5.00 | 05/01/23 | 754,406 | |||||||
| 475,000 | Owensboro Independent School District Finance Corp., Kentucky Revenue Bond | 4.00 | 09/01/20 | 524,338 | |||||||
| 4,774,364 | |||||||||||
| Michigan - 7.3% | |||||||||||
| 350,000 | Central Michigan University, Michigan Revenue Bond | 5.00 | 10/01/24 | 435,645 | |||||||
| Principal | Security Description | Rate | Maturity | Value |
| $ | 225,000 | Charles Stewart Mott Community College, Michigan Revenue Bond | 3.00 | % | 05/01/24 | $ | 242,649 | ||||
| 500,000 | Howell Public Schools, Michigan General Obligation Bond, Series B | 5.00 | 05/01/25 | 578,440 | |||||||
| 695,000 | L'Anse Creuse Public Schools, Michigan General Obligation Bond | 5.00 | 05/01/25 | 857,873 | |||||||
| 210,000 | Lansing School District, Michigan General Obligation Bond | 5.00 | 05/01/21 | 245,994 | |||||||
| 200,000 | Rockford Public Schools, Michigan General Obligation Bond | 5.00 | 05/01/22 | 236,428 | |||||||
| 2,597,029 | |||||||||||
| Missouri - 1.8% | |||||||||||
| 250,000 | Liberty Public School District No. 53, Missouri Certificate of Participation | 3.00 | 04/01/20 | 266,563 | |||||||
| 300,000 | Missouri Joint Municipal Electric Utility Commission, Missouri Revenue Bond, Series A | 5.00 | 01/01/24 | 365,751 | |||||||
| 632,314 | |||||||||||
| New Jersey - 0.6% | |||||||||||
| 200,000 | Borough of Tuckerton, New Jersey General Obligation Bond | 2.00 | 03/01/18 | 203,982 | |||||||
| New York - 1.3% | |||||||||||
| 400,000 | Metropolitan Transportation Authority, New York Revenue Bond, Series H | 5.00 | 11/15/30 | 476,368 | |||||||
| North Dakota - 1.4% | |||||||||||
| 460,000 | City of Mandan, North Dakota General Obligation Bond, Series B | 5.00 | 05/01/18 | 498,405 | |||||||
| Ohio - 2.0% | |||||||||||
| 200,000 | Trotwood-Madison City School District, Ohio Certificate of Participation | 4.00 | 12/01/23 | 230,908 | |||||||
| 200,000 | Trotwood-Madison City School District, Ohio Certificate of Participation | 4.00 | 12/01/24 | 231,490 | |||||||
| Principal | Security Description | Rate | Maturity | Value |
| $ | 215,000 | Trotwood-Madison City School District, Ohio Certificate of Participation | 4.00 | % | 12/01/25 | $ | 249,086 | ||||
| 711,484 | |||||||||||
| Pennsylvania - 17.4% | |||||||||||
| 230,000 | Clearfield Area School District, Pennsylvania General Obligation Bond | 3.00 | 09/01/24 | 232,279 | |||||||
| 500,000 | Commonwealth of Pennsylvania, Pennsylvania General Obligation Bond, First Series | 5.00 | 11/15/22 | 595,535 | |||||||
| 300,000 | Commonwealth of Pennsylvania, Pennsylvania General Obligation Bond, First Series | 5.00 | 04/01/26 | 357,657 | |||||||
| 810,000 | Commonwealth of Pennsylvania, Pennsylvania General Obligation Bond, First Series | 5.00 | 05/15/27 | 876,744 | |||||||
| 700,000 | Commonwealth of Pennsylvania, Pennsylvania General Obligation Bond, First Series | 5.00 | 06/01/28 | 807,268 | |||||||
| 365,000 | Deer Lakes School District, Pennsylvania General Obligation Bond | 2.63 | 04/01/25 | 369,179 | |||||||
| 250,000 | Hampton Township School District, Pennsylvania General Obligation Bond, Series A | 3.00 | 11/15/17 | 258,498 | |||||||
| 425,000 | Northern Tioga School District, Pennsylvania General Obligation Bond | 2.00 | 04/01/21 | 437,899 | |||||||
| 265,000 | Pennsylvania State University, Pennsylvania Revenue Bond, Series A | 5.00 | 03/01/28 | 292,157 | |||||||
| 200,000 | Pennsylvania Turnpike Commission, Pennsylvania Revenue Bond, Series B | 5.00 | 12/01/25 | 249,456 | |||||||
| Principal | Security Description | Rate | Maturity | Value |
| $ | 750,000 | Red Lion Area School District, Pennsylvania General Obligation Bond | 5.00 | % | 05/01/23 | $ | 810,233 | ||||
| 500,000 | West Allegheny School District, Pennsylvania General Obligation Bond | 3.20 | 09/01/24 | 508,515 | |||||||
| 430,000 | Wyalusing Area School District, Pennsylvania General Obligation Bond | 2.00 | 04/01/21 | 442,001 | |||||||
| 6,237,421 | |||||||||||
| South Dakota - 1.7% | |||||||||||
| 315,000 | South Dakota Board of Regents, South Dakota Revenue Bond | 4.00 | 04/01/18 | 333,862 | |||||||
| 250,000 | South Dakota Board of Regents, South Dakota Revenue Bond | 5.00 | 04/01/19 | 278,540 | |||||||
| 612,402 | |||||||||||
| Texas - 18.6% | |||||||||||
| 750,000 | Brazoria-Fort Bend County Municipal Utility District No. 1, Texas General Obligation Bond | 2.00 | 09/01/19 | 767,392 | |||||||
| 845,000 | Brazoria-Fort Bend County Municipal Utility District No. 1, Texas General Obligation Bond | 3.00 | 09/01/23 | 900,956 | |||||||
| 300,000 | City of Houston, Texas General Obligation Bond, Series A | 5.00 | 03/01/24 | 355,845 | |||||||
| 295,000 | City of League Texas Water and Sewer, Texas General Obligation Bond, Series B | 5.00 | 02/15/30 | 336,126 | |||||||
| 500,000 | Dallas/Fort Worth International Airport, Texas Revenue Bond | 5.25 | 11/01/27 | 595,955 | |||||||
| 200,000 | Fort Bend County Municipal Utility District No. 2, Texas General Obligation Bond | 4.35 | 10/01/29 | 209,356 | |||||||
| 750,000 | Harris County Municipal Utility District No. 290, Texas General Obligation Bond | 2.00 | 09/01/21 | 762,360 | |||||||
| Principal | Security Description | Rate | Maturity | Value |
| $ | 235,000 | Harris County Municipal Utility District No. 383, Texas General Obligation Bond | 2.00 | % | 09/01/19 | $ | 241,803 | |||||
| 255,000 | Harris County Municipal Utility District No. 383, Texas General Obligation Bond | 3.00 | 09/01/20 | 273,656 | ||||||||
| 200,000 | Harris County Municipal Utility District No. 383, Texas General Obligation Bond | 2.00 | 09/01/20 | 205,204 | ||||||||
| 235,000 | Harris County Municipal Utility District No. 383, Texas General Obligation Bond | 2.00 | 09/01/21 | 240,758 | ||||||||
| 235,000 | Harris County Municipal Utility District No. 383, Texas General Obligation Bond | 3.00 | 09/01/24 | 252,912 | ||||||||
| 235,000 | Harris County Municipal Utility District No. 383, Texas General Obligation Bond | 3.00 | 09/01/25 | 250,284 | ||||||||
| 275,000 | Lower Colorado River Authority, Texas Revenue Bond | 5.00 | 05/15/30 | 312,026 | ||||||||
| 330,000 | Reagan County Independent School District, Texas General Obligation Bond | 3.00 | 02/15/23 | 330,445 | ||||||||
| 590,000 | Travis County Water Control & Improvement District No. 17, Texas General Obligation Bond | 3.00 | 11/01/25 | 617,040 | ||||||||
| 6,652,118 | ||||||||||||
| Vermont - 0.5% | ||||||||||||
| 200,000 | Vermont Housing Finance Agency, Vermont Revenue Bond, Series B | 1.95 | 05/01/23 | 200,400 | ||||||||
| Washington - 1.4% | ||||||||||||
| 395,000 | Grant County Public Utility District No. 2, Washington Revenue Bond, Series B | 5.00 | 01/01/26 | 488,437 | ||||||||
| Principal | Security Description | Rate | Maturity | Value |
| Wisconsin - 1.8% | |||||||||||
| $ | 600,000 | Evansville Community School District, Wisconsin General Obligation Bond | 3.00 | % | 04/01/19 | $ | 634,650 | ||||
Total Municipal Bonds (Cost $34,422,955) | 34,733,000 |
| Shares | Security Description | Value |
| Money Market Fund - 5.6% | |||||||
| 1,982,472 | Fidelity Institutional Cash Money Market Fund, 0.34% (b) (Cost $1,982,472) | 1,982,472 | |||||
Total Investments - 102.8% (Cost $36,405,427)* | $ | 36,715,472 |
| Other Assets & Liabilities, Net – (2.8)% | (994,092 | ) | |
| Net Assets – 100.0% | $ | 35,721,380 |
| (a) | Zero coupon bond. Interest rate presented is yield to maturity. |
| (b) | Variable rate security. Rate presented is as of March 31, 2016. |
* Cost for federal income tax purposes is substantially the same as for financial statement purposes and net unrealized appreciation consists of:
| Gross Unrealized Appreciation | $ | 335,634 | ||
| Gross Unrealized Depreciation | (25,589 | ) | ||
| Net Unrealized Appreciation | $ | 310,045 |
The inputs or methodology used for valuing securities are not necessarily an indication of the risks associated with investing in those securities. For more information on valuation inputs, and their aggregation into the levels used in the table below, please refer to the Security Valuation section in Note 2 of the accompanying Notes to Financial Statements.
The following is a summary of the inputs used to value the Fund's investments as of March 31, 2016.
| Valuation Inputs | Investments in Securities |
| Level 1 - Quoted Prices | $ | - | ||
| Level 2 - Other Significant Observable Inputs | 36,715,472 | |||
| Level 3 - Significant Unobservable Inputs | - | |||
| Total | $ | 36,715,472 |
The Level 2 value displayed in this table includes Municipal Bonds and a Money Market Fund. Refer to this Schedule of Investments for a further breakout of each Municipal Bond security by state.
The Fund utilizes the end of period methodology when determining transfers. There were no transfers among Level 1, Level 2 and Level 3 for the period ended March 31, 2016.
AFA
| PORTFOLIO HOLDINGS | ||
| % of Total Investments | ||
| Municipal Bonds | 94.6 | % |
| Money Market Fund | 5.4 | % |
| 100.0 | % |
| ASSETS | ||||||
| Total investments, at value (Cost $36,405,427) | $ | 36,715,472 | ||||
| Receivables: | ||||||
| Dividends and interest | 321,585 | |||||
| From investment adviser | 9,647 | |||||
| Prepaid expenses | 3,308 | |||||
| Deferred offering costs | 11,851 | |||||
| Total Assets | 37,061,863 | |||||
| LIABILITIES | ||||||
| Payables: | ||||||
| Investment securities purchased | 1,291,703 | |||||
| Fund shares redeemed | 4,089 | |||||
| Distributions payable | 3,276 | |||||
| Accrued Liabilities: | ||||||
| Trustees' fees and expenses | 1,023 | |||||
| Fund services fees | 15,652 | |||||
| Other expenses | 24,740 | |||||
| Total Liabilities | 1,340,483 | |||||
| NET ASSETS | $ | 35,721,380 | ||||
| COMPONENTS OF NET ASSETS | ||||||
| Paid-in capital | $ | 35,401,535 | ||||
| Accumulated net realized gain | 9,800 | |||||
| Net unrealized appreciation | 310,045 | |||||
| NET ASSETS | $ | 35,721,380 | ||||
| SHARES OF BENEFICIAL INTEREST AT NO PAR VALUE (UNLIMITED SHARES AUTHORIZED) | 3,531,522 | |||||
| NET ASSET VALUE, OFFERING AND REDEMPTION PRICE PER SHARE | $ | 10.12 | ||||
| INVESTMENT INCOME | |||||||
| Dividend income | . | $ | 4,308 | ||||
| Interest income | 127,216 | ||||||
| Total Investment Income | 131,524 | ||||||
| EXPENSES | |||||||
| Investment adviser fees | 27,948 | ||||||
| Fund services fees | 35,085 | ||||||
| Custodian fees | 2,552 | ||||||
| Registration fees | 1,608 | ||||||
| Professional fees | 18,932 | ||||||
| Trustees' fees and expenses | 1,970 | ||||||
| Offering costs | 15,776 | ||||||
| Miscellaneous expenses | 15,782 | ||||||
| Total Expenses | 119,653 | ||||||
| Fees waived and expenses reimbursed | (88,511 | ) | |||||
| Net Expenses | 31,142 | ||||||
| NET INVESTMENT INCOME | 100,382 | ||||||
| NET REALIZED AND UNREALIZED GAIN (LOSS) | |||||||
| Net realized gain on investments | 9,800 | ||||||
| Net change in unrealized appreciation (depreciation) on investments | 310,045 | ||||||
| NET REALIZED AND UNREALIZED GAIN | 319,845 | ||||||
| INCREASE IN NET ASSETS RESULTING FROM OPERATIONS | $ | 420,227 | |||||
| * | Commencement of operations was December 1, 2015. | ||||||
December 1, 2015* through March 31, 2016 | |||||||
| OPERATIONS | |||||||
| Net investment income | $ | 100,382 | |||||
| Net realized gain | 9,800 | ||||||
| Net change in unrealized appreciation (depreciation) | 310,045 | ||||||
| Increase in Net Assets Resulting from Operations | 420,227 | ||||||
| DISTRIBUTIONS TO SHAREHOLDERS FROM | |||||||
| Net investment income | (100,382 | ) | |||||
| CAPITAL SHARE TRANSACTIONS | |||||||
| Sale of shares | 35,309,872 | ||||||
| Reinvestment of distributions | 95,752 | ||||||
| Redemption of shares | (4,089 | ) | |||||
| Increase in Net Assets from Capital Share Transactions | 35,401,535 | ||||||
| Increase in Net Assets | 35,721,380 | ||||||
| NET ASSETS | |||||||
| Beginning of Period | - | ||||||
| End of Period | $ | 35,721,380 | |||||
| SHARE TRANSACTIONS | |||||||
| Sale of shares | 3,522,446 | ||||||
| Reinvestment of distributions | 9,480 | ||||||
| Redemption of shares | (404 | ) | |||||
| Increase in Shares | 3,531,522 | ||||||
| * | Commencement of operations. | ||||||
These financial highlights reflect selected data for a share outstanding throughout each period. | |||||
December 1, 2015 (a) through March 31, 2016 | |||||
| INSTITUTIONAL CLASS | |||||
| NET ASSET VALUE, Beginning of Period | $ | 10.00 | |||
| INVESTMENT OPERATIONS | |||||
| Net investment income (b) | 0.04 | ||||
| Net realized and unrealized gain (loss) | 0.12 | ||||
| Total from Investment Operations | 0.16 | ||||
| DISTRIBUTIONS TO SHAREHOLDERS FROM | |||||
| Net investment income | (0.04 | ) | |||
| NET ASSET VALUE, End of Period | $ | 10.12 | |||
| TOTAL RETURN | 1.48 | %(c) | |||
| RATIOS/SUPPLEMENTARY DATA | |||||
| Net Assets at End of Period (000's omitted) | $35,721 | ||||
| Ratios to Average Net Assets: | |||||
| Net investment income | 1.25 | %(d) | |||
| Net expenses | 0.39 | %(d) | |||
| Gross expenses (e) | 1.49 | %(d) | |||
| PORTFOLIO TURNOVER RATE | 8 | %(c) | |||
| (a) | Commencement of operations. | ||||
| (b) | Calculated based on average shares outstanding during the period. | ||||
| (c) | Not annualized. | ||||
| (d) | Annualized. | ||||
| (e) | Reflects the expense ratio excluding any waivers and/or reimbursements. | ||||
Dear Shareholders:
We are pleased to present to you the first report for the Gurtin National Municipal Intermediate Value Fund and Gurtin California Municipal Intermediate Value Fund (the Gurtin Intermediate Value Funds). Having launched these funds in November 2015 with an objective of maximizing risk-adjusted long-term income while seeking to preserve capital and liquidity, we believe our ability to do so lies in our ability to execute on opportunistic purchases of generally misunderstood and mispriced municipal bond structures and high quality credits.
In looking back at the initial months of performance of the Gurtin Intermediate Value Funds, we are extremely pleased with our ability to get cash invested and identify opportunities to generate value in an environment of falling interest rates and narrowing spreads, even as money market funds – in which a significant portion of the funds was invested as we looked for higher yielding opportunities – were essentially earning zero at a yield of 0.34% as of Dec. 31, 2015.1 Notably, the Gurtin National Municipal Intermediate Value Fund and Gurtin California Municipal Intermediate Value Fund averaged 20.68% and 29.48% investment in money market funds, respectively, over the course of the funds' first month of operation as compared to the benchmark indexes, which were both more fully invested with less than 0.6% maturing in less than one year as of Dec. 31, 2015.2 Holding higher levels of cash in such a market environment could negatively affect funds, making it difficult to perform in line with the benchmark indexes. Yet, having diligently worked over the past five months to get initial cash invested, the Gurtin Intermediate Value Funds have performed almost in line with their benchmark indexes in spite of higher cash levels, while generating yields (income) in excess of those of the index yields, as shown below as of March 31, 2016.
Fund3 | Yield-to-Maturity4 at Market | Yield-to-Worst5 at Market | 30-Day SEC Yield (Subsidized/Unsubsidized) 6 | |||
| Gurtin National Municipal Intermediate Value Fund (GNMVX) | 2.37% | 1.76% | 1.79%/1.09% | |||
| Gurtin California Municipal Intermediate Value Fund (GCMVX) | 2.34% | 1.68% | 1.72%/0.22% | |||
Merrill Lynch 1-15 Year Blend Index7 | 2.22% | 1.53% | N/A | |||
| Merrill Lynch 1-12 Year Index | 1.82% | 1.35% | N/A |
Past performance does not guarantee future results. The performance data quoted represents past performance and current returns may be lower or higher. Share prices and investment returns fluctuate and an investor's shares may be worth more or less than original cost upon redemption. For performance data current to the most recent month-end please call (844) 342-5763. Returns for performance under one year are cumulative, not annualized. Short-term performance, in particular, is not a good indication of the fund's future performance, and an investment should not be made based solely on returns. Because of ongoing market volatility, fund performance may be subject to substantial short-term changes.
In our management of the Gurtin Intermediate Value Funds, we have taken advantage of a number of exploitable inefficiencies in the municipal market to help generate the above-market income levels noted above. In addition, we have been able to maximize risk-adjusted long-term income through the achievement of the following goals:
| · | Bond structure optimization. By taking advantage of inefficiencies in the market due to mispriced structures and misunderstood credits, we were able to purchase what we identified as optimal bond structures at attractive levels |
1 Source: Fidelity, data as of December 31, 2015.
2 Source: Merrill Lynch, data as of December 31, 2015. http://www.mlindex.ml.com/GISPublic/bin/IndexDistOlap.asp?AppCode=0&hdnDate=12/31/2015&txtSSCUSIP=U0T0
3 Data current as of 3/31/2016.
4 Yield-to-Maturity: Average anticipated rate of return for the portfolio's positions if held to maturity.
5 Yield-to-Worst: The average rate of return of the portfolio at current market prices, adjusting for optionality.
6 The 30-Day SEC Yield is computed under an SEC standardized formula based on net income earned over the past 30 days. It is a "subsidized" yield, which means it includes contractual expense reimbursements and it would be lower without those reimbursements. The Unsubsidized 30-Day SEC Yield is computed under an SEC standardized formula based on net income earned over the past 30 days. It excludes contractual expense reimbursements, resulting in a lower yield.
7 The Merrill Lynch 1-15 Year Blend is calculated as a 15%/85% blend of the Merrill Lynch 1-3 and 3-15 Year indices, respectively. The benchmarks reflect no deduction for fees, expenses or taxes. These indices track the performance of tax-exempt investment grade debt publicly issued by U.S. states and territories, and their political subdivisions, years remaining term to maturity. Bonds must have a fixed coupon schedule and an investment grade rating. You cannot invest directly into an index.
| without sacrificing the structural integrity of the fund. |
| · | Fund diversification. We did not overweight any particular credit for any reason, providing us with the diversification we desired, which included credit quality distribution, sector allocation, and duration distribution. |
| · | Opportunistic buying. Historically, when interest rates move higher, spreads tend to widen, creating opportunities to buy at more attractive levels. Over the past six months, in instances where such opportunities were presented, we were able to use our cash position to take advantage of them. |
We continue to anticipate opportunities and are eager to act when they are presented.
We believe the future is bright.
Sincerely,
William R. Gurtin
CEO, CIO, Managing Partner
Gurtin Fixed Income Management, LLC
CEO, CIO, Managing Partner
Gurtin Fixed Income Management, LLC
Important Information:
There can be no guarantee that any strategy (risk management) or otherwise will be successful. All investing involves risk, including the potential loss of principal. The Fund is newly formed. Investors in the Fund bear the risk that the Adviser may not be successful in implementing the Fund's investment strategy and the Fund may not achieve scale.
Bonds: Investing in the bond market is subject to certain risks including market, interest-rate, issuer, credit and inflation risk; investments may be worth more or less than the original cost when redeemed. Income from municipal bonds may be subject to state and local taxes and at times the alternative minimum tax; a strategy concentrating in a single or limited number of states is subject to greater risk of adverse economic conditions and regulatory changes. The value of most bond funds and fixed income securities are impacted by changes in interest rates. Bonds and bond funds with longer durations tend to be more sensitive and more volatile than securities with shorter durations; bond prices generally fall as interest rates rise. Credit risk refers to an issuers ability to make interest and principal payments when due.
The following chart reflects the change in the value of a hypothetical $250,000 investment in Insitutional Shares, including reinvested dividends and distributions, in Gurtin California Municipal Intermediate Value Fund (the "Fund") compared with the performance of the benchmark, Bank of America Merrill Lynch Municipal Blended 85% Index ("BAML Muni Blended 85%") and the Bank of America Merrill Lynch 1-12 Year Municipal Index ("BAML 1-2 Muni Index"), since inception. The BAML Muni Blended 85% is a blend of 85% of the Bank of America Merrill Lynch 3-15 Year US Municipal Securities Index, a subset of the Bank of America Merrill Lynch US Municipal Securities Index including all securities with a remaining term to final maturity greater than or equal to three years and less than twelve years, and 15% of the Bank of America Merrill Lynch 1-3 Year US Municipal Securities Index, a subset of the Bank of America Merrill Lynch US Municipal Securities Index including all securities with a remaining term to final maturity greater than or equal to one year and less than three years. BAML 1-12 Year Muni is an unmanaged, market-weighted index that includes investment-grade municipal bonds with maturities greater than one year but less than twelve years. The total returns of both the BAML Muni Blended 85% and the BAML Muni Index 1-12 include the reinvestment of dividends and income. The total return of the Fund includes operating expenses that reduce returns, while the total returns of the BAML Muni Blended 85% and the BAML Muni Index 1-12 does not include expenses. The Fund is professionally managed while the BAML Muni Blended 85% and the BAML Muni Index 1-12 are unmanaged and are not available for investment.
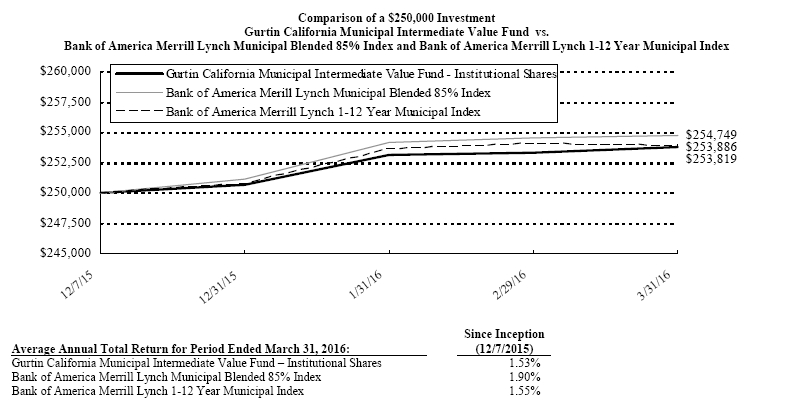
Performance data quoted represents past performance and is no guarantee of future results. Current performance may be lower or higher than the performance data quoted. Investment return and principal value will fluctuate so that shares, when redeemed, may be worth more or less than original cost. For the most recent month-end performance, please call (844) 342-5763. As stated in the Fund's current prospectus, the annual operating expense ratio (gross) is 1.02%. However, the Fund's adviser has contractually agreed to waive its fee and/or reimburse expenses to limit total operating expenses (excluding all taxes, interest, portfolio transaction expenses, acquired fund fees and expenses, proxy expenses and extraordinary expenses) to 0.39%, through January 28, 2017. During the period, certain fees were waived and/or expenses reimbursed; otherwise, returns would have been lower. The performance table and graph do not reflect the deduction of taxes that a shareholder would pay on Fund distributions or the redemption of Fund shares.
| Municipal Bonds - 98.6% |
| Arkansas - 1.4% |
| $ | 420,000 | Bentonville School District No. 6, Arkansas General Obligation Bond | 4.50 | % | 06/01/30 | $ | 438,047 |
| California - 84.8% | ||||||||||
| 200,000 | California Statewide Communities Development Authority, California Revenue Bond | 5.00 | 11/15/23 | 246,674 | ||||||
| 425,000 | Campbell Union High School District, California Certificate of Participation | 5.00 | 08/01/22 | 448,260 | ||||||
| 350,000 | Campbell Union High School District, California Certificate of Participation | 5.00 | 08/01/24 | 368,868 | ||||||
| 300,000 | Campbell Union High School District, California Certificate of Participation | 5.00 | 08/01/27 | 315,882 | ||||||
| 750,000 | Centinela Valley Union High School District, California General Obligation Bond, Series B | 5.75 | 08/01/30 | 963,345 | ||||||
| 275,000 | Central Unified School District, California General Obligation Bond | 5.50 | 08/01/29 | 310,981 | ||||||
| 855,000 | Chula Vista Elementary School District, California Certificate of Participation | 5.00 | 09/01/22 | 1,031,583 | ||||||
| 610,000 | Chula Vista Elementary School District, California Certificate of Participation | 5.00 | 09/01/23 | 748,110 | ||||||
| 380,000 | Chula Vista Elementary School District, California Certificate of Participation, Series A | 5.00 | 09/01/19 | 430,601 | ||||||
| 200,000 | City & County of San Francisco, California Certificate of Participation, Series A | 5.00 | 04/01/18 | 216,904 | ||||||
| Principal | Security Description | Rate | Maturity | Value |
| $ | 200,000 | City of Sacramento, California Special Tax Bond | 5.00 | % | 09/01/24 | $ | 242,236 | |||
| 250,000 | City of Ukiah Water Revenue, California Revenue Bond | 4.00 | 09/01/18 | 268,440 | ||||||
| 275,000 | Colton Public Financing Authority, California Revenue Bond, Series A | 5.00 | 04/01/24 | 321,728 | ||||||
| 500,000 | Compton Unified School District, California General Obligation Bond, Series D (a) | 1.42 | 06/01/18 | 484,520 | ||||||
| 295,000 | County of Santa Cruz, California Certificate of Participation | 5.00 | 08/01/23 | 360,124 | ||||||
| 500,000 | Dinuba Unified School District, California General Obligation Bond | 4.13 | 08/01/29 | 521,160 | ||||||
| 365,000 | Fillmore Unified School District, California General Obligation Bond | 4.00 | 07/01/18 | 391,415 | ||||||
| 1,015,000 | Golden State Tobacco Securitization Corp., California Revenue Bond, Series A | 5.00 | 06/01/29 | 1,198,350 | ||||||
| 190,000 | Golden State Tobacco Securitization Corp., California Revenue Bond, Series A | 5.00 | 06/01/30 | 224,067 | ||||||
| 660,000 | Imperial Community College District, California General Obligation Bond | 5.00 | 08/01/29 | 787,070 | ||||||
| 580,000 | Irvine Unified School District, California Special Tax Bond | 5.00 | 09/01/23 | 721,050 | ||||||
| 205,000 | Los Angeles County Redevelopment Refunding Authority Redev Agency Successor Agency, California Tax Allocation Bond, Series A | 5.00 | 09/01/20 | 238,889 |
| $ | 250,000 | Poway Unified School District Public Financing Authority, California Special Tax Bond, Series A | 5.00 | % | 09/01/24 | $ | 302,720 | |||
| 350,000 | Poway Unified School District Public Financing Authority, California Special Tax Bond, Series A | 5.00 | 09/01/25 | 426,832 | ||||||
| 250,000 | Riverside County Asset Leasing Corp., California Revenue Bond | 4.00 | 06/01/28 | 271,952 | ||||||
| 300,000 | Riverside County Redevelopment Successor Agency, California Tax Allocation Bond | 5.00 | 10/01/25 | 369,996 | ||||||
| 300,000 | Sacramento Redevelopment Agency Successor Agency, California Tax Allocation Bond, Series A | 5.00 | 12/01/19 | 339,285 | ||||||
| 500,000 | San Jose Redevelopment Agency, California Tax Allocation Bond | 5.00 | 08/01/22 | 524,765 | ||||||
| 200,000 | San Mateo County Transit District, California Revenue Bond, Series A | 5.75 | 06/01/18 | 221,748 | ||||||
| 225,000 | Santa Clara County Board of Education, California Certificate of Participation | 5.00 | 04/01/21 | 268,063 | ||||||
| 1,525,000 | Solano County Community College District, California General Obligation Bond (a) | 1.39 | 08/01/29 | 1,300,901 | ||||||
| 500,000 | Sonoma Community Development Agency Successor Agency, California Tax Allocation Bond | 5.00 | 12/01/30 | 578,560 | ||||||
| 610,000 | State of California Department of Veterans Affairs, Series A | 3.50 | 12/01/25 | 655,933 | ||||||
| 785,000 | Stockton Unified School District, California General Obligation Bond | 4.00 | 08/01/18 | 841,748 |
| Principal | Security Description | Rate | Maturity | Value |
| $ | 415,000 | Stockton Unified School District, California General Obligation Bond, Series B | 5.00 | % | 08/01/18 | $ | 454,969 | |||
| 370,000 | Stockton Unified School District, California General Obligation Bond, Series B | 5.00 | 08/01/19 | 418,892 | ||||||
| 430,000 | Stockton Unified School District, California General Obligation Bond, Series B | 5.00 | 08/01/24 | 537,380 | ||||||
| 310,000 | Travis Unified School District, California Certificate of Participation | 4.00 | 09/01/19 | 339,695 | ||||||
| 375,000 | Travis Unified School District, California Certificate of Participation | 4.00 | 09/01/22 | 427,215 | ||||||
| 215,000 | Val Verde Unified School District, California Certificate of Participation, Series A | 5.00 | 08/01/26 | 265,897 | ||||||
| 500,000 | Val Verde Unified School District, California Revenue Bond, Series A | 4.10 | 03/01/20 | 542,485 | ||||||
| 225,000 | Visalia Unified School District, California General Obligation Bond | 4.00 | 08/01/17 | 233,879 | ||||||
| 300,000 | Waugh School District, California Special Tax Bond | 4.00 | 09/01/20 | 337,539 | ||||||
| 25,799,562 | ||||||||||
| Illinois - 6.1% | ||||||||||
| 400,000 | Chicago Park District, Illinois General Obligation Bond, Series C | 5.00 | 01/01/25 | 455,528 | ||||||
| 625,000 | Chicago Park District, Illinois General Obligation Bond, Series C | 5.00 | 01/01/25 | 691,237 | ||||||
| 255,000 | Grundy & Kendall Counties Consolidated Grade School District No. 60-C/IL, Illinois General Obligation Bond | 4.00 | 02/01/21 | 284,228 | ||||||
| Principal | Security Description | Rate | Maturity | Value |
| $ | 425,000 | Illinois Finance Authority, Illinois Revenue Bond, Series C | 4.50 | % | 11/15/32 | $ | 433,530 | |||
| 1,864,523 | ||||||||||
| Kentucky - 0.4% | ||||||||||
| 125,000 | Corbin Independent School District Finance Corp., Kentucky Revenue Bond | 3.00 | 02/01/26 | 131,354 | ||||||
| Michigan - 1.0% | ||||||||||
| 285,000 | Macomb Township Building Authority, Michigan Revenue Bond | 4.25 | 04/01/23 | 303,006 | ||||||
| New Jersey - 2.1% | ||||||||||
| 310,000 | Middle Township Fire District No. 1, New Jersey General Obligation Bond | 4.00 | 02/01/20 | 342,299 | ||||||
| 250,000 | Township of Berlin, New Jersey General Obligation Bond, Series A | 4.50 | 01/01/21 | 284,503 | ||||||
| 626,802 | ||||||||||
| Pennsylvania - 0.8% | ||||||||||
| 225,000 | Wellsboro Area School District, Pennsylvania General Obligation Bond | 3.00 | 04/15/21 | 242,746 | ||||||
| Texas - 2.0% | ||||||||||
| 575,000 | Travis County Water Control & Improvement District No. 17, Texas General Obligation Bond | 3.00 | 11/01/25 | 601,352 | ||||||
Total Municipal Bonds (Cost $29,801,020) | 30,007,392 |
| Shares | Security Description | Value |
| Money Market Fund - 1.5% | |||||||
| 445,406 | Fidelity Institutional Cash Money Market Fund, 0.34% (b) (Cost $445,406) | 445,406 | |||||
Total Investments - 100.1% (Cost $30,246,426)* | $ | 30,452,798 |
| Other Assets & Liabilities, Net – (0.1)% | (23,565 | ) | |
| Net Assets – 100.0% | $ | 30,429,233 |
| (a) | Zero coupon bond. Interest rate presented is yield to maturity. |
| (b) | Variable rate security. Rate presented is as of March 31, 2016. |
* Cost for federal income tax purposes is substantially the same as for financial statement purposes and net unrealized appreciation consists of:
| Gross Unrealized Appreciation | $ | 258,394 | ||
| Gross Unrealized Depreciation | (52,022 | ) | ||
| Net Unrealized Appreciation | $ | 206,372 |
The inputs or methodology used for valuing securities are not necessarily an indication of the risks associated with investing in those securities. For more information on valuation inputs, and their aggregation into the levels used in the table below, please refer to the Security Valuation section in Note 2 of the accompanying Notes to Financial Statements.
The following is a summary of the inputs used to value the Fund's investments as of March 31, 2016.
| Valuation Inputs | Investments in Securities |
| Level 1 - Quoted Prices | $ | - | ||
| Level 2 - Other Significant Observable Inputs | 30,452,798 | |||
| Level 3 - Significant Unobservable Inputs | - | |||
| Total | $ | 30,452,798 |
The Level 2 value displayed in this table includes Municipal Bonds and a Money Market Fund. Refer to this Schedule of Investments for a further breakout of each Municipal Bond security by state.
The Fund utilizes the end of period methodology when determining transfers. There were no transfers among Level Level 1, Level 2 and Level 3 for the period ended March 31, 2016.
AFAPORTFOLIO HOLDINGS | ||
| % of Total Investments | ||
| Municipal Bonds | 98.5 | % |
| Money Market Fund | 1.5 | % |
| 100.0 | % |
| ASSETS | ||||||
| Total investments, at value (Cost $30,246,426) | $ | 30,452,798 | ||||
| Receivables: | ||||||
| Fund shares sold | 75,000 | |||||
| Dividends and interest | 219,946 | |||||
| From investment adviser | 29,530 | |||||
| Prepaid expenses | 347 | |||||
| Deferred offering costs | 1,723 | |||||
| Total Assets | 30,779,344 | |||||
| LIABILITIES | ||||||
| Payables: | ||||||
| Investment securities purchased | 276,425 | |||||
| Fund shares redeemed | 2,494 | |||||
| Distributions payable | 546 | |||||
| Accrued Liabilities: | ||||||
| Trustees' fees and expenses | 1,331 | |||||
| Fund services fees | 28,328 | |||||
| Other expenses | 40,987 | |||||
| Total Liabilities | 350,111 | |||||
| NET ASSETS | $ | 30,429,233 | ||||
| COMPONENTS OF NET ASSETS | ||||||
| Paid-in capital | $ | 30,217,138 | ||||
| Accumulated net realized gain | 5,723 | |||||
| Net unrealized appreciation | 206,372 | |||||
| NET ASSETS | $ | 30,429,233 | ||||
| SHARES OF BENEFICIAL INTEREST AT NO PAR VALUE (UNLIMITED SHARES AUTHORIZED) | 3,006,531 | |||||
| NET ASSET VALUE, OFFERING AND REDEMPTION PRICE PER SHARE | $ | 10.12 | ||||
| INVESTMENT INCOME | |||||||
| Dividend income | . | $ | 4,742 | ||||
| Interest income | 97,320 | ||||||
| Total Investment Income | 102,062 | ||||||
| EXPENSES | |||||||
| Investment adviser fees | 23,972 | ||||||
| Fund services fees | 49,053 | ||||||
| Custodian fees | 3,703 | ||||||
| Registration fees | 1,551 | ||||||
| Professional fees | 26,897 | ||||||
| Trustees' fees and expenses | 2,271 | ||||||
| Offering costs | 17,642 | ||||||
| Pricing fees | 9,453 | ||||||
| Miscellaneous expenses | 13,541 | ||||||
| Total Expenses | 148,083 | ||||||
| Fees waived and expenses reimbursed | (121,371 | ) | |||||
| Net Expenses | 26,712 | ||||||
| NET INVESTMENT INCOME | 75,350 | ||||||
| NET REALIZED AND UNREALIZED GAIN (LOSS) | |||||||
| Net realized gain on investments | 5,723 | ||||||
| Net change in unrealized appreciation (depreciation) on investments | 206,372 | ||||||
| NET REALIZED AND UNREALIZED GAIN | 212,095 | ||||||
| INCREASE IN NET ASSETS RESULTING FROM OPERATIONS | $ | 287,445 | |||||
| * | Commencement of operations was December 7, 2015. | ||||||
December 7, 2015* through March 31, 2016 | |||||||
| OPERATIONS | |||||||
| Net investment income | $ | 75,350 | |||||
| Net realized gain | 5,723 | ||||||
| Net change in unrealized appreciation (depreciation) | 206,372 | ||||||
| Increase in Net Assets Resulting from Operations | 287,445 | ||||||
| DISTRIBUTIONS TO SHAREHOLDERS FROM | |||||||
| Net investment income | (75,350 | ) | |||||
| CAPITAL SHARE TRANSACTIONS | |||||||
| Sale of shares | 30,144,961 | ||||||
| Reinvestment of distributions | 74,671 | ||||||
| Redemption of shares | (2,494 | ) | |||||
| Increase in Net Assets from Capital Share Transactions | 30,217,138 | ||||||
| Increase in Net Assets | 30,429,233 | ||||||
| NET ASSETS | |||||||
| Beginning of Period | - | ||||||
| End of Period | $ | 30,429,233 | |||||
| SHARE TRANSACTIONS | |||||||
| Sale of shares | 2,999,389 | ||||||
| Reinvestment of distributions | 7,388 | ||||||
| Redemption of shares | (246 | ) | |||||
| Increase in Shares | 3,006,531 | ||||||
| * | Commencement of operations. | ||||||
| These financial highlights reflect selected data for a share outstanding throughout the period. | |||||
December 7, 2015 (a) through March 31, 2016 | |||||
| INSTITUTIONAL CLASS | |||||
| NET ASSET VALUE, Beginning of Period | $ | 10.00 | |||
| INVESTMENT OPERATIONS | |||||
| Net investment income (b) | 0.03 | ||||
| Net realized and unrealized gain (loss) | 0.12 | ||||
| Total from Investment Operations | 0.15 | ||||
| DISTRIBUTIONS TO SHAREHOLDERS FROM | |||||
| Net investment income | (0.03 | ) | |||
| NET ASSET VALUE, End of Period | $ | 10.12 | |||
| TOTAL RETURN | 1.53 | %(c) | |||
| RATIOS/SUPPLEMENTARY DATA | |||||
| Net Assets at End of Period (000's omitted) | $30,429 | ||||
| Ratios to Average Net Assets: | |||||
| Net investment income | 1.09 | %(d) | |||
| Net expenses | 0.39 | %(d) | |||
| Gross expenses (e) | 2.16 | %(d) | |||
| PORTFOLIO TURNOVER RATE | 6 | %(c) | |||
| (a) | Commencement of operations. | ||||
| (b) | Calculated based on average shares outstanding during the period. | ||||
| (c) | Not annualized. | ||||
| (d) | Annualized. | ||||
| (e) | Reflects the expense ratio excluding any waivers and/or reimbursements. | ||||
Note 1. Organization
Gurtin National Municipal Value Fund, Gurtin California Municipal Value Fund, Gurtin National Municipal Intermediate Value Fund and Gurtin California Municipal Intermediate Value Fund (individually, a "Fund" and collectively, the "Funds") are non-diversified portfolios of Forum Funds II (the "Trust"). The Trust is a Delaware statutory trust that is registered as an open-end, management investment company under the Investment Company Act of 1940 (the "Act"), as amended. Under its Trust Instrument, the Trust is authorized to issue an unlimited number of each Fund's shares of beneficial interest without par value. Each Fund currently offers two class of shares: Institutional Shares and Investor Shares. As of March 31, 2016, Investor Shares for each Fund had not commenced operations. The Gurtin National Municipal Value Fund's investment objective is to provide current income exempt from regular federal income tax while seeking to preserve capital and liquidity. The Gurtin California Municipal Value Fund's investment objective is to provide current income exempt from regular federal income tax and California state personal income taxes while seeking to preserve capital and liquidity. The Gurtin National Municipal Intermediate Value Fund's investment objective is to provide current income exempt from regular federal income tax while seeking to preserve capital and liquidity. The Gurtin California Municipal Intermediate Value Fund's investment objective is to provide current income exempt from regular federal income tax and California state personal income taxes while seeking to preserve capital and liquidity.
The Gurtin National Municipal Value Fund and Gurtin California Municipal Value Fund commenced operations on November 3, 2014, after they acquired the net assets of privately offered funds managed by the Funds' adviser and portfolio management team (each a "Predecessor Fund" and collectively the "Predecessor Funds"). The Predecessor Funds of the Gurtin National Municipal Value Fund and Gurtin California Municipal Value Fund commenced operations on May 3, 2010.
On November 3, 2014, the Predecessor Funds reorganized into the Gurtin National Municipal Value Fund and Gurtin California Municipal Value Fund. The reorganization of net assets and unrealized gain from this tax-free transaction were as follows:
| Fund | Date of Contribution | Net Assets | Shares Issued | Unrealized Gain on Investments Received from Reorganization | ||||
| Gurtin National Municipal Value Fund | November 3, 2014 | $46,288,768 | 4,628,877 | $2,085,304 | ||||
| Gurtin California Municipal Value Fund | November 3, 2014 | 83,099,170 | 8,309,917 | 4,405,323 |
The Gurtin National Municipal Intermediate Value Fund and Gurtin California Municipal Intermediate Value Fund commenced operations on December 1, 2015, and December 7, 2015, respectively.
Note 2. Summary of Significant Accounting Policies
These financial statements are prepared in accordance with accounting principles generally accepted in the United States of America ("GAAP"), which require management to make estimates and assumptions that affect the reported amounts of assets and liabilities, the disclosure of contingent liabilities at the date of the financial statements, and the reported amounts of increases and decreases in net assets from operations during the fiscal period. Actual amounts could differ from those estimates. The following summarizes the significant accounting policies of each Fund:
Security Valuation – Exchange-traded securities and over-the-counter securities are valued using the last quoted trade or official closing price, provided by independent pricing services as of the close of trading on the market or exchange for which they are primarily traded, on each Fund business day. In the absence of a sale, such securities are valued at the mean of the last bid and ask price provided by independent pricing services. Non-exchange-traded securities for which quotations are available are valued using the last quoted sales price, or in the absence of a sale, at the mean of the last bid and ask prices provided by independent pricing services. Debt securities may be valued at prices supplied by a fund's pricing agent based on broker or dealer supplied valuations or evaluated bid pricing. Shares of open-end mutual funds are valued at net asset value ("NAV"). Short-term investments that mature in 60 days or less may be valued at amortized cost.
Each Fund values its investments at fair value pursuant to procedures adopted by the Trust's Board of Trustees (the "Board") if (1) market quotations are insufficient or not readily available or (2) the adviser believes that the values available are unreliable. The Trust's Valuation Committee, as defined in each Fund's registration statement, performs certain functions as they relate to the administration and oversight of each Fund's valuation procedures. Under these procedures, the Valuation Committee convenes on a regular and ad-hoc basis to review such investments and considers a number of factors, including valuation methodologies and significant unobservable inputs, when arriving at fair value.
The Valuation Committee may work with the adviser to provide valuation inputs. In determining fair valuations, inputs may include market-based analytics which may consider related or comparable assets or liabilities, recent transactions, market multiples, book values and other relevant investment information. Adviser inputs may include an income-based approach in which the anticipated future cash flows of the investment are discounted in determining fair value. Discounts may also be applied based on the nature or duration of any restrictions on the disposition of the investments. The Valuation Committee performs regular reviews of valuation methodologies, key inputs and assumptions, disposition analysis and market activity.
Fair valuation is based on subjective factors and, as a result, the fair value price of an investment may differ from the security's market price and may not be the price at which the asset may be sold. Fair valuation could result in a different NAV than a NAV determined by using market quotes.
Each Fund has a three-tier fair value hierarchy. The basis of the tiers is dependent upon the various "inputs" used to determine the value of each Fund's investments. These inputs are summarized in the three broad levels listed below:
Level 1 — quoted prices in active markets for identical assets and liabilities
Level 2 — other significant observable inputs (including quoted prices of similar securities, interest rates, prepayment speeds, credit risk, etc.)
Level 3 — significant unobservable inputs (including each Fund's own assumptions in determining the fair value of investments)
The aggregate value by input level, as of March 31, 2016, for each Fund's investments is included at the end of each Fund's schedule of investments.
Security Transactions, Investment Income and Realized Gain and Loss – Investment transactions are accounted for on the trade date. Dividend income is recorded on the ex-dividend date. Interest income is recorded on an accrual basis. Premium is amortized and discount is accreted using the effective interest method. Identified cost of investments sold is used to determine the gain and loss for both financial statement and federal income tax purposes.
Distributions to Shareholders – Distributions to shareholders of net investment income, if any, are declared daily and paid monthly. Distributions to shareholders of net capital gains, if any, are declared and paid annually. Distributions to shareholders are recorded on the ex-dividend date. Distributions are based on amounts calculated in accordance with applicable federal income tax regulations, which may differ from GAAP. These differences are due primarily to differing treatments of income and gain on various investment securities held by each Fund, timing differences and differing characterizations of distributions made by each Fund.
Federal Taxes – Each Fund intends to qualify each year as a regulated investment company under Subchapter M of the Internal Revenue Code of 1986, as amended ("Code") and to distribute all of their taxable income to shareholders. In addition, by distributing in each calendar year substantially all of their net investment income and capital gains, if any, the Funds will not be subject to a federal excise tax. Therefore, no federal income or excise tax provision is required. Each Fund files a U.S. federal income and excise tax return as required. A fund's federal income tax returns are subject to examination by the Internal Revenue Service for a period of three fiscal years after they are filed. As of March 31, 2016, there are no uncertain tax positions that would require financial statement recognition, de-recognition, or disclosure.
Income and Expense Allocation – The Trust accounts separately for the assets, liabilities and operations of each of its investment portfolios. Expenses that are directly attributable to more than one investment portfolio are allocated among the respective investment portfolios in an equitable manner.
Offering Costs – Offering costs of $67,862, $60,947, $30,398 and $22,494 for the Gurtin National Municipal Value Fund, Gurtin California Municipal Value Fund, Gurtin National Municipal Intermediate Value Fund and Gurtin California Municipal Intermediate Value Fund, respectively, consist of fees related to certain startup legal costs, initial registration filings, and printing and mailing of the initial prospectus. Such costs are amortized over a twelve-month period beginning with the commencement of operations of the Funds. During the period ended March 31, 2016, the Gurtin National Municipal Value Fund, Gurtin California Municipal Value Fund, Gurtin National Municipal Intermediate Value Fund and Gurtin California Municipal Intermediate Value Fund expensed $5,655, $5,079, $15,776 and $17,642, respectively.
Commitments and Contingencies – In the normal course of business, each Fund enters into contracts that provide general indemnifications by each Fund to the counterparty to the contract. Each Fund's maximum exposure under these arrangements is dependent on future claims that may be made against each Fund and, therefore, cannot be estimated; however, based on experience, the risk of loss from such claims is considered remote.
Note 3. Fees and Expenses
Investment Adviser – Gurtin Fixed Income Management, LLC (the "Adviser") is the investment adviser to the Funds. Pursuant to an Investment Advisory Agreement, the Adviser receives an advisory fee at an annual rate of 0.45% of the average daily net assets of Gurtin National Municipal Value Fund and Gurtin California Municipal Value Fund and 0.35% of the average daily net assets of Gurtin National Municipal Intermediate Value Fund and Gurtin California Municipal Intermediate Value Fund.
Distribution – Foreside Fund Services, LLC serves as each Fund's distributor (the "Distributor"). The Funds have adopted a Distribution Plan (the "Plan") for Investor Shares in accordance with Rule 12b-1 of the Act. Under the Plan, the Funds pay the Distributor and/or any other entity as authorized by the Board a fee of up to 0.25% of the average daily net assets of Investor Shares. The Distributor is not affiliated with the Adviser or Atlantic Fund Administration, LLC (d/b/a Atlantic Fund Services) ("Atlantic") or their affiliates.
Other Service Providers – Atlantic provides fund accounting, fund administration, compliance and transfer agency services to each Fund. Atlantic also provides certain shareholder report production, and EDGAR conversion and filing services. Pursuant to an Atlantic services agreement, each Fund pays Atlantic customary fees for its services. Atlantic provides a Principal Executive Officer, a Principal Financial Officer, a Chief Compliance Officer, and an Anti-Money Laundering Officer to each Fund, as well as certain additional compliance support functions.
Trustees and Officers – The Trust pays each Independent Trustee an annual fee of $16,000 ($21,000 for the Chairman). The Independent Trustees and Chairman may receive additional fees for special Board meetings. The Independent Trustees are also reimbursed for all reasonable out-of-pocket expenses incurred in connection with their duties as Trustees, including travel and related expenses incurred in attending Board meetings. The amount of Independent Trustees' fees attributable to each Fund is disclosed in the Statements of Operations. Certain officers of the Trust are also officers or employees of the above named service providers, and during their terms of office received no compensation from each Fund.
Note 4. Expense Reimbursement and Fees Waived
The Adviser has contractually agreed to waive a portion of its fee and reimburse certain expenses to limit total annual operating expenses (excluding all taxes, interest, portfolio transaction expenses, acquired fund fees and expenses, proxy expense and extraordinary expenses) to 0.60% and 0.85% of average daily net assets through January 28, 2017, of the Gurtin National Municipal Value Fund and Gurtin California Municipal Value Fund's Institutional Shares and Investor Shares, respectively and to 0.39% of average daily net assets through January 28, 2017, of the Gurtin National Municipal Intermediate Value Fund and Gurtin California Municipal Intermediate Value Fund's Institutional and Investor Shares. Other fund service providers have voluntarily agreed to waive a portion of their fees. Voluntary fee waivers may be reduced or
eliminated at any time. For the period ended March 31, 2016, fees waived were as follows:
| Fund | Investment Adviser Fees Waived | Investment Adviser Expenses Reimbursed | Other Waivers | Total Fees Waived and/or Expenses Reimbursed | ||||||||
| Gurtin National Municipal Value Fund | $ | 69,587 | $ | - | $ | 10,944 | $ | 80,531 | ||||
| Gurtin California Municipal Value Fund | 61,819 | - | 25,634 | 87,453 | ||||||||
| Gurtin National Municipal Intermediate Value Fund | 27,948 | 57,121 | 3,442 | 88,511 | ||||||||
| Gurtin Calfornia Municipal Intermediate Value Fund | 23,972 | 91,106 | 6,293 | 121,371 | ||||||||
Note 5. Security Transactions
The cost of purchases and proceeds from sales of investment securities (including maturities), other than short-term investments during the period ended March 31, 2016, were as follows:

| Purchases | Sales | |||||
| Gurtin National Municipal Value Fund | $ | 32,813,062 | $ | 32,410,101 | ||
| Gurtin California Municipal Value Fund | 45,528,199 | 44,549,786 | ||||
| Gurtin National Municipal Intermediate Value Fund | 36,517,301 | 2,007,973 | ||||
| Gurtin California Municipal Intermediate Value Fund | 31,154,324 | 1,253,523 | ||||
Note 6. Federal Income Tax
As of September 30, 2015, distributable earnings (accumulated loss) on a tax basis were as follows:
| Other Temporary Differences | Undistributed Tax Exempt Income | Undistributed Ordinary Income | Capital and Other Losses | Unrealized Appreciation | Total | |||||||||||||||||
| Gurtin National Municipal Value Fund | $ | (12,959) | $ | 11,081 | $ | 1,883 | $ | (16,111 | ) | $ | 2,256,597 | $ | 2,240,491 | |||||||||
| Gurtin California Municipal Value Fund | (17,255) | 14,669 | 2,603 | (87,342 | ) | 5,235,607 | 5,148,282 | |||||||||||||||
As of March 31, 2016, distributable earnings (accumulated loss) on a tax basis were as follows:
| Other Temporary Differences | Undistributed Tax Exempt Income | Undistributed Ordinary Income | Unrealized Appreciation | Total | ||||||||||||||
| Gurtin National Municipal Intermediate Value Fund | $ | (3,276) | $ | 3,154 | $ | 9,922 | $ | 310,045 | $ | 319,845 | ||||||||
| Gurtin California Municipal Intermediate Value Fund | (546) | 516 | 5,753 | 206,372 | 212,095 | |||||||||||||
The difference between components of distributable earnings on a tax basis and the amounts reflected in the Statements of Assets and Liabilities are primarily due to end of period distributions payable in each Fund.
Gurtin National Municipal Value Fund and Gurtin California Municipal Value Fund have $1,195 and $67,365 respectively, of available short-term capital loss carryforwards and $14,916 and $19,977, respectively of available long-term capital loss carryforwards that have no expiration date.
Note 7. Subsequent Events
Subsequent events occurring after the date of this report through the date these financial statements were issued have been evaluated for potential impact and each Fund has had no such events.
Investment Advisory Agreement Approval
The investment advisory agreement between the investment adviser and the Trust, must be approved for initial terms no greater than two years, and must be renewed at least annually thereafter by the vote of the Trustees, including a majority of the Trustees who are not parties to the agreements or "interested persons" of any party thereto (the "Independent Trustees").
On September 10, 2015, the Board met in person, with independent legal counsel to the Independent Trustees ("Independent Legal Counsel"), representatives of the Adviser, and others to consider information related to the approval of the investment advisory agreement between the Trust, on behalf of Gurtin National Municipal Intermediate Value Fund and Gurtin California Muncipal Intermediate Value Fund (together, the "Gurtin Funds"), and the Adviser for the performance of investment advisory services to the Funds. A description of the Board's conclusions in approving the agreements follows.
In preparation for its September meeting of the Board of Trustees of the Trust ("September Meeting"), the Trustees were presented with a wide range of information to assist in their deliberations. Those materials included information from Lipper Inc. ("Lipper"), a leading independent source of data about the mutual fund industry, which compared the Gurtin Funds' proposed investment advisory fee and total expense ratios with an appropriate group of peer funds that were selected by Lipper. The materials also included other information regarding the fee arrangement. The Trustees also received a memorandum from Independent Legal Counsel concerning their responsibilities with respect to the approval of the investment advisory agreement, and met in executive session with Independent Legal Counsel while deliberating.
The Board also reviewed information that was provided by the Adviser concerning the following:
| · | The terms of the proposed investment advisory agreement, including the fees payable under the agreement, and the commitment of the Adviser to provide expense caps and fee waivers for the Gurtin Funds; |
| · | The nature and extent of the services to be provided by the Adviser, including information about the investment objective, policies and strategies applicable to the Gurtin Funds; |
| · | The personnel of the Adviser, including educational background, experience in the investment management industry, and the ability of the Adviser to retain qualified personnel; |
| · | The compliance program of the Adviser; |
| · | The financial condition and stability of the Adviser; |
| · | The potential for the Adviser to derive benefits that are ancillary to serving as an investment adviser to the Gurtin Funds; |
| · | The investment performance of the Adviser with respect to other managed accounts investing in fixed income securities, including two existing series of the Trust, and the investing philosophy of the Adviser; and |
| · | The profitability of the Adviser from the advisory fee to be paid by each of the Gurtin Funds. |
At the September Meeting, the Trustees reviewed, evaluated, and discussed among themselves and with the Adviser and Independent Legal Counsel, among other things, the information referenced above. The Trustees also considered the overall reputation, capabilities, and commitment of the Adviser to provide high-quality service to the Gurtin Funds. After discussion and consideration amongst themselves, and with the Adviser and Independent Legal Counsel, the Independent Trustees concluded that the nature and extent of the investment advisory services to be provided by the Adviser to the Gurtin Funds would be appropriate and consistent with the terms of the investment advisory agreement, including the amount of fees to be paid under the advisory agreement. At the September Meeting, the Board unanimously approved the investment advisory agreement. The Independent Trustees agreed that no single factor was determinative of their decision to approve the investment advisory agreement.
Proxy Voting Information
A description of the policies and procedures that each Fund uses to determine how to vote proxies relating to securities held in each Fund's portfolio is available, without charge and upon request, by calling (844) 342-5763 and on the U.S. Securities and Exchange Commission's (the "SEC") website at www.sec.gov. Each Fund's proxy voting record for the period from each Fund's commencement of operations to June 30 is available, without charge and upon request, by calling (844) 342-5763 and on the SEC's website at www.sec.gov.
Availability of Quarterly Portfolio Schedules
Each Fund files its complete schedule of portfolio holdings with the SEC for the first and third quarters of each fiscal year on Form N-Q. These filings are available, without charge and upon request on the SEC's website at www.sec.gov or may be reviewed and copied at the SEC's Public Reference Room in Washington, DC. Information on the operation of the Public Reference Room may be obtained by calling (800) SEC-0330.
Shareholder Expense Example
As a shareholder of the Funds, you incur ongoing costs, including management fees, distribution and/or service (12b-1) fees (for Investor Shares only) and other Fund expenses. This example is intended to help you understand your ongoing costs (in dollars) of investing in the Funds and to compare these costs with the ongoing costs of investing in other mutual funds.
The example is based on an investment of $1,000 invested at the beginning of the period and held for the entire period from October 1, 2015 (Gurtin National Municipal Value Fund and Gurtin California Municipal Value Fund), December 1, 2015 (commencment of operations for Gurtin National Municipal Intermediate Value Fund) and December 7, 2015 (commencement of operations for Gurtin California Municipal Intermediate Value Fund), through March 31, 2016.
Actual Expenses – The first line of the table below provides information about actual account values and actual expenses. You may use the information in this line, together with the amount you invested, to estimate the expenses that you paid over the period. Simply divide your account value by $1,000 (for example, an $8,600 account value divided by $1,000 = 8.6), then multiply the result by the number in the first line under the heading entitled "Expenses Paid During Period" to estimate the expenses you paid on your account during the period.
Hypothetical Example for Comparison Purposes – The second line of the table below provides information about hypothetical account values and hypothetical expenses based on each Fund's actual expense ratio and an assumed rate of return of 5% per year before expenses, which is not each Fund's actual return. The hypothetical account values and expenses may not be used to estimate the actual ending account balance or expenses you paid for the period. You may use this information to compare the ongoing costs of investing in each Fund and other funds. To do so, compare this 5% hypothetical example with the 5% hypothetical examples that appear in the shareholder reports of other funds.
Please note that the expenses shown in the table are meant to highlight your ongoing costs only. Therefore, the second line of the table is useful in comparing ongoing costs only, and will not help you determine the relative total costs of owning different funds.
Beginning Account Value October 1, 2015 | Ending Account Value March 31, 2016 | Expenses Paid During Period * | Annualized Expense Ratio * | |||||||||||
| Gurtin National Municipal Value Fund | ||||||||||||||
| Actual | $ | 1,000.00 | $ | 1,017.85 | $ | 3.03 | 0.60% | |||||||
Hypothetical (5% return before expenses) | $ | 1,000.00 | $ | 1,022.00 | $ | 3.03 | 0.60% | |||||||
| Gurtin California Municipal Value Fund | ||||||||||||||
| Actual | $ | 1,000.00 | $ | 1,021.69 | $ | 3.03 | 0.60% | |||||||
Hypothetical (5% return before expenses) | $ | 1,000.00 | $ | 1,022.00 | $ | 3.03 | 0.60% | |||||||
| * | Expenses are equal to each Fund's annualized expense ratio as indicated above multiplied by the average account value over the period, multiplied by the number of days in the most recent fiscal half-year divided by 366 to reflect the half-year period. |
Beginning Account Value December 1, 2015 | Ending Account Value March 31, 2016 | Expenses Paid During Period ** | Annualized Expense Ratio ** | |||||||||||
| Gurtin National Municipal Intermediate Value Fund | ||||||||||||||
| Actual | $ | 1,000.00 | $ | 1,014.80 | $ | 1.30 | 0.39% | |||||||
Hypothetical (5% return before expenses) | $ | 1,000.00 | $ | 1,023.05 | $ | 1.97 | 0.39% | |||||||
| ** | Expenses are equal to the Fund's annualized expense ratio as indicated above multiplied by the average account value over the period, multiplied by the number of days in the most recent fiscal half-year divided by 366 to reflect the half-year period (except that the average account values reflect the Fund's actual return information for the 121-day period between December 1, 2015, the commencement date of Fund operations, through March 31, 2016). |
Beginning Account Value December 7, 2015 | Ending Account Value March 31, 2016 | Expenses Paid During Period *** | Annualized Expense Ratio*** | |||||||||||
| Gurtin California Municipal Intermediate Value Fund | ||||||||||||||
| Actual | $ | 1,000.00 | $ | 1,015.28 | $ | 1.23 | 0.39% | |||||||
Hypothetical (5% return before expenses) | $ | 1,000.00 | $ | 1,023.05 | $ | 1.97 | 0.39% | |||||||
| *** | Expenses are equal to the Fund's annualized expense ratio as indicated above multiplied by the average account value over the period, multiplied by the number of days in the most recent fiscal half-year divided by 366 to reflect the half-year period (except that the average account values reflect the Fund's actual return information for the 115-day period between December 7, 2015, the commencement date of Fund operations, through March 31, 2016). |
FOR MORE INFORMATION
Investment Adviser
Gurtin Fixed Income Management, LLC
440 Stevens Avenue, Suite 260
Solana Beach, CA 92075
www.gurtin.com
Transfer Agent
Atlantic Fund Services, LLC
P.O. Box 588
Portland, ME 04112
www.atlanticfundservices.com
Distributor
Foreside Fund Services, LLC
Three Canal Plaza, Suite 100
Portland, ME 04101
www.foreside.com
Gurtin National Municipal Value Fund
Gurtin California Municipal Value Fund
Gurtin National Municipal Intermediate Value Fund
Gurtin California Municipal Intermediate Value Fund
P.O. Box 588
Portland, ME 04112
(844) 342-5763
223-SAR-0316 This report is submitted for the general information of the shareholders of the Funds. It is not authorized for distribution to prospective investors unless preceded or accompanied by an effective prospectus, which includes information regarding the Funds' risks, objectives, fees and expenses, experience of its management, and other information.
BAYWOOD VALUEPLUS FUND A MESSAGE TO OUR SHAREHOLDERS MARCH 31, 2016 |
Dear Shareholder,
We are pleased to report our economic and financial market perspectives and the investment activities for the Baywood ValuePlus Fund (the "Fund") for the six months ended March 31, 2016. The Fund is a large-capitalization value fund that purchases primarily dividend-paying companies traded on U.S. exchanges and uses SKBA's Relative Dividend Yield (RDY) discipline as the initial valuation framework. We believe that RDY points out attractive investment opportunities, not simply among companies with above-average dividend yield, but just as importantly among stocks for which low expectations are already discounted into their valuations at the time of purchase. This provides the potential for attractive capital appreciation opportunities.
The rapid swings in investor sentiment were once again on display over the six-month period ended March 31, 2016. Over this period, the Fund's two share classes exceeded the returns of its primary benchmark, the Russell 1000 Value and performed above median, compared to the Morningstar Large-Cap Value category of funds.
Much of the market's volatility during the period appeared to be chained to the movements in oil prices, rallying in the 4th quarter of 2015 with the short-term rise in energy prices, followed by the renewed plunge in oil prices and the stock market in January and February of 2016. Yet, in the 4th quarter of 2015, there was no greater event—albeit widely anticipated—than the Federal Reserve Board's decision to end its Zero Interest Rate Policy (ZIRP). The end came at its December meeting at which the Fed raised the Fed Funds rate target to essentially 25 basis points. Of course, the market couldn't quite figure out whether it should be singing hosannas for this action or predicting a coming economic calamity. "Ho-hum, it's about time," was our response. But the talk of four rate increases in 2016 spooked the market. Both the S&P 500 and the Russell 1000 Value plunged over 10% in the first six weeks of 2016 only to reverse gears in the final six weeks to post gains greater than 13%, which recovered all of the prior loss and then some. "As goes January, so goes the year," is a typical refrain, yet the market turned on a dime from the February 11th bottom and ascended for the final six weeks. Now that's a rollercoaster ride!
Clearly defensive stocks held up best early in the new year and energy stocks the worst during the sharp decline, but after Fed Chairman Yellen signaled there would be no March increase in the Fed Funds target rate, interest sensitive, cyclical and energy stocks led the rebound. Fed policy decisions seem to be designed to avoid conflict with the European Central Bank chief Draghi's shift to negative interest rates in Europe rather than the plan to normalize rates in the U.S. We have believed that the Fed's ZIRP policy in effect courted excessive borrowing by high-yield borrowers, a dangerous trend. Contrary to the general perception, a move away from ZIRP should be good for credit discipline and ultimately the real economy.
Yet the market's volatility and decline brought forth new opportunities to add companies whose stock prices plunged in January. Whereas we added no new stocks to the portfolio in the 4th quarter of 2015, four new companies were added in the first quarter of 2016. The worldwide recession in commodity industries provided us with the opportunity to add Packaging Corp. and Union Pacific to the portfolio. Both stocks significantly underperformed the market in 2015 and in January. Texas Instruments was swapped for ST Microelectronics, and HealthSouth Corp. (medical rehabilitation centers) was swapped for pharmaceutical distributor, Cardinal Health. These changes pushed the portfolio in a slight more pro-cyclical direction, and as a whole, contributed positively to the portfolio's relative performance during the rebound from the February lows.
Over the six months, the greatest positive relative return contribution came from the health care sector, followed by consumer cyclicals, energy and financials. From consumer cyclicals, energy and health care, the return contribution came primarily from stock selection, whereas in the financial sector—which produced a negative return of the period—the outperformance came from being significantly underweight, nearly 8% under the worst performing sector. While the financial sector features many inexpensive stocks in the banking and insurance industry segments, the unlocking of these attractive valuations is highly dependent upon the Federal Reserve Board's progress toward "normalizing" interest rates. Every time the Fed stretches out its timetable, financial stocks underperform. For the banks, the problem today is that loan losses, particularly from the energy sector, are rising while net interest margins remain depressed—hence our decision to remain underweighted.
There were few winners among financial sector stocks. The portfolio, however, benefited from the completion of two acquisitions announced in 2015: Sumitomo Life Insurance bought insurer Symetra Financial for cash, and Swiss property/casualty insurer ACE bought Chubb for cash and ACE shares. ACE then promptly changed the new company's name back to Chubb. We retained our holdings in the new Chubb Ltd. In addition, just before the end of the quarter, MetLife received a huge court victory in its battle to remove its "Systemically Important Financial Institution" designation (SIFI) when the judge ruled that the Financial Stability Oversight Council had not properly justified its decision to classify Met as a SIFI. This court ruling bodes well for the future ability of Met to manage its business, raise its dividend rate and position its capital structure to benefit shareholders.
1 |
BAYWOOD VALUEPLUS FUND A MESSAGE TO OUR SHAREHOLDERS MARCH 31, 2016 |
The greatest headwind to relative performance in the six-month period came from our underweight position in the utility sector as electric and gas utilities posted strong absolute return, up over 17%. Although the 23% gain in Exelon was among best performing stocks in the entire sector, our underweight of the sector hurt relative performance. Most utility stocks acted defensively early in the first quarter but then continued to benefit from their interest sensitivity as the Fed cut back on the previously expected 2016 increases in the Fed Funds rate. In our view, these short-term beneficial impacts are unlikely to be sustained unless the economy falters and actually heads into recession, which we believe is a relatively low probability event. As a result, we held fast to our underweighted position.
Overall, individual securities produced a wide dispersion in returns. In addition to the strong gains and contributions of Chubb, Exelon, and Symetra, the performances of a diversified group of stocks lead the positive return contributions to the portfolio, including Albermarle, Eaton, Goldcorp and Mattel. In contrast, the most significant negative returns came from Boeing, Chemours (after being spun out from DuPont), M&T Bank and Eli Lilly. Lilly, one of our largest holdings, was affected by the political debate surrounding industry pricing for lifesaving drugs and procedures rather than deteriorating business. While we trimmed holdings in Eli Lilly after its strong price advance over the prior year, we have maintained most of our holdings health care.
One cannot complete the discussion of the six-month period without also noting the Fund started the 4th quarter modestly underweight the Russell 1000 Value in the energy sector but ended the 1st quarter overweight the Sector. With the downdraft in crude oil prices toward $25 per barrel in January, energy stocks followed suit. We did not, however, change our long-held view that oil would eventually return to a more normal price level near $80 per barrel. Thus as stock prices fell, we added to our positions in the companies with the strongest balance sheets, Chevron, Exxon and Schlumberger. These purchases shifted our sector weight from an equal-weighted position at the start of the quarter to a modest overweight at the end of the quarter. With either another round of price declines or with the continuation of the "lower for longer" environment, we would be likely to further add to our holdings in energy stocks.
The outlook for the economy in 2016 appears to be "more of the same" subpar growth of the past six years, and with the market's overall valuation no longer inexpensive, we believe single-digit market returns are likely to characterize the market over the next 3-5 years. We remain pleased that despite the turmoil in the stock market over the last six months, our deliberate and thoughtful investment process lead to more stable returns and outperformance versus our value benchmark.
For more detailed information on SKBA Capital Management, LLC and our investment process and perspectives, visit our website at www.SKBA.com.
Current and future portfolio holdings are subject to change and risk.
The Morningstar category is used to compare fund performance to its peers. It is not possible to invest directly into an index or category. Past performance is no guarantee of future results.
Risk Considerations: Mutual fund investing involves risk, including the possible loss of principal. The Fund primarily invests in undervalued securities, which may not appreciate in value as anticipated by the Advisor or remain undervalued for longer than anticipated. The Fund may invest in American Depositary Receipts (ADRs), which involves risks relating to political, economic or regulatory conditions in foreign countries and may cause greater volatility and less liquidity. The Fund may also invest in convertible securities and preferred stock, which may be adversely affected as interest rates rise.
2 |
BAYWOOD VALUEPLUS FUND SCHEDULE OF INVESTMENTS MARCH 31, 2016 |
| Shares | Security Description | Value |
| Common Stock - 96.4% | |||||||
| Basic Materials - 7.1% | |||||||
| 500 | Albemarle Corp. | $ | 31,965 | ||||
| 1,400 | Goldcorp, Inc. | 22,722 | |||||
| 300 | LyondellBasell Industries NV, Class A | 25,674 | |||||
| 500 | Packaging Corp. of America | 30,200 | |||||
| 700 | Weyerhaeuser Co. REIT | 21,686 | |||||
| 132,247 | |||||||
| Capital Goods / Industrials - 11.1% | |||||||
| 200 | Caterpillar, Inc. | 15,308 | |||||
| 600 | Eaton Corp. PLC | 37,536 | |||||
| 900 | Republic Services, Inc. | 42,885 | |||||
| 400 | Stanley Black & Decker, Inc. | 42,084 | |||||
| 400 | The Boeing Co. | 50,776 | |||||
| 200 | Union Pacific Corp. | 15,910 | |||||
| 204,499 | |||||||
| Consumer Cyclicals - 4.9% | |||||||
| 2,500 | Ford Motor Co. | 33,750 | |||||
| 700 | Mattel, Inc. | 23,534 | |||||
| 400 | Target Corp. | 32,912 | |||||
| 90,196 | |||||||
| Consumer Staples - 8.9% | |||||||
| 100 | Molson Coors Brewing Co., Class B | 9,618 | |||||
| 500 | PepsiCo, Inc. | 51,240 | |||||
| 600 | The Procter & Gamble Co. | 49,386 | |||||
| 800 | Wal-Mart Stores, Inc. | 54,792 | |||||
| 165,036 | |||||||
| Energy - 14.2% | |||||||
| 1,300 | BP PLC, ADR | 39,234 | |||||
| 75 | California Resources Corp. | 77 | |||||
| 500 | Chevron Corp. | 47,700 | |||||
| 500 | Exxon Mobil Corp. | 41,795 | |||||
| 700 | National Oilwell Varco, Inc. | 21,770 | |||||
| 800 | Occidental Petroleum Corp. | 54,744 | |||||
| 400 | Phillips 66 | 34,636 | |||||
| 300 | Schlumberger, Ltd. | 22,125 | |||||
| 262,081 | |||||||
| Financials - 18.7% | |||||||
| 1,000 | BB&T Corp. | 33,270 | |||||
| 300 | BOK Financial Corp. | 16,386 | |||||
| 240 | Chubb, Ltd. | 28,596 | |||||
| 800 | FNF Group | 27,120 | |||||
| 1,000 | Invesco, Ltd. | 30,770 | |||||
| 400 | JPMorgan Chase & Co. | 23,688 | |||||
| 500 | M&T Bank Corp. | 55,500 | |||||
| 1,200 | MetLife, Inc. | 52,728 | |||||
| 1,100 | U.S. Bancorp | 44,649 | |||||
| 700 | Wells Fargo & Co. | 33,852 | |||||
| 346,559 | |||||||
| Shares | Security Description | Value |
| Health Care - 12.7% | |||||||
| 800 | AbbVie, Inc. | $ | 45,696 | ||||
| 500 | Baxalta, Inc. | 20,200 | |||||
| 700 | Baxter International, Inc. | 28,756 | |||||
| 300 | Becton Dickinson and Co. | 45,546 | |||||
| 600 | Eli Lilly & Co. | 43,206 | |||||
| 500 | HealthSouth Corp. | 18,815 | |||||
| 300 | Johnson & Johnson | 32,460 | |||||
| 234,679 | |||||||
| Technology - 14.3% | |||||||
| 1,900 | Cisco Systems, Inc. | 54,093 | |||||
| 300 | Harris Corp. | 23,358 | |||||
| 200 | International Business Machines Corp. | 30,290 | |||||
| 1,200 | Microsoft Corp. | 66,276 | |||||
| 700 | QUALCOMM, Inc. | 35,798 | |||||
| 600 | TE Connectivity, Ltd. | 37,152 | |||||
| 300 | Texas Instruments, Inc. | 17,226 | |||||
| 264,193 | |||||||
| Telecommunications - 2.9% | |||||||
| 1,000 | Verizon Communications, Inc. | 54,080 | |||||
| Utilities - 1.6% | |||||||
| 800 | Exelon Corp. | 28,688 | |||||
Total Common Stock (Cost $1,722,545) | 1,782,258 |
| Money Market Fund - 2.6% | |||||||
| 47,360 | Federated Government Obligations Fund, 0.20% (a) (Cost $47,360) | 47,360 | |||||
Total Investments - 99.0% (Cost $1,769,905)* | $ | 1,829,618 |
| Other Assets & Liabilities, Net – 1.0% | 19,257 | ||
| Net Assets – 100.0% | $ | 1,848,875 |
| ADR | American Depositary Receipt |
| PLC | Public Limited Company |
| REIT | Real Estate Investment Trust |
| (a) | Variable rate security. Rate presented is as of March 31, 2016. |
* Cost for federal income tax purposes is substantially the same as for financial statement purposes and net unrealized appreciation consists of:
| Gross Unrealized Appreciation | $ | 153,361 | ||
| Gross Unrealized Depreciation | (93,648 | ) | ||
| Net Unrealized Appreciation | $ | 59,713 |
The following is a summary of the inputs used to value the Fund's investments as of March 31, 2016.
The inputs or methodology used for valuing securities are not necessarily an indication of the risks associated with investing in those securities. For more information on valuation inputs, and their aggregation into the levels used in the table below, please
See Notes to Financial Statements. | 3 |
BAYWOOD VALUEPLUS FUND SCHEDULE OF INVESTMENTS MARCH 31, 2016 |
refer to the Security Valuation section in Note 2 of the accompanying Notes to Financial Statements.
| Valuation Inputs | Investments in Securities |
| Level 1 - Quoted Prices | $ | 1,782,258 | ||
| Level 2 - Other Significant Observable Inputs | 47,360 | |||
| Level 3 - Significant Unobservable Inputs | - | |||
| Total | $ | 1,829,618 |
The Level 1 value displayed in this table is Common Stock. The Level 2 value displayed in this table is a Money Market Fund. Refer to this Schedule of Investments for a further breakout of each security by industry.
The Fund utilizes the end of period methodology when determining transfers. There were no transfers among Level 1, Level 2 and Level 3 for the period ended March 31, 2016.
AFA
| PORTFOLIO HOLDINGS | ||
| % of Total Investments | ||
| Basic Materials | 7.2 | % |
| Capital Goods / Industrials | 11.2 | % |
| Consumer Cyclicals | 4.9 | % |
| Consumer Staples | 9.0 | % |
| Energy | 14.3 | % |
| Financials | 19.0 | % |
| Health Care | 12.8 | % |
| Technology | 14.4 | % |
| Telecommunications | 3.0 | % |
| Utilities | 1.6 | % |
| Money Market Fund | 2.6 | % |
| 100.0 | % |
See Notes to Financial Statements. | 4 |
BAYWOOD VALUEPLUS FUND STATEMENT OF ASSETS AND LIABILITIES MARCH 31, 2016 |
| ASSETS | ||||||
| Total investments, at value (Cost $1,769,905) | $ | 1,829,618 | ||||
| Receivables: | ||||||
| Fund shares sold | 1,347 | |||||
| Dividends | 2,475 | |||||
| From investment advisor | 11,985 | |||||
| Prepaid expenses | 20,967 | |||||
| Total Assets | 1,866,392 | |||||
| LIABILITIES | ||||||
| Accrued Liabilities: | ||||||
| Trustees' fees and expenses | 142 | |||||
| Fund services fees | 7,529 | |||||
| Other expenses | 9,846 | |||||
| Total Liabilities | 17,517 | |||||
| NET ASSETS | $ | 1,848,875 | ||||
| COMPONENTS OF NET ASSETS | ||||||
| Paid-in capital | $ | 1,795,452 | ||||
| Distributions in excess of net investment income | (47 | ) | ||||
| Accumulated net realized loss | (6,243 | ) | ||||
| Net unrealized appreciation | 59,713 | |||||
| NET ASSETS | $ | 1,848,875 | ||||
| SHARES OF BENEFICIAL INTEREST AT NO PAR VALUE (UNLIMITED SHARES AUTHORIZED) | ||||||
| Investor Shares | 94,160 | |||||
| Institutional Shares | 33,106 | |||||
| NET ASSET VALUE, OFFERING AND REDEMPTION PRICE PER SHARE | ||||||
| Investor Shares (based on net assets of $1,366,441) | $ | 14.51 | ||||
| Institutional Shares (based on net assets of $482,434) | $ | 14.57 | ||||
See Notes to Financial Statements. | 5 |
BAYWOOD VALUEPLUS FUND STATEMENT OF OPERATIONS PERIOD ENDED MARCH 31, 2016* |
| INVESTMENT INCOME | |||||||
| Dividend income (Net of foreign withholding taxes of $118) | . | $ | 17,572 | ||||
| Total Investment Income | 17,572 | ||||||
| EXPENSES | |||||||
| Investment advisor fees | 2,876 | ||||||
| Fund services fees | 24,824 | ||||||
| Transfer agent fees: | |||||||
| Investor Shares | 5,963 | ||||||
| Institutional Shares | 6,172 | ||||||
| Distribution fees: | |||||||
| Investor Shares | 1,089 | ||||||
| Custodian fees | 1,887 | ||||||
| Registration fees: | |||||||
| Investor Shares | 4,807 | ||||||
| Institutional Shares | 4,998 | ||||||
| Professional fees | 10,278 | ||||||
| Trustees' fees and expenses | 1,501 | ||||||
| Miscellaneous expenses | 7,080 | ||||||
| Total Expenses | 71,475 | ||||||
| Fees waived and expenses reimbursed | (66,358 | ) | |||||
| Net Expenses | 5,117 | ||||||
| NET INVESTMENT INCOME | 12,455 | ||||||
| NET REALIZED AND UNREALIZED GAIN (LOSS) | |||||||
| Net realized gain on investments | 32,731 | ||||||
| Net change in unrealized appreciation (depreciation) on investments | (35,346 | ) | |||||
| NET REALIZED AND UNREALIZED LOSS | (2,615 | ) | |||||
| INCREASE IN NET ASSETS RESULTING FROM OPERATIONS | $ | 9,840 | |||||
| * | Effective March 24, 2016, the Fund changed its fiscal year end from November 30 to September 30. The information presented is for the period December 1, 2015 to March 31, 2016. | ||||||
See Notes to Financial Statements. | 6 |
BAYWOOD VALUEPLUS FUND STATEMENTS OF CHANGES IN NET ASSETS |
For the Period* Ended March 31, 2016 | For the Year Ended November 30, 2015 | ||||||||||
| OPERATIONS | |||||||||||
| Net investment income | $ | 12,455 | $ | 215,300 | |||||||
| Net realized gain | 32,731 | 1,216,102 | |||||||||
| Net change in unrealized appreciation (depreciation) | (35,346 | ) | (2,370,562 | ) | |||||||
| Increase (Decrease) in Net Assets Resulting from Operations | 9,840 | (939,160 | ) | ||||||||
| DISTRIBUTIONS TO SHAREHOLDERS FROM | |||||||||||
| Net investment income: | |||||||||||
| Investor Shares | (169,336 | ) | (21,548 | ) | |||||||
| Institutional Shares | (54,165 | ) | (215,813 | ) | |||||||
| Net realized gain: | |||||||||||
| Investor Shares | (30,026 | ) | (106,575 | ) | |||||||
| Institutional Shares | (9,339 | ) | (795,111 | ) | |||||||
| Total Distributions to Shareholders | (262,866 | ) | (1,139,047 | ) | |||||||
| CAPITAL SHARE TRANSACTIONS | |||||||||||
| Sale of shares: | |||||||||||
| Investor Shares | 215 | - | |||||||||
| Institutional Shares | 66,324 | 1,666,328 | |||||||||
| Reinvestment of distributions: | |||||||||||
| Investor Shares | 199,362 | 128,123 | |||||||||
| Institutional Shares | 63,504 | 1,010,924 | |||||||||
| Redemption of shares: | |||||||||||
| Investor Shares | - | (54,025 | ) | ||||||||
| Institutional Shares | (15,019 | ) | (11,423,874 | ) | |||||||
| Increase (Decrease) in Net Assets from Capital Share Transactions | 314,386 | (8,672,524 | ) | ||||||||
| Increase (Decrease) in Net Assets | 61,360 | (10,750,731 | ) | ||||||||
| NET ASSETS | |||||||||||
| Beginning of Period | 1,787,515 | 12,538,246 | |||||||||
| End of Period (Including line (a)) | $ | 1,848,875 | $ | 1,787,515 | |||||||
| SHARE TRANSACTIONS | |||||||||||
| Sale of shares: | |||||||||||
| Investor Shares | 16 | - | |||||||||
| Institutional Shares | 4,761 | 95,363 | |||||||||
| Reinvestment of distributions: | |||||||||||
| Investor Shares | 13,581 | 7,383 | |||||||||
| Institutional Shares | 4,311 | 57,782 | |||||||||
| Redemption of shares: | |||||||||||
| Investor Shares | - | (3,097 | ) | ||||||||
| Institutional Shares | (1,023 | ) | (697,866 | ) | |||||||
| Increase (Decrease) in Shares | 21,646 | (540,435 | ) | ||||||||
| (a) | Undistributed (distributions in excess of) net investment income | $ | (47 | ) | $ | 210,999 | |||||
| * | Effective March 24, 2016, the Fund changed its fiscal year end from November 30 to September 30. The information presented is for the period December 1, 2015 to March 31, 2016. | ||||||||||
See Notes to Financial Statements. | 7 |
BAYWOOD VALUEPLUS FUND FINANCIAL HIGHLIGHTS |
| These financial highlights reflect selected data for a share outstanding throughout each period. | |||||||||||||
For the Period Ended March 31, 2016 (a) | For the Year Ended November 30, 2015 | December 2, 2013 (b) Through November 30, 2014 | |||||||||||
| INVESTOR SHARES | |||||||||||||
| NET ASSET VALUE, Beginning of Period | $ | 16.90 | $ | 19.28 | $ | 17.47 | |||||||
| INVESTMENT OPERATIONS | |||||||||||||
| Net investment income (c) | 0.10 | 0.34 | 0.36 | ||||||||||
| Net realized and unrealized gain (loss) | (0.07 | ) | (1.06 | ) | 1.49 | ||||||||
| Total from Investment Operations | 0.03 | (0.72 | ) | 1.85 | |||||||||
| DISTRIBUTIONS TO SHAREHOLDERS FROM | |||||||||||||
| Net investment income | (2.05 | ) | (0.26 | ) | (0.04 | ) | |||||||
| Net realized gain | (0.37 | ) | (1.40 | ) | — | ||||||||
| Total Distributions to Shareholders | (2.42 | ) | (1.66 | ) | (0.04 | ) | |||||||
| NET ASSET VALUE, End of Period | $ | 14.51 | $ | 16.90 | $ | 19.28 | |||||||
| TOTAL RETURN | (0.73 | )%(d) | (3.86 | )% | 10.59 | %(d) | |||||||
| RATIOS/SUPPLEMENTARY DATA | |||||||||||||
| Net Assets at End of Period (000's omitted) | $1,366 | $1,362 | $1,471 | ||||||||||
| Ratios to Average Net Assets: | |||||||||||||
| Net investment income | 2.11 | %(e) | 1.97 | % | 1.98 | %(e) | |||||||
| Net expenses | 0.95 | %(e) | 0.95 | % | 0.95 | %(e) | |||||||
| Gross expenses (f) | 11.02 | %(e) | 5.80 | % | 4.54 | %(e) | |||||||
| PORTFOLIO TURNOVER RATE | 10 | %(d) | 32 | % | 35 | %(d) | |||||||
| (a) | Effective March 24, 2016, the Fund changed its fiscal year end from November 30 to September 30. The information presented is for the period December 1, 2015 to March 31, 2016. | ||||||||||||
| (b) | Commencement of operations. | ||||||||||||
| (c) | Calculated based on average shares outstanding during each period. | ||||||||||||
| (d) | Not annualized. | ||||||||||||
| (e) | Annualized. | ||||||||||||
| (f) | Reflects the expense ratio excluding any waivers and/or reimbursements. | ||||||||||||
See Notes to Financial Statements. | 8 |
BAYWOOD VALUEPLUS FUND FINANCIAL HIGHLIGHTS |
| These financial highlights reflect selected data for a share outstanding throughout each period. | |||||||||||||
For the Period Ended March 31, 2016 (a) | For the Year Ended November 30, 2015 | December 2, 2013 (b) Through November 30, 2014 | |||||||||||
| INSTITUTIONAL SHARES | |||||||||||||
| NET ASSET VALUE, Beginning of Period | $ | 17.00 | $ | 19.42 | $ | 17.56 | |||||||
| INVESTMENT OPERATIONS | |||||||||||||
| Net investment income (c) | 0.11 | 0.39 | 0.41 | ||||||||||
| Net realized and unrealized gain (loss) | (0.07 | ) | (1.06 | ) | 1.50 | ||||||||
| Total from Investment Operations | 0.04 | (0.67 | ) | �� | 1.91 | ||||||||
| DISTRIBUTIONS TO SHAREHOLDERS FROM | |||||||||||||
| Net investment income | (2.10 | ) | (0.35 | ) | (0.05 | ) | |||||||
| Net realized gain | (0.37 | ) | (1.40 | ) | — | ||||||||
| Total Distributions to Shareholders | (2.47 | ) | (1.75 | ) | (0.05 | ) | |||||||
| NET ASSET VALUE, End of Period | $ | 14.57 | $ | 17.00 | $ | 19.42 | |||||||
| TOTAL RETURN | (0.58 | )%(d) | (3.58 | )% | 10.87 | %(d) | |||||||
| RATIOS/SUPPLEMENTARY DATA | |||||||||||||
| Net Assets at End of Period (000's omitted) | $482 | $426 | $11,067 | ||||||||||
| Ratios to Average Net Assets: | |||||||||||||
| Net investment income | 2.35 | %(e) | 2.23 | % | 2.26 | %(e) | |||||||
| Net expenses | 0.70 | %(e) | 0.70 | % | 0.70 | %(e) | |||||||
| Gross expenses (f) | 16.86 | %(e) | 2.09 | % | 2.50 | %(e) | |||||||
| PORTFOLIO TURNOVER RATE | 10 | %(d) | 32 | % | 35 | %(d) | |||||||
| (a) | Effective March 24, 2016, the Fund changed its fiscal year end from November 30 to September 30. The information presented is for the period December 1, 2015 through March 31, 2016 | ||||||||||||
| (b) | Commencement of operations. | ||||||||||||
| (c) | Calculated based on average shares outstanding during each period. | ||||||||||||
| (d) | Not annualized. | ||||||||||||
| (e) | Annualized. | ||||||||||||
| (f) | Reflects the expense ratio excluding any waivers and/or reimbursements. | ||||||||||||
See Notes to Financial Statements. | 9 |
BAYWOOD SOCIALLYRESPONSIBLE FUND A MESSAGE TO OUR SHAREHOLDERS MARCH 31, 2016 |
Dear Shareholder,
This letter covering the six months ended March 31, 2016 is SKBA Capital Management's ("SKBA") first commentary regarding the economic and financial market perspectives and the investment activities for the Baywood SociallyResponsible Fund (the "Fund"). This report also marks a new chapter in the organization of the Fund as SKBA was pleased to be elected, effective January 8, 2016, the Advisor to the renamed Baywood SociallyResponsible Fund. We have long desired to become the Advisor to align our goals with those of our clients and shareholders through every aspect of fund management. During the transition, however, large client flows caused a material negative impact on Fund performance from November of 2015 and through February of 2016. Yet SKBA has remained steadfast in its application of our investment approach to meet the needs of shareholders who desire to have ESG (environmental, social, and governance) criteria apply to the stock selection decisions in the Fund.
The Fund is a mid-to-large capitalization value-oriented portfolio of stock holdings selected from a universe of stocks created through the application of social screens and assessments of the ESG profile of each company. Among these stocks, we further evaluate and assess each prospective holding's valuation and fundamental business attraction to determine the current portfolio holdings. Over the years we have learned to take the good and the bad periods in stride but to always trust that our long-term perspective, value discipline, socially aware and consistent process will meet our clients' goals and needs. As the new Advisor to the Fund we will do everything within our control to ensure we are aware of client commitments and intentions. In March, having emerged from the transition, we are looking forward to a fresh start as Advisor together with the shareholders in the Fund.
In selecting investments, we consider social criteria such as an issuer's community relations, corporate governance, employee diversity, employee relations, environmental impact and sustainability, human rights record and product safety. Using both quantitative and qualitative data, we also evaluate an issuer's involvement in specific revenue generating activities to determine whether the issuer's involvement was meaningful or incidental with respect to that activity.
We apply vigorous valuation screens that identify issuers for further in-depth fundamental analysis for potential inclusion in the Fund. The investment strategy typically emphasizes securities that we believe have one or more of the following characteristics: a price significantly below the intrinsic value of the issuer; below average or historical price to sales and price to cash flow ratios; and sound overall financial condition of the issuer.
The Fund seeks to avoid investing in any issuer that derives more than 5% of its total revenue from tobacco, alcohol, gambling, abortion or weaponry (whether sold to consumers or the military), or that is involved in nuclear power. Because information on an issuer's involvement in those activities may not always be publicly available, it is possible that the Fund's holdings may include an issuer that does not meet its criteria for socially responsible investing. When we discover that a holding does not meet the criteria for socially responsible investing, we will divest that holding as soon as reasonably viable.
Since the initial Fed rate hike, surprisingly, interest rates have declined on the long end, leading to a flattening of the yield curve. The lift-off, it seems, has fallen flat on its face. A flat yield curve has deleterious effects for banks as the spread they earn by lending long-term and borrowing short-term compresses. As such, financials represented the greatest source of underperformance for the Russell 1000 Value benchmark, declining 5.4% while the overall benchmark advanced 1.6%.
Over the last several quarters we have reduced our exposure to financials as increased rate volatility clouds the outlook for the companies dependent on the level and direction of interest rates. Two holdings in the financial sector, Symetra and HCC were acquired by other insurers, both of which contributed significantly to the Fund's performance over the years. We did not re-deploy the cash consideration into the sector, thus lowering the weight. Furthermore, we have re-balanced the sector towards capital allocators like Brookfield Asset Management which benefit from a low cost of capital and away from asset-sensitive companies like Symetra. As a result of these moves, the financial sector represented one of the greatest sources of positive relative performance for the first quarter 2016.
Much of the underperformance in the six-month period can be attributed to two holdings: AutoNation and Starz. AutoNation is the nation's largest publicly traded auto dealer and is on the path to consolidate the highly fragmented industry. During the first quarter its stock price was pressured from comments made by its CEO, Mike Jackson, on the general direction of the automotive market. While the level of annual car sales may be nearing a peak, the thesis for our investment in AutoNation goes beyond the level of annual car sales. As the nation's largest dealer group, its overall market share remains only 2%. To say there is room for more consolidation is an understatement. It is currently building out the first website to allow customers to purchase autos entirely online while at the same time disintermediating third party reference companies like TrueCar and Auto Trader. AutoNation generates high cash flows and almost 70% of its profits come from car maintenance and finance which are more likely to remain stable if annual
10 |
BAYWOOD SOCIALLYRESPONSIBLE FUND A MESSAGE TO OUR SHAREHOLDERS MARCH 31, 2016 |
car sales begin to flatten or even decline. We used the opportunity to add to our position in the first quarter and unless there are unanticipated changes in the industry, we will likely continue to do so when the opportunity arises.
The majority of the impact from Starz's decline occurred in the 1st quarter of 2016 as the stock fell nearly 20% on the rumor that it was going to merge with Lions Gate for stock consideration and subsequent to Lions Gate reporting underwhelming earnings. We found the sharp decline in the price of Starz disappointing since it had nothing to do with Starz fundamentals, and therefore we used the opportunity to increase our position. Media in general has been out-of-favor and consequently has been a source of opportunity for value managers like us. Starz has improved its fundamentals which, in the long-run, should translate into pricing power and likely higher valuation multiples. Directionally we like where both companies will be five years from now and if the short-termism that undermines the market continues to pressure stock prices, they may likely become even bigger positions.
A source of positive relative performance was from our holdings in the health care sector. The outperformance is primarily attributed to one holding: Baxter. We acquired Baxter because we thought the market was not valuing its biopharmaceutical segment appropriately and from a sum-of-the parts methodology, it was significantly undervalued. Baxter eventually spun off Baxalta, which then agreed to be acquired by Shire for a meaningful premium, lending credence to our hypothesis. Both of these shares returned greater than 25% for the 6-month period, while the overall health care sector returned 6%.
We added a number of new companies to the portfolio in the period, one of which is Packaging Corp. It is a vertically-integrated manufacturer of corrugated container board, or, as it is most commonly referred to as: cardboard boxes. These are the same cardboard boxes you receive when ordering online which likely end up in the recycling bin. As our society continues to move away from making purchases at physical stores towards online stores, companies like Packaging Corp. stand to benefit. The worldwide recession in commodity industries provided the opportunity to add Packaging Corp. to the portfolio at relatively attractive prices. Furthermore, a significant portion of boxes made from corrugated container board are subsequently recycled to make new boxes.
The commodity business recession's effects are broad-based. Of particular interest to us are railroad companies which transport goods. Railroad stocks, in general, have not been this out-of-favor in more than two decades due to low commodity prices and the collapse of the coal industry. As a result, we added Union Pacific to the portfolio in the recent period. Union Pacific operates what is basically a duopoly in western United States railroad transportation and, as it continues to upgrade its fleets and rails making it more efficient and reliable, volumes and prices should revert back to normal. Furthermore, rails are the most efficient mode of long-haul transportation. Trains are four-times more efficient than trucks and can move nearly 1 ton of freight 500 miles on 1 gallon of diesel. This naturally means they pollute less and helps to eliminate congestion on the freeways!
Whether it is in commodities, technology, energy or financials, volatility is likely to continue. However, volatility can provide opportunities, such as our purchases in Union Pacific and Packaging Corps, when at times it can be deleterious in the short-run, like it was for AutoNation and Starz. We will continue to manage for the long-term and will use the volatility to position the portfolio in our clients' favor. We will use prudence and care to find investments worthy of a position in our Baywood SociallyResponsible strategy with favorable Environmental, Social and Governance profiles.
For more detailed information on SKBA Capital Management, LLC and our investment process and perspectives, visit our website at www.SKBA.com.
Current and future portfolio holdings are subject to change and risk.
The Morningstar category is used to compare fund performance to its peers. It is not possible to invest directly into an index or category. Past performance is no guarantee of future results.
Risk Considerations: Mutual fund investing involves risk, including the possible loss of principal. The Fund primarily invests in undervalued securities, which may not appreciate in value as anticipated by the Advisor or remain undervalued for longer than anticipated. The Fund may invest in American Depositary Receipts (ADRs), which involves risks relating to political, economic or regulatory conditions in foreign countries and may cause greater volatility and less liquidity. The Fund may also invest in convertible securities and preferred stock, which may be adversely affected as interest rates rise.
11 |
BAYWOOD SOCIALLYRESPONSIBLE FUND SCHEDULE OF INVESTMENTS MARCH 31, 2016 |
| Shares | Security Description | Value |
| Common Stock - 92.3% | |||||||
| Basic Materials - 3.6% | |||||||
| 3,600 | Albemarle Corp. | $ | 230,148 | ||||
| 5,400 | Packaging Corp. of America | 326,160 | |||||
| 556,308 | |||||||
| Capital Goods / Industrials - 10.1% | |||||||
| 8,200 | Republic Services, Inc. | 390,730 | |||||
| 3,000 | Stanley Black & Decker, Inc. | 315,630 | |||||
| 7,475 | Tyco International PLC | 274,407 | |||||
| 1,700 | Union Pacific Corp. | 135,235 | |||||
| 10,100 | USG Corp. (a) | 250,581 | |||||
| 13,000 | Wesco Aircraft Holdings, Inc. (a) | 187,070 | |||||
| 1,553,653 | |||||||
| Consumer Cyclicals - 5.7% | |||||||
| 9,300 | AutoNation, Inc. (a) | 434,124 | |||||
| 21,900 | Ford Motor Co. | 295,650 | |||||
| 1,800 | Target Corp. | 148,104 | |||||
| 877,878 | |||||||
| Consumer Discretionary- 5.0% | |||||||
| 18,100 | Starz (a) | 476,573 | |||||
| 10,700 | Twenty-First Century Fox, Inc., Class B | 301,740 | |||||
| 778,313 | |||||||
| Consumer Staples - 6.3% | |||||||
| 2,500 | CVS Health Corp. | 259,325 | |||||
| 3,900 | PepsiCo, Inc. | 399,672 | |||||
| 3,800 | The Procter & Gamble Co. | 312,778 | |||||
| 971,775 | |||||||
| Energy - 8.2% | |||||||
| 12,700 | Cabot Oil & Gas Corp. | 288,417 | |||||
| 2,600 | ConocoPhillips | 104,702 | |||||
| 16,300 | Devon Energy Corp. | 447,272 | |||||
| 7,300 | National Oilwell Varco, Inc. | 227,030 | |||||
| 1,200 | Phillips 66 | 103,908 | |||||
| 3,000 | Spectra Energy Corp. | 91,800 | |||||
| 1,263,129 | |||||||
| Financials - 19.4% | |||||||
| 12,100 | Air Lease Corp. | 388,652 | |||||
| 5,900 | American Express Co. | 362,260 | |||||
| 7,100 | American International Group, Inc. | 383,755 | |||||
| 30,900 | Bank of America Corp. | 417,768 | |||||
| 1,600 | Berkshire Hathaway, Inc., Class B (a) | 227,008 | |||||
| 9,150 | Brookfield Asset Management, Inc., Class A | 318,329 | |||||
| 16,200 | Kennedy-Wilson Holdings, Inc. | 354,780 | |||||
| 2,600 | M&T Bank Corp. | 288,600 | |||||
| 6,000 | MetLife, Inc. | 263,640 | |||||
| 3,004,792 | |||||||
| Health Care - 17.4% | |||||||
| 6,000 | AbbVie, Inc. | 342,720 | |||||
| 6,200 | Baxalta, Inc. | 250,480 | |||||
| Shares | Security Description | Value |
| 8,700 | Baxter International, Inc. | $ | 357,396 | ||||
| 2,900 | Becton Dickinson and Co. | 440,278 | |||||
| 4,800 | DaVita HealthCare Partners, Inc. (a) | 352,224 | |||||
| 5,000 | Express Scripts Holding Co. (a) | 343,450 | |||||
| 1,900 | Gilead Sciences, Inc. | 174,534 | |||||
| 11,200 | HealthSouth Corp. | 421,456 | |||||
| 2,682,538 | |||||||
| Technology - 13.8% | |||||||
| 12,900 | Cisco Systems, Inc. | 367,263 | |||||
| 13,300 | Corning, Inc. | 277,837 | |||||
| 1,200 | International Business Machines Corp. | 181,740 | |||||
| 7,200 | Microsoft Corp. | 397,656 | |||||
| 6,000 | Oracle Corp. | 245,460 | |||||
| 7,300 | QUALCOMM, Inc. | 373,322 | |||||
| 4,700 | TE Connectivity, Ltd. | 291,024 | |||||
| 2,134,302 | |||||||
| Telecommunications - 2.8% | |||||||
| 8,000 | Verizon Communications, Inc. | 432,640 | |||||
Total Common Stock (Cost $14,589,593) | 14,255,328 |
| Money Market Fund - 7.9% | |||||||
| 1,228,761 | Morgan Stanley Institutional Liquidity Fund, 0.25% (b) (Cost $1,228,761) | 1,228,761 | |||||
Total Investments - 100.2% (Cost $15,818,354)* | $ | 15,484,089 |
The following is a summary of the inputs used to value the Fund's investments as of March 31, 2016.
The inputs or methodology used for valuing securities are not necessarily an indication of the risks associated with investing in those securities. For more information on valuation inputs, and their aggregation into the levels used in the table below, please refer to the Security Valuation section in Note 2 of the accompanying Notes to Financial Statements.
| Valuation Inputs | Investments in Securities |
| Level 1 - Quoted Prices | $ | 14,255,328 | ||
| Level 2 - Other Significant Observable Inputs | 1,228,761 | |||
| Level 3 - Significant Unobservable Inputs | - | |||
| Total | $ | 15,484,089 |
The Level 1 value displayed in this table is Common Stock. The Level 2 value displayed in this table is a Money Market Fund. Refer to this Schedule of Investments for a further breakout of each security by industry.
The Fund utilizes the end of period methodology when determining transfers. There were no transfers among Level Level 1, Level 2 and Level 3 for the period ended March 31, 2016.
| PORTFOLIO HOLDINGS | ||
| % of Total Investments | ||
| Basic Materials | 3.6 | % |
| Capital Goods / Industrials | 10.0 | % |
| Consumer Cyclicals | 5.7 | % |
| Consumer Discretionary | 5.0 | % |
| Consumer Staples | 6.3 | % |
| Energy | 8.2 | % |
| Financials | 19.4 | % |
| Health Care | 17.3 | % |
| Technology | 13.8 | % |
| Telecommunications | 2.8 | % |
| Money Market Funds | 7.9 | % |
| 100.0 | % |
See Notes to Financial Statements. | 13 |
BAYWOOD SOCIALLYRESPONSIBLE FUND STATEMENT OF ASSETS AND LIABILITIES MARCH 31, 2016 |
| ASSETS | ||||||
| Total investments, at value (Cost $15,818,354) | $ | 15,484,089 | ||||
| Receivables: | ||||||
| Fund shares sold | 7,413 | |||||
| Investment securities sold | 41,905 | |||||
| Dividends | 19,741 | |||||
| Total Assets | 15,553,148 | |||||
| LIABILITIES | ||||||
| Payables: | ||||||
| Investment securities purchased | 85,865 | |||||
| Fund shares redeemed | 6,453 | |||||
| Accrued Liabilities: | ||||||
| Investment advisor fees | 904 | |||||
| Trustees' fees and expenses | 43 | |||||
| Fund services fees | 5,059 | |||||
| Other expenses | 7,201 | |||||
| Total Liabilities | 105,525 | |||||
| NET ASSETS | $ | 15,447,623 | ||||
| COMPONENTS OF NET ASSETS | ||||||
| Paid-in capital | $ | 17,281,780 | ||||
| Distributions in excess of net investment income | (442 | ) | ||||
| Accumulated net realized loss | (1,499,450 | ) | ||||
| Net unrealized depreciation | (334,265 | ) | ||||
| NET ASSETS | $ | 15,447,623 | ||||
| SHARES OF BENEFICIAL INTEREST AT NO PAR VALUE (UNLIMITED SHARES AUTHORIZED) | ||||||
| Investor Shares | 1,054,408 | |||||
| Institutional Shares | 600,484 | |||||
| NET ASSET VALUE, OFFERING AND REDEMPTION PRICE PER SHARE | ||||||
| Investor Shares (based on net assets of $9,838,547) | $ | 9.33 | ||||
| Institutional Shares (based on net assets of $5,609,076) | $ | 9.34 | ||||
See Notes to Financial Statements. | 14 |
BAYWOOD SOCIALLYRESPONSIBLE FUND STATEMENT OF OPERATIONS PERIOD ENDED MARCH 31, 2016 |
| INVESTMENT INCOME | |||||||
| Dividend income (Net of foreign withholding taxes of $561) | $ | 1,085,902 | |||||
| Total Investment Income | 1,085,902 | ||||||
| EXPENSES | |||||||
| Investment advisor fees | 365,287 | ||||||
| Fund services fees | 56,120 | ||||||
| Transfer agent fees: | |||||||
| Investor Shares | 6,583 | ||||||
| Institutional Shares | 8,357 | ||||||
| Distribution fees: | |||||||
| Investor Shares | 22,451 | ||||||
| Custodian fees | 4,082 | ||||||
| Registration fees: | |||||||
| Investor Shares | 8,504 | ||||||
| Institutional Shares | 6,687 | ||||||
| Professional fees | 3,399 | ||||||
| Trustees' fees and expenses | 10,708 | ||||||
| Miscellaneous expenses | 11,841 | ||||||
| Total Expenses | 504,019 | ||||||
| Fees waived and expenses reimbursed | (34,290 | ) | |||||
| Net Expenses | 469,729 | ||||||
| NET INVESTMENT INCOME | 616,173 | ||||||
| NET REALIZED AND UNREALIZED GAIN (LOSS) | |||||||
| Net realized loss on investments | (1,381,742 | ) | |||||
| Net change in unrealized appreciation (depreciation) on investments | 14,318,184 | ||||||
| NET REALIZED AND UNREALIZED GAIN | 12,936,442 | ||||||
| INCREASE IN NET ASSETS RESULTING FROM OPERATIONS | $ | 13,552,615 | |||||
See Notes to Financial Statements. | 15 |
BAYWOOD SOCIALLYRESPONSIBLE FUND STATEMENT OF CHANGES IN NET ASSETS |
For the Six Months Ended March 31, 2016 | For the Year Ended September 30, 2015 | ||||||||||
| OPERATIONS | |||||||||||
| Net investment income | $ | 616,173 | $ | 3,150,847 | |||||||
| Net realized gain (loss) | (1,381,742 | ) | 2,738,120 | ||||||||
| Net change in unrealized appreciation (depreciation) | 14,318,184 | (28,300,346 | ) | ||||||||
| Increase (Decrease) in Net Assets Resulting from Operations | 13,552,615 | (22,411,379 | ) | ||||||||
| DISTRIBUTIONS TO SHAREHOLDERS FROM | |||||||||||
| Net investment income: | |||||||||||
| Investor Shares | (504,180 | ) | (2,845,377 | ) | |||||||
| Institutional Shares | (189,319 | ) | (240,990 | ) | |||||||
| Net realized gain: | |||||||||||
| Investor Shares | (1,155,096 | ) | (5,652,223 | ) | |||||||
| Institutional Shares | (750,918 | ) | (671,508 | ) | |||||||
| Total Distributions to Shareholders | (2,599,513 | ) | (9,410,098 | ) | |||||||
| CAPITAL SHARE TRANSACTIONS | |||||||||||
| Sale of shares: | |||||||||||
| Investor Shares | 8,034,576 | 4,091,705 | |||||||||
| Institutional Shares | 1,077,689 | 112,428,694 | |||||||||
| Reinvestment of distributions: | |||||||||||
| Investor Shares | 1,652,140 | 903,945 | |||||||||
| Institutional Shares | 920,261 | 8,463,173 | |||||||||
| Redemption of shares: | |||||||||||
| Investor Shares | (13,258,886 | ) | (5,829,516 | ) | |||||||
| Institutional Shares | (255,355,185 | ) | (26,406,009 | ) | |||||||
| Increase (Decrease) in Net Assets from Capital Share Transactions | (256,929,405 | ) | 93,651,992 | ||||||||
| Increase (Decrease) in Net Assets | (245,976,303 | ) | 61,830,515 | ||||||||
| NET ASSETS | |||||||||||
| Beginning of Period | 261,423,926 | 199,593,411 | |||||||||
| End of Period (Including line (a)) | $ | 15,447,623 | $ | 261,423,926 | |||||||
| SHARE TRANSACTIONS | |||||||||||
| Sale of shares: | |||||||||||
| Investor Shares | 119,628 | 363,291 | |||||||||
| Institutional Shares | 759,538 | 9,897,772 | |||||||||
| Reinvestment of distributions: | |||||||||||
| Investor Shares | 169,431 | 82,166 | |||||||||
| Institutional Shares | 93,832 | 767,412 | |||||||||
| Redemption of shares: | |||||||||||
| Investor Shares | (1,503,690 | ) | (519,232 | ) | |||||||
| Institutional Shares | (23,671,827 | ) | (2,343,458 | ) | |||||||
| Increase (Decrease) in Shares | (24,033,088 | ) | 8,247,951 | ||||||||
| (a) | Undistributed (distributions in excess of) net investment income | $ | (442 | ) | $ | 76,784 | |||||
See Notes to Financial Statements. | 16 |
BAYWOOD SOCIALLYRESPONSIBLE FUND FINANCIAL HIGHLIGHTS |
| These financial highlights reflect selected data for a share outstanding throughout each period. | ||||||||||||||||||||||||
For the Six Months Ended | For the Years Ended September 30, | |||||||||||||||||||||||
| INVESTOR SHARES | March 31, 2016 | 2015 | 2014 | 2013 | 2012 | 2011 | ||||||||||||||||||
| NET ASSET VALUE, Beginning of Period | $ | 10.16 | $ | 11.42 | $ | 12.26 | $ | 10.04 | $ | 8.37 | $ | 8.79 | ||||||||||||
| INVESTMENT OPERATIONS | ||||||||||||||||||||||||
| Net investment income (a) | 0.04 | 0.11 | 0.18 | 0.09 | 0.11 | 0.10 | ||||||||||||||||||
| Net realized and unrealized gain (loss) | (0.09 | )(b) | (0.98 | ) | 1.15 | 2.22 | 1.67 | (0.42 | ) | |||||||||||||||
| Total from Investment Operations | (0.05 | ) | (0.87 | ) | 1.33 | 2.31 | 1.78 | (0.32 | ) | |||||||||||||||
| DISTRIBUTIONS TO SHAREHOLDERS FROM | ||||||||||||||||||||||||
| Net investment income | (0.25 | ) | (0.10 | ) | (0.15 | ) | (0.09 | ) | (0.11 | ) | (0.10 | ) | ||||||||||||
| Net realized gain | (0.53 | ) | (0.29 | ) | (2.02 | ) | — | — | — | |||||||||||||||
| Total Distributions to Shareholders | (0.78 | ) | (0.39 | ) | (2.17 | ) | (0.09 | ) | (0.11 | ) | (0.10 | ) | ||||||||||||
| NET ASSET VALUE, End of Period | $ | 9.33 | $ | 10.16 | $ | 11.42 | $ | 12.26 | $ | 10.04 | $ | 8.37 | ||||||||||||
| TOTAL RETURN | (0.73 | )%(c) | (7.86 | )% | 12.11 | % | 23.12 | % | 21.28 | % | (3.80 | )% | ||||||||||||
| RATIOS/SUPPLEMENTARY DATA | ||||||||||||||||||||||||
| Net Assets at End of Period (000's omitted) | $9,839 | $23,045 | $26,763 | $31,387 | $25,631 | $3,132 | ||||||||||||||||||
| Ratios to Average Net Assets: | ||||||||||||||||||||||||
| Net investment income | 0.82 | %(d) | 0.99 | % | 1.55 | % | 0.81 | % | 1.13 | % | 1.05 | % | ||||||||||||
| Net expenses | 1.35 | %(d) | 1.14 | % | 1.14 | % | 1.13 | % | 1.15 | % | 1.13 | % | ||||||||||||
| Gross expenses (e) | 1.59 | %(d) | 1.37 | % | 1.46 | % | 1.38 | % | 1.40 | % | 1.39 | % | ||||||||||||
| PORTFOLIO TURNOVER RATE | 32 | %(c) | 29 | % | 34 | % | 42 | % | 38 | % | 22 | % | ||||||||||||
| (a) | Calculated based on average shares outstanding during each period. | |||||||||||||||||||||||
| (b) | The net realized and unrealized gain (loss) per share does not correlate to the aggregate of the net realized and unrealized loss in the Statement of Operations for the period ended March 31. 2016, primarily due to the timing of the sales and repurchases of the Fund's shares in relation to fluctuating market values for the Fund's portfolio. | |||||||||||||||||||||||
| (c) | Not annualized. | |||||||||||||||||||||||
| (d) | Annualized. | |||||||||||||||||||||||
| (e) | Reflects the expense ratio excluding any waivers and/or reimbursements. | |||||||||||||||||||||||
See Notes to Financial Statements. | 17 |
BAYWOOD SOCIALLYRESPONSIBLE FUND FINANCIAL HIGHLIGHTS |
| These financial highlights reflect selected data for a share outstanding throughout each period. | |||||||||||||||||||||||||
For the Six Months Ended | For the Years Ended September 30, | ||||||||||||||||||||||||
| INSTITUTIONAL SHARES | March 31, 2016 | 2015 | 2014 | 2013 | 2012 | 2011 | |||||||||||||||||||
| NET ASSET VALUE, Beginning of Period | $ | 10.18 | $ | 11.45 | $ | 12.28 | $ | 10.06 | $ | 8.38 | $ | 8.81 | |||||||||||||
| INVESTMENT OPERATIONS | |||||||||||||||||||||||||
| Net investment income (a) | 0.07 | 0.14 | 0.19 | 0.12 | 0.13 | 0.12 | |||||||||||||||||||
| Net realized and unrealized gain (loss) | (0.12 | )(b) | (0.99 | ) | 1.18 | 2.22 | 1.68 | (0.43 | ) | ||||||||||||||||
| Total from Investment Operations | (0.05 | ) | (0.85 | ) | 1.37 | 2.34 | 1.81 | (0.31 | ) | ||||||||||||||||
| DISTRIBUTIONS TO SHAREHOLDERS FROM | |||||||||||||||||||||||||
| Net investment income | (0.26 | ) | (0.13 | ) | (0.18 | ) | (0.12 | ) | (0.13 | ) | (0.12 | ) | |||||||||||||
| Net realized gain | (0.53 | ) | (0.29 | ) | (2.02 | ) | — | — | — | ||||||||||||||||
| Total Distributions to Shareholders | (0.79 | ) | (0.42 | ) | (2.20 | ) | (0.12 | ) | (0.13 | ) | (0.12 | ) | |||||||||||||
| NET ASSET VALUE, End of Period | $ | 9.34 | $ | 10.18 | $ | 11.45 | $ | 12.28 | $ | 10.06 | $ | 8.38 | |||||||||||||
| TOTAL RETURN | (0.71 | )%(c) | (7.70 | )% | 12.46 | % | 23.38 | % | 21.63 | % | (3.67 | )% | |||||||||||||
| RATIOS/SUPPLEMENTARY DATA | |||||||||||||||||||||||||
| Net Assets at End of Period (000's omitted) | $5,609 | $238,379 | $172,830 | $45,357 | $80,109 | $62,193 | |||||||||||||||||||
| Ratios to Average Net Assets: | |||||||||||||||||||||||||
| Net investment income | 1.38 | %(d) | 1.22 | % | 1.62 | % | 1.10 | % | 1.37 | % | 1.27 | % | |||||||||||||
| Net expenses | 0.89 | %(d) | 0.89 | % | 0.89 | % | 0.87 | % | 0.90 | % | 0.88 | % | |||||||||||||
| Gross expenses (e) | 0.92 | %(d) | 0.87 | %(f) | 0.96 | % | 0.87 | % | 0.90 | % | 0.89 | % | |||||||||||||
| PORTFOLIO TURNOVER RATE | 32 | %(c) | 29 | % | 34 | % | 42 | % | 38 | % | 22 | % | |||||||||||||
| (a) | Calculated based on average shares outstanding during each period. | ||||||||||||||||||||||||
| (b) | The net realized and unrealized gain (loss) per share does not correlate to the aggregate of the net realized and unrealized loss in the Statement of Operations for the period ended March 31. 2016, primarily due to the timing of the sales and repurchases of the Fund's shares in relation to fluctuating market values for the Fund's portfolio. | ||||||||||||||||||||||||
| (c) | Not annualized. | ||||||||||||||||||||||||
| (d) | Annualized. | ||||||||||||||||||||||||
| (e) | Reflects the expense ratio excluding any waivers and/or reimbursements. | ||||||||||||||||||||||||
| (f) | Ratio includes waivers and previously waived investment advisory fees recovered. The impact of the recovered fees may cause a higher net expense ratio. | ||||||||||||||||||||||||
See Notes to Financial Statements. | 18 |
BAYWOOD FUNDS NOTES TO FINANCIAL STATEMENTS MARCH 31, 2016 |
Note 1. Organization
Baywood ValuePlus Fund and Baywood SociallyResponsible Fund (individually, a "Fund" and collectively, the "Funds") are diversified portfolios of Forum Funds II (the "Trust"). The Trust is a Delaware statutory trust that is registered as an open-end, management investment company under the Investment Company Act of 1940 (the "Act"), as amended. Under its Trust Instrument, the Trust is authorized to issue an unlimited number of each Fund's shares of beneficial interest without par value. The Baywood ValuePlus Fund commenced operations on December 2, 2013. The Baywood ValuePlus Fund currently offers two classes of shares: Investor Shares and Institutional Shares. The Baywood ValuePlus Fund seeks to achieve long-term capital appreciation by investing in undervalued equity securities.
On December 2, 2013, the Baywood ValuePlus Fund commenced operations through a reorganization of a collective investment trust into the Baywood ValuePlus Fund. The collective investment trust was previously managed by the Baywood ValuePlus Fund's Advisor and portfolio management team. This collective investment trust was organized and commenced operations on June 27, 2008. The collective investment trust had an investment objective and strategies that were, in all material respects, identical to those of the Baywood ValuePlus Fund. The net assets and unrealized gain received by the Baywood ValuePlus Fund from this tax-free reorganization were as follows:
| Date of Contribution | Net Assets Investor Shares | Net Assets Institutional Shares | Shares Issued Investor Shares | Shares Issued Institutional Shares | Cost of Investments | Unrealized Gain on Investments | ||||||
| December 2, 2013 | $2,099,735 | $10,168,720 | 120,217 | 579,166 | $9,396,973 | $2,372,564 |
In addition to the securities transferred in, as noted above, $498,918 of cash and other receivables were also transferred in as part of the reorganization.
The Baywood SociallyResponsible Fund commenced operations on January 3, 2005. The Baywood SociallyResponsible Fund currently offers two classes of shares: Investor Shares and Institutional Shares. The Baywood SociallyResponsible Fund seeks to provide long-term capital growth.
On December 7, 2015, at a special meeting of Shareholders of Baywood SociallyResponsible Fund, formerly City National Rochdale Socially Responsible Equity Fund, a series of City National Rochdale Funds (the "Predecessor Fund"), the shareholders approved a proposal to reorganize the Predecessor Fund into the Baywood SociallyResponsible Fund, a newly created series of the Forum Funds II. The Predecessor Fund was sub-advised by the Fund's Advisor, SKBA Capital Management, LLC, with the same portfolio managers as Baywood SociallyResponsible Fund. The Baywood SociallyResponsible Fund is managed in a manner that is in all material respects equivalent to the management of the Predecessor Fund, including the investment objective, strategies, guidelines and restrictions. The primary purpose of the reorganization was to move the Predecessor Fund to a newly created series of Forum Funds II. As a result of the reorganization, the Baywood SociallyResponsible Fund is now operating under the supervision of a different board of trustees. On January 8, 2016, the Baywood SociallyResponsible Fund acquired all of the assets, subject to liabilities, of the Predecessor Fund. The shares of the Predecessor Fund were, in effect, exchanged on a tax-free basis for Shares of the Baywood SociallyResponsible Fund with the same aggregate value. No commission or other transactional fees were imposed on shareholders in connection with the tax-free exchange of their shares.
Note 2. Summary of Significant Accounting Policies
These financial statements are prepared in accordance with accounting principles generally accepted in the United States of America ("GAAP"), which require management to make estimates and assumptions that affect the reported amounts of assets and liabilities, the disclosure of contingent liabilities at the date of the financial statements, and the reported amounts of increases and decreases in net assets from operations during the fiscal period. Actual amounts could differ from those estimates. The following summarizes the significant accounting policies of each Fund:
Security Valuation – Exchange-traded securities and over-the-counter securities are valued using the last quoted trade or official closing price, provided by independent pricing services as of the close of trading on the market or exchange for which they are primarily traded, on each Fund business day. In the absence of a sale, such securities are valued at the mean of the last bid and ask price provided by independent pricing services. Non-exchange-traded securities for which quotations are available are valued using the last quoted sales price, or in the absence of a sale, at the mean of the last bid and ask prices provided by independent pricing services. Shares of open-end mutual funds are valued at net asset value ("NAV"). Short-term investments that mature in 60 days
19 |
BAYWOOD FUNDS NOTES TO FINANCIAL STATEMENTS MARCH 31, 2016 |
or less may be valued at amortized cost.
Each Fund values its investments at fair value pursuant to procedures adopted by the Trust's Board of Trustees (the "Board") if (1) market quotations are insufficient or not readily available or (2) the advisor believes that the values available are unreliable. The Trust's Valuation Committee, as defined in each Fund's registration statement, performs certain functions as they relate to the administration and oversight of each Fund's valuation procedures. Under these procedures, the Valuation Committee convenes on a regular and ad-hoc basis to review such investments and considers a number of factors, including valuation methodologies and significant unobservable inputs, when arriving at fair value.
The Valuation Committee may work with the advisor to provide valuation inputs. In determining fair valuations, inputs may include market-based analytics which may consider related or comparable assets or liabilities, recent transactions, market multiples, book values and other relevant investment information. Advisor inputs may include an income-based approach in which the anticipated future cash flows of the investment are discounted in determining fair value. Discounts may also be applied based on the nature or duration of any restrictions on the disposition of the investments. The Valuation Committee performs regular reviews of valuation methodologies, key inputs and assumptions, disposition analysis and market activity.
Fair valuation is based on subjective factors and, as a result, the fair value price of an investment may differ from the security's market price and may not be the price at which the asset may be sold. Fair valuation could result in a different NAV than a NAV determined by using market quotes.
Each Fund has a three-tier fair value hierarchy. The basis of the tiers is dependent upon the various "inputs" used to determine the value of each Fund's investments. These inputs are summarized in the three broad levels listed below:
Level 1 — quoted prices in active markets for identical assets and liabilities
Level 2 — other significant observable inputs (including quoted prices of similar securities, interest rates, prepayment speeds, credit risk, etc.)
Level 3 — significant unobservable inputs (including each Fund's own assumptions in determining the fair value of investments)
The aggregate value by input level, as of March 31, 2016, for each Fund's investments is included each Fund's Schedule of Investments.
Security Transactions, Investment Income and Realized Gain and Loss – Investment transactions are accounted for on the trade date. Dividend income is recorded on the ex-dividend date. Foreign dividend income is recorded on the ex-dividend date or as soon as possible after each Fund determines the existence of a dividend declaration after exercising reasonable due diligence. Income and capital gains on some foreign securities may be subject to foreign withholding taxes, which are accrued as applicable. Interest income is recorded on an accrual basis. Premium is amortized and discount is accreted using the effective interest method. Identified cost of investments sold is used to determine the gain and loss for both financial statement and federal income tax purposes.
Distributions to Shareholders – Distributions to shareholders of net investment income, if any, are declared and paid at least annually. Distributions to shareholders of net capital gains, if any, are declared and paid at least annually. Distributions to shareholders are recorded on the ex-dividend date. Distributions are based on amounts calculated in accordance with applicable federal income tax regulations, which may differ from GAAP. These differences are due primarily to differing treatments of income and gain on various investment securities held by each Fund, timing differences and differing characterizations of distributions made by each Fund.
Federal Taxes – Each Fund intends to qualify each year as a regulated investment company under Subchapter M of the Internal Revenue Code of 1986, as amended ("Code") and to distribute all of its taxable income to shareholders. In addition, by distributing in each calendar year substantially all of its net investment income and capital gains, if any, the Fund will not be subject to a federal excise tax. Therefore, no federal income or excise tax provision is required. Each Fund files a U.S. federal income and excise tax return as required. A fund's federal income tax returns are subject to examination by the Internal Revenue Service for a period of three fiscal years after they are filed. As of March 31, 2016, there are no uncertain tax positions that would require financial statement recognition, de-recognition, or disclosure.
Income and Expense Allocation – The Trust accounts separately for the assets, liabilities and operations of each of its investment portfolios. Expenses that are directly attributable to more than one investment portfolio are allocated among the respective investment portfolios in an equitable manner.
20 |
BAYWOOD FUNDS NOTES TO FINANCIAL STATEMENTS MARCH 31, 2016 |
The Fund's class-specific expenses are charged to the operations of that class of shares. Income and expenses (other than expenses attributable to a specific class) and realized and unrealized gains or losses on investments are allocated to each class of shares based on the class' respective net assets to the total net assets of each Fund.
Commitments and Contingencies – In the normal course of business, each Fund enters into contracts that provide general indemnifications by each Fund to the counterparty to the contract. Each Fund's maximum exposure under these arrangements is dependent on future claims that may be made against each Fund and, therefore, cannot be estimated; however, based on experience, the risk of loss from such claims is considered remote.
Note 3. Fees and Expenses
Investment Advisor – SKBA Capital Management, LLC (the "Advisor") is the investment advisor to the Funds. Pursuant to an Investment Advisory Agreement, the Advisor receives an advisory fee at an annual rate of 0.50% and 0.70% of the average daily net assets of Baywood ValuePlus Fund and Baywood SociallyResponsible Fund, respectively.
Distribution – Foreside Fund Services, LLC serves as each Fund's distributor (the "Distributor"). The Funds have adopted a Distribution Plan (the "Plan") in accordance with Rule 12b-1 of the Act. Under the Plan, each Fund may pay the Distributor and/or any other entity as authorized by the Board a fee of up to 0.25% of each Fund's average daily net assets of Investor Shares for providing distribution and/or shareholder services to the Funds. The Distributor is not affiliated with the Advisor or Atlantic Fund Administration, LLC (d/b/a Atlantic Fund Services) ("Atlantic") or their affiliates.
Other Service Providers – Atlantic provides fund accounting, fund administration, compliance and transfer agency services to each Fund. Atlantic also provides certain shareholder report production, and EDGAR conversion and filing services. Pursuant to an Atlantic services agreement, each Fund pays Atlantic customary fees for its services. Atlantic provides a Principal Executive Officer, a Principal Financial Officer, a Chief Compliance Officer, and an Anti-Money Laundering Officer to each Fund, as well as certain additional compliance support functions.
Trustees and Officers – The Trust pays each Independent Trustee an annual fee of $16,000 ($21,000 for the Chairman). The Independent Trustees and Chairman may receive additional fees for special Board meetings. The Independent Trustees are also reimbursed for all reasonable out-of-pocket expenses incurred in connection with their duties as Trustees, including travel and related expenses incurred in attending Board meetings. The amount of Independent Trustees' fees attributable to each Fund is disclosed in the Statements of Operations. Certain officers of the Trust are also officers or employees of the above named service providers, and during their terms of office received no compensation from each Fund.
Note 4. Expenses Reimbursed and Fees Waived
The Advisor has contractually agreed to waive its fee and/or reimburse certain expenses to limit total operating expenses (excluding all taxes, interest, portfolio transaction expenses, acquired fund fees and expenses, proxy expenses and extraordinary expenses) for Investor Shares to 0.95% and Institutional Shares to 0.70% through March 31, 2017 for Baywood ValuePlus Fund. Effective January 8, 2016, the Advisor also has contractually agreed to waive its fees and/or reimburse certain expenses to limit total operating expenses (excluding all taxes, interest, portfolio transaction expenses, acquired fund fees and expenses, proxy expenses and extraordinary expenses) for Investor Shares to 1.14% and Institutional Shares to 0.89% through December 31, 2017 for Baywood SociallyResponsible Fund. Other Fund service providers have voluntarily agreed to waive and reimburse a portion of their fees. These voluntary fee waivers and reimbursements may be reduced or eliminated at any time. For the period ended March 31, 2016, fees waived and expenses reimbursed were as follows:
| Investment Advisor Fees Waived | Investment Advisor Expenses Reimbursed | Other Waivers | Total Fees Waived and Expenses Reimbursed | |||||||||
Baywood ValuePlus Fund | $ | 2,876 | $ | 48,545 | $ | 14,937 | $ | 66,358 | ||||
Baywood SociallyResponsible Fund | 21,206 | 5,302 | 7,782 | 34,290 | ||||||||
The Funds may repay the Advisor for fees waived and expenses reimbursed pursuant to the expense cap if such payment is made within three years of the fee waiver or expense reimbursement, is approved by the Funds' Board of Trustees and the reimbursement does not cause the Funds' net annual operating expenses of that class to exceed the expense cap in place at the time the fees were waived. The amount of fees waived or expenses reimbursed eligible for recoupment are as follows:
21 |
BAYWOOD FUNDS NOTES TO FINANCIAL STATEMENTS MARCH 31, 2016 |
Baywood ValuePlus Fund | Amount of Fees Waived and/or Expenses Reimbursed | Expiration Date to Recoup Fees Waived and/or Expenses Reimbursed | Fees Recouped | ||||||
| November 30, 2014 | $ | 201,724 | November 30, 2017 | $ | - | ||||
| November 30, 2015 | $ | 140,556 | November 30, 2018 | $ | - | ||||
| March 31, 2016 | $ | 51,421 | September 30, 2019 | $ | - | ||||
Baywood SociallyResponsible Fund | Amount of Fees Waived and/or Expenses Reimbursed | Expiration Date to Recoup Fees Waived and/or Expenses Reimbursed | Fees Recouped | ||||||
| March 31, 2016 | $ | 26,508 | September 30, 2019 | $ | - | ||||
Note 5. Security Transactions
The cost of purchases and proceeds from sales of investment securities (including maturities), other than short-term investments during the period ended March 31, 2016, were as follows:
| Purchases | Sales | |||||
Baywood ValuePlus Fund | $ | 210,131 | $ | 163,844 | ||
Baywood SociallyResponsible Fund | 29,325,038 | 281,079,827 | ||||
Note 6. Federal Income Tax
As of November 30, 2015, distributable earnings (accumulated loss) for the Baywood ValuePlus Fund on a tax basis were as follows:
| Undistributed Ordinary Income | $ | 210,999 | ||
| Undistributed Long-Term Gain | 43,653 | |||
| Unrealized Appreciation | 51,797 | |||
| Total | $ | 306,449 | ||
The difference between components of distributable earnings on a tax basis and the amounts reflected in the Statement of Assets and Liabilities are primarily due to wash sales.
As of September 30, 2015, distributable earnings (accumulated loss) for the Baywood SociallyResponsible Fund on a tax basis were as follows:
| Undistributed Ordinary Income | $ | 76,792 | ||
| Undistributed Long-Term Gain | 1,788,307 | |||
| Unrealized Depreciation | (14,652,348 | ) | ||
| Total | $ | (12,787,249 | ) |
Note 7. Subsequent Events
Subsequent events occurring after the date of this report through the date these financial statements were issued have been evaluated for potential impact and each Fund has had no such events.
22 |
BAYWOOD FUNDS ADDITIONAL INFORMATION MARCH 31, 2016 |
Investment Advisory Agreement Approval
On September 10, 2015, the Trustees met in person with independent legal counsel to the Independent Trustees ("Independent Legal Counsel"), representatives of the Advisor, and others to consider information related to the approval of the investment advisory agreement between the Trust, on behalf of the Baywood SociallyResponsible Fund, and the Advisor for the performance of investment advisory services to the Baywood SociallyResponsible Fund. A description of the Board's conclusions in approving the agreement follows.
In preparation for its September meeting of the Board of Trustees of the Trust ("September Meeting"), the Trustees were presented with a range of information to assist in their deliberations. Those materials included a copy of the proposed investment advisory agreement and information from Lipper, Inc. ("Lipper"), a leading independent source of data about the mutual fund industry, which compared the 's proposed investment advisory fee and total expense ratio with an appropriate group of peer funds that were selected by Lipper. The materials also included other information regarding the fee arrangement. The Trustees also received a memorandum from Independent Legal Counsel concerning their responsibilities with respect to the approval of the investment advisory agreement. The Independent Trustees met in executive session with Independent Legal Counsel while deliberating.
The Board also reviewed information provided by the Advisor concerning the following:
| · | the reorganization of the Baywood SociallyResponsible Fund from an existing fund family into the Trust and discussions with the Advisor regarding proposed changes in the services, fees, or expenses, if any, with respect to the Baywood SociallyResponsible Fund as a result of the reorganization; |
| · | the nature and extent of the services to be provided by the Advisor, including information about the investment objective, policies and strategies applicable to the Baywood SociallyResponsible Fund; |
| · | the personnel of the Advisor, including educational background, experience in the investment management industry, and the ability of the Advisor to retain qualified personnel; |
| · | the compliance program of the Advisor; |
| · | the financial condition and stability of the Advisor; |
| · | the potential for the Advisor to derive benefits that are ancillary to serving as an investment advisor to the Baywood SociallyResponsible Fund; |
| · | the profitability of the Advisor from the advisory fee to be paid by the Baywood SociallyResponsible Fund, including information concerning the advisory fees of funds considered by the Advisor to be comparable; |
| · | the performance of the predecessor fund to the Baywood SociallyResponsible Fund; |
| · | the investing philosophy and historical performance of the Advisor; and |
| · | the terms of the proposed investment advisory agreement, including the fees payable under the agreement, and the commitment of the Advisor to provide expense caps and fee waivers for the Baywood SociallyResponsible Fund. |
At the September Meeting, the Trustees reviewed, evaluated, and discussed among themselves and with the Advisor and Independent Legal Counsel, among other things, the information referenced above. The Trustees also considered the overall reputation, capabilities, and commitment of the Advisor to provide high-quality services to the Baywood SociallyResponsible Fund. The Independent Trustees engaged in discussion and consideration amongst themselves, and with the Advisor and Independent Legal Counsel. The Trustees concluded that the nature and extent of the investment advisory services to be provided by the Advisor to the Baywood SociallyResponsible Fund would be appropriate and consistent with the terms of the investment advisory agreement, including the amount of fees to be paid under the advisory agreement. At the September Meeting, the Board unanimously approved the investment advisory agreement. The Trustees agreed that no single factor was determinative of their decision to approve the investment advisory agreement.
23 |
BAYWOOD FUNDS ADDITIONAL INFORMATION MARCH 31, 2016 |
Shareholder Proxy Vote
At a special meeting of shareholders, held on December 7, 2015, shares were voted as follows on the proposal presented to shareholders:
To approve an Agreement and Plan of Reorganization under which the Predecessor Fund would assign all of its assets and liabilities to the Baywood SociallyResponsible Fund, a series of Forum Funds II, in exchange for shares of the Predecessor Fund in a tax-free reorganization.
| For | Against | Abstain | ||
| 23,651,473 | 5,787 | 9,624 |
Proxy Voting Information
A description of the policies and procedures that each Fund uses to determine how to vote proxies relating to securities held in each Fund's portfolio is available, without charge and upon request, by calling (855) 409-2297 and on the U.S. Securities and Exchange Commission's (the "SEC") website at www.sec.gov. Each Fund's proxy voting record for the most recent twelve-month period ended June 30 is available, without charge and upon request, by calling (855) 409-2297 and on the SEC's website at www.sec.gov.
Availability of Quarterly Portfolio Schedules
Each Fund files its complete schedule of portfolio holdings with the SEC for the first and third quarters of each fiscal year on Form N-Q. These filings are available, without charge and upon request on the SEC's website at www.sec.gov or may be reviewed and copied at the SEC's Public Reference Room in Washington, DC. Information on the operation of the Public Reference Room may be obtained by calling (800) SEC-0330.
Shareholder Expense Example
As a shareholder of the Fund, you incur ongoing costs, including management fees, distribution (12b-1) fees (for Investor Shares only) and other Fund expenses. This example is intended to help you understand your ongoing costs (in dollars) of investing in the Fund and to compare these costs with the ongoing costs of investing in other mutual funds.
The example is based on an investment of $1,000 invested at the beginning of the period and held for the entire period from October 1, 2015, through March 31, 2016.
Actual Expenses – The first line under each share class of the table below provides information about actual account values and actual expenses. You may use the information in this line, together with the amount you invested, to estimate the expenses that you paid over the period. Simply divide your account value by $1,000 (for example, an $8,600 account value divided by $1,000 = 8.6), then multiply the result by the number in the first line under the heading entitled "Expenses Paid During Period" to estimate the expenses you paid on your account during the period.
Hypothetical Example for Comparison Purposes – The second line under each share class of the table below provides information about hypothetical account values and hypothetical expenses based on each Fund's actual expense ratio and an assumed rate of return of 5% per year before expenses, which is not each Fund's actual return. The hypothetical account values and expenses may not be used to estimate the actual ending account balance or expenses you paid for the period. You may use this information to compare the ongoing costs of investing in each Fund and other funds. To do so, compare this 5% hypothetical example with the 5% hypothetical examples that appear in the shareholder reports of other funds.
Please note that the expenses shown in the table are meant to highlight your ongoing costs only. Therefore, the second line of the table is useful in comparing ongoing costs only, and will not help you determine the relative total costs of owning different funds.
24 |
BAYWOOD FUNDS ADDITIONAL INFORMATION MARCH 31, 2016 |
| Beginning | Ending | Expenses | Annualized | ||||||||
| Account Value | Account Value | Paid During | Expense | ||||||||
| October 1, 2015 | March 31, 2016 | Period* | Ratio* | ||||||||
Baywood ValuePlus Fund | |||||||||||
| Investor Shares | |||||||||||
| Actual | $ | 1,000.00 | $ | 1,075.89 | $ | 4.93 | 0.95 | % | |||
| Hypothetical (5% return before taxes) | $ | 1,000.00 | $ | 1,020.25 | $ | 4.80 | 0.95 | % | |||
| Institutional Shares | |||||||||||
| Actual | $ | 1,000.00 | $ | 1,077.64 | $ | 3.64 | 0.70 | % | |||
| Hypothetical (5% return before taxes) | $ | 1,000.00 | $ | 1,021.50 | $ | 3.54 | 0.70 | % | |||
Baywood SociallyResponsible Fund |
| Investor Shares | |||||||||||
| Actual | $ | 1,000.00 | $ | 992.73 | $ | 6.73 | 1.35 | % | |||
| Hypothetical (5% return before taxes) | $ | 1,000.00 | $ | 1,018.25 | $ | 6.81 | 1.35 | % | |||
| Institutional Shares | |||||||||||
| Actual | $ | 1,000.00 | $ | 992.94 | $ | 4.43 | 0.89 | % | |||
| Hypothetical (5% return before taxes) | $ | 1,000.00 | $ | 1,020.55 | $ | 4.50 | 0.89 | % | |||
| * | Expenses are equal to each Fund's annualized expense ratio multiplied by the average account value over the period, multiplied by the number of days in the most recent fiscal half-year divided by 366 to reflect the half-year period. |
25 |
ITEM 2. CODE OF ETHICS.
Not applicable.
ITEM 3. AUDIT COMMITTEE FINANCIAL EXPERT.
Not applicable.
ITEM 4. PRINCIPAL ACCOUNTANT FEES AND SERVICES.
Not applicable.
ITEM 5. AUDIT COMMITTEE OF LISTED REGISTRANTS.
Not applicable
ITEM 6. INVESTMENTS.
| (a) | Included as part of report to shareholders under Item 1. |
| (b) | Not applicable. |
ITEM 7. DISCLOSURE OF PROXY VOTING POLICIES AND PROCEDURES FOR CLOSED-END
MANAGEMENT INVESTMENT COMPANIES.
Not applicable.
ITEM 8. PORTFOLIO MANAGERS OF CLOSED-END MANAGEMENT INVESTMENT COMPANIES.
Not applicable.
ITEM 9. PURCHASES OF EQUITY SECURITIES BY CLOSED-END MANAGEMENT INVESTMENT COMPANY AND AFFILIATED PURCHASERS.
Not applicable.
ITEM 10. SUBMISSION OF MATTERS TO A VOTE OF SECURITY HOLDERS
The Registrant does not accept nominees to the board of trustees from shareholders.
ITEM 11. CONTROLS AND PROCEDURES
(a) The Registrant's Principal Executive Officer and Principal Financial Officer have concluded that the Registrant's disclosure controls and procedures (as defined in Rule 30a-3(c) under the Investment Company Act of 1940 (the "Act")) are effective, based on their evaluation of the controls and procedures required by Rule 30a-3(b) under the Act and Rules 13a-15(b) or 15d-15(b) under the Securities Exchange Act of 1934, as of a date within 90 days of the filing date of this report.
(b) There were no changes in the Registrant's internal control over financial reporting (as defined in
Rule 30a-3(d) under the Act) that occurred during the second fiscal quarter of the period covered by this report that have materially affected, or are reasonably likely to materially affect, the Registrant's internal control over financial reporting.
ITEM 12. EXHIBITS.
(a)(1) Not applicable.
(a)(2) Certifications pursuant to Rule 30a-2(a) of the Act, and Section 302 of the Sarbanes-Oxley Act of 2002. (Exhibits filed herewith)
(a)(3) Not applicable.
(b) Certifications pursuant to Rule 30a-2(b) of the Act, and Section 906 of the Sarbanes-Oxley Act of 2002. (Exhibit filed herewith)
SIGNATURES
Pursuant to the requirements of the Securities Exchange Act of 1934 and the Investment Company Act of 1940, the Registrant has duly caused this report to be signed on its behalf by the undersigned, thereunto duly authorized.
Registrant Forum Funds II
| By | /s/ Jessica Chase | |
| Jessica Chase, Principal Executive Officer | ||
| Date | May 19, 2016 |
Pursuant to the requirements of the Securities Exchange Act of 1934 and the Investment Company Act of 1940, this report has been signed below by the following persons on behalf of the Registrant and in the capacities and on the dates indicated.
| By | /s/ Jessica Chase | |
| Jessica Chase, Principal Executive Officer | ||
| Date | May 19, 2016 |
| By | /s/ Karen Shaw | |
| Karen Shaw, Principal Financial Officer | ||
| Date | May 19, 2016 |