As filed with the Securities and Exchange Commission on November 28, 2016
UNITED STATES
SECURITIES AND EXCHANGE COMMISSION
WASHINGTON, D.C. 20549
FORM N-CSR
CERTIFIED SHAREHOLDER REPORT OF REGISTERED MANAGEMENT
INVESTMENT COMPANIES
Investment Company Act file number 811-22842
FORUM FUNDS II
Three Canal Plaza, Suite 600
Portland, Maine 04101
Jessica Chase, Principal Executive Officer
Three Canal Plaza, Suite 600
Portland, Maine 04101
207-347-2000
Date of fiscal year end: September 30
Date of reporting period: October 1, 2015 – September 30, 2016
ITEM 1. REPORT TO STOCKHOLDERS.
BAYWOOD VALUEPLUS FUNDA MESSAGE TO OUR SHAREHOLDERS (Unaudited) SEPTEMBER 30, 2016 |
Dear Shareholder,
We are pleased to report our economic and financial market perspectives and the investment activities for the Baywood ValuePlus Fund (the "Fund") for the ten months ended September, 2016. The Fund is a large-capitalization value fund that purchases primarily dividend-paying companies traded on U.S. exchanges and uses SKBA Capital Management's ("SKBA") Relative Dividend Yield (RDY) discipline as the initial valuation framework. We believe that RDY points out attractive investment opportunities, not simply among companies with above-average dividend yield, but just as importantly among stocks for which low expectations are already discounted into their valuations at the time of purchase. This provides the potential for attractive capital appreciation opportunities, while offering desirable downside protection.
The ten month period ending September 2016 marked a new regime in the market. The robust market advances of the prior years abated and we have begun a period marked with uncertainty which precipitates wild market swings at just the slightest hint of disappointment. This was twice on display in 2016. The first instance occurred in the first month and a half of the year when the broad market lost as much as 12%. What struck us, however, was the nature of the sell-off not just the sell-off itself. A number of high-flying stocks responsible for advancing the indexes over the last 5-7 years, companies like Facebook, Amazon, Netflix and Google (Alphabet) declined the most, as did other, less recognizable, highly valued companies. At the same time companies we tend to favor and own suddenly came into favor. These less exciting, stable, high cash flow yielding, yet out-of-favor companies declined much less than the recent high-flyers. During these early weeks of the year the Baywood ValuePlus fund outperformed its benchmarks meaningfully.
Not surprisingly, sectors commonly believed to be "defensive", many of which have high dividend yields like utilities and telecom also outperformed. We happen to be underweight telecom and utilities for the opposite reason so many others find them attractive. The historical tendency of these sectors to be defensive in periods of extreme volatility coupled with low worldwide investment yields has resulted in extraordinary demand for these expensive yet relatively high-yielding investments. Global bond substitution effects in the search for yield have resulted in valuations inconsistent with what we view as generally poor company fundamentals. As value investors having experienced many cycles, we can confidently state that market regimes change over time. Yesterday's low beta, low volatility, defensive, perceived to be safe investments are often tomorrow's blow-ups. Electric utilities, for example, are currently more highly valued than they arguably have ever been while their dividend yields are near record lows for the industry. Out-of-favor, they are not. But what about fundamentals? Are the high valuations associated with improving fundamentals? With valuations at record highs and dividend yields at record lows, what are investors paying for if not extraordinary fundamental improvement? Alas, this is where we take exception. The utility business model is under pressure from more efficient households and enterprises. Power demand as a function of GDP is at an all-time low, with conceivably more room to squeeze out efficiencies. Renewable resources put strain on the grid as well as lower the price of electricity without commensurate decreases in cost. Furthermore, with the recent strides in storage technology (batteries), prospective profitability looks to decrease, not increase.
This is where we differ from many of our contemporaries. As value investors we simply look for stocks that are out-of-favor, where the relative dividend yield is high due to a depressed stock price, not purely by dividend policy. Dividend policies in and of themselves can be highly misleading. For example, before the crash in oil prices, several exploration and production companies that have no business paying a dividend, let alone one high enough to be attractive, had high absolute dividend yields. This was not due to their stock prices being depressed or their cash flows being in excess of their capital needs, it was due to managements trying to appeal to a certain investor base looking for yield. When the price of the commodity dropped and no offsetting business like refining was able to mitigate losses tied to production; dividends had to be slashed and with it went the price of their shares.
Instead we look for sustainable businesses, often with market leading positions in their respective industries that have strong enough balance sheets to support a healthy dividend policy and have become temporarily out-of-favor. Companies like Packaging Corp, Albemarle, Baxter and Chubb all contributed meaningfully in recent months, yet would not otherwise be considered "defensive" under recently accepted definitions. These companies' historic betas may have been somewhat elevated at time of purchase, and would not have typically fit in a "low-vol" strategy, yet in fact proved to be much more defensive due to valuations low enough to provide downside protection and capture market upside during a recovery.
Market regimes change and what was true last year may no longer be this year. In the latter half of the fund's fiscal year, utility stocks began to fall out of favor. Bond substitution, the only leg upon which such securities were priced, vanished with the Fed signaling a change in policy. Technical factors driving up prices of traditionally high yielding sectors ceased, which helped contribute meaningfully to the fund's returns over the second half of the fiscal year. ValuePlus' absolute returns will not always keep up with very robust market advances as we experienced between 2012 and 2014. Under more normal environments and those with heightened volatility as we recently experienced, the increase in our investment opportunity set resulted in the fund performing
BAYWOOD VALUEPLUS FUNDA MESSAGE TO OUR SHAREHOLDERS (Unaudited) SEPTEMBER 30, 2016 |
very well in its Morningstar Large Cap Value category over this past year. Following an unprecedented period of consecutive yearly increases in the stock market, it is unlikely that returns in the future will be as strong as they have been. The market regime has shifted. To investors like ourselves, however, the uncertainty of myriad geo-political and economic events worldwide is likely to continue to offer an increased investment opportunity set. As such, we should continue to find attractive investment prospects in the foreseeable future.We look forward to reporting to you in our semi-annual shareholder letter in another few months.
For more detailed information on SKBA Capital Management, LLC and our investment process and perspectives, visit our website at www.SKBA.com.
Current and future portfolio holdings are subject to change and risk.
The Morningstar category is used to compare fund performance to its peers. It is not possible to invest directly into an index or category. Past performance is no guarantee of future results.
Risk Considerations: Mutual fund investing involves risk, including the possible loss of principal. The Fund primarily invests in undervalued securities, which may not appreciate in value as anticipated by the Advisor or remain undervalued for longer than anticipated. The Fund may invest in American Depositary Receipts (ADRs), which involves risks relating to political, economic or regulatory conditions in foreign countries and may cause greater volatility and less liquidity. The Fund may also invest in convertible securities and preferred stock, which may be adversely affected as interest rates rise.
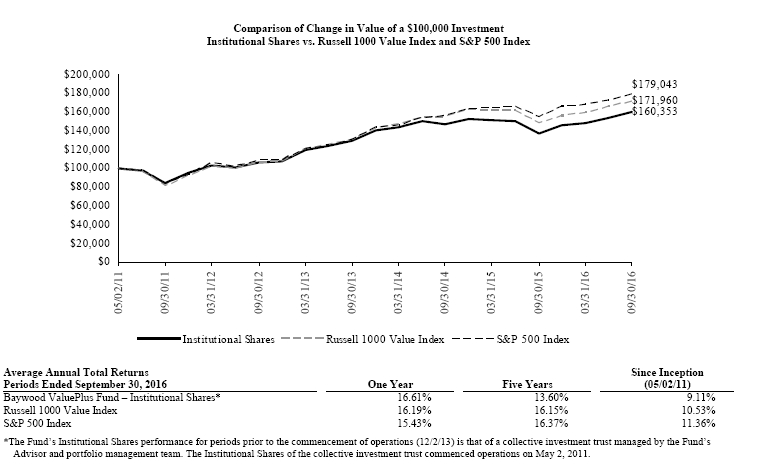
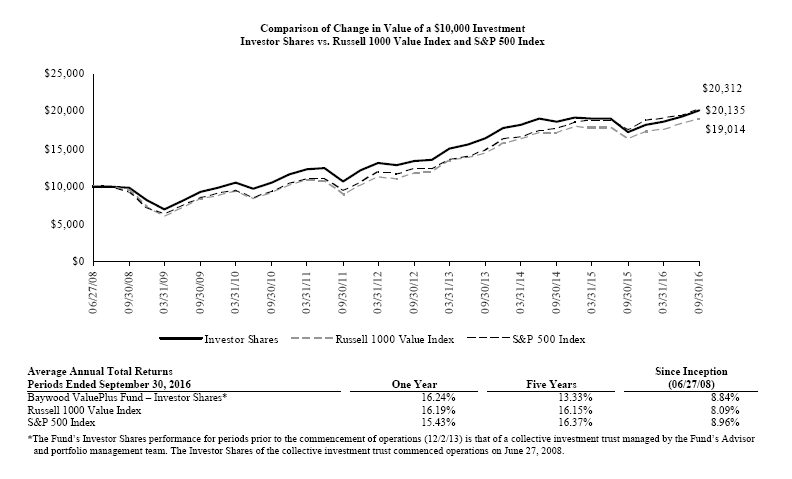
Performance data quoted represents past performance and is no guarantee of future results. Current performance may be lower or higher than the performance data quoted. Investment return and principal value will fluctuate so that shares, when redeemed, may be worth more or less than original cost. For the most recent month-end performance, please call (855) 409-2297. As stated in the Fund's prospectus, the annual operating expense ratios (gross) for Investor Shares and Institutional Shares are 5.80% and 2.09%, respectively. However, the Fund's advisor has agreed to contractually waive its fees and/or reimburse expenses such that total operating expenses (excluding all taxes, interest, portfolio transaction expenses, acquired fund fees and expenses, proxy expenses and extraordinary expenses) do not exceed 0.95% and 0.70% for Investor Shares and Institutional Shares, respectively through March 31, 2017 (the "Expense Cap"). The Fund may repay the Advisor for fees waived and expenses reimbursed pursuant to the expense cap if such payment is made within three years of the fee waiver or expense reimbursement, is approved by the Fund's Board of Trustees, and the reimbursement does not cause the Fund's net annual operating expenses of that class to exceed the expense cap in place at the time the fees were waived. During the period, certain fees were waived and/or expenses reimbursed, otherwise returns would have been lower. The performance table and graph do not reflect the deduction of taxes that a shareholder would pay on Fund distributions or the redemption of Fund shares. The performance table and graph do not reflect the deduction of taxes that a shareholder would pay on Fund distributions or the redemption of Fund shares. Returns greater than one year are annualized.
| | 275 | | Baxter International, Inc. | $ | 13,090 | |
| | 100 | | Becton Dickinson and Co. | | 17,973 | |
| | 800 | | Eli Lilly & Co. | | 64,208 | |
| | 1,000 | | HealthSouth Corp. | | 40,570 | |
| | 200 | | Johnson & Johnson | | 23,626 | |
| | 1,100 | | Koninklijke Philips NV, ADR | | 32,549 | |
| | | 242,472 | |
| Technology - 15.0% |
| | 2,100 | | Cisco Systems, Inc. | | 66,612 | |
| | 500 | | Harris Corp. | | 45,805 | |
| | 200 | | International Business Machines Corp. | | 31,770 | |
| | 1,200 | | Microsoft Corp. | | 69,120 | |
| | 800 | | QUALCOMM, Inc. | | 54,800 | |
| | 700 | | TE Connectivity, Ltd. | | 45,066 | |
| | 300 | | Texas Instruments, Inc. | | 21,054 | |
| | | 334,227 | |
| Telecommunications - 2.3% |
| | 1,000 | | Verizon Communications, Inc. | | 51,980 | |
| | | | |
| Transportation - 0.9% |
| | 300 | | CH Robinson Worldwide, Inc. | | 21,138 | |
| | | | |
| Utilities - 1.2% |
| | 800 | | Exelon Corp. | | 26,632 | |
| | | | |
Total Common Stock (Cost $1,966,412) | | 2,137,270 | |
| Money Market Fund - 5.0% |
| | 111,214 | | Federated Government Obligations Fund, 0.27% (a) (Cost $111,214) | | 111,214 | |
| | | | |
Total Investments - 100.6% (Cost $2,077,626)* | $ | 2,248,484 | |
| Other Assets & Liabilities, Net – (0.6)% | | (14,169 | ) |
| Net Assets – 100.0% | $ | 2,234,315 | |
| ADR | American Depositary Receipt |
| PLC | Public Limited Company |
| (a) | Variable rate security. Rate presented is as of September 30, 2016. |
* Cost for federal income tax purposes is $2,102,642 and net unrealized appreciation consists of:
| Gross Unrealized Appreciation | | $ | 206,343 | |
| Gross Unrealized Depreciation | | | (60,501 | ) |
| Net Unrealized Appreciation | | $ | 145,842 | |
The following is a summary of the inputs used to value the Fund's investments as of September 30, 2016.
The inputs or methodology used for valuing securities are not necessarily an indication of the risks associated with investing in those securities. For more information on valuation inputs, and their aggregation into the levels used in the table below, please refer to the Security Valuation section in Note 2 of the accompanying Notes to Financial Statements.
| Valuation Inputs | | Investments in Securities |
| Level 1 - Quoted Prices | | $ | 2,137,270 | |
| Level 2 - Other Significant Observable Inputs | | | 111,214 | |
| Level 3 - Significant Unobservable Inputs | | | - | |
| Total | | $ | 2,248,484 | |
The Level 1 value displayed in this table is Common Stock. The Level 2 value displayed in this table is a Money Market Fund. Refer to this Schedule of Investments for a further breakout of each security by industry.
The Fund utilizes the end of period methodology when determining transfers. There were no transfers among Level 1, Level 2 and Level 3 for the period ended September 30, 2016.
| PORTFOLIO HOLDINGS | | |
| % of Total Investments | | |
| Basic Materials | 8.1 | % |
| Capital Goods / Industrials | 10.4 | % |
| Consumer Cyclicals | 4.5 | % |
| Consumer Staples | 7.4 | % |
| Energy | 15.3 | % |
| Financials | 19.2 | % |
| Health Care | 10.8 | % |
| Technology | 14.9 | % |
| Telecommunications | 2.3 | % |
| Transportation | 0.9 | % |
| Utilities | 1.2 | % |
| Money Market Fund | 5.0 | % |
| | 100.0 | % |
| ASSETS | | | | |
| . | Total investments, at value (Cost $2,077,626) | | $ | 2,248,484 | |
| | Receivables: | | | | |
| | | Fund shares sold | | | 2,404 | |
| | | Investment securities sold | | | 3,074 | |
| | | Dividends | | | 2,666 | |
| | | From investment advisor | | | 8,044 | |
| | Prepaid expenses | | | 9,448 | |
| Total Assets | | | 2,274,120 | |
| | | | | | | |
| LIABILITIES | | | | |
| | Payables: | | | | |
| | | Investment securities purchased | | | 13,143 | |
| | Accrued Liabilities: | | | | |
| | | Fund services fees | | | 4,281 | |
| | | Other expenses | | | 22,381 | |
| Total Liabilities | | | 39,805 | |
| | | | | | | |
| NET ASSETS | | $ | 2,234,315 | |
| | | | | | | |
| COMPONENTS OF NET ASSETS | | | | |
| | Paid-in capital | | $ | 2,048,032 | |
| | Undistributed net investment income | | | 4,234 | |
| | Accumulated net realized gain | | | 11,191 | |
| | Net unrealized appreciation | | | 170,858 | |
| NET ASSETS | | $ | 2,234,315 | |
| | | | | | | |
| SHARES OF BENEFICIAL INTEREST AT NO PAR VALUE (UNLIMITED SHARES AUTHORIZED) | | | | |
| | Investor Shares | | | 109,420 | |
| | Institutional Shares | | | 34,363 | |
| | | | | | | |
| NET ASSET VALUE, OFFERING AND REDEMPTION PRICE PER SHARE | | | | |
| | Investor Shares (based on net assets of $1,698,610) | | $ | 15.52 | |
| | Institutional Shares (based on net assets of $535,705) | | $ | 15.59 | |
| See Notes to Financial Statements. | 7 | |
| | | | December 1, 2015 | | | For the Year |
| | | | Through | | | Ended |
| INVESTMENT INCOME | | | September 30, 2016* | | | November 30, 2015 |
| | Dividend income (Net of foreign withholding taxes of $125 and $469, respectively) | . | | $ | 47,743 | | | | $ | 287,641 | |
| Total Investment Income | | | | 47,743 | | | | | 287,641 | |
| | | | | | | | | | | |
| EXPENSES | | | | | | | | | | |
| | Investment advisor fees | | | 7,909 | | | | | 49,163 | |
| | Fund services fees | | | 51,532 | | | | | 80,000 | |
| | Transfer agent fees: | | | | | | | | | |
| | Investor Shares | | | 15,150 | | | | | 18,180 | |
| | Institutional Shares | | | 15,150 | | | | | 18,180 | |
| | Distribution fees: | | | | | | | | | |
| | Investor Shares | | | 2,967 | | | | | 3,514 | |
| | Custodian fees | | | 5,633 | | | | | 5,000 | |
| | Registration fees: | | | | | | | | | |
| | Investor Shares | | | 13,054 | | | | | 13,663 | |
| | Institutional Shares | | | 13,083 | | | | | 13,397 | |
| | Professional fees | | | 24,637 | | | | | 34,391 | |
| | Trustees' fees and expenses | | | 2,519 | | | | | 2,587 | |
| | Miscellaneous expenses | | | 17,219 | | | | | 19,822 | |
| Total Expenses | | | | 168,853 | | | | | 257,897 | |
| | Fees waived and expenses reimbursed | | | (154,812 | ) | | | | (185,556 | ) |
| Net Expenses | | | | 14,041 | | | | | 72,341 | |
| | | | | | | | | | | | |
| NET INVESTMENT INCOME | | | | 33,702 | | | | | | 215,300 | |
| | | | | | | | | | | | |
| NET REALIZED AND UNREALIZED GAIN (LOSS) | | | | | | | | | | |
| | Net realized gain on investments | | | 54,453 | | | | | 1,216,102 | |
| | Net change in unrealized appreciation (depreciation) on investments | | | 75,799 | | | | | | (2,370,562 | ) |
| NET REALIZED AND UNREALIZED GAIN (LOSS) | | | | 130,252 | | | | | | | (1,154,460 | ) |
| INCREASE (DECREASE) IN NET ASSETS RESULTING FROM OPERATIONS | | | $ | 163,954 | | | | $ | (939,160 | ) |
| See Notes to Financial Statements. | 8 | |
BAYWOOD VALUEPLUS FUNDSTATEMENTS OF CHANGES IN NET ASSETS |
| | | | | December 1, 2015 Through September 30, 2016* | | | For the Year Ended November 30, 2015 | | December 2, 2013** Through November 30, 2014 | |
| OPERATIONS | | | | | | | | | | | | | | |
| | Net investment income | | $ | 33,702 | | | | $ | 215,300 | | | $ | 268,748 | | |
| | Net realized gain | | | 54,453 | | | | | 1,216,102 | | | | 900,291 | | |
| | Net change in unrealized appreciation (depreciation) | | | 75,799 | | | | | (2,370,562 | ) | | | 93,057 | | |
| Increase (Decrease) in Net Assets Resulting from Operations | | | 163,954 | | | | | (939,160 | ) | | | 1,262,096 | | |
| | | | | | | | | | | | | | | | | |
| DISTRIBUTIONS TO SHAREHOLDERS FROM | | | | | | | | | | | | | | |
| | Net investment income: | | | | | | | | | | | | | | |
| | | Investor Shares | | | (184,835 | ) | | | | (21,548 | ) | | | (4,507 | ) | |
| | | Institutional Shares | | | (59,920 | ) | | | | (215,813 | ) | | | (25,497 | ) | |
| | Net realized gain: | | | | | | | | | | | | | | |
| | | Investor Shares | | | (30,026 | ) | | | | (106,575 | ) | | | - | | |
| | | Institutional Shares | | | (9,339 | ) | | | | (795,111 | ) | | | - | | |
| Total Distributions to Shareholders | | | (284,120 | ) | | | | (1,139,047 | ) | | | (30,004 | ) | |
| | | | | | | | | | | | | | | | | |
| CAPITAL SHARE TRANSACTIONS | | | | | | | | | | | | | | |
| | Sale of shares: | | | | | | | | | | | | | | |
| | | Investor Shares | | | 222,661 | | | | | - | | | | 2,156,450 | | |
| | | Institutional Shares | | | 82,490 | | | | | 1,666,328 | | | | 12,143,951 | | |
| | Reinvestment of distributions: | | | | | | | | | | | | | | |
| | | Investor Shares | | | 214,861 | | | | | 128,123 | | | | 4,507 | | |
| | | Institutional Shares | | | 69,259 | | | | | 1,010,924 | | | | 25,497 | | |
| | Redemption of shares: | | | | | | | | | | | | | | |
| | | Investor Shares | | | (4,481 | ) | | | | (54,025 | ) | | | (841,210 | ) | |
| | | Institutional Shares | | | (17,824 | ) | | | | (11,423,874 | ) | | | (2,183,041 | ) | |
| Increase (Decrease) in Net Assets from Capital Share Transactions | | 566,966 | | | | | (8,672,524 | ) | | | 11,306,154 | | |
| Increase (Decrease) in Net Assets | | | 446,800 | | | | | (10,750,731 | ) | | | 12,538,246 | | |
| | | | | | | | | | | | | | | | | |
| NET ASSETS | | | | | | | | | | | | | | |
| | Beginning of Period | | | 1,787,515 | | | | | 12,538,246 | | | | - | | |
| | End of Period (Including line (a)) | | $ | 2,234,315 | | | | $ | 1,787,515 | | | $ | 12,538,246 | | |
| | | | | | | | | | | | | | | | | |
| SHARE TRANSACTIONS | | | | | | | | | | | | | | |
| | Sale of shares: | | | | | | | | | | | | | | |
| | | Investor Shares | | | 14,548 | | | | | - | | | | 123,329 | | |
| | | Institutional Shares | | | 5,823 | | | | | 95,363 | | | | 687,361 | | |
| | Reinvestment of distributions: | | | | | | | | | | | | | | |
| | | Investor Shares | | | 14,608 | | | | | 7,383 | | | | 254 | | |
| | | Institutional Shares | | | 4,691 | | | | | 57,782 | | | | 1,428 | | |
| | Redemption of shares: | | | | | | | | | | | | | | |
| | | Investor Shares | | | (299 | ) | | | | (3,097 | ) | | | (47,306 | ) | |
| | | Institutional Shares | | | (1,208 | ) | | | | (697,866 | ) | | | (119,011 | ) | |
| Increase (Decrease) in Shares | | | 38,163 | | | | | (540,435 | ) | | | 646,055 | | |
| | | | | | | | | | | | | | | | | |
| (a) | Undistributed net investment income | | $ | 4,234 | | | | $ | 210,999 | | | | $ | 237,355 | | |
* | Effective March 24, 2016, the Fund changed its fiscal year end from November 30 to September 30. |
| ** | Commencement of Operations. |
| See Notes to Financial Statements. | 9 | |
| These financial highlights reflect selected data for a share outstanding throughout each period. |
| | | For the Period Ended September 30, 2016(a) | | For the Year Ended November 30, 2015 | | December 2, 2013 (b) through November 30, 2014 | |
| INVESTOR SHARES | | | | | | | | | | | | |
| NET ASSET VALUE, Beginning of Period | $ | 16.90 | | | $ | 19.28 | | | $ | 17.47 | | |
| INVESTMENT OPERATIONS | | | | | | | | | | | | |
| Net investment income (c) | | 0.26 | | | | 0.34 | | | | 0.36 | | |
| Net realized and unrealized gain (loss) | | 0.93 | | | | (1.06 | ) | | | 1.49 | | |
| Total from Investment Operations | | 1.19 | | | | (0.72 | ) | | | 1.85 | | |
| DISTRIBUTIONS TO SHAREHOLDERS FROM | | | | | | | | | | | | |
| Net investment income | | (2.20 | ) | | | (0.26 | ) | | | (0.04 | ) | |
| Net realized gain | | (0.37 | ) | | | (1.40 | ) | | | — | | |
| Total Distributions to Shareholders | | (2.57 | ) | | | (1.66 | ) | | | (0.04 | ) | |
| NET ASSET VALUE, End of Period | $ | 15.52 | | | $ | 16.90 | | | $ | 19.28 | | |
| TOTAL RETURN | | 8.40 | %(d) | (3.86 | )% | | 10.59 | %(d) |
| RATIOS/SUPPLEMENTARY DATA | | | | | | | | | | | | |
| Net Assets at End of Period (000's omitted) | $1,699 | | | $1,362 | | | $1,471 | | |
| Ratios to Average Net Assets: | | | | | | | | | | | | |
| Net investment income | | 2.07 | %(e) | 1.97 | % | | 1.98 | %(e) |
| Net expenses | | 0.95 | %(e) | 0.95 | % | | 0.95 | %(e) |
| Gross expenses (f) | | 9.43 | %(e) | 5.80 | % | | 4.54 | %(e) |
| PORTFOLIO TURNOVER RATE | | 22 | %(d) | 32 | % | | 35 | %(d) |
| | | | | | | | | | | | | | |
| | |
| (a) | Effective March 24, 2016, the Fund changed its fiscal year end from November 30 to September 30. The information presented is for the period December 1, 2015 through September 30, 2016. |
| (b) | Commencement of operations. |
| (c) | Calculated based on average shares outstanding during each period. |
| (d) | Not annualized. |
| (e) | Annualized. |
| (f) | Reflects the expense ratio excluding any waivers and/or reimbursements. |
| See Notes to Financial Statements. | 10 | |
| These financial highlights reflect selected data for a share outstanding throughout each period. |
| | | For the Period Ended September 30, 2016(a) | | For the Year Ended November 30, 2015 | | December 2, 2013 (b) Through November 30, 2014 | |
| INSTITUTIONAL SHARES | | | | | | | | | | | | |
| NET ASSET VALUE, Beginning of Period | $ | 17.00 | | | $ | 19.42 | | | $ | 17.56 | | |
| INVESTMENT OPERATIONS | | | | | | | | | | | | |
| Net investment income (c) | | 0.29 | | | | 0.39 | | | | 0.41 | | |
| Net realized and unrealized gain (loss) | | 0.94 | | | | (1.06 | ) | | | 1.50 | | |
| Total from Investment Operations | | 1.23 | | | | (0.67 | ) | | | 1.91 | | |
| DISTRIBUTIONS TO SHAREHOLDERS FROM | | | | | | | | | | | | |
| Net investment income | | (2.27 | ) | | | (0.35 | ) | | | (0.05 | ) | |
| Net realized gain | | (0.37 | ) | | | (1.40 | ) | | | — | | |
| Total Distributions to Shareholders | | (2.64 | ) | | | (1.75 | ) | | | (0.05 | ) | |
| NET ASSET VALUE, End of Period | $ | 15.59 | | | $ | 17.00 | | | $ | 19.42 | | |
| TOTAL RETURN | | 8.65 | %(d) | (3.58 | )% | | 10.87 | %(d) |
| RATIOS/SUPPLEMENTARY DATA | | | | | | | | | | | | |
| Net Assets at End of Period (000's omitted) | $536 | | | $426 | | | $11,067 | | |
| Ratios to Average Net Assets: | | | | | | | | | | | | |
| Net investment income | | 2.30 | %(e) | 2.23 | % | | 2.26 | %(e) |
| Net expenses | | 0.70 | %(e) | 0.70 | % | | 0.70 | %(e) |
| Gross expenses (f) | | 14.43 | %(e) | 2.09 | % | | 2.50 | %(e) |
| PORTFOLIO TURNOVER RATE | | 22 | %(d) | 32 | % | | 35 | %(d) |
| | | | | | | | | | | | | | |
| | | | | | | | | | | | | | |
| (a) | Effective March 24, 2016, the Fund changed its fiscal year end from November 30 to September 30. The information presented is for the period December 1, 2015 through September 30, 2016. |
| (b) | Commencement of operations. |
| (c) | Calculated based on average shares outstanding during each period. |
| (d) | Not annualized. |
| (e) | Annualized. |
| (f) | Reflects the expense ratio excluding any waivers and/or reimbursements. |
| See Notes to Financial Statements. | 11 | |
BAYWOOD SOCIALLYRESPONSIBLE FUND A MESSAGE TO OUR SHAREHOLDERS (Unaudited) SEPTEMBER 30, 2016 |
Dear Shareholder,
This letter covering the twelve months ended September 30, 2016 is SKBA Capital Management's ("SKBA") first regarding the economic and financial market perspectives and the investment activities for the Baywood SociallyResponsible Fund (the "Fund"). This report also marks a new chapter in the organization of the Fund as SKBA was pleased to be elected, effective January 8, 2016, the Advisor to the renamed Baywood SociallyResponsible Fund.
We have long desired to become the Advisor to the Fund in order to align our goals with those of our clients and shareholders through every aspect of fund management. During the transition, however, large client flows caused a material negative impact on Fund performance from November of 2015 through February of 2016. Yet SKBA has remained steadfast in its application of our investment approach to meet the needs of shareholders who want environmental, social, and governance (ESG) criteria applied to the stock selection decisions in the Fund and we are very excited at the Fund's prospects going forward. The Fund is a mid-to-large capitalization value-oriented portfolio of stock holdings selected from a universe of stocks created through the application of social screens and assessments of the ESG profile of each company. Among these stocks, we further evaluate and assess each prospective holding's valuation and fundamental business attraction to determine the current portfolio holdings.
As the new Advisor to the Fund we will do everything within our control to ensure we are aware of client commitments and intentions. Having completed the transition, we are looking forward to a fresh start as Advisor and as shareholders as well together with outside shareholders in the Fund. Additionally, we believe the Fund's return characteristics are more represented by the eight full months since the completion of the conversion.
In the most recently ended quarter, the Fund's returns meaningfully surpassed all of our benchmarks; a reminder that our investment horizons don't often match up with the clearly defined quarterly reporting that is commonplace. We manage for the long-term yet are measured in quarters. As value investors, there are periods of strong market advances where the Fund may not keep up; there are also periods in which the value of the securities we purchase tend to be unrecognized. These tend to be followed by periods in which those securities purchased do become recognized. Quite often those take place in times of either normal or volatile returns. While volatility may be difficult to "stomach", we seek it in order to take advantage of mis-pricings. The last year or so has been such an environment and we expect it to continue to provide opportunities over a considerable period.
During the recently ended quarter, consumer staples, an underperforming sector in the Russell 1000 Value Index, was flat in the benchmark. Not an unsurprising result given the high valuations and poor fundamentals. Our underweight position in this expensive sector contributed to returns as did the individual holdings which returned more than 4%. In a quarter where the portfolio outperformed in numerous ways, this sector's performance is more indicative of our valuation discipline and philosophy than of anything else. Consumer Staples, in general, are priced for perfection. The global hunt for yield and stability has pushed valuations to near record highs, reducing yields to record lows. Further, growth in the sector is pressured as emerging economies, once drivers of growth, slow down and pressure revenues. These two conditions make the decision to underweight an easy one, yet the two staple stocks the strategy does own - Pepsi and Procter & Gamble - were some of the two best performing stocks in the sector.
Both Pepsi and Procter & Gamble have divergent sets of fundamentals from other stocks in the sector. Where, on one pass, one might look at reported earnings and conclude they are expensive; normalizing the earnings yields a much different perspective. Procter & Gamble is recovering from years of underperformance as smaller, more focused companies willing to sacrifice margins for market share have eaten away at its lead. Yet it is in the process of completing its biggest change in strategy since the Gillette acquisition by divesting of nearly 2/3's of its slower growing, lower margin brands. The resulting company will be much more focused and the simple stemming of market share losses should result in large fundamental improvements. Pepsi, on the other hand has been widely successful in maintaining its market share in a competitive environment where carbonated, sugary drinks have lagged consumer preferences. Additionally, we have always liked its strategy of diversification with its snack foods segment. Indra Nooyi, to the extent that she is able, is shifting the company's beverage mix away from carbonated soft drinks and shifting its snacks mix to incorporate more healthy alternatives. This is not only good for consumer health and diets in general; it is also proving to be good for the company's financials. While the majority of stocks in the staples category suffer from high valuations and deteriorating fundamentals, these two companies have reasonable valuations and are showing improving fundamentals, which speaks to our philosophy. We don't chase sectors because somehow 'Value' has become defined or bound by certain sectors or stocks. We purchase stocks that are out-of-favor in which fundamentals aren't likely to be as bad as the valuation would suggest. It's not always what you invest in that will determine how you perform; it's also what you avoid. In this case, it was both.
Stocks in the utilities sector suffer from the same general condition as consumer staples, albeit to a much higher degree. Here, fundamentals are unambiguously poor and relative valuations are near stratospheric, the combination of which are the reasons we
BAYWOOD SOCIALLYRESPONSIBLE FUND A MESSAGE TO OUR SHAREHOLDERS (Unaudited) SEPTEMBER 30, 2016 |
have no sector representation in the portfolio. This decision alone accounted for a large portion of the outperformance in the third quarter. Conversely, the decision to hold an overweight position in the Information Technology sector helped returns in addition to stock selection, the majority of which was from Qualcomm. Qualcomm is a stock whose valuation suggested it would be in perpetual decline despite the fact it holds a monopoly on the patents for most of the world's smart phones, a growing market. During the most recently ended quarter its fundamentals were proven to be "not as bad as feared" and its price recovered meaningfully off of multi-year lows. We initiated a position in Qualcomm two years ago and continued to add to our position as it declined through the earlier part of the year. Our conviction enabled us to lower our average purchase price all the way down to where the tiniest bit of good news propelled returns significantly.
Throughout the year we lowered our positions in financials and are currently underweight compared to the Russell 1000 Value Index. Overall our allocation to the sector contributed to returns, while a few stocks partially offset it. Our decision to underweight the sector came somewhat naturally when two of our holdings were acquired last year and we did not re-deploy the proceeds back into the sector as rate volatility persisted. Instead we increased positions elsewhere and held steady to our holdings in financials. That decision proved to be correct and in the most recent quarter as the companies we held were some of the most out-of-favor and a bit of reversion to the mean for Bank of America, Metlife and Kennedy Wilson's valuations led the group to an overall sector outperformance.
For most of the year markets have been volatile to say the least, which has proven beneficial for us value investors. While the benchmark averages continue to climb we're seeing more divergent valuations across sectors and individual stocks. This has led to an increase in activity in the portfolio. During the third quarter alone we added several new companies: Royal Philips, Discovery Communications, Range Resources and Radian Group. Phillips is a European conglomerate in the process of de-conglomerating and has underperformed for years as profitable divisions subsidized its loss-making businesses. Changes in management and a focus on industries with oligopoly structures within healthcare should boost profits as it divests its less profitable lighting divisions. Further, it is now a healthcare equipment manufacturing company that participates in some of the faster growing segments in the industry where valuation multiples tend to be much higher. A reasonable valuation and improving fundamentals point to a successful investment without having to make heroic assumptions.
Discovery is a new investment that follows a familiar theme: media stocks are cheap! We purchased Starz! several years ago because its valuation was suggestive that severe pricing pressures would persist, despite the fact that its shows were rejuvenated and gaining in popularity, the result of hiring a former HBO director. It needed to grow in order to increase its leverage in pricing negotiations, but even if it didn't its valuation was still too low, in our opinion. We didn't need to make heroic assumptions about Starz!, a successful investment that has agreed to merge with LionsGate and we don't need to make heroic assumptions about Discovery as its valuation is as similarly depressed.
Radian, another new addition from the portfolio provides mortgage insurance to individuals and financial institutions. It is a part of the solution in terms of the housing recovery and helps enable those without the ability to make down payments of 20%, a rarity in these days of high home values, to own a home. One of the major reasons for the protracted housing recovery is from the lack of buyers with credit good enough to purchase a home. This means that over the last 5-7 years, those with the ability to purchase a home have been in the highest tier of credit, which also means very low future losses for Radian. Its valuation still remains low as there have been fears of price competition in the industry, but with recent consolidation, those fears will likely subside.
Range Resources was also added in the third quarter as we reduced our holdings in Devon Energy. Devon was the top contributor in the third quarter and, as the strategy's largest energy related company, we are reducing the position to maintain our targeted exposure. Instead we are turning to Range Resources, whose production is geared towards NGLs and natural gas, much cleaner sources of energy and whose valuation has lagged its peers in the recent rally. Our goal in the energy sector is to remain underweight the benchmark while responsibly striking the proper balance between lower carbon emitters and attractive valuations. In the past this strategy detracted from returns as the cleaner segment of the energy industry has not performed particularly well from an investment perspective, but was rewarded in the most recent quarter as it added most to returns despite the underweight position in an outperforming sector.
For the twelve month period ending September 30, 2016, the Fund underperformed its benchmark, which includes significant deleterious effects from outflows that occurred prior to and during the transition of SKBA becoming Advisor to the Fund. The absence of such uncontrollable factors, factors we hope to contain going forward, combined with a market environment conducive to value investing have resulted in the Fund's improved returns over a number of months. We remain steadfast in our resolve to manage our shareholders' assets prudently. We believe the current environment and the heightened volatility associated with it lends itself to our value discipline; something that has been absent in the recent high absolute return environment At the same time,
BAYWOOD SOCIALLYRESPONSIBLE FUND A MESSAGE TO OUR SHAREHOLDERS (Unaudited) SEPTEMBER 30, 2016 |
after nearly eight consecutive years of increasing stock prices, markets will not be forgiving of highly valued companies that disappoint. We will attempt to steer clear of those and continue our relentless search for value as we always have with capital preservation foremost, responsibly.
For more detailed information on SKBA Capital Management, LLC and our investment process and perspectives, visit our website at www.SKBA.com.
Current and future portfolio holdings are subject to change and risk.
The Russell 1000 Value Index is used to compare fund performance to its peers. It is not possible to invest directly into an index or category. Past performance is no guarantee of future results.
Risk Considerations: Mutual fund investing involves risk, including the possible loss of principal. Socially responsible investment criteria may limit the number of investment opportunities available to the Fund or it may invest a larger portion of its assets in certain sectors which could be more sensitive to market conditions, economic, regulatory and environmental developments. These factors could negatively impact the Fund's returns. The Fund primarily invests in undervalued securities, which may not appreciate in value as anticipated by the Advisor or remain undervalued for longer than anticipated. The Fund may invest in American Depositary Receipts (ADRs), which involves risks relating to political, economic or regulatory conditions in foreign countries and may cause greater volatility and less liquidity. The Fund may also invest in convertible securities and preferred stock, which may be adversely affected as interest rates rise.
BAYWOOD SOCIALLYRESPONSIBLE FUND PERFORMANCE CHART AND ANALYSIS (Unaudited) SEPTEMBER 30, 2016 |
The following charts reflect the change in the value of a hypothetical $10,000 investment in Investor Shares and $100,000 investment in Institutional Shares, including reinvested dividends and distributions, in Baywood SociallyResponsible Fund (the "Fund") compared with the performance of the primary benchmark, MSCI KLD 400 Social Index and Russell 1000 Value Index, over the past ten fiscal years. The MSCI KLD 400 Social Index is a capitalization weighted index of 400 US securities that provides exposure to companies with outstanding Environmental, Social and Governance ratings and excludes companies whose products have negative social or environmental impacts. The Russell 1000 Value Index is an unmanaged index which measures the performance of the large-cap value segment of the Russell 1000 companies (that is, the 1,000 largest U.S. companies in terms of market capitalization) with lower price-to-book ratios and lower forecasted growth values. The S&P 500 is a broad-based, unmanaged measurement of changes in stock market conditions based on the average of 500 widely held common stocks. The total return of both the MSCI KLD 400 Social Index and Russell 1000 Value Index include the reinvestment of dividends and income. The total return of the Fund includes operating expenses that reduce returns, while the total return of the MSCI KLD 400 Social Index and Russell 1000 Value Index do not include expenses. The Fund is professionally managed, while the MSCI KLD 400 Social Index and Russell 1000 Value Index are unmanaged and are not available for investment.
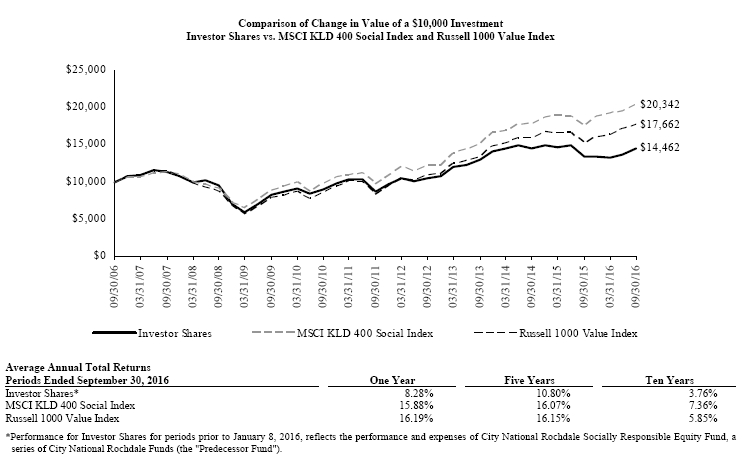
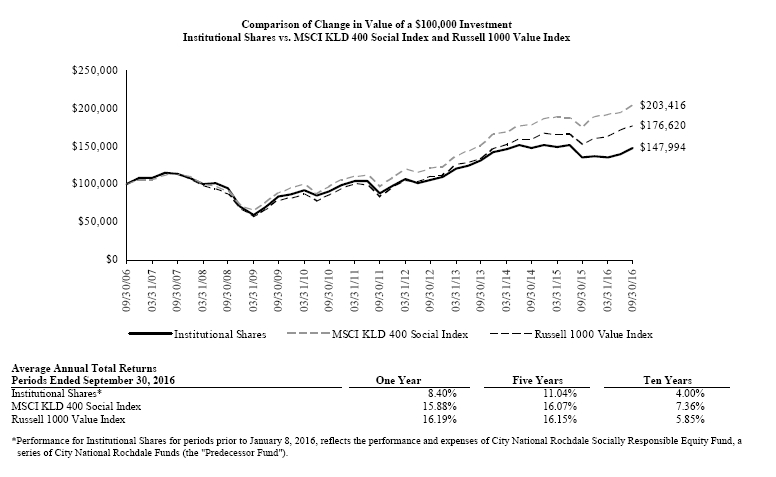
Performance data quoted represents past performance and is no guarantee of future results. Current performance may be lower or higher than the performance data quoted. Investment return and principal value will fluctuate so that shares, when redeemed, may be worth more or less than original cost. For the most recent month-end performance, please call (855) 409-2297. As stated in the Fund's prospectus, the annual operating expense ratios (gross) for Investor Shares and Institutional Shares are 1.22% and 0.85%, respectively. However, the Fund's advisor has agreed to contractually waive its fees and/or reimburse expenses such that total operating expenses (excluding all taxes, interest, portfolio transaction expenses, acquired fund fees and expenses, proxy expenses and extraordinary expenses) do not exceed 1.14% and 0.89% for Investor Shares and Institutional Shares, respectively through December 31, 2017 (the "Expense Cap"). The Fund may repay the Advisor for fees waived and expenses reimbursed pursuant to the expense cap if such payment is made within three years of the fee waiver or expense reimbursement, is approved by the Fund's Board of Trustees, and the reimbursement does not cause the Fund's net annual operating expenses of that class to exceed the expense cap in place at the time the fees were waived. During the period, certain fees were waived and/or expenses reimbursed, otherwise returns would have been lower. The performance table and graph do not reflect the deduction of taxes that a shareholder would pay on Fund distributions or the redemption of Fund shares. The performance table and graph do not reflect the deduction of taxes that a shareholder would pay on Fund distributions or the redemption of Fund shares. Returns greater than one year are annualized.
BAYWOOD SOCIALLYRESPONSIBLE FUND SCHEDULE OF INVESTMENTS SEPTEMBER 30, 2016 |
| Shares | | Security Description | | Value | |
| Common Stock - 93.4% |
| Basic Materials - 5.1% |
| | 1,300 | | Albemarle Corp. | $ | 111,137 | |
| | 5,300 | | Packaging Corp. of America | | 430,678 | |
| | 10,100 | | The Mosaic Co. | | 247,046 | |
| | | 788,861 | |
| Capital Goods / Industrials - 9.9% |
| | 8,338 | | Johnson Controls International PLC | | 387,967 | |
| | 8,200 | | Republic Services, Inc. | | 413,690 | |
| | 1,800 | | Stanley Black & Decker, Inc. | | 221,364 | |
| | 2,100 | | Union Pacific Corp. | | 204,813 | |
| | 11,600 | | USG Corp. (a) | | 299,860 | |
| | | 1,527,694 | |
| Consumer Discretionary - 10.9% |
| | 9,000 | | AutoNation, Inc. (a) | | 438,390 | |
| | 7,400 | | Discovery Communications, Inc., Class C (a) | | 194,694 | |
| | 21,900 | | Ford Motor Co. | | 264,333 | |
| | 16,800 | | Starz, Class A (a) | | 523,992 | |
| | 10,700 | | Twenty-First Century Fox, Inc., Class B | | 264,718 | |
| | | 1,686,127 | |
| Consumer Staples - 4.3% |
| | 3,400 | | PepsiCo, Inc. | | 369,818 | |
| | 3,300 | | The Procter & Gamble Co. | | 296,175 | |
| | | 665,993 | |
| Energy - 9.0% |
| | 14,100 | | Cabot Oil & Gas Corp. | | 363,780 | |
| | 2,600 | | ConocoPhillips | | 113,022 | |
| | 11,000 | | Devon Energy Corp. | | 485,210 | |
| | 8,600 | | National Oilwell Varco, Inc. | | 315,964 | |
| | 3,000 | | Range Resources Corp. | | 116,250 | |
| | | 1,394,226 | |
| Financials - 20.9% |
| | 13,100 | | Air Lease Corp. | | 374,398 | |
| | 6,400 | | American Express Co. | | 409,856 | |
| | 7,100 | | American International Group, Inc. | | 421,314 | |
| | 30,900 | | Bank of America Corp. | | 483,585 | |
| | 1,000 | | Berkshire Hathaway, Inc., Class B (a) | | 144,470 | |
| | 3,300 | | BOK Financial Corp. | | 227,601 | |
| | 9,150 | | Brookfield Asset Management, Inc., Class A | | 321,897 | |
| | 2,700 | | M&T Bank Corp. | | 313,470 | |
| | 6,500 | | MetLife, Inc. | | 288,795 | |
| | 17,700 | | Radian Group, Inc. | | 239,835 | |
| | | 3,225,221 | |
| Health Care - 16.4% |
| | 5,600 | | AbbVie, Inc. | | 353,192 | |
| | 6,185 | | Baxter International, Inc. | | 294,406 | |
| | 2,600 | | Becton Dickinson and Co. | | 467,298 | |
| Shares | | Security Description | | Value | |
| | 5,700 | | DaVita, Inc. (a) | $ | 376,599 | |
| | 1,900 | | Gilead Sciences, Inc. | | 150,328 | |
| | 11,200 | | HealthSouth Corp. | | 454,384 | |
| | 14,900 | | Koninklijke Philips NV, ADR | | 440,891 | |
| | | 2,537,098 | |
| Technology - 15.0% |
| | 12,900 | | Cisco Systems, Inc. | | 409,188 | |
| | 15,300 | | Corning, Inc. | | 361,845 | |
| | 1,200 | | International Business Machines Corp. | | 190,620 | |
| | 6,100 | | Microsoft Corp. | | 351,360 | |
| | 5,400 | | Oracle Corp. | | 212,112 | |
| | 7,300 | | QUALCOMM, Inc. | | 500,050 | |
| | 4,400 | | TE Connectivity, Ltd. | | 283,272 | |
| | | 2,308,447 | |
| Telecommunications - 1.9% |
| | 5,500 | | Verizon Communications, Inc. | | 285,890 | |
| | | | |
Total Common Stock (Cost $13,617,977) | | 14,419,557 | |
| Money Market Fund - 6.7% |
| | 1,033,572 | | Morgan Stanley Institutional Liquidity Fund, 0.31% (b) (Cost $1,033,572) | | 1,033,572 | |
| | | | |
Total Investments - 100.1% (Cost $14,651,549)* | $ | 15,453,129 | |
| Other Assets & Liabilities, Net – (0.1)% | | (7,871 | ) |
| Net Assets – 100.0% | $ | 15,445,258 | |
| ADR | American Depositary Receipt |
| PLC | Public Limited Company |
| (a) | Non-income producing security. |
| (b) | Variable rate security. Rate presented is as of September 30, 2016. |
* Cost for federal income tax purposes is $15,631,664 and net unrealized depreciation consists of:
| Gross Unrealized Appreciation | | $ | 506,512 | |
| Gross Unrealized Depreciation | | | (685,047 | ) |
| Net Unrealized Depreciation | | $ | (178,535 | ) |
The following is a summary of the inputs used to value the Fund's investments as of September 30, 2016.
The inputs or methodology used for valuing securities are not necessarily an indication of the risks associated with investing in those securities. For more information on valuation inputs, and their aggregation into the levels used in the table below, please refer to the Security Valuation section in Note 2 of the accompanying Notes to Financial Statements.
| Valuation Inputs | | Investments in Securities |
| Level 1 - Quoted Prices | | $ | 14,419,557 | |
| Level 2 - Other Significant Observable Inputs | | | 1,033,572 | |
| Level 3 - Significant Unobservable Inputs | | | - | |
| Total | | $ | 15,453,129 | |
The Level 1 value displayed in this table is Common Stock. The Level 2 value displayed in this table is a Money Market Fund. Refer to this Schedule of Investments for a further breakout of
See Notes to Financial Statements. | 17 | |
BAYWOOD SOCIALLYRESPONSIBLE FUND SCHEDULE OF INVESTMENTS SEPTEMBER 30, 2016 |
each security by industry.
The Fund utilizes the end of period methodology when determining transfers. There were no transfers among Level Level 1, Level 2 and Level 3 for the year ended September 30, 2016.
| PORTFOLIO HOLDINGS | | |
| % of Total Investments | | |
| Basic Materials | 5.1 | % |
| Capital Goods / Industrials | 9.9 | % |
| Consumer Discretionary | 10.9 | % |
| Consumer Staples | 4.3 | % |
| Energy | 9.0 | % |
| Financials | 20.9 | % |
| Health Care | 16.4 | % |
| Technology | 14.9 | % |
| Telecommunications | 1.9 | % |
| Money Market Fund | 6.7 | % |
| | 100.0 | % |
See Notes to Financial Statements. | 18 | |
BAYWOOD SOCIALLYRESPONSIBLE FUND STATEMENT OF ASSETS AND LIABILITIES SEPTEMBER 30, 2016 |
| ASSETS | | | | |
| . | Total investments, at value (Cost $14,651,549) | | $ | 15,453,129 | |
| | Cash | | | 893 | |
| | Receivables: | | | | |
| | | Fund shares sold | | | 2,487 | |
| | | Investment securities sold | | | 146,773 | |
| | | Dividends | | | 17,076 | |
| | Prepaid expenses | | | 3,193 | |
| Total Assets | | | 15,623,551 | |
| | | | | | | |
| LIABILITIES | | | | |
| | Payables: | | | | |
| | | Investment securities purchased | | | 145,565 | |
| | | Fund shares redeemed | | | 111 | |
| | Accrued Liabilities: | | | | |
| | | Investment advisor fees | | | 1,504 | |
| | | Trustees' fees and expenses | | | 40 | |
| | | Fund services fees | | | 5,530 | |
| | | Other expenses | | | 25,543 | |
| Total Liabilities | | | 178,293 | |
| | | | | | | |
| NET ASSETS | | $ | 15,445,258 | |
| | | | | | | |
| COMPONENTS OF NET ASSETS | | | | |
| | Paid-in capital | | $ | 16,000,829 | |
| | Accumulated net realized loss | | | (1,357,151 | ) |
| | Net unrealized appreciation | | | 801,580 | |
| NET ASSETS | | $ | 15,445,258 | |
| | | | | | | |
| SHARES OF BENEFICIAL INTEREST AT NO PAR VALUE (UNLIMITED SHARES AUTHORIZED) | | | | |
| | Investor Shares | | | 975,454 | |
| | Institutional Shares | | | 547,202 | |
| | | | | | | |
| NET ASSET VALUE, OFFERING AND REDEMPTION PRICE PER SHARE | | | | |
| | Investor Shares (based on net assets of $9,889,909) | | $ | 10.14 | |
| | Institutional Shares (based on net assets of $5,555,349) | | $ | 10.15 | |
See Notes to Financial Statements. | 19 | |
BAYWOOD SOCIALLYRESPONSIBLE FUND STATEMENT OF OPERATIONS YEAR ENDED SEPTEMBER 30, 2016 |
| INVESTMENT INCOME | | | | | | |
| | Dividend income (Net of foreign withholding taxes of $1,505) | . | | $ | 1,226,048 | | |
| Total Investment Income | | | | 1,226,048 | | |
| | | | | | | |
| EXPENSES | | | | | | |
| | Investment advisor fees | | | 419,145 | | |
| | Fund services fees | | | 101,552 | | |
| | Transfer agent fees: | | | | | |
| | Investor Shares | | | 13,515 | | |
| | Institutional Shares | | | 14,887 | | |
| | Distribution fees: | | | | | |
| | Investor Shares | | | 34,939 | | |
| | Custodian fees | | | 7,053 | | |
| | Registration fees: | | | | | |
| | Investor Shares | | | 7,769 | | |
| | Institutional Shares | | | 5,676 | | |
| | Professional fees | | | 23,734 | | |
| | Trustees' fees and expenses | | | 12,204 | | |
| | Miscellaneous expenses | | | 34,168 | | |
| Total Expenses | | | | 674,642 | | |
| | Fees waived and expenses reimbursed | | | (123,949 | ) | |
| Net Expenses | | | | 550,693 | | |
| | | | | | | | |
| NET INVESTMENT INCOME | | | | 675,355 | | |
| | | | | | | | |
| NET REALIZED AND UNREALIZED GAIN (LOSS) | | | | | | |
| | Net realized loss on investments | | | (1,239,017 | ) | |
| | Net change in unrealized appreciation (depreciation) on investments | | | 15,453,930 | | |
| NET REALIZED AND UNREALIZED GAIN | | | | 14,214,913 | | |
| INCREASE IN NET ASSETS RESULTING FROM OPERATIONS | | | $ | 14,890,268 | | |
| | | | | | | | |
See Notes to Financial Statements. | 20 | |
BAYWOOD SOCIALLYRESPONSIBLE FUND STATEMENTS OF CHANGES IN NET ASSETS |
| | | | | | | | | | | | |
| | | | | For the Year Ended September 30, 2016 | | | For the Year Ended September 30, 2015 |
| OPERATIONS | | | | | | | | | |
| | Net investment income | | $ | 675,355 | | | | $ | 3,150,747 | |
| | Net realized gain (loss) | | | (1,239,017 | ) | | | | 2,738,120 | |
| | Net change in unrealized appreciation (depreciation) | | | 15,453,930 | | | | | (28,299,350 | ) |
| Increase (Decrease) in Net Assets Resulting from Operations | | | 14,890,268 | | | | | (22,410,483 | ) |
| | | | | | | | | | | | |
| DISTRIBUTIONS TO SHAREHOLDERS FROM | | | | | | | | | |
| | Net investment income: | | | | | | | | | |
| | | Investor Shares | | | (539,156 | ) | | | | (2,845,377 | ) |
| | | Institutional Shares | | | (213,418 | ) | | | | (240,990 | ) |
| | Net realized gain: | | | | | | | | | |
| | | Investor Shares | | | (1,155,096 | ) | | | | (5,652,223 | ) |
| | | Institutional Shares | | | (750,918 | ) | | | | (671,508 | ) |
| Total Distributions to Shareholders | | | (2,658,588 | ) | | | | (9,410,098 | ) |
| | | | | | | | | | | | |
| CAPITAL SHARE TRANSACTIONS | | | | | | | | | |
| | Sale of shares: | | | | | | | | | |
| | | Investor Shares | | | 1,397,425 | | | | | 4,091,605 | |
| | | Institutional Shares | | | 8,353,879 | | | | | 112,429,342 | |
| | Reinvestment of distributions: | | | | | | | | | |
| | | Investor Shares | | | 1,686,621 | | | | | 903,845 | |
| | | Institutional Shares | | | 944,207 | | | | | 8,463,173 | |
| | Redemption of shares: | | | | | | | | | |
| | | Investor Shares | | | (14,388,052 | ) | | | | (5,830,449 | ) |
| | | Institutional Shares | | | (256,204,428 | ) | | | | (26,406,009 | ) |
| Increase (Decrease) in Net Assets from Capital Share Transactions | | (258,210,348 | ) | | | | 93,651,507 | |
| Increase (Decrease) in Net Assets | | | (245,978,668 | ) | | | | 61,830,926 | |
| | | | | | | | | | | | |
| NET ASSETS | | | | | | | | | |
| | Beginning of Year | | | 261,423,926 | | | | | 199,593,000 | |
| | End of Year (Including line (a)) | | $ | 15,445,258 | | | | $ | 261,423,926 | |
| | | | | | | | | | | | |
| SHARE TRANSACTIONS | | | | | | | | | |
| | Sale of shares: | | | | | | | | | |
| | | Investor Shares | | | 152,505 | | | | | 363,291 | |
| | | Institutional Shares | | | 792,315 | | | | | 9,897,772 | |
| | Reinvestment of distributions: | | | | | | | | | |
| | | Investor Shares | | | 172,979 | | | | | 82,167 | |
| | | Institutional Shares | | | 96,286 | | | | | 767,411 | |
| | Redemption of shares: | | | | | | | | | |
| | | Investor Shares | | | (1,619,069 | ) | | | | (519,232 | ) |
| | | Institutional Shares | | | (23,760,340 | ) | | | | (2,343,458 | ) |
| Increase (Decrease) in Shares | | | (24,165,324 | ) | | | | 8,247,951 | |
| | | | | | | | | | | | |
| (a) | Undistributed net investment income | | $ | - | | | | $ | 76,785 | |
See Notes to Financial Statements. | 21 | |
BAYWOOD SOCIALLYRESPONSIBLE FUND |
| These financial highlights reflect selected data for a share outstanding throughout each year. | | | | | | |
| | | For the Years Ended September 30, | |
| | | 2016 | | | | 2015 | | | | 2014 | | | | 2013 | | | | 2012 | | |
| INVESTOR SHARES | | | | | | | | | | | | | | | | | | | | |
| NET ASSET VALUE, Beginning of Year | $ | 10.16 | | | $ | 11.42 | | | $ | 12.26 | | | $ | 10.04 | | | $ | 8.37 | | |
| INVESTMENT OPERATIONS | | | | | | | | | | | | | | | | | | | | |
| Net investment income (a) | | 0.08 | | | | 0.11 | | | | 0.18 | | | | 0.09 | | | | 0.11 | | |
| Net realized and unrealized gain (loss) | | 0.71 | | | | (0.98 | ) | | | 1.15 | | | | 2.22 | | | | 1.67 | | |
| Total from Investment Operations | | 0.79 | | | | (0.87 | ) | | | 1.33 | | | | 2.31 | | | | 1.78 | | |
| DISTRIBUTIONS TO SHAREHOLDERS FROM | | | | | | | | | | | | | | | | | | |
| Net investment income | | (0.28 | ) | | | (0.10 | ) | | | (0.15 | ) | | | (0.09 | ) | | | (0.11 | ) | |
| Net realized gain | | (0.53 | ) | | | (0.29 | ) | | | (2.02 | ) | | | — | | | | — | | |
| Total Distributions to Shareholders | | (0.81 | ) | | | (0.39 | ) | | | (2.17 | ) | | | (0.09 | ) | | | (0.11 | ) | |
| NET ASSET VALUE, End of Year | $ | 10.14 | | | $ | 10.16 | | | $ | 11.42 | | | $ | 12.26 | | | $ | 10.04 | | |
| TOTAL RETURN | | 8.28 | % | | (7.86 | )% | | 12.11 | % | | 23.12 | % | | 21.28 | % |
| RATIOS/SUPPLEMENTARY DATA | | | | | | | | | | | | | | | | | | | | |
| Net Assets at End of Year (000's omitted) | $9,890 | | | $23,045 | | | $26,763 | | | $31,387 | | | $25,631 | | |
| Ratios to Average Net Assets: | | | | | | | | | | | | | | | | | | | | |
| Net investment income | | 0.77 | % | | 0.99 | % | | 1.55 | % | | 0.81 | % | | 1.13 | % |
| Net expenses | | 1.28 | % | | 1.14 | % | | 1.14 | % | | 1.13 | % | | 1.15 | % |
| Gross expenses (b) | | 1.84 | % | 1.37 | % | | 1.46 | % | | 1.38 | % | | 1.40 | % |
| PORTFOLIO TURNOVER RATE | | 57 | % | | 29 | % | | 34 | % | | 42 | % | | 38 | % |
| | | | | | | | | | | | | | | | | | | | | | |
| | | | | | | | | | | | | | | | | | | | | | |
| (a) | Calculated based on average shares outstanding during each year. |
| (b) | Reflects the expense ratio excluding any waivers and/or reimbursements. |
See Notes to Financial Statements. | 22 | |
BAYWOOD SOCIALLYRESPONSIBLE FUND |
| These financial highlights reflect selected data for a share outstanding throughout each year. | | | | | | |
| | | For the Years Ended September 30, | |
| | | 2016 | | | | 2015 | | | | 2014 | | | | 2013 | | | | 2012 | | |
| INSTITUTIONAL SHARES | | | | | | | | | | | | | | | | | | | | |
| NET ASSET VALUE, Beginning of Year | $ | 10.18 | | | $ | 11.45 | | | $ | 12.28 | | | $ | 10.06 | | | $ | 8.38 | | |
| INVESTMENT OPERATIONS | | | | | | | | | | | | | | | | | | | | |
| Net investment income (a) | | 0.14 | | | | 0.14 | | | | 0.19 | | | | 0.12 | | | | 0.13 | | |
| Net realized and unrealized gain (loss) | | 0.66 | | | | (0.99 | ) | | | 1.18 | | | | 2.22 | | | | 1.68 | | |
| Total from Investment Operations | | 0.80 | | | | (0.85 | ) | | | 1.37 | | | | 2.34 | | | | 1.81 | | |
| | | | | | | | | | | | | | | | | | | | | |
| DISTRIBUTIONS TO SHAREHOLDERS FROM | | | | | | | | | | | | | | | | | | |
| Net investment income | | (0.30 | ) | | | (0.13 | ) | | | (0.18 | ) | | | (0.12 | ) | | | (0.13 | ) | |
| Net realized gain | | (0.53 | ) | | | (0.29 | ) | | | (2.02 | ) | | | — | | | | — | | |
| Total Distributions to Shareholders | | (0.83 | ) | | | (0.42 | ) | | | (2.20 | ) | | | (0.12 | ) | | | (0.13 | ) | |
| NET ASSET VALUE, End of Year | $ | 10.15 | | | $ | 10.18 | | | $ | 11.45 | | | $ | 12.28 | | | $ | 10.06 | | |
| TOTAL RETURN | | 8.40 | % | | (7.70 | )% | | 12.46 | % | | 23.38 | % | | 21.63 | % |
| RATIOS/SUPPLEMENTARY ATA | | | | | | | | | | | | | | | | | | | | |
| Net Assets at End of Year (000's omitted) | $5,555 | | | $238,379 | | | $172,830 | | | $45,357 | | | $80,109 | | |
| Ratios to Average Net Assets: | | | | | | | | | | | | | | | | | | | | |
| Net investment income | | 1.35 | % | | 1.22 | % | | 1.62 | % | | 1.10 | % | | 1.37 | % |
| Net expenses | | 0.89 | % | | 0.89 | % | | 0.89 | % | | 0.87 | % | | 0.90 | % |
| Gross expenses (b) | | 1.00 | % | 0.87 | %(c) | 0.96 | % | | 0.87 | % | | 0.90 | % |
| PORTFOLIO TURNOVER RATE | | 57 | % | | 29 | % | | 34 | % | | 42 | % | | 38 | % |
| | | | | | | | | | | | | | | | | | | | | | |
| | | | | | | | | | | | | | | | | | | | | | |
| (a) | Calculated based on average shares outstanding during each year. |
| (b) | Reflects the expense ratio excluding any waivers and/or reimbursements. |
| (c) | Ratio includes waivers and previously waived investment advisory fees recovered. The impact of the recovered fees may cause a higher net expense ratio. |
See Notes to Financial Statements. | 23 | |
BAYWOOD FUNDS NOTES TO FINANCIAL STATEMENTS SEPTEMBER 30, 2016 |
Note 1. Organization
Baywood ValuePlus Fund and Baywood SociallyResponsible Fund (individually, a "Fund" and collectively, the "Funds") are diversified portfolios of Forum Funds II (the "Trust"). The Trust is a Delaware statutory trust that is registered as an open-end, management investment company under the Investment Company Act of 1940, as amended (the "Act"). Under its Trust Instrument, the Trust is authorized to issue an unlimited number of each Fund's shares of beneficial interest without par value. The Baywood ValuePlus Fund commenced operations on December 2, 2013. The Baywood ValuePlus Fund currently offers two classes of shares: Investor Shares and Institutional Shares. The Baywood ValuePlus Fund seeks to achieve long-term capital appreciation by investing in undervalued equity securities.
On December 2, 2013, the Baywood ValuePlus Fund commenced operations through a reorganization of a collective investment trust into the Baywood ValuePlus Fund. The collective investment trust was previously managed by the Baywood ValuePlus Fund's Advisor and portfolio management team. This collective investment trust was organized and commenced operations on June 27, 2008. The collective investment trust had an investment objective and strategies that were, in all material respects, identical to those of the Baywood ValuePlus Fund. The net assets and unrealized gain received by the Baywood ValuePlus Fund from this tax-free reorganization were as follows:
| Date of Contribution | | Net Assets Investor Shares | | Net Assets Institutional Shares | | Shares Issued Investor Shares | | Shares Issued Institutional Shares | | Cost of Investments | | Unrealized Gain on Investments |
| December 2, 2013 | | $2,099,735 | | $10,168,720 | | 120,217 | | 579,166 | | $9,396,973 | | $2,372,564 |
In addition to the securities transferred in, as noted above, $498,918 of cash and other receivables were also transferred in as part of the reorganization.
The Baywood SociallyResponsible Fund commenced operations on January 3, 2005. The Baywood SociallyResponsible Fund currently offers two classes of shares: Investor Shares and Institutional Shares. The Baywood SociallyResponsible Fund seeks to provide long-term capital growth.
On December 7, 2015, at a special meeting of Shareholders of Baywood SociallyResponsible Fund, formerly City National Rochdale Socially Responsible Equity Fund, a series of City National Rochdale Funds (the "Predecessor Fund"), the shareholders approved a proposal to reorganize the Predecessor Fund into the Baywood SociallyResponsible Fund, a newly created series of the Forum Funds II. The Predecessor Fund was sub-advised by the Fund's Advisor, SKBA Capital Management, LLC, with the same portfolio managers as Baywood SociallyResponsible Fund. The Baywood SociallyResponsible Fund is managed in a manner that is in all material respects equivalent to the management of the Predecessor Fund, including the investment objective, strategies, guidelines and restrictions. The primary purpose of the reorganization was to move the Predecessor Fund to a newly created series of Forum Funds II. As a result of the reorganization, the Baywood SociallyResponsible Fund is now operating under the supervision of a different board of trustees. On January 8, 2016, the Baywood SociallyResponsible Fund acquired all of the assets, subject to liabilities, of the Predecessor Fund. The shares of the Predecessor Fund were, in effect, exchanged on a tax-free basis for Shares of the Baywood SociallyResponsible Fund with the same aggregate value. No commission or other transactional fees were imposed on shareholders in connection with the tax-free exchange of their shares.
Note 2. Summary of Significant Accounting Policies
The Funds are investment companies and follow accounting and reporting guidance under Financial Accounting Standards Board ("FASB") Accounting Standards Codification ("ASC") Topic 946, "Financial Services-Investment Companies". These financial statements are prepared in accordance with accounting principles generally accepted in the United States of America ("GAAP"), which require management to make estimates and assumptions that affect the reported amounts of assets and liabilities, the disclosure of contingent liabilities at the date of the financial statements, and the reported amounts of increases and decreases in net assets from operations during the fiscal period. Actual amounts could differ from those estimates. The following summarizes the significant accounting policies of each Fund:
Security Valuation – Exchange-traded securities and over-the-counter securities are valued using the last quoted trade or official closing price, provided by independent pricing services as of the close of trading on the market or exchange for which they are primarily traded, on each Fund business day. In the absence of a sale, such securities are valued at the mean of the last bid and ask price provided by independent pricing services. Non-exchange-traded securities for which quotations are available are valued using
BAYWOOD FUNDS NOTES TO FINANCIAL STATEMENTS SEPTEMBER 30, 2016 |
the last quoted sales price, or in the absence of a sale, at the mean of the last bid and ask prices provided by independent pricing services. Shares of open-end mutual funds are valued at net asset value ("NAV"). Short-term investments that mature in 60 days or less may be valued at amortized cost.
Each Fund values its investments at fair value pursuant to procedures adopted by the Trust's Board of Trustees (the "Board") if (1) market quotations are insufficient or not readily available or (2) the Advisor, as defined in Note 3, believes that the values available are unreliable. The Trust's Valuation Committee, as defined in each Fund's registration statement, performs certain functions as they relate to the administration and oversight of each Fund's valuation procedures. Under these procedures, the Valuation Committee convenes on a regular and ad-hoc basis to review such investments and considers a number of factors, including valuation methodologies and significant unobservable inputs, when arriving at fair value.
The Valuation Committee may work with the Advisor to provide valuation inputs. In determining fair valuations, inputs may include market-based analytics which may consider related or comparable assets or liabilities, recent transactions, market multiples, book values and other relevant investment information. Advisor inputs may include an income-based approach in which the anticipated future cash flows of the investment are discounted in determining fair value. Discounts may also be applied based on the nature or duration of any restrictions on the disposition of the investments. The Valuation Committee performs regular reviews of valuation methodologies, key inputs and assumptions, disposition analysis and market activity.
Fair valuation is based on subjective factors and, as a result, the fair value price of an investment may differ from the security's market price and may not be the price at which the asset may be sold. Fair valuation could result in a different NAV than a NAV determined by using market quotes.
Each Fund has a three-tier fair value hierarchy. The basis of the tiers is dependent upon the various "inputs" used to determine the value of each Fund's investments. These inputs are summarized in the three broad levels listed below:
Level 1 — quoted prices in active markets for identical assets and liabilities
Level 2 — other significant observable inputs (including quoted prices of similar securities, interest rates, prepayment speeds, credit risk, etc.)
Level 3 — significant unobservable inputs (including each Fund's own assumptions in determining the fair value of investments)
The aggregate value by input level, as of September 30, 2016, for each Fund's investments is included at the end of each Fund's Schedule of Investments.
Security Transactions, Investment Income and Realized Gain and Loss – Investment transactions are accounted for on the trade date. Dividend income is recorded on the ex-dividend date. Foreign dividend income is recorded on the ex-dividend date or as soon as possible after each Fund determines the existence of a dividend declaration after exercising reasonable due diligence. Income and capital gains on some foreign securities may be subject to foreign withholding taxes, which are accrued as applicable. Interest income is recorded on an accrual basis. Premium is amortized and discount is accreted using the effective interest method. Identified cost of investments sold is used to determine the gain and loss for both financial statement and federal income tax purposes.
Distributions to Shareholders – Distributions to shareholders of net investment income, if any, are declared and paid at least annually. Distributions to shareholders of net capital gains, if any, are declared and paid at least annually. Distributions to shareholders are recorded on the ex-dividend date. Distributions are based on amounts calculated in accordance with applicable federal income tax regulations, which may differ from GAAP. These differences are due primarily to differing treatments of income and gain on various investment securities held by each Fund, timing differences and differing characterizations of distributions made by each Fund.
Federal Taxes – Each Fund intends to continue to qualify each year as a regulated investment company under Subchapter M of Chapter 1, Subtitle A, of the Internal Revenue Code of 1986, as amended ("Code"), and to distribute all of its taxable income to shareholders. In addition, by distributing in each calendar year substantially all of its net investment income and capital gains, if any, the Fund will not be subject to a federal excise tax. Therefore, no federal income or excise tax provision is required. Each Fund files a U.S. federal income and excise tax return as required. Each Fund's federal income tax returns are subject to examination by the Internal Revenue Service for a period of three fiscal years after they are filed. As of September 30, 2016, there are no uncertain tax positions that would require financial statement recognition, de-recognition or disclosure.
Income and Expense Allocation – The Trust accounts separately for the assets, liabilities and operations of each of its investment
BAYWOOD FUNDS NOTES TO FINANCIAL STATEMENTS SEPTEMBER 30, 2016 |
portfolios. Expenses that are directly attributable to more than one investment portfolio are allocated among the respective investment portfolios in an equitable manner.
The Fund's class-specific expenses are charged to the operations of that class of shares. Income and expenses (other than expenses attributable to a specific class) and realized and unrealized gains or losses on investments are allocated to each class of shares based on the class' respective net assets to the total net assets of each Fund.
Commitments and Contingencies – In the normal course of business, each Fund enters into contracts that provide general indemnifications by each Fund to the counterparty to the contract. Each Fund's maximum exposure under these arrangements is dependent on future claims that may be made against each Fund and, therefore, cannot be estimated; however, based on experience, the risk of loss from such claims is considered remote.
Note 3. Fees and Expenses
Investment Advisor – SKBA Capital Management, LLC (the "Advisor") is the investment advisor to the Funds. Pursuant to an Investment Advisory Agreement, the Advisor receives an advisory fee at an annual rate of 0.50% and 0.70% of the average daily net assets of Baywood ValuePlus Fund and Baywood SociallyResponsible Fund, respectively. Prior to January 8, 2016, for the Predecessor Fund to Baywood SociallyResponsible Fund, City National Rochdale received an advisory fee at an annual rate of 0.75% of the Fund's average daily assets. For the period October 1, 2015 through January 8, 2016, the advisory fee paid to City National Rochdale was $337,829 for the Baywood SociallyResponsible Fund.
Distribution – Foreside Fund Services, LLC serves as each Fund's distributor (the "Distributor"). The Funds have adopted a Distribution Plan (the "Plan") in accordance with Rule 12b-1 of the Act. Under the Plan, each Fund may pay the Distributor and/or any other entity as authorized by the Board a fee of up to 0.25% of each Fund's average daily net assets of Investor Shares for providing distribution and/or shareholder services to the Funds.
The Distributor is not affiliated with the Advisor or Atlantic Fund Administration, LLC (d/b/a Atlantic Fund Services) ("Atlantic") or their affiliates.
Other Service Providers – Atlantic provides fund accounting, fund administration, compliance and transfer agency services to each Fund. Atlantic also provides certain shareholder report production and EDGAR conversion and filing services. Pursuant to an Atlantic services agreement, each Fund pays Atlantic customary fees for its services. Prior to January 8, 2016, SEI Investments Global Funds Services served as the administrator to the Predecessor Fund to the Baywood SociallyResponsible Fund. For the period October 1, 2015 through January 8, 2016, the administration fee paid to SEI Investments Global Funds Services was $38,781 for the Baywood SociallyResponsible Fund.
Atlantic provides a Principal Executive Officer, a Principal Financial Officer, a Chief Compliance Officer and an Anti-Money Laundering Officer to each Fund, as well as certain additional compliance support functions.
Trustees and Officers – The Trust pays each Independent Trustee an annual fee of $16,000 ($21,000 for the Chairman). The Independent Trustees and Chairman may receive additional fees for special Board meetings. The Independent Trustees are also reimbursed for all reasonable out-of-pocket expenses incurred in connection with their duties as Trustees, including travel and related expenses incurred in attending Board meetings. The amount of Independent Trustees' fees attributable to each Fund is disclosed in the Statements of Operations. Certain officers of the Trust are also officers or employees of the above named service providers, and during their terms of office received no compensation from each Fund.
Note 4. Expenses Reimbursed and Fees Waived
The Advisor has contractually agreed to waive its fee and/or reimburse certain expenses to limit total operating expenses (excluding all taxes, interest, portfolio transaction expenses, acquired fund fees and expenses, proxy expenses and extraordinary expenses) for Investor Shares to 0.95% and Institutional Shares to 0.70% through March 31, 2017 for Baywood ValuePlus Fund. Effective January 8, 2016, the Advisor also has contractually agreed to waive its fees and/or reimburse certain expenses to limit total operating expenses (excluding all taxes, interest, portfolio transaction expenses, acquired fund fees and expenses, proxy expenses and extraordinary expenses) for Investor Shares to 1.14% and Institutional Shares to 0.89% through December 31, 2017 for Baywood SociallyResponsible Fund. Other Fund service providers have voluntarily agreed to waive and reimburse a portion of their fees. These voluntary fee waivers and reimbursements may be reduced or eliminated at any time. For the period ended September 30, 2016, fees waived and expenses reimbursed were as follows:
BAYWOOD FUNDS NOTES TO FINANCIAL STATEMENTS SEPTEMBER 30, 2016 |
| | Investment Advisor Fees Waived | | Investment Advisor Expenses Reimbursed | | Other Waivers | | Total Fees Waived and Expenses Reimbursed |
Baywood ValuePlus Fund | $ | 7,909 | | $ | 109,403 | | $ | 37,500 | | $ | 154,812 |
Baywood SociallyResponsible Fund | | 75,063 | | | 15,982 | | | 32,904 | | | 123,949 |
| | | | | | | | | | | | |
For the year ended November 30, 2015, fees waived and expenses reimbursed were as follows:
| | Investment Advisor Fees Waived | | Investment Advisor Expenses Reimbursed | | Other Waivers | | Total Fees Waived and Expenses Reimbursed |
Baywood ValuePlus Fund | $ | 49,163 | | $ | 91,393 | | $ | 45,000 | | $ | 185,556 |
The Funds may repay the Advisor for fees waived and expenses reimbursed pursuant to the expense cap if such payment is made within three years of the fee waiver or expense reimbursement, is approved by the Funds' Board of Trustees and the reimbursement does not cause the Funds' net annual operating expenses of that class to exceed the expense cap in place at the time the fees were waived. The amount of fees waived or expenses reimbursed eligible for recoupment are as follows:
Baywood ValuePlus Fund | | Amount of Fees Waived and/or Expenses Reimbursed | | Expiration Date to Recoup Fees Waived and/or Expenses Reimbursed | | Fees Recouped |
| November 30, 2014 | | $ | 201,724 | | November 30, 2017 | | $ | - |
| November 30, 2015 | | $ | 140,556 | | November 30, 2018 | | $ | - |
| September 30, 2016 | | $ | 117,312 | | September 30, 2019 | | $ | - |
| | | | | | | | | |
Baywood SociallyResponsible Fund | | Amount of Fees Waived and/or Expenses Reimbursed | | Expiration Date to Recoup Fees Waived and/or Expenses Reimbursed | | Fees Recouped |
| September 30, 2016 | | $ | 91,045 | | September 30, 2019 | | $ | - |
| | | | | | | | | |
Note 5. Security Transactions
The cost of purchases and proceeds from sales of investment securities (including maturities), other than short-term investments during the period ended September 30, 2016, were as follows:
| | | Purchases | | Sales |
Baywood ValuePlus Fund | | $ | 669,794 | | $ | 401,361 |
Baywood SociallyResponsible Fund | | | 31,395,184 | | | 284,262,994 |
Note 6. Federal Income Tax
Distributions paid during the fiscal periods ended as noted were characterized for tax purposes as follows:
| | | Ordinary Income | | Long-Term Capital Gain | | Total | |
Baywood ValuePlus Fund |
| 2016 | | $ | 240,467 | | | $ | 43,653 | | | $ | 284,120 | | |
| 2015 | | | 229,854 | | | | 2,129,193 | | | | 2,359,047 | | |
| 2014 | | | 30,004 | | | | - | | | | 30,004 | | |
Baywood SociallyResponsible Fund |
| 2016 | | | 752,147 | | | | 1,906,441 | | | | 2,658,588 | | |
| 2015 | | | 3,086,366 | | | | 6,323,732 | | | | 9,410,098 | | |
There are amounts included in the above relating to equalization debits.
As of September 30, 2016, distributable earnings (accumulated loss) on a tax basis were as follows:
| | | Undistributed Ordinary Income | | Undistributed Long-Term Gain | | Capital and Other Losses | | Unrealized Appreciation (Depreciation) | | Total |
Baywood ValuePlus Fund | | $ | 4,234 | | | $ | 36,207 | | | $ | - | | | $ | 145,842 | | | $ | 186,283 | |
Baywood SociallyResponsible Fund | | | - | | | | - | | | | (377,036 | ) | | | (178,535 | ) | | | (555,571 | ) |
The difference between components of distributable earnings on a tax basis and the amounts reflected in the Statements of Assets and Liabilities are primarily due to wash sales.
For tax purposes, the Baywood SociallyResponsible Fund's current year post-October loss was $377,036 (realized during the period November 1, 2015 through September 30, 2016). This loss will be recognized for tax purposes on the first business day of the Fund's next fiscal year, October 1, 2016.
On the Statements of Assets and Liabilities, as a result of permanent book to tax differences, certain amounts have been reclassified for the periods ended November 30, 2015 and September 30, 2016 . The following reclassifications were the result of partnerships, equalization and distribution reclassifications and have no impact on the net assets of each Fund.
For the year ended November 30, 2015 | | Undistributed Net Investment Income (Loss) | | Accumulated Net Realized Gain (Loss) | | Paid-in-Capital |
Baywood ValuePlus Fund | | $ | (4,295 | ) | | | (1,215,705 | ) | | | (1,220,000 | ) |
For the period ended September 30, 2016 | | Undistributed Net Investment Income (Loss) | | Accumulated Net Realized Gain (Loss) | | Paid-in-Capital |
Baywood ValuePlus Fund | | $ | 4,288 | | | $ | (4,288 | ) | | $ | - | |
Baywood SociallyResponsible Fund | | | 434 | | | | 902 | | | | (1,336 | ) |
Note 7. Subsequent Events
Subsequent events occurring after the date of this report through the date these financial statements were issued have been evaluated for potential impact, and each Fund has had no such events.
and the Board of Trustees of Forum Funds II
We have audited the accompanying statements of assets and liabilities of Baywood Value
Plus Fund (formerly Baywood SKBA Value
Plus Fund) and Baywood Socially
Responsible Fund (formerly City National Rochdale Socially
Responsible Fund and formerly a series of the City National Rochdale Funds) (the
"Funds"), each a series of shares of beneficial interest in Forum Funds II, including the schedules of investments, as of September 30, 2016, and the related statements of operations for the ten-month period then ended and for the year ended November 30, 2015 and the statements of changes in net assets and financial highlights for each of the years or periods during the period December 2, 2013 (commencement of operations) through September 30, 2016 for the Baywood Value
Plus Fund. We have also audited the statement of operations for the year ended September 30, 2016 and the statements of changes in net assets and financial highlights for each of the years in the two-year period then ended for the Baywood Socially
Responsible Fund. These financial statements and financial highlights are the responsibility of the Funds' management. Our responsibility is to express an opinion on these financial statements and financial highlights based on our audits. The financial highlights for each of the three years presented through September 30, 2014 for the Baywood Socially
Responsible Fund were audited by other auditors, whose report dated November 28, 2014 expressed an unqualified opinion on those financial highlights.
We conducted our audits in accordance with the standards of the Public Company Accounting Oversight Board (United States). Those standards require that we plan and perform the audits to obtain reasonable assurance about whether the financial statements and financial highlights are free of material misstatement. An audit includes examining, on a test basis, evidence supporting the amounts and disclosures in the financial statements. Our procedures included confirmation of securities owned as of September 30, 2016 by correspondence with the custodian and brokers, or by other appropriate auditing procedures where responses from brokers were not received. An audit also includes assessing the accounting principles used and significant estimates made by management, as well as evaluating the overall financial statement presentation. We believe that our audits provide a reasonable basis for our opinion.
In our opinion, the financial statements and financial highlights referred to above present fairly, in all material respects, the financial position of the Baywood ValuePlus Fund and Baywood SociallyResponsible Fund as of September 30, 2016, and the results of their operations, the changes in their net assets and their financial highlights for each of the periods detailed above, in conformity with accounting principles generally accepted in the United States of America.
BBD, LLP
Philadelphia, Pennsylvania
November 21, 2016
Investment Advisory Agreement Approval
On September 9, 2016, the Trustees met in person with independent legal counsel to the Independent Trustees ("Independent Legal Counsel"), representatives of the Advisor and others to consider information related to the approval of the investment advisory agreement between the Trust, on behalf of the Funds, and the Advisor for the performance of investment advisory services to the Funds. A description of the Board's conclusions in approving the agreement follows.
In preparation for its September meeting of the Board of Trustees of the Trust ("September Meeting"), the Trustees were presented with a range of information to assist in their deliberations. Those materials included a copy of the investment advisory agreement, as well as information from Broadridge Financial Solutions, Inc. ("Broadridge"), a leading independent source of data about the mutual fund industry, which compared the Funds' investment advisory fee and total expense ratio with appropriate groups of peer funds that were selected by Broadridge. The Trustees also received a memorandum from Independent Legal Counsel concerning their responsibilities with respect to the approval of the investment advisory agreement. The Independent Trustees met in executive session with Independent Legal Counsel while deliberating.
The Board also reviewed information provided by the Advisor concerning the following:
| · | The nature and extent of the services provided by the Advisor, including information about the investment objectives, policies and strategies applicable to each Fund; |
| · | The personnel of the Advisor, including educational background, experience in the investment management industry, and the ability of the Advisor to retain qualified personnel; |
| · | The compliance program of the Advisor; |
| · | The financial condition and stability of the Advisor; |
| · | The potential for the Advisor to derive benefits that are ancillary to serving as an investment adviser to the Funds; |
| · | The investment performance of the Advisor with respect to the Funds and their similarly managed accounts; |
| · | The profitability of the Advisor, including information concerning the advisory fees of funds identified by Broadridge and considered to be comparable; |
| · | The investing philosophy of the Advisor; and |
| · | The terms of the investment advisory agreement, including the fees payable under the agreement, and the commitment of the Advisor to provide expense caps and fee waivers for the Funds. |
At the September Meeting, the Trustees reviewed, evaluated, and discussed among themselves and with the Advisor and Independent Legal Counsel, among other things, the information referenced above. The Trustees also considered the overall reputation, capabilities, and commitment of the Advisor to provide high-quality services to the Funds. The Independent Trustees engaged in discussion and consideration amongst themselves, and with the Advisor and Independent Legal Counsel. The Trustees concluded that the nature and extent of the investment advisory services provided by the Advisor to the Funds would be appropriate and consistent with the terms of the investment advisory agreement, including the amount of fees to be paid to the Advisor under the advisory agreement. At the September Meeting, the Board unanimously approved the investment advisory agreement. The Trustees agreed that no single factor was determinative of their decision to approve the investment advisory agreement.
Proxy Voting Information
A description of the policies and procedures that each Fund uses to determine how to vote proxies relating to securities held in each Fund's portfolio is available, without charge and upon request, by calling (855) 409-2297 and on the U.S. Securities and Exchange Commission's (the "SEC") website at www.sec.gov. Each Fund's proxy voting record for the most recent twelve-month period ended June 30 is available, without charge and upon request, by calling (855) 409-2297 and on the SEC's website at www.sec.gov.
Availability of Quarterly Portfolio Schedules
Each Fund files its complete schedule of portfolio holdings with the SEC for the first and third quarters of each fiscal year on Form N-Q. These filings are available, without charge and upon request on the SEC's website at www.sec.gov or may be reviewed and copied at the SEC's Public Reference Room in Washington, DC. Information on the operation of the Public Reference Room may be obtained by calling (800) SEC-0330.
Shareholder Expense Example
As a shareholder of the Fund, you incur ongoing costs, including management fees, distribution (12b-1) fees (for Investor Shares only) and other Fund expenses. This example is intended to help you understand your ongoing costs (in dollars) of investing in the Fund and to compare these costs with the ongoing costs of investing in other mutual funds.
The example is based on an investment of $1,000 invested at the beginning of the period and held for the entire period from April 1, 2016, through September 30, 2016.
Actual Expenses – The first line under each share class of the table below provides information about actual account values and actual expenses. You may use the information in this line, together with the amount you invested, to estimate the expenses that you paid over the period. Simply divide your account value by $1,000 (for example, an $8,600 account value divided by $1,000 = 8.6), then multiply the result by the number in the first line under the heading entitled "Expenses Paid During Period" to estimate the expenses you paid on your account during the period.
Hypothetical Example for Comparison Purposes – The second line under each share class of the table below provides information about hypothetical account values and hypothetical expenses based on each Fund's actual expense ratio and an assumed rate of return of 5% per year before expenses, which is not each Fund's actual return. The hypothetical account values and expenses may not be used to estimate the actual ending account balance or expenses you paid for the period. You may use this information to compare the ongoing costs of investing in each Fund and other funds. To do so, compare this 5% hypothetical example with the 5% hypothetical examples that appear in the shareholder reports of other funds.
Please note that the expenses shown in the table are meant to highlight your ongoing costs only. Therefore, the second line of the table is useful in comparing ongoing costs only, and will not help you determine the relative total costs of owning different funds.
| | Beginning | | Ending | | Expenses | | Annualized |
| | Account Value | | Account Value | | Paid During | | Expense |
| | April 1, 2016 | | September 30, 2016 | | Period* | | Ratio* |
Baywood ValuePlus Fund | | | | | | | | | | | |
| Investor Shares | | | | | | | | | | | |
| Actual | $ | 1,000.00 | | $ | 1,080.41 | | $ | 4.94 | | 0.95 | % |
| Hypothetical (5% return before taxes) | $ | 1,000.00 | | $ | 1,020.25 | | $ | 4.80 | | 0.95 | % |
| Institutional Shares | | | | | | | | | | | |
| Actual | $ | 1,000.00 | | $ | 1,082.07 | | $ | 3.64 | | 0.70 | % |
| Hypothetical (5% return before taxes) | $ | 1,000.00 | | $ | 1,021.50 | | $ | 3.54 | | 0.70 | % |
| | | | | | | | | | | | |
Baywood SociallyResponsible Fund | | | | | | | | | | | |
| Investor Shares | | | | | | | | | | | |
| Actual | $ | 1,000.00 | | $ | 1,090.73 | | $ | 5.96 | | 1.14 | % |
| Hypothetical (5% return before taxes) | $ | 1,000.00 | | $ | 1,019.30 | | $ | 5.76 | | 1.14 | % |
| Institutional Shares | | | | | | | | | | | |
| Actual | $ | 1,000.00 | | $ | 1,091.68 | | $ | 4.65 | | 0.89 | % |
| Hypothetical (5% return before taxes) | $ | 1,000.00 | | $ | 1,020.55 | | $ | 4.50 | | 0.89 | % |
| | | | | | | | | | | | |
| * | Expenses are equal to each Fund's annualized expense ratio multiplied by the average account value over the period, multiplied by the number of days in the most recent fiscal half-year (183) divided by 365 to reflect the half-year period. |
Federal Tax Status of Dividends Declared during the Fiscal Year
For federal income tax purposes, dividends from short-term capital gains are classified as ordinary income. The Baywood ValuePlus Fund designates 100.00% of its income dividend distributed as qualifying for the corporate dividends-received deduction (DRD) and 100.00% for the qualified dividend rate (QDI) as defined in Section 1(h)(11) of the Internal Revenue Code. The Baywood SociallyResponsible Fund designates 100.00% of its income dividend distributed as DRD and 100.00% for QDI.
Trustees and Officers of the Trust
The Board is responsible for oversight of the management of the Trust's business affairs and of the exercise of all the Trust's powers except those reserved for the shareholders. The following table provides information about each Trustee and certain officers of the Trust. Each Trustee and officer holds office until the person resigns, is removed, or is replaced. Unless otherwise noted, the persons have held their principal occupations for more than five years. The address for all Trustees and officers is Three Canal Plaza, Suite 600, Portland, Maine 04101. Mr. Keffer and Mr. Hong are considered Interested Trustees due to their affiliation with Atlantic. Each Fund's Statement of Additional Information includes additional information about the Trustees and is available, without charge and upon request, by calling (855) 409-2297.
| Name and Year of Birth | Position with the Trust | Length of Time Served | Principal Occupation(s) During Past Five Years | Number of Series of Fund Complex¹ Overseen by Trustee | Other Directorships Held by Trustee |
| Independent Trustees | | | | | |
David Tucker Born: 1958 | Chairman of the Board; Trustee; Chairman, Nominating Committee and Qualified Legal Compliance Committee | Since 2013 | Director, Blue Sky Experience (a charitable endeavor) since 2008; Senior Vice President & General Counsel, American Century Companies (an investment management firm) 1998-2008. | 46 | Trustee, Forum Funds, Forum ETF Trust and U.S. Global Investors Funds |
Mark D. Moyer Born: 1959 | Trustee; Chairman, Audit Committee | Since 2013 | Chief Financial Officer, Institute of International Education 2008-2011; Chief Financial Officer and Chief Restructuring Officer, Ziff Davis Media Inc. 2005-2008; Adjunct Professor of Accounting, Fairfield University 2009-2012. | 22 | Trustee, Forum ETF Trust and U.S. Global Investors Funds |
Jennifer Brown-Strabley Born: 1964 | Trustee | Since 2013 | Principal, Portland Global Advisors 1996-2010. | 22 | Trustee, Forum ETF Trust and U.S. Global Investors Funds |
| Interested Trustees | | | | | |
Stacey E. Hong Born: 1966 | Trustee | Since 2013 | President, Atlantic since 2008. | 22 | Trustee, U.S. Global Investors Funds |
John Y. Keffer2 Born: 1942 | Trustee | Since 2013 | Chairman, Atlantic since 2008; President, Forum Investment Advisors, LLC since 2011; President, Forum Foundation (a charitable organization) since 2005; President, Forum Trust, LLC (a non-depository trust company chartered in the State of Maine) since 1997. | 46 | Trustee, Forum Funds, Forum ETF Trust and U.S. Global Investors Funds; Director, Wintergreen Fund, Inc. |
| Officers | | | | | |
Jessica Chase Born: 1970 | President; Principal Executive Officer | Since 2015 | Senior Vice President, Atlantic since 2008. | N/A | N/A |
Karen Shaw Born: 1972 | Treasurer; Principal Financial Officer | Since 2013 | Senior Vice President, Atlantic since 2008. | N/A | N/A |
Zachary Tackett Born: 1988 | Vice President; Secretary; Anti-Money Laundering Compliance Officer | Since 2014 | Counsel, Atlantic since 2014; Intern Associate, Coakley & Hyde, PLLC, 2010-2013. | N/A | N/A |
Michael J. McKeen Born: 1971 | Vice President | Since 2013 | Senior Vice President, Atlantic since 2008. | N/A | N/A |
Timothy Bowden Born: 1969 | Vice President | Since 2013 | Manager, Atlantic since 2008. | N/A | N/A |
Geoffrey Ney Born: 1975 | Vice President | Since 2013 | Manager, Atlantic since 2013; Senior Fund Accountant, Atlantic, 2008-2013. | N/A | N/A |
Todd Proulx Born: 1978 | Vice President | Since 2013 | Manager, Atlantic since 2013; Senior Fund Accountant, Atlantic, 2008-2013. | N/A | N/A |
Carlyn Edgar Born: 1963 | Chief Compliance Officer | Since 2013 | Senior Vice President, Atlantic since 2008. | N/A | N/A |
1The Fund Complex includes the Trust, Forum Funds, Forum ETF Trust and U.S. Global Investors Funds and is overseen by different Boards of Trustees. 2Atlantic is a subsidiary of Forum Holdings Corp. I, a Delaware corporation that is wholly owned by Mr. Keffer. |

Gurtin National Municipal Oportunistic Value Fund | | |
A Message to Our Shareholders (Unaudited) | | 2 |
Performance Chart and Analysis (Unaudited) | | 3 |
Schedule of Investments | | 5 |
Statements of Assets and Liabilities | | 8 |
Statement of Operations | | 9 |
Statements of Changes in Net Assets | | 10 |
Financial Highlights | | 11 |
Gurtin California Municipal Oportunistic Value Fund | | |
A Message to Our Shareholders (Unaudited) | | 12 |
Performance Chart and Analysis (Unaudited) | | 13 |
Schedule of Investments | | 15 |
Statements of Assets and Liabilities | | 19 |
Statement of Operations | | 20 |
Statements of Changes in Net Assets | | 21 |
Financial Highlights | | 22 |
Gurtin National Municipal Intermediate Value Fund | | |
A Message to Our Shareholders (Unaudited) | | 23 |
Performance Chart and Analysis (Unaudited) | | 24 |
Schedule of Investments | | 26 |
Statements of Assets and Liabilities | | 32 |
Statement of Operations | | 33 |
Statements of Changes in Net Assets | | 34 |
Financial Highlights | | 35 |
Gurtin California Municipal Intermediate Value Fund | | |
A Message to Our Shareholders (Unaudited) | | 36 |
Performance Chart and Analysis (Unaudited) | | 37 |
Schedule of Investments | | 39 |
Statements of Assets and Liabilities | | 43 |
Statement of Operations | | 44 |
Statements of Changes in Net Assets | | 45 |
Financial Highlights | | 46 |
Notes to Financial Statements | | 47 |
Report of Independent Registered Public Accounting Firm | | 52 |
Additional Information (Unaudited) | | 53 |
GURTIN NATIONAL MUNICIPAL OPPORTUNISTIC VALUE FUNDA MESSAGE TO OUR SHAREHOLDERS (Unaudited) SEPTEMBER 30, 2016
|
Dear Shareholders:
During the 12-month period from September 30, 2015 through September 30, 2016, we continued to manage the Gurtin National Municipal Opportunistic Value Fund and the Gurtin California Municipal Opportunistic Value Fund (the Gurtin Opportunistic Value Funds) under our disciplined investment approach of opportunistically deploying capital only as attractive investments become available. During this same period, we saw a continued decline in municipal bond yields which made for a difficult investment environment for the Gurtin Opportunistic Value Funds – even following an increase in the fed funds rate by the Federal Reserve (the Fed) in December, which was the first rate increase seen since 2006.
Recognizing the importance of the Fed's actions in an eventual reversal of interest rates' downward trajectory, we have remained focused on the Fed for important clues regarding its approach to monetary policy. We believe that such clues were clearly provided in Fed actions and discussions which seemed to indicate its intentions to raise rates, albeit slowly, as long as the domestic economy continues to perform in a similar manner to 2015 and 2016 year-to-date.
In terms of the trajectory of Fed tightening, our research and the Fed's actions and projections lead us to believe that: 1) the Fed will likely only raise rates when the markets are reasonably calm, 2) the Fed wants to make sure that a fed funds rate increase is discounted in the markets prior to any move, and 3) the trajectory of rates will likely be slow and deliberate, but subject to change based upon future market dynamics. Notably, the Fed was willing to be patient in October, 2015 and restrain from a rate hike during a period of significant volatility and uncertainty in overseas markets, the bond market absorbed the December rate hike without a hiccup, and the terminal fed funds rate is not expected to be reached until after 2018.
While we remain reticent to predict the path for interest rates, we believe a rising rate backdrop will likely result in a somewhat rocky and volatile path for intermediate and longer term municipal yields. Given the strained liquidity in the markets in general, and the municipal market in particular, we expect that any increase in volatility will result in spread widening – not only between municipals and Treasuries, but also in municipal credit spreads which, if history is a guide, will be somewhat random in nature. We continue to believe that the Gurtin Opportunistic Value Funds are well positioned for rising rates, and look forward to being able to use market dynamics such as strained liquidity and randomness of spread widening to our advantage by exploiting opportunities presented to the Gurtin Opportunistic Value Funds by a volatile market.
Sincerely,
William R. Gurtin
CEO, CIO, Managing Partner
Gurtin Fixed Income Management, LLC
Important Information:
Effective August 1, 2016, Gurtin National Municipal Value Fund and Gurtin California Municipal Value Fund were renamed Gurtin National Municipal Opportunistic Value Fund and Gurtin California Municipal Oppportunistic Value Fund, respectively.
There can be no guarantee that any strategy (risk management) or otherwise will be successful. All investing involves risk, including the potential loss of principal.
Bonds: Investing in the bond market is subject to certain risks including market, interest-rate, issuer, credit and inflation risk; investments may be worth more or less than the original cost when redeemed. Income from municipal bonds may be subject to state and local taxes and at times the alternative minimum tax; a strategy concentrating in a single or limited number of states is subject to greater risk of adverse economic conditions and regulatory changes. The value of most bond funds and fixed income securities is impacted by changes in interest rates. Bonds and bond funds with longer durations tend to be more sensitive and more volatile than securities with shorter durations; bond prices generally fall as interest rates rise. Credit risk refers to an issuer's ability to make interest and principal payments when due.
GURTIN NATIONAL MUNICIPAL OPPORTUNISTIC VALUE FUNDPERFORMANCE CHART AND ANALYSIS (Unaudited) SEPTEMBER 30, 2016
The following chart reflects the change in the value of a hypothetical $250,000 investment in Institutional Shares, including reinvested dividends and distributions, in Gurtin National Municipal Opportunistic Value Fund (the "Fund") compared with the performance of the benchmark, Bank of America Merrill Lynch Municipal Miscellaneous Index 7-12 Years ("BAML Muni Misc 7-12") and the Bank of America Merrill Lynch Municipal Blended Index ("BAML Muni Blended"), since inception. The BAML Muni Misc 7-12 was formerly known as the Merrill Lynch Municipal Miscellaneous 7-12 Years Index and measures the performance of municipal securities with a remaining term to final maturity greater than or equal to 7 years and less than 12 years. The BAML Muni Blended is a blend of 75% of The Bank of America Merrill Lynch 7-12 Year US Large Cap Municipal Securities Index, a subset of the Bank of America Merrill Lynch US Large Cap Municipal Securities Index including all securities with a remaining term to final maturity greater than or equal to 7 years and less than 12 years, and 25% of the Bank of America Merrill Lynch 12-22 Year US Large Cap Municipal Securities Index, a subset of the Bank of America Merrill Lynch US Large Cap Municipal Securities Index including all securities with a remaining term to final maturity greater than or equal to 12 years and less than 22 years. The total returns of both the BAML Muni Misc 7-12 and the BAML Muni Blended includes the reinvestment of dividends and income. The total return of the Fund includes operating expenses that reduce returns, while the total returns of the BAML Muni Misc 7-12 and the BAML Muni Blended do not include expenses. The Fund is professionally managed, while the BAML Muni Misc 7-12 and the BAML Muni Blended are unmanaged and are not available for investment. |
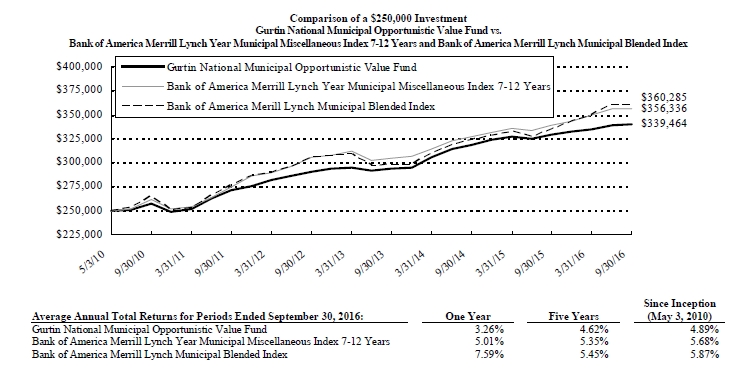
Performance data quoted represents past performance and is no guarantee of future results. Current performance may be lower or higher than the performance data quoted. Investment return and principal value will fluctuate so that shares, when redeemed, may be worth more or less than original cost. For the most recent month-end performance, please call (844) 342-5763. As stated in the Fund's current prospectus, the annual operating expense ratio (gross) is 0.93%. However, the Fund's adviser has contractually agreed to waive its fee and/or reimburse expenses to limit total operating expenses (excluding all taxes, interest, portfolio transaction expenses, acquired fund fees and expenses, proxy expenses and extraordinary expenses) to 0.60%, through January 28, 2017. During the period, certain fees were waived and/or expenses reimbursed; otherwise, returns would have been lower. The performance table and graph do not reflect the deduction of taxes that a shareholder would pay on Fund distributions or the redemption of Fund shares. Returns greater than one year are annualized.
GURTIN NATIONAL MUNICIPAL OPPORTUNISTIC VALUE FUNDPERFORMANCE CHART AND ANALYSIS (Unaudited) SEPTEMBER 30, 2016
|
The Fund's underperformance relative to the benchmark BAML Muni Blended and the BAML Muni Misc 7-12 during the twelve months ended September 30, 2016, was largely attributable to the Fund's relatively more conservative positioning during a period of declining interest rates, with effective duration as of each month end being 44% and 54% that of the benchmark BAML Muni Blended and the BAML Muni Misc 7-12 on average, respectively; while this more conservative positioning was certainly deliberate as we maintained our discipline of opportunistically deploying capital only as attractive investments become available, increased cash associated with advance refunded holdings also contributed to the Fund's shorter effective duration. Historically low yields, a flattened yield curve, tight spreads, drastically decreased market availability of shorter duration bond structures, and massive inflows into long-term mutual funds over an extended period of time combined over the past year to create a difficult investment environment for the Fund. However, we were able to find select opportunities to reinvest cash into lower duration bonds, and price appreciation was a positive driver of performance for the existing holdings in the Fund as municipal yields declined throughout the year.
A privately offered fund managed by the Gurtin National Municipal Opportunistic Value Fund's Adviser and portfolio management team ("Predecessor Fund") reorganized into the Gurtin National Municipal Opportunistic Value Fund on November 3, 2014. This Predecessor Fund was organized on November 16, 2009, and commenced operations on May 3, 2010. The Predecessor Fund had an investment objective and strategies that were, in all material respects, identical to those of the Fund, and was managed in a manner that, in all material respects, complied with the investment guidelines and restrictions of the Gurtin National Municipal Opportunistic Value Fund. The Predecessor Fund, however, was not registered as an investment company under the Investment Company Act of 1940 (the "1940 Act"), and the Predecessor Fund was not subject to certain investment limitations, diversification requirements, liquidity requirements, and other restrictions imposed by the 1940 Act and the Internal Revenue Code of 1986 which, if applicable, may have adversely affected its performance. The Gurtin National Municipal Opportunistic Value Fund's performance for periods prior to the commencement of operations is that of the Predecessor Fund and is based on calculations that are different from the standardized method of calculations adopted by the SEC. The performance of the Predecessor Fund was calculated net of the Predecessor Fund's fees and expenses. The performance of the Predecessor Fund has not been restated to reflect the fees, estimated expenses and fee waivers and/or expense limitations of the Gurtin National Municipal Opportunistic Value Fund. If the performance of the Predecessor Fund had been restated to reflect the applicable fees and expenses of the Gurtin National Municipal Opportunistic Value Fund, the performance may have been higher or lower. Past performance is not indicative of future results.
GURTIN NATIONAL MUNICIPAL OPPORTUNISTIC VALUE FUNDSCHEDULE OF INVESTMENTS SEPTEMBER 30, 2016
|
| | Principal | | Security Description | | Rate | | Maturity | | Value | |
| Municipal Bonds - 98.4% |
| Alabama - 1.4% |
| $ | 1,500,000 | | Alabama Special Care Facilities Financing Authority-Birmingham, Alabama RB | | 5.00 | % | 11/15/39 | $ | 1,508,040 | |
| California - 18.2% |
| | 85,000 | | California Health Facilities Financing Authority, California RB, Series A | | 5.00 | | 04/01/25 | | 85,298 | |
| | 500,000 | | California State Public Works Board, California RB, Series B1 | | 5.63 | | 03/01/30 | | 577,175 | |
| | 2,875,000 | | California State Public Works Board, California RB, Series G | | 5.00 | | 11/01/37 | | 3,392,155 | |
| | 1,000,000 | | City of Fairfield, California COP, Series A (a) | | 6.55 | | 04/01/30 | | 655,500 | |
| | 670,000 | | County of San Bernardino, California COP | | 5.00 | | 08/01/28 | | 677,142 | |
| | 1,450,000 | | Golden State Tobacco Securitization Corp., California RB, Series A | | 5.00 | | 06/01/29 | | 1,747,352 | |
| | 1,000,000 | | Modesto Irrigation District, California RB (b) | | 1.14 | | 09/01/27 | | 956,790 | |
| | 1,000,000 | | Natomas Unified School District, California GOB (a) | | 5.05 | | 08/01/26 | | 604,840 | |
| | 1,000,000 | | Natomas Unified School District, California GOB (a) | | 5.14 | | 08/01/27 | | 570,860 | |
| | 4,795,000 | | Riverside County Public Financing Authority, California Tax Allocation Bond | | 4.75 | | 10/01/35 | | 4,795,527 | |
| | 3,050,000 | | Sacramento County Sanitation Districts Financing Authority, California RB, Series B (b) | | 1.09 | | 12/01/35 | | 2,839,764 | |
| | 130,000 | | State of California, GOB, Series 07 | | 5.13 | | 10/01/27 | | 130,490 | |
| | 1,500,000 | | Stockton East Water District, California COP, Series B (a) | | 5.96-5.97 | | 04/01/20 | | 1,222,350 | |
| | Principal | | Security Description | | Rate | | Maturity | | Value | |
| $ | 2,200,000 | | Stockton East Water District, California COP, Series B (a) | | 6.09 | % | 04/01/26 | $ | 1,244,716 | |
| | 250,000 | | Victor Valley Community College District, California GOB, Series A | | 5.38 | | 08/01/29 | | 281,155 | |
| | | 19,781,114 | |
| Connecticut - 4.7% |
| | 3,000,000 | | State of Connecticut, Connecticut GOB, Series A (b) | | 1.79 | | 03/01/24 | | 3,005,430 | |
| | 2,125,000 | | State of Connecticut, Connecticut GOB, Series F | | 5.00 | | 12/01/21 | | 2,140,491 | |
| | | 5,145,921 | |
| District of Columbia - 2.7% |
| | 2,900,000 | | Washington Convention & Sports Authority, District of Columbia RB, Series A | | 4.50 | | 10/01/30 | | 2,908,990 | |
| | | | |
| Florida - 6.9% |
| | 2,775,000 | | County of Miami-Dade Transit System, Florida RB | | 5.00 | | 07/01/32 | | 2,955,569 | |
| | 1,145,000 | | Highlands County Health Facilities Authority, Florida RB, Series G | | 5.13 | | 11/15/22 | | 1,151,240 | |
| | 675,000 | | South Florida Water Management District, Florida COP | | 5.00 | | 10/01/36 | | 675,081 | |
| | 2,675,000 | | South Miami Health Facilities Authority, Florida RB | | 5.00 | | 08/15/32 | | 2,755,571 | |
| | | 7,537,461 | |
| Illinois - 14.4% |
| | 500,000 | | Chicago Park District, Illinois GOB, Series A | | 5.00 | | 01/01/27 | | 549,200 | |
| | 525,000 | | Chicago Park District, Illinois GOB, Series A | | 5.50 | | 01/01/33 | | 622,356 | |
| | 980,000 | | Chicago Park District, Illinois GOB, Series A | | 5.00 | | 01/01/33 | | 1,053,725 | |
| | 3,000,000 | | Chicago Park District, Illinois GOB, Series A | | 5.75 | | 01/01/38 | | 3,605,460 | |
| | 1,975,000 | | Chicago Park District, Illinois GOB, Series A | | 5.00 | | 01/01/40 | | 2,176,509 | |
See Notes to Financial Statements. | 5 | |
GURTIN NATIONAL MUNICIPAL OPPORTUNISTIC VALUE FUNDSCHEDULE OF INVESTMENTS SEPTEMBER 30, 2016
|
| | Principal | | Security Description | | Rate | | Maturity | | Value | |
| $ | 1,500,000 | | Chicago Park District, Illinois GOB, Series C | | 5.00 | % | 01/01/27 | $ | 1,663,785 | |
| | 900,000 | | Chicago Park District, Illinois GOB, Series C | | 5.00 | | 01/01/29 | | 990,054 | |
| | 1,250,000 | | Illinois Finance Authority, Illinois RB | | 5.00 | | 07/01/46 | | 1,289,400 | |
| | 525,000 | | Illinois Finance Authority, Illinois RB, Series D | | 6.25 | | 11/01/28 | | 583,028 | |
| | 1,030,000 | | University of Illinois, Illinois RB, Series A | | 5.13 | | 04/01/36 | | 1,155,197 | |
| | 900,000 | | University of Illinois, Illinois RB, Series A | | 5.00 | | 04/01/39 | | 1,025,316 | |
| | 825,000 | | Will Grundy Etc Counties Community College District No. 525, Illinois GOB, Series B | | 5.25 | | 06/01/36 | | 973,038 | |
| | | 15,687,068 | |
| Indiana - 7.5% |
| | 2,335,000 | | Indiana Finance Authority, Indiana RB, Series A | | 4.50 | | 12/01/24 | | 2,348,660 | |
| | 3,575,000 | | Indiana Finance Authority, Indiana RB, Series A | | 3.00 | | 06/01/29 | | 3,586,869 | |
| | 1,950,000 | | Indiana Finance Authority, Indiana RB, Series A | | 5.00 | | 05/01/42 | | 2,218,905 | |
| | | 8,154,434 | |
| Kansas - 1.8% |
| | 2,000,000 | | State of Kansas Department of Transportation, Kansas RB, Series B-3 (b) | | 0.59 | | 09/01/17 | | 1,994,680 | |
| | | | |
| Louisiana - 2.5% |
| | 2,750,000 | | State of Louisiana Gasoline & Fuels Tax Revenue, Louisiana RB, Series B2 (b) | | 0.92 | | 05/01/43 | | 2,737,350 | |
| | | | |
| Maryland - 0.6% |
| | 625,000 | | Montgomery County Housing Opportunites Commission, Maryland RB, Series C | | 5.00 | | 07/01/31 | | 682,725 | |
| | | | |
| Massachusetts - 0.9% |
| | 935,000 | | Massachusetts Housing Finance Agency, Massachusetts RB, Series C | | 5.00 | | 12/01/30 | | 983,190 | |
| | | | |
| | Principal | | Security Description | | Rate | | Maturity | | Value | |
| Michigan - 2.2% |
| $ | 550,000 | | Michigan State Building Authority, Michigan RB, Series A | | 5.20 | % | 10/15/31 | $ | 638,770 | |
| | 1,760,000 | | Michigan State Housing Development Authority, Michigan RB, Series A | | 5.15 | | 10/01/29 | | 1,760,211 | |
| | | 2,398,981 | |
| Minnesota - 4.4% |
| | 4,775,000 | | Minneapolis-St Paul Metropolitan Airports Commission, Minnesota RB, Series A | | 4.50 | | 01/01/32 | | 4,818,596 | |
| | | | |
| Nevada - 0.1% |
| | 145,000 | | Nevada Housing Division, Nevada RB, Series A | | 5.85 | | 10/01/20 | | 145,583 | |
| | | | |
| New York - 4.9% |
| | 1,000,000 | | Metropolitan Transportation Authority, New York RB, Series A | | 5.00 | | 11/15/31 | | 1,005,710 | |
| | 2,500,000 | | New York State Dormitory Authority, New York RB | | 5.00 | | 07/01/46 | | 2,575,550 | |
| | 50,000 | | New York State Dormitory Authority, New York RB, Series D | | 5.75 | | 02/15/19 | | 50,211 | |
| | 1,410,000 | | Schenectady Metroplex Development Authority, New York RB, Series A | | 5.50 | | 08/01/33 | | 1,752,320 | |
| | | 5,383,791 | |
| North Carolina - 3.0% |
| | 3,200,000 | | North Carolina Capital Facilities Finance Agency, North Carolina RB, Series A | | 5.00 | | 10/01/41 | | 3,211,200 | |
| | | | |
| Ohio - 8.2% |
| | 2,950,000 | | American Municipal Power, Inc., Ohio RB, Series B | | 5.00 | | 02/15/37 | | 3,406,955 | |
| | 5,225,000 | | Ohio Higher Educational Facility Commission, Ohio RB, Series A | | 5.25 | | 01/01/33 | | 5,513,524 | |
| | | 8,920,479 | |
See Notes to Financial Statements. | 6 | |
GURTIN NATIONAL MUNICIPAL OPPORTUNISTIC VALUE FUNDSCHEDULE OF INVESTMENTS SEPTEMBER 30, 2016
|
| | Principal | | Security Description | | Rate | | Maturity | | Value | |
| Pennsylvania - 1.2% |
| $ | 1,300,000 | | Elizabethtown Area School District, Pennsylvania GOB | | 2.00 | % | 03/01/18 | $ | 1,306,071 | |
| | | | |
| Texas - 4.9% |
| | 1,425,000 | | City of San Antonio Electric & Gas Systems Revenue, Texas RB | | 5.00 | | 02/01/32 | | 1,444,893 | |
| | 1,600,000 | | County of Harris, Texas RB (b) | | 1.22 | | 08/15/35 | | 1,463,776 | |
| | 1,375,000 | | Lamar Consolidated Independent School District, Texas GOB | | 5.00 | | 02/15/38 | | 1,396,423 | |
| | 1,000,000 | | Red River Education Financing Corp., Texas RB | | 5.00 | | 03/15/38 | | 1,019,380 | |
| | | 5,324,472 | |
| Virginia - 2.6% |
| | 2,775,000 | | Fairfax County Redevelopment & Housing Authority, Virginia RB | | 4.75 | | 04/01/38 | | 2,821,343 | |
| | | | |
| Washington - 5.3% |
| | 1,715,000 | | Central Puget Sound Regional Transit Authority, Washington RB | | 4.75 | | 02/01/28 | | 1,830,882 | |
| | 2,000,000 | | City of Seattle Drainage & Wastewater Revenue, Washington RB | | 5.00 | | 06/01/38 | | 2,136,580 | |
| | 1,455,000 | | Everett Housing Authority, Washington RB (b) | | 4.89 | | 06/01/37 | | 1,472,882 | |
| | 250,000 | | State of Washington, Washington COP, Series D | | 5.45 | | 07/01/28 | | 275,485 | |
| | | 5,715,829 | |
Total Municipal Bonds (Cost $103,680,950) | | 107,167,318 | |
| | Shares | | Security Description | | Value | |
| Money Market Fund - 0.5% |
| | 581,273 | | Fidelity Government Money Market Fund, 0.27% (b) (Cost $581,273) | | 581,273 | |
| | | | |
Total Investments - 98.9% (Cost $104,262,223)* | $ | 107,748,591 | |
| Other Assets & Liabilities, Net – 1.1% | | 1,173,629 | |
| Net Assets – 100.0% | $ | 108,922,220 | |
| (a) | Zero coupon bond. Interest rate presented is yield to maturity. |
| (b) | Variable rate security. Rate presented is as of September 30, 2016. |
| COP | Certificate of Participation |
| GOB | General Obligation Bond |
* Cost for federal income tax purposes is $104,262,223 and net unrealized appreciation consists of:
| Gross Unrealized Appreciation | | $ | 3,533,543 | |
| Gross Unrealized Depreciation | | | (47,175 | ) |
| Net Unrealized Appreciation | | $ | 3,486,368 | |
The inputs or methodology used for valuing securities are not necessarily an indication of the risks associated with investing in those securities. For more information on valuation inputs, and their aggregation into the levels used in the table below, please refer to the Security Valuation section in Note 2 of the accompanying Notes to Financial Statements.
The following is a summary of the inputs used to value the Fund's investments as of September 30, 2016.
| Valuation Inputs | | Investments in Securities |
| Level 1 - Quoted Prices | | $ | - | |
| Level 2 - Other Significant Observable Inputs | | | 107,748,591 | |
| Level 3 - Significant Unobservable Inputs | | | - | |
| Total | | $ | 107,748,591 | |
The Level 2 value displayed in this table includes Municipal Bonds and a Money Market Fund. Refer to this Schedule of Investments for a further breakout of each Municipal Bond security by state.
The Fund utilizes the end of period methodology when determining transfers. There were no transfers among Level 1, Level 2 and Level 3 for the year ended September 30, 2016.
AFA
| PORTFOLIO HOLDINGS | | |
| % of Total Investments | | |
| Municipal Bonds | 99.5 | % |
| Money Market Fund | 0.5 | % |
| | 100.0 | % |
| INVESTMENT INCOME | | | | | | |
| | Dividend income | . | | $ | 11,035 | | |
| | Interest income | | | 2,563,623 | | |
| Total Investment Income | | | | 2,574,658 | | |
| | | | | | | |
| EXPENSES | | | | | | |
| | Investment adviser fees | | | 480,810 | | |
| | Fund services fees | | | 140,440 | | |
| | Custodian fees | | | 11,302 | | |
| | Registration fees | | | 16,210 | | |
| | Professional fees | | | 37,749 | | |
| | Trustees' fees and expenses | | | 9,653 | | |
| | Offering costs | | | 5,655 | | |
| | Miscellaneous expenses | | | 52,818 | | |
| Total Expenses | | | | 754,637 | | |
| | Fees waived | | | (113,559 | ) | |
| Net Expenses | | | | 641,078 | | |
| | | | | | | | |
| NET INVESTMENT INCOME | | | | 1,933,580 | | |
| | | | | | | | |
| NET REALIZED AND UNREALIZED GAIN | | | | | | |
| | Net realized gain on investments | | | 224,340 | | |
| | Net change in unrealized appreciation on investments | | | 1,229,771 | | |
| NET REALIZED AND UNREALIZED GAIN | | | | 1,454,111 | | |
| INCREASE IN NET ASSETS RESULTING FROM OPERATIONS | | | $ | 3,387,691 | | |
| | | | | | | | |
See Notes to Financial Statements. | 9 | |
GURTIN NATIONAL MUNICIPAL OPPORTUNISTIC VALUE FUNDSTATEMENT OF CHANGES IN NET ASSETS
|
| | | | | | | | | | | | |
| | | | | For the Year Ended September 30, 2016 | | | November 3, 2014* through September 30, 2015 |
| OPERATIONS | | | | | | | | | |
| | Net investment income | | $ | 1,933,580 | | | | $ | 1,301,681 | |
| | Net realized gain (loss) | | | 224,340 | | | | | (16,111 | ) |
| | Net change in unrealized appreciation | | | 1,229,771 | | | | | 171,293 | |
| Increase in Net Assets Resulting from Operations | | | 3,387,691 | | | | | 1,456,863 | |
| | | | | | | | | | | | |
| DISTRIBUTIONS TO SHAREHOLDERS FROM | | | | | | | | | |
| | Net investment income | | | (1,933,804 | ) | | | | (1,301,676 | ) |
| | | | | | | | | | | | |
| CAPITAL SHARE TRANSACTIONS | | | | | | | | | |
| | Sale of shares | | | 27,315,987 | | | | | 106,706,244 | |
| | Reinvestment of distributions | | | 1,729,254 | | | | | 1,136,510 | |
| | Redemption of shares | | | (13,308,725 | ) | | | | (16,266,124 | ) |
| Increase in Net Assets from Capital Share Transactions | | | 15,736,516 | | | | | 91,576,630 | |
| Increase in Net Assets | | | 17,190,403 | | | | | 91,731,817 | |
| | | | | | | | | | | | |
| NET ASSETS | | | | | | | | | |
| | Beginning of Period | | | 91,731,817 | | | | | - | |
| | End of Period (Including line (a)) | | $ | 108,922,220 | | | | $ | 91,731,817 | |
| | | | | | | | | | | | |
| SHARE TRANSACTIONS | | | | | | | | | |
| | Sale of shares | | | 2,713,337 | | | | | 10,678,702 | |
| | Reinvestment of distributions | | | 171,051 | | | | | 113,588 | |
| | Redemption of shares | | | (1,315,943 | ) | | | | (1,628,881 | ) |
| Increase in Shares | | | 1,568,445 | | | | | 9,163,409 | |
| | | | | | | | | | | | |
| (a) | Undistributed (distributions in excess of) net investment income | | $ | (219 | ) | | | $ | 5 | |
| * | Commencement of operations. | | | | | | | | | |
See Notes to Financial Statements. | 10 | |
GURTIN NATIONAL MUNICIPAL OPPORTUNISTIC VALUE FUNDFINANCIAL HIGHLIGHTS
|
| These financial highlights reflect selected data for a share outstanding throughout each period. |
| | | For the Year Ended September 30, 2016 | | November 3, 2014 (a) through September 30, 2015 | |
| INSTITUTIONAL CLASS | | | | | | | | |
| NET ASSET VALUE, Beginning of Period | $ | 10.01 | | | $ | 10.00 | | |
| INVESTMENT OPERATIONS | | | | | | | | |
| Net investment income (b) | | 0.18 | | | | 0.20 | | |
| Net realized and unrealized gain | | 0.14 | | | | 0.02 | | |
| Total from Investment Operations | | 0.32 | | | | 0.22 | | |
| DISTRIBUTIONS TO SHAREHOLDERS FROM | | | | | | | | |
| Net investment income | | (0.18 | ) | | | (0.21 | ) | |
| NET ASSET VALUE, End of Period | $ | 10.15 | | | $ | 10.01 | | |
| TOTAL RETURN | | 3.26 | % | | 2.18 | %(c) |
| RATIOS/SUPPLEMENTARY DATA | | | | | | | | |
| Net Assets at End of Period (000's omitted) | $108,922 | | | $91,732 | | |
| Ratios to Average Net Assets: | | | | | | | | |
| Net investment income | | 1.81 | % | | 2.21 | %(d) |
| Net expenses | | 0.60 | % | | 0.60 | %(d) |
| Gross expenses (e) | | 0.71 | % | | 0.93 | %(d) |
| PORTFOLIO TURNOVER RATE | | 59 | % | | 32 | %(c) |
| | | | | | | | | | |
| | | | | | | | | | |
| (a) | Commencement of operations. |
| (b) | Calculated based on average shares outstanding during each period. |
| (c) | Not annualized. |
| (d) | Annualized. |
| (e) | Reflects the expense ratio excluding any waivers and/or reimbursements. |
See Notes to Financial Statements. | 11 | |
GURTIN CALIFORNIA MUNICIPAL OPPORTUNISTIC VALUE FUNDA MESSAGE TO OUR SHAREHOLDERS (Unaudited) SEPTEMBER 30, 2016
|
Dear Shareholders:
During the 12-month period from September 30, 2015 through September 30, 2016, we continued to manage the Gurtin National Municipal Opportunistic Value Fund and the Gurtin California Municipal Opportunistic Value Fund (the Gurtin Opportunistic Value Funds) under our disciplined investment approach of opportunistically deploying capital only as attractive investments become available. During this same period, we saw a continued decline in municipal bond yields which made for a difficult investment environment for the Gurtin Opportunistic Value Funds – even following an increase in the fed funds rate by the Federal Reserve (the Fed) in December, which was the first rate increase seen since 2006.
Recognizing the importance of the Fed's actions in an eventual reversal of interest rates' downward trajectory, we have remained focused on the Fed for important clues regarding its approach to monetary policy. We believe that such clues were clearly provided in Fed actions and discussions which seemed to indicate its intentions to raise rates, albeit slowly, as long as the domestic economy continues to perform in a similar manner to 2015 and 2016 year-to-date.
In terms of the trajectory of Fed tightening, our research and the Fed's actions and projections lead us to believe that: 1) the Fed will likely only raise rates when the markets are reasonably calm, 2) the Fed wants to make sure that a fed funds rate increase is discounted in the markets prior to any move, and 3) the trajectory of rates will likely be slow and deliberate, but subject to change based upon future market dynamics. Notably, the Fed was willing to be patient in October, 2015 and restrain from a rate hike during a period of significant volatility and uncertainty in overseas markets, the bond market absorbed the December rate hike without a hiccup, and the terminal fed funds rate is not expected to be reached until after 2018.
While we remain reticent to predict the path for interest rates, we believe a rising rate backdrop will likely result in a somewhat rocky and volatile path for intermediate and longer term municipal yields. Given the strained liquidity in the markets in general, and the municipal market in particular, we expect that any increase in volatility will result in spread widening – not only between municipals and Treasuries, but also in municipal credit spreads which, if history is a guide, will be somewhat random in nature. We continue to believe that the Gurtin Opportunistic Value Funds are well positioned for rising rates, and look forward to being able to use market dynamics such as strained liquidity and randomness of spread widening to our advantage by exploiting opportunities presented to the Gurtin Opportunistic Value Funds by a volatile market.
Sincerely,
William R. Gurtin
CEO, CIO, Managing Partner
Gurtin Fixed Income Management, LLC
Important Information:
Effective August 1, 2016, Gurtin National Municipal Value Fund and Gurtin California Municipal Value Fund were renamed Gurtin National Municipal Opportunistic Value Fund and Gurtin California Municipal Oppportunistic Value Fund, respectively.
There can be no guarantee that any strategy (risk management) or otherwise will be successful. All investing involves risk, including the potential loss of principal.
Bonds: Investing in the bond market is subject to certain risks including market, interest-rate, issuer, credit and inflation risk; investments may be worth more or less than the original cost when redeemed. Income from municipal bonds may be subject to state and local taxes and at times the alternative minimum tax; a strategy concentrating in a single or limited number of states is subject to greater risk of adverse economic conditions and regulatory changes. The value of most bond funds and fixed income securities is impacted by changes in interest rates. Bonds and bond funds with longer durations tend to be more sensitive and more volatile than securities with shorter durations; bond prices generally fall as interest rates rise. Credit risk refers to an issuer's ability to make interest and principal payments when due.
GURTIN CALIFORNIA MUNICIPAL OPPORTUNISTIC VALUE FUNDPERFORMANCE CHART AND ANALYSIS (Unaudited) SEPTEMBER 30, 2016
|
The following chart reflects the change in the value of a hypothetical $250,000 investment in Institutional Shares, including reinvested dividends and distributions, in Gurtin California Municipal Opportunistic Value Fund (the "Fund") compared with the performance of the benchmark, Bank of America Merrill Lynch Municipal Miscellaneous Index 7-12 Years ("BAML Muni Misc 7-12") and the Bank of America Merrill Lynch Municipal Blended Index ("BAML Muni Blended"), since inception. The BAML Muni Misc 7-12 was formerly known as the Merrill Lynch Municipal Miscellaneous 7-12 Years Index and measures the performance of municipal securities with a remaining term to final maturity greater than or equal to 7 years and less than 12 years. The BAML Muni Blended is a blend of 75% of The Bank of America Merrill Lynch 7-12 Year US Large Cap Municipal Securities Index, a subset of the Bank of America Merrill Lynch US Large Cap Municipal Securities Index including all securities with a remaining term to final maturity greater than or equal to 7 years and less than 12 years, and 25% of the Bank of America Merrill Lynch 12-22 Year US Large Cap Municipal Securities Index, a subset of the Bank of America Merrill Lynch US Large Cap Municipal Securities Index including all securities with a remaining term to final maturity greater than or equal to 12 years and less than 22 years. The total returns of both the BAML Muni Misc 7-12 and the BAML Muni Blended includes the reinvestment of dividends and income. The total return of the Fund includes operating expenses that reduce returns, while the total returns of the BAML Muni Misc 7-12 and the BAML Muni Blended do not include expenses. The Fund is professionally managed, while the BAML Muni Misc 7-12 and the BAML Muni Blended are unmanaged and are not available for investment.
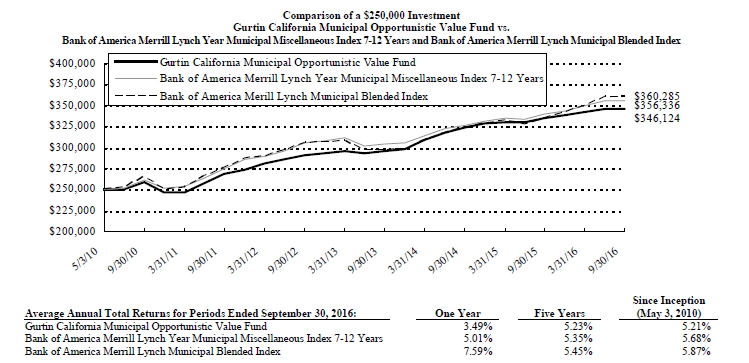
Performance data quoted represents past performance and is no guarantee of future results. Current performance may be lower or higher than the performance data quoted. Investment return and principal value will fluctuate so that shares, when redeemed, may be worth more or less than original cost. For the most recent month-end performance, please call (844) 342-5763. As stated in the Fund's current prospectus, the annual operating expense ratio (gross) is 0.79%. However, the Fund's adviser has contractually agreed to waive its fee and/or reimburse expenses to limit total operating expenses (excluding all taxes, interest, portfolio transaction expenses, acquired fund fees and expenses, proxy expenses and extraordinary expenses) to 0.60%, through January 28, 2017. During the period, certain fees were waived and/or expenses reimbursed; otherwise, returns would have been lower. The performance table and graph do not reflect the deduction of taxes that a shareholder would pay on Fund distributions or the redemption of Fund shares. Returns greater than one year are annualized.
GURTIN CALIFORNIA MUNICIPAL OPPORTUNISTIC VALUE FUNDPERFORMANCE CHART AND ANALYSIS (Unaudited) SEPTEMBER 30, 2016
|
| | Principal | | Security Description | | Rate | | Maturity | | Value | |
| $ | 105,000 | | San Mateo Union High School District, California GOB, Series A (b) | | 6.02 | % | 09/01/25 | $ | 77,040 | |
| | 895,000 | | San Mateo Union High School District, California GOB, Series A (b) | | 6.02 | | 09/01/25 | | 650,083 | |
| | 2,355,000 | | Sierra View Local Health Care District, California RB | | 5.25 | | 07/01/37 | | 2,433,822 | |
| | 5,000 | | State of California, California GOB | | 5.00 | | 10/01/28 | | 5,018 | |
| | 525,000 | | State of California, California GOB | | 5.00 | | 11/01/37 | | 547,197 | |
| | 2,825,000 | | State of California, California GOB | | 5.00 | | 11/01/37 | | 2,954,922 | |
| | 135,000 | | State of California, California GOB, Series 07 | | 5.13 | | 10/01/27 | | 135,509 | |
| | 85,000 | | State of California, California GOB, Series 2007 | | 5.75 | | 05/01/30 | | 85,360 | |
| | 3,300,000 | | Stockton East Water District, California COP, Series B (b) | | 5.96-6.00 | | 04/01/21 | | 2,531,991 | |
| | 2,000,000 | | Stockton East Water District, California COP, Series B (b) | | 6.08 | | 04/01/25 | | 1,202,680 | |
| | 775,000 | | Stockton Unified School District, California GOB | | 5.00 | | 07/01/27 | | 929,403 | |
| | 1,600,000 | | Tulare County Board of Education, California COP | | 5.38 | | 05/01/33 | | 1,897,456 | |
| | 250,000 | | Victor Valley Community College District, California GOB, Series A | | 5.38 | | 08/01/29 | | 281,155 | |
| | | 163,695,342 | |
| Illinois - 9.5% |
| | 1,000,000 | | Chicago Park District, Illinois GOB, Series A | | 5.00 | | 01/01/30 | | 1,125,980 | |
| | 1,000,000 | | Chicago Park District, Illinois GOB, Series A | | 5.00 | | 01/01/35 | | 1,107,450 | |
| | 2,050,000 | | Chicago Park District, Illinois GOB, Series A | | 5.75 | | 01/01/38 | | 2,463,731 | |
| | 2,325,000 | | Chicago Park District, Illinois GOB, Series A | | 5.00 | | 01/01/40 | | 2,562,220 | |
| | 1,755,000 | | Chicago Park District, Illinois GOB, Series B | | 5.00 | | 01/01/26 | | 2,048,120 | |
| | 1,000,000 | | Chicago Park District, Illinois GOB, Series B | | 5.00 | | 01/01/26 | | 1,167,020 | |
| | Principal | | Security Description | | Rate | | Maturity | | Value | |
| $ | 1,580,000 | | Chicago Park District, Illinois GOB, Series C | | 5.00 | % | 01/01/23 | $ | 1,817,742 | |
| | 1,600,000 | | Chicago Park District, Illinois GOB, Series C | | 5.25 | | 01/01/37 | | 1,777,776 | |
| | 3,580,000 | | Chicago Park District, Illinois GOB, Series C | | 5.25 | | 01/01/40 | | 3,959,480 | |
| | | 18,029,519 | |
| Louisiana - 1.7% |
| | 3,340,000 | | State of Louisiana Gasoline & Fuels Tax Revenue, Louisiana RB, Series B2 (a) | | 0.92 | | 05/01/43 | | 3,324,636 | |
| | | | |
| Texas - 0.5% |
| | 1,000,000 | | Tarrant County Cultural Education Facilities Finance Corp. , Texas RB, Series A | | 5.00 | | 02/15/36 | | 1,014,120 | |
| | | | |
Total Municipal Bonds (Cost $178,547,840) | | 186,063,617 | |
| | Shares | | Security Description | | Value | |
| Money Market Fund - 1.4% |
| | 2,760,666 | | Fidelity Government Money Market Fund, 0.27% (a) (Cost $2,760,666) | | 2,760,666 | |
| | | | |
Total Investments - 99.1% (Cost $181,308,506)* | $ | 188,824,283 | |
| Other Assets & Liabilities, Net – 0.9% | | 1,638,092 | |
| Net Assets – 100.0% | $ | 190,462,375 | |
| (a) | Variable rate security. Rate presented is as of September 30, 2016. |
| (b) | Zero coupon bond. Interest rate presented is yield to maturity. |
COP Certificate of Participation
GOB General Obligation Bond
RB Revenue Bond
* Cost for federal income tax purposes is $181,308,506 and net unrealized appreciation consists of:
| Gross Unrealized Appreciation | | $ | 7,597,749 | |
| Gross Unrealized Depreciation | | | (81,972 | ) |
| Net Unrealized Appreciation | | $ | 7,515,777 | |
The inputs or methodology used for valuing securities are not necessarily an indication of the risks associated with investing in those securities. For more information on valuation inputs, and their aggregation into the levels used in the table below, please refer to the Security Valuation section in Note 2 of the accompanying Notes to Financial Statements.
The following is a summary of the inputs used to value the Fund's investments as of September 30, 2016.
| Valuation Inputs | | Investments in Securities |
| Level 1 - Quoted Prices | | $ | - | |
| Level 2 - Other Significant Observable Inputs | | | 188,824,283 | |
| Level 3 - Significant Unobservable Inputs | | | - | |
| Total | | $ | 188,824,283 | |
The Level 2 value displayed in this table includes Municipal Bonds and a Money Market Fund. Refer to this Schedule of Investments for a further breakout of each Municipal Bond security by state.
The Fund utilizes the end of period methodology when determining transfers. There were no transfers among Level 1, Level 2 and Level 3 for the year ended September 30, 2016.
AFA
| PORTFOLIO HOLDINGS | | |
| % of Total Investments | | |
| Municipal Bonds | 98.5 | % |
| Money Market Fund | 1.5 | % |
| | 100.0 | % |
See Notes to Financial Statements. | 18 | |
GURTIN CALIFORNIA MUNICIPAL OPPORTUNISTIC VALUE FUNDSTATEMENT OF ASSETS AND LIABILITIES SEPTEMBER 30, 2016
|
See Notes to Financial Statements. | 19 | |
GURTIN CALIFORNIA MUNICIPAL OPPORTUNISTIC VALUE FUNDSTATEMENT OF OPERATIONS YEAR ENDED SEPTEMBER 30, 2016
|
| INVESTMENT INCOME | | | | | | |
| | Dividend income | . | | $ | 13,034 | | |
| | Interest income | | | 4,659,045 | | |
| Total Investment Income | | | | 4,672,079 | | |
| | | | | | | |
| EXPENSES | | | | | | |
| | Investment adviser fees | | | 828,706 | | |
| | Fund services fees | | | 208,077 | | |
| | Custodian fees | | | 18,861 | | |
| | Registration fees | | | 3,082 | | |
| | Professional fees | | | 42,444 | | |
| | Trustees' fees and expenses | | | 14,894 | | |
| | Offering costs | | | 5,079 | | |
| | Miscellaneous expenses | | | 81,693 | | |
| Total Expenses | | | | 1,202,836 | | |
| | Fees waived | | | (97,896 | ) | |
| Net Expenses | | | | 1,104,940 | | |
| | | | | | | | |
| NET INVESTMENT INCOME | | | | 3,567,139 | | |
| | | | | | | | |
| NET REALIZED AND UNREALIZED GAIN | | | | | | |
| | Net realized gain on investments | | | 393,489 | | |
| | Net change in unrealized appreciation on investments | | | 2,280,170 | | |
| NET REALIZED AND UNREALIZED GAIN | | | | 2,673,659 | | |
| INCREASE IN NET ASSETS RESULTING FROM OPERATIONS | | | $ | 6,240,798 | | |
| | | | | | | | |
See Notes to Financial Statements. | 20 | |
GURTIN CALIFORNIA MUNICIPAL OPPORTUNISTIC VALUE FUNDSTATEMENT OF CHANGES IN NET ASSETS
|
| | | | | | | | | | | | |
| | | | | For the Year Ended September 30, 2016 | | | November 3, 2014* through September 30, 2015 |
| OPERATIONS | | | | | | | | | |
| | Net investment income | | $ | 3,567,139 | | | | $ | 2,313,780 | |
| | Net realized gain (loss) | | | 393,489 | | | | | (87,342 | ) |
| | Net change in unrealized appreciation | | | 2,280,170 | | | | | 830,284 | |
| Increase in Net Assets Resulting from Operations | | | 6,240,798 | | | | | 3,056,722 | |
| | | | | | | | | | | | |
| DISTRIBUTIONS TO SHAREHOLDERS FROM | | | | | | | | | |
| | Net investment income | | | (3,567,134 | ) | | | | (2,313,763 | ) |
| | | | | | | | | | | | |
| CAPITAL SHARE TRANSACTIONS | | | | | | | | | |
| | Sale of shares | | | 40,612,199 | | | | | 181,959,715 | |
| | Reinvestment of distributions | | | 3,404,936 | | | | | 2,119,555 | |
| | Redemption of shares | | | (18,693,551 | ) | | | | (22,357,102 | ) |
| Increase in Net Assets from Capital Share Transactions | | | 25,323,584 | | | | | 161,722,168 | |
| Increase in Net Assets | | | 27,997,248 | | | | | 162,465,127 | |
| | | | | | | | | | | | |
| NET ASSETS | | | | | | | | | |
| | Beginning of Period | | | 162,465,127 | | | | | - | |
| | End of Period (Including line (a)) | | $ | 190,462,375 | | | | $ | 162,465,127 | |
| | | | | | | | | | | | |
| SHARE TRANSACTIONS | | | | | | | | | |
| | Sale of shares | | | 4,002,872 | | | | | 18,169,038 | |
| | Reinvestment of distributions | | | 334,511 | | | | | 211,373 | |
| | Redemption of shares | | | (1,834,265 | ) | | | | (2,232,042 | ) |
| Increase in Shares | | | 2,503,118 | | | | | 16,148,369 | |
| | | | | | | | | | | | |
| (a) | Undistributed net investment income | | $ | 22 | | | | $ | 17 | |
| * | Commencement of operations. | | | | | | | | | |
See Notes to Financial Statements. | 21 | |
GURTIN CALIFORNIA MUNICIPAL OPPORTUNISTIC VALUE FUNDFINANCIAL HIGHLIGHTS
|
| These financial highlights reflect selected data for a share outstanding throughout each period. |
| | | For the Year Ended September 30, 2016 | | November 3, 2014 (a) through September 30, 2015 | |
| INSTITUTIONAL CLASS | | | | | | | | |
| NET ASSET VALUE, Beginning of Period | $ | 10.06 | | | $ | 10.00 | | |
| INVESTMENT OPERATIONS | | | | | | | | |
| Net investment income (b) | | 0.20 | | | | 0.19 | | |
| Net realized and unrealized gain | | 0.15 | | | | 0.07 | | |
| Total from Investment Operations | | 0.35 | | | | 0.26 | | |
| DISTRIBUTIONS TO SHAREHOLDERS FROM | | | | | | | | |
| Net investment income | | (0.20 | ) | | | (0.20 | ) | |
| NET ASSET VALUE, End of Period | $ | 10.21 | | | $ | 10.06 | | |
| TOTAL RETURN | | 3.49 | % | | 2.55 | %(c) |
| RATIOS/SUPPLEMENTARY DATA | | | | | | | | |
| | | | | | | | | |
| Net Assets at End of Period (000's omitted) | $190,462 | | | $162,465 | | |
| Ratios to Average Net Assets: | | | | | | | | |
| Net investment income | | 1.94 | % | | 2.09 | %(d) |
| Net expenses | | 0.60 | % | | 0.60 | %(d) |
| Gross expenses (e) | | 0.65 | % | | 0.79 | %(d) |
| PORTFOLIO TURNOVER RATE | | 58 | % | | 83 | %(c) |
| | | | | | | | | | |
| | | | | | | | | | |
| (a) | Commencement of operations. |
| (b) | Calculated based on average shares outstanding during each period. |
| (c) | Not annualized. |
| (d) | Annualized. |
| (e) | Reflects the expense ratio excluding any waivers and/or reimbursements. |
See Notes to Financial Statements. | 22 | |
GURTIN NATIONAL MUNICIPAL INTERMEDIATE VALUE FUND A MESSAGE TO OUR SHAREHOLDERS (Unaudited) SEPTEMBER 30, 2016
|
Dear Shareholders:
During the fiscal period* ended September 30, 2016, we continued to manage the Gurtin National Municipal Intermediate Value Fund and the Gurtin California Municipal Intermediate Value Fund (the Gurtin Intermediate Value Funds) with a focus on maximizing risk-adjusted long-term income while seeking to preserve capital and liquidity. During this same period, we saw a continued decline in municipal bond yields which made for a difficult investment environment for the Gurtin Intermediate Value Funds – even following an increase in the fed funds rate by the Federal Reserve (the Fed) in December, which was the first rate increase seen since 2006.
Recognizing the importance of the Fed's actions in an eventual reversal of interest rates' downward trajectory, we have remained focused on the Fed for important clues regarding its approach to monetary policy. We believe that such clues were clearly provided in Fed actions and discussions which seemed to indicate its intentions to raise rates, albeit slowly, as long as the domestic economy continues to perform in a similar manner to 2015 and 2016 year-to-date.
In terms of the trajectory of Fed tightening, our research and the Fed's actions and projections lead us to believe that: 1) the Fed will likely only raise rates when the markets are reasonably calm, 2) the Fed wants to make sure that a fed funds rate increase is discounted in the markets prior to any move, and 3) the trajectory of rates will likely be slow and deliberate, but subject to change based upon future market dynamics. Notably, the Fed was willing to be patient in October, 2015 and restrain from a rate hike during a period of significant volatility and uncertainty in overseas markets, the bond market absorbed the December rate hike without a hiccup, and the terminal fed funds rate is not expected to be reached until after 2018.
While we remain reticent to predict the path for interest rates, we believe a rising rate backdrop will likely result in a somewhat rocky and volatile path for intermediate municipal yields. Given the strained liquidity in the markets in general, and the municipal market in particular, we expect that any increase in volatility will result in spread widening – not only between municipals and Treasuries, but also in municipal credit spreads which, if history is a guide, will be somewhat random in nature. We look forward to being able to use market dynamics such as strained liquidity and randomness of spread widening to our advantage by exploiting opportunities presented to the Gurtin Intermediate Value Funds by a volatile market.
Sincerely,

William R. Gurtin
CEO, CIO, Managing Partner
Gurtin Fixed Income Management, LLC
Important Information:
* The Gurtin National Municipal Intermediate Value Fund and the Gurtin California Municipal Intermediate Value Fund commenced operations on December 1, 2015 and December 7, 2015, respectively.
There can be no guarantee that any strategy (risk management) or otherwise will be successful. All investing involves risk, including the potential loss of principal. The Fund is newly formed. Investors in the Fund bear the risk that the Adviser may not be successful in implementing the Fund's investment strategy and the Fund may not achieve scale.
Bonds: Investing in the bond market is subject to certain risks including market, interest-rate, issuer, credit and inflation risk; investments may be worth more or less than the original cost when redeemed. Income from municipal bonds may be subject to state and local taxes and at times the alternative minimum tax; a strategy concentrating in a single or limited number of states is subject to greater risk of adverse economic conditions and regulatory changes. The value of most bond funds and fixed income securities are impacted by changes in interest rates. Bonds and bond funds with longer durations tend to be more sensitive and more volatile than securities with shorter durations; bond prices generally fall as interest rates rise. Credit risk refers to an issuers ability to make interest and principal payments when due.
GURTIN NATIONAL MUNICIPAL INTERMEDIATE VALUE FUND PERFORMANCE CHART AND ANALYSIS (Unaudited) SEPTEMBER 30, 2016
|
The following chart reflects the change in the value of a hypothetical $250,000 investment in Institutional Shares, including reinvested dividends and distributions, in Gurtin National Municipal Intermediate Value Fund (the "Fund") compared with the performance of the benchmark, Bank of America Merrill Lynch Municipal Blended 85% Index ("BAML Muni Blended 85%") and the Bank of America Merrill Lynch 1-12 Year Municipal Index ("BAML 1-2 Muni Index"), since inception. The BAML Muni Blended 85% is a blend of 85% of the Bank of America Merrill Lynch 3-15 Year US Municipal Securities Index, a subset of the Bank of America Merrill Lynch US Municipal Securities Index including all securities with a remaining term to final maturity greater than or equal to three years and less than twelve years, and 15% of the Bank of America Merrill Lynch 1-3 Year US Municipal Securities Index, a subset of the Bank of America Merrill Lynch US Municipal Securities Index including all securities with a remaining term to final maturity greater than or equal to one year and less than three years. BAML 1-12 Year Muni is an unmanaged, market-weighted index that includes investment-grade municipal bonds with maturities greater than one year but less than twelve years. The total returns of both the BAML Muni Blended 85% and the BAML Muni Index 1-12 includes the reinvestment of dividends and income. The total return of the Fund includes operating expenses that reduce returns, while the total returns of the BAML Muni Blended 85% and the BAML Muni Index 1-12 do not include expenses. The Fund is professionally managed, while the BAML Muni Blended 85% and the BAML Muni Index 1-12 are unmanaged and are not available for investment.
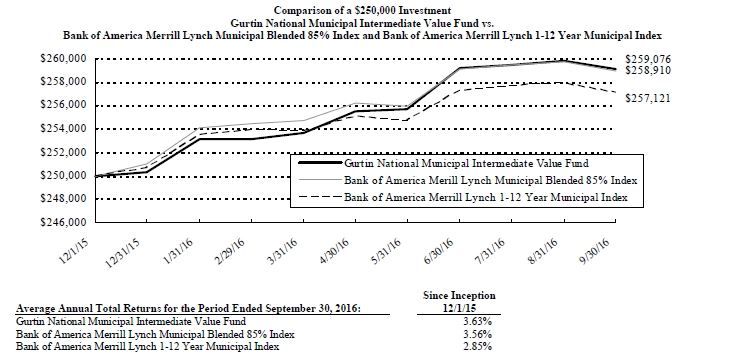
Performance data quoted represents past performance and is no guarantee of future results. Current performance may be lower or higher than the performance data quoted. Investment return and principal value will fluctuate so that shares, when redeemed, may be worth more or less than original cost. For the most recent month-end performance, please call (844) 342-5763. As stated in the Fund's current prospectus, the annual operating expense ratio (gross) is 1.04%. However, the Fund's adviser has contractually agreed to waive its fee and/or reimburse expenses to limit total operating expenses (excluding all taxes, interest, portfolio transaction expenses, acquired fund fees and expenses, proxy expenses and extraordinary expenses) to 0.39%, through January 28, 2017. During the period, certain fees were waived and/or expenses reimbursed; otherwise, returns would have been lower. The performance table and graph do not reflect the deduction of taxes that a shareholder would pay on Fund distributions or the redemption of Fund shares.
The Fund's outperformance of the benchmark BAML Muni Blended 85% and the BAML 1-12 Muni Index during the period December 1, 2015 through September 30, 2016, was primarily attributable to our ability to execute on opportunistic purchases of municipal bond structures and high quality credits which we believe were generally misunderstood and mispriced; additionally, there has also been significant contribution from price appreciation within the Fund as municipal yields fell throughout the year. Although increases in price tend to be universally associated with decreases in interest rates, it is important to recognize the additional role that credit spreads can play. We estimate that about 10% of the overall Fund performance over the past year came from a tightening of option-adjusted spreads. This type of spread tightening can be wide-spread or idiosyncratic. According to Thomson Reuters, as shown in its various Municipal Market Data municipal yield curves, there has been very little change in A spreads over AAA spreads, while there has been notable tightening of BBB spreads over AAA spreads. This provides evidence that some of the performance attained from spread tightening is due to overall market effects, while some is due to security selection through fundamental credit research being performed. Specifically, Fund performance benefited from favorable sector positioning and security structure selection as we took advantage of opportunities in higher quality state and commonwealth general obligation bonds with AA ratings that were trading at single A spreads.
Furthermore, it is interesting to note that price appreciation due to a decline in interest rates is due at least as much to changes in the shape of the municipal yield curve as it is changes in the overall level of the municipal yield curve. Although municipal yields for bonds with less than two years to maturity are actually higher than they were at the beginning of this reporting period, yields across the remainder of the yield curve are significantly lower, particularly farther out on the yield curve. This type of behavior is known as a "bull flattener", which is notable for at least two reasons: 1) Yield curve movements of this type are more commonly associated with looser rather than tighter monetary policy, and 2) Bull flatteners often result in yields across all maturities decreasing. The recent increase in short-term yields, which did produce a moderately negative effect on the Fund's performance, is due to money-market regulatory reforms and possibly also anticipation of tighter monetary policy. The concurrent decline in longer maturity yields is mostly a result of supply and demand factors, resulting in a steep decline in term premiums (the portion of yield not attributable to the market's mean expectations for short-term interest rates over the maturity time horizon), as well as a continued lack of inflationary pressure.
GURTIN NATIONAL MUNICIPAL INTERMEDIATE VALUE FUND SCHEDULE OF INVESTMENTS SEPTEMBER 30, 2016
|
See Notes to Financial Statements. | 26 | |
GURTIN NATIONAL MUNICIPAL INTERMEDIATE VALUE FUND SCHEDULE OF INVESTMENTS SEPTEMBER 30, 2016
|
| | Principal | | Security Description | | Rate | | Maturity | | Value | |
| $ | 1,190,000 | | Cook County Community High School District No. 218 Oak Lawn, Illinois GOB | | 5.00 | % | 12/01/22 | $ | 1,415,719 | |
| | 1,140,000 | | Cook County Community High School District No. 218 Oak Lawn, Illinois GOB | | 5.00 | | 12/01/23 | | 1,379,970 | |
| | 645,000 | | Cook County Community High School District No. 218 Oak Lawn, Illinois GOB | | 4.00 | | 12/01/24 | | 741,066 | |
| | 535,000 | | Cook County School District No. 111 Burbank, Illinois GOB | | 4.00 | | 12/01/23 | | 609,124 | |
| | 1,000,000 | | Cook County School District No. 111 Burbank, Illinois GOB | | 4.00 | | 12/01/25 | | 1,151,240 | |
| | 725,000 | | Cook County School District No. 111 Burbank, Illinois GOB | | 4.00 | | 12/01/29 | | 807,904 | |
| | 1,020,000 | | Cook County School District No. 111 Burbank, Illinois GOB | | 4.00 | | 12/01/30 | | 1,126,692 | |
| | 240,000 | | Cook County School District No. 29 Sunset Ridge, Illinois RB, Series A | | 3.00 | | 12/01/20 | | 256,150 | |
| | 570,000 | | Cook County School District No. 81 Schiller Park, Illinois GOB , Series B | | 4.00 | | 12/01/19 | | 614,705 | |
| | 1,500,000 | | Cook County Township High School District No. 227 Rich Township, Illinois GOB | | 2.00 | | 12/01/18 | | 1,522,920 | |
| | 825,000 | | Du Page County School District No. 33 West Chicago, Illinois GOB, Series B | | 4.00 | | 12/01/26 | | 931,540 | |
| | 500,000 | | Illinois Finance Authority, Illinois RB | | 5.00 | | 11/15/25 | | 587,085 | |
| | 1,000,000 | | Illinois Finance Authority, Illinois RB, Series A | | 5.00 | | 03/15/26 | | 1,017,400 | |
| | 575,000 | | Illinois Finance Authority, Illinois RB, Series C | | 4.50 | | 11/15/32 | | 577,720 | |
| | Principal | | Security Description | | Rate | | Maturity | | Value | |
| $ | 250,000 | | Kane County Community Unit School District No. 304 Geneva, Illinois GOB, Series A | | 5.00 | % | 01/01/26 | $ | 252,495 | |
| | 700,000 | | University of Illinois, Illinois RB, Series A | | 5.00 | | 04/01/30 | | 834,484 | |
| | 780,000 | | Will Grundy Etc Counties Community College District No. 525, Illinois GOB | | 5.75 | | 06/01/25 | | 837,283 | |
| | | 26,288,954 | |
| Indiana - 0.4% |
| | 545,000 | | South Madison Middle School Building Corp., Indiana RB | | 2.00 | | 07/15/18 | | 554,619 | |
| | | | |
| Kansas - 1.0% |
| | 830,000 | | Kansas Development Finance Authority, Kansas RB, Series A | | 5.00 | | 05/01/24 | | 964,020 | |
| | 375,000 | | Kansas Development Finance Authority, Kansas RB, Series G | | 5.00 | | 04/01/25 | | 453,518 | |
| | | 1,417,538 | |
| Kentucky - 5.1% |
| | 300,000 | | Boone County School District Finance Corp., Kentucky RB | | 3.00 | | 04/01/25 | | 320,145 | |
| | 400,000 | | Corbin Independent School District Finance Corp., Kentucky RB | | 2.00 | | 02/01/22 | | 411,492 | |
| | 425,000 | | Corbin Independent School District Finance Corp., Kentucky RB | | 3.00 | | 02/01/25 | | 463,326 | |
| | 630,000 | | Corbin Independent School District Finance Corp., Kentucky RB | | 3.00 | | 02/01/26 | | 681,899 | |
| | 420,000 | | Grant County School District Finance Corp., Kentucky RB | | 3.00 | | 04/01/24 | | 451,479 | |
| | 280,000 | | Kenton County School District Finance Corp., Kentucky RB | | 3.00 | | 02/01/26 | | 298,682 | |
See Notes to Financial Statements. | 27 | |
GURTIN NATIONAL MUNICIPAL INTERMEDIATE VALUE FUND SCHEDULE OF INVESTMENTS SEPTEMBER 30, 2016
|
| | Principal | | Security Description | | Rate | | Maturity | | Value | |
| $ | 250,000 | | Kentucky State Property & Building Commission, Kentucky RB | | 2.50 | % | 10/01/18 | $ | 256,813 | |
| | 1,175,000 | | Kentucky State Property & Building Commission, Kentucky RB | | 5.75 | | 11/01/19 | | 1,286,930 | |
| | 775,000 | | Madison County School District Finance Corp., Kentucky RB | | 5.00 | | 05/01/22 | | 922,428 | |
| | 630,000 | | Madison County School District Finance Corp., Kentucky RB | | 5.00 | | 05/01/23 | | 767,208 | |
| | 1,040,000 | | Meade County School District Finance Corp., Kentucky RB | | 5.00 | | 09/01/20 | | 1,186,266 | |
| | 475,000 | | Owensboro Independent School District Finance Corp., Kentucky RB | | 4.00 | | 09/01/20 | | 520,410 | |
| | | 7,567,078 | |
| Louisiana - 5.9% |
| | 1,265,000 | | Louisiana Public Facilities Authority, Louisiana RB | | 5.00 | | 06/01/22 | | 1,498,595 | |
| | 1,650,000 | | State of Louisiana, Louisiana GOB, Series A | | 5.00 | | 08/01/21 | | 1,931,968 | |
| | 3,000,000 | | State of Louisiana, Louisiana GOB, Series B | | 5.00 | | 08/01/26 | | 3,825,570 | |
| | 1,345,000 | | State of Louisiana, Louisiana GOB, Series C | | 5.00 | | 07/15/24 | | 1,646,011 | |
| | | 8,902,144 | |
| Michigan - 5.4% |
| | 175,000 | | Battle Creek School District, Michigan GOB | | 5.00 | | 05/01/28 | | 213,812 | |
| | 1,065,000 | | Bellevue Community Schools, Michigan GOB, Series A | | 5.00 | | 05/01/31 | | 1,258,553 | |
| | 350,000 | | Central Michigan University, Michigan RB | | 5.00 | | 10/01/24 | | 438,606 | |
| | 225,000 | | Charles Stewart Mott Community College, Michigan GOB | | 3.00 | | 05/01/24 | | 246,521 | |
| | 1,215,000 | | Durand Area Schools, Michigan GOB | | 5.00 | | 05/01/28 | | 1,478,072 | |
| | Principal | | Security Description | | Rate | | Maturity | | Value | |
| $ | 1,225,000 | | Durand Area Schools, Michigan GOB | | 5.00 | % | 05/01/29 | $ | 1,479,604 | |
| | 500,000 | | Howell Public Schools, Michigan GOB, Series B | | 5.00 | | 05/01/25 | | 575,445 | |
| | 695,000 | | L'Anse Creuse Public Schools, Michigan GOB | | 5.00 | | 05/01/25 | | 868,284 | |
| | 210,000 | | Lansing School District, Michigan GOB | | 5.00 | | 05/01/21 | | 243,398 | |
| | 785,000 | | Oakland University, Michigan RB | | 5.00 | | 03/01/29 | | 964,451 | |
| | 200,000 | | Rockford Public Schools, Michigan GOB | | 5.00 | | 05/01/22 | | 236,554 | |
| | | 8,003,300 | |
| Minnesota - 0.2% |
| | 225,000 | | County of Wright, Minnesota GOB, Series A | | 4.50 | | 12/01/19 | | 234,142 | |
| | | | |
| Missouri - 3.2% |
| | 1,690,000 | | City of Cape Girardeau, Missouri RB | | 2.00 | | 06/01/19 | | 1,730,949 | |
| | 1,095,000 | | City of Springfield, Missouri RB, Series B | | 2.00 | | 05/01/22 | | 1,127,620 | |
| | 1,250,000 | | City of Springfield, Missouri RB, Series B | | 3.00 | | 05/01/23 | | 1,357,100 | |
| | 250,000 | | Liberty Public School District No. 53, Missouri COP | | 3.00 | | 04/01/20 | | 265,125 | |
| | 300,000 | | Missouri Joint Municipal Electric Utility Commission, Missouri RB, Series A | | 5.00 | | 01/01/24 | | 367,275 | |
| | | 4,848,069 | |
| New Jersey - 11.5% |
| | 200,000 | | Borough of Tuckerton, New Jersey GOB | | 2.00 | | 03/01/18 | | 202,508 | |
| | 1,000,000 | | Essex County Improvement Authority, New Jersey RB | | 4.75 | | 11/01/32 | | 1,036,600 | |
| | 2,945,000 | | New Jersey Health Care Facilities Financing Authority, New Jersey RB, Series A | | 5.00 | | 07/01/22 | | 3,514,622 | |
See Notes to Financial Statements. | 28 | |
GURTIN NATIONAL MUNICIPAL INTERMEDIATE VALUE FUND SCHEDULE OF INVESTMENTS SEPTEMBER 30, 2016
|
| | Principal | | Security Description | | Rate | | Maturity | | Value | |
| $ | 3,175,000 | | New Jersey Health Care Facilities Financing Authority, New Jersey RB, Series A | | 5.00 | % | 07/01/23 | $ | 3,854,291 | |
| | 4,280,000 | | New Jersey Health Care Facilities Financing Authority, New Jersey RB, Series A | | 5.00 | | 07/01/24 | | 5,273,816 | |
| | 985,000 | | Township of Berkeley, New Jersey GOB | | 3.00 | | 05/15/21 | | 1,057,181 | |
| | 1,020,000 | | Township of Berkeley, New Jersey GOB | | 3.00 | | 05/15/22 | | 1,103,406 | |
| | 1,145,000 | | Township of Berkeley, New Jersey GOB | | 3.00 | | 05/15/23 | | 1,242,611 | |
| | | 17,285,035 | |
| New York - 0.3% |
| | 400,000 | | Metropolitan Transportation Authority, New York RB, Series H | | 5.00 | | 11/15/30 | | 478,784 | |
| | | | |
| North Dakota - 0.3% |
| | 460,000 | | City of Mandan, North Dakota GOB, Series B | | 5.00 | | 05/01/18 | | 488,428 | |
| | | | |
| Ohio - 2.9% |
| | 2,200,000 | | Ohio Higher Educational Facility Commission, Ohio RB, Series A | | 5.13 | | 01/01/28 | | 2,318,910 | |
| | 1,310,000 | | The University of Akron, Ohio RB, Series A | | 4.00 | | 01/01/18 | | 1,358,785 | |
| | 200,000 | | Trotwood-Madison City School District, Ohio COP | | 4.00 | | 12/01/23 | | 233,098 | |
| | 200,000 | | Trotwood-Madison City School District, Ohio COP | | 4.00 | | 12/01/24 | | 235,582 | |
| | 215,000 | | Trotwood-Madison City School District, Ohio COP | | 4.00 | | 12/01/25 | | 255,177 | |
| | | 4,401,552 | |
| Pennsylvania - 16.5% |
| | 845,000 | | Cameron County School District, Pennsylvania GOB | | 2.00 | | 09/01/19 | | 860,261 | |
| | 1,020,000 | | Cameron County School District, Pennsylvania GOB | | 3.00 | | 09/01/20 | | 1,078,813 | |
| | Principal | | Security Description | | Rate | | Maturity | | Value | |
| $ | 1,060,000 | | Cameron County School District, Pennsylvania GOB | | 3.00 | % | 09/01/21 | $ | 1,131,296 | |
| | 1,025,000 | | Cameron County School District, Pennsylvania GOB | | 2.00 | | 09/01/22 | | 1,041,226 | |
| | 230,000 | | Clearfield Area School District, Pennsylvania GOB | | 3.00 | | 09/01/24 | | 231,274 | |
| | 500,000 | | Commonwealth of Pennsylvania, Pennsylvania GOB, First Series | | 5.00 | | 11/15/22 | | 590,205 | |
| | 1,555,000 | | Commonwealth of Pennsylvania, Pennsylvania GOB, First Series | | 5.00 | | 03/15/24 | | 1,909,073 | |
| | 300,000 | | Commonwealth of Pennsylvania, Pennsylvania GOB, First Series | | 5.00 | | 04/01/26 | | 359,277 | |
| | 1,825,000 | | Commonwealth of Pennsylvania, Pennsylvania GOB, First Series | | 5.00 | | 03/15/27 | | 2,239,202 | |
| | 810,000 | | Commonwealth of Pennsylvania, Pennsylvania GOB, First Series | | 5.00 | | 05/15/27 | | 864,205 | |
| | 700,000 | | Commonwealth of Pennsylvania, Pennsylvania GOB, First Series | | 5.00 | | 06/01/28 | | 815,752 | |
| | 600,000 | | Commonwealth of Pennsylvania, Pennsylvania GOB, Second Series | | 5.00 | | 10/15/23 | | 731,628 | |
| | 2,575,000 | | Commonwealth of Pennsylvania, Pennsylvania GOB, Second Series A | | 5.00 | | 05/01/21 | | 2,907,123 | |
| | 365,000 | | Deer Lakes School District, Pennsylvania GOB | | 2.63 | | 04/01/25 | | 370,143 | |
| | 1,460,000 | | East Stroudsburg Area School District, Pennsylvania GOB | | 2.00 | | 09/01/21 | | 1,498,164 | |
| | 390,000 | | East Stroudsburg Area School District, Pennsylvania GOB | | 5.00 | | 09/01/29 | | 412,901 | |
See Notes to Financial Statements. | 29 | |
GURTIN NATIONAL MUNICIPAL INTERMEDIATE VALUE FUND SCHEDULE OF INVESTMENTS SEPTEMBER 30, 2016
|
| | Principal | | Security Description | | Rate | | Maturity | | Value | |
| $ | 110,000 | | East Stroudsburg Area School District, Pennsylvania GOB | | 5.00 | % | 09/01/29 | $ | 115,935 | |
| | 615,000 | | Erie Parking Authority, Pennsylvania RB | | 4.00 | | 09/01/21 | | 684,550 | |
| | 250,000 | | Hampton Township School District, Pennsylvania GOB, Series A | | 3.00 | | 11/15/17 | | 255,593 | |
| | 1,500,000 | | Interboro School District, Pennsylvania GOB, Series A | | 2.55 | | 08/15/26 | | 1,513,770 | |
| | 425,000 | | Northern Tioga School District, Pennsylvania GOB | | 2.00 | | 04/01/21 | | 439,391 | |
| | 265,000 | | Pennsylvania State University, Pennsylvania RB, Series A | | 5.00 | | 03/01/28 | | 291,012 | |
| | 200,000 | | Pennsylvania Turnpike Commission, Pennsylvania RB, Series B | | 5.00 | | 12/01/25 | | 251,910 | |
| | 750,000 | | Red Lion Area School District, Pennsylvania GOB | | 5.00 | | 05/01/23 | | 795,780 | |
| | 680,000 | | South Middleton School District, Pennsylvania GOB | | 3.00 | | 09/01/26 | | 706,581 | |
| | 525,000 | | The Hospitals & Higher Education Facilities Authority of Philadelphia, Pennsylvania RB, Series D | | 5.00 | | 07/01/32 | | 602,217 | |
| | 500,000 | | West Allegheny School District, Pennsylvania GOB | | 3.20 | | 09/01/24 | | 504,300 | |
| | 430,000 | | Wyalusing Area School District, Pennsylvania GOB | | 2.00 | | 04/01/21 | | 443,601 | |
| | 1,120,000 | | York Suburban School District, Pennsylvania GOB | | 2.25 | | 05/01/23 | | 1,131,760 | |
| | | 24,776,943 | |
| Rhode Island - 0.7% |
| | 900,000 | | Rhode Island Health & Educational Building Corp., Rhode Island RB, Series A | | 5.00 | | 09/15/30 | | 1,101,681 | |
| | | | |
| | Principal | | Security Description | | Rate | | Maturity | | Value | |
| South Dakota - 0.4% |
| $ | 315,000 | | South Dakota Board of Regents, South Dakota RB | | 4.00 | % | 04/01/18 | $ | 328,602 | |
| | 250,000 | | South Dakota Board of Regents, South Dakota RB | | 5.00 | | 04/01/19 | | 273,680 | |
| | | 602,282 | |
| Texas - 6.6% |
| | 750,000 | | Brazoria-Fort Bend County Municipal Utility District No. 1, Texas GOB | | 2.00 | | 09/01/19 | | 764,843 | |
| | 845,000 | | Brazoria-Fort Bend County Municipal Utility District No. 1, Texas GOB | | 3.00 | | 09/01/23 | | 910,302 | |
| | 300,000 | | City of Houston, Texas GOB, Series A | | 5.00 | | 03/01/24 | | 353,601 | |
| | 770,000 | | City of Laredo Texas International Toll Bridge System Revenue, Texas RB | | 4.00 | | 10/01/19 | | 830,791 | |
| | 295,000 | | City of League City, Texas GOB, Series B | | 5.00 | | 02/15/30 | | 339,167 | |
| | 500,000 | | Dallas/Fort Worth International Airport, Texas RB | | 5.25 | | 11/01/27 | | 606,915 | |
| | 200,000 | | Fort Bend County Municipal Utility District No. 2, Texas GOB | | 4.35 | | 10/01/29 | | 207,158 | |
| | 1,310,000 | | Harris County Municipal Utility District No. 153, Texas GOB | | 2.00 | | 09/01/20 | | 1,337,851 | |
| | 750,000 | | Harris County Municipal Utility District No. 290, Texas GOB | | 2.00 | | 09/01/21 | | 767,227 | |
| | 235,000 | | Harris County Municipal Utility District No. 383, Texas GOB | | 2.00 | | 09/01/19 | | 241,218 | |
| | 255,000 | | Harris County Municipal Utility District No. 383, Texas GOB | | 3.00 | | 09/01/20 | | 272,723 | |
| | 200,000 | | Harris County Municipal Utility District No. 383, Texas GOB | | 2.00 | | 09/01/20 | | 206,650 | |
| | 235,000 | | Harris County Municipal Utility District No. 383, Texas GOB | | 2.00 | | 09/01/21 | | 243,686 | |
| | Principal | | Security Description | | Rate | | Maturity | | Value | |
| $ | 235,000 | | Harris County Municipal Utility District No. 383, Texas GOB | | 3.00 | % | 09/01/24 | $ | 258,949 | |
| | 235,000 | | Harris County Municipal Utility District No. 383, Texas GOB | | 3.00 | | 09/01/25 | | 256,411 | |
| | 900,000 | | Lower Colorado River Authority, Texas RB | | 5.00 | | 05/15/27 | | 1,066,455 | |
| | 275,000 | | Lower Colorado River Authority, Texas RB | | 5.00 | | 05/15/30 | | 309,053 | |
| | 330,000 | | Reagan County Independent School District, Texas GOB | | 3.00 | | 02/15/23 | | 330,488 | |
| | 590,000 | | Travis County Water Control & Improvement District No. 17, Texas GOB | | 3.00 | | 11/01/25 | | 626,981 | |
| | | 9,930,469 | |
| Vermont - 0.1% |
| | 200,000 | | Vermont Housing Finance Agency, Vermont RB, Series B | | 1.95 | | 05/01/23 | | 204,068 | |
| | | | |
| Washington - 0.3% |
| | 395,000 | | Grant County Public Utility District No. 2, Washington RB, Series B | | 5.00 | | 01/01/26 | | 494,635 | |
| | | | |
| West Virginia - 1.1% |
| | 1,000,000 | | School Building Authority of West Virginia, West Virginia RB, Series A | | 5.00 | | 07/01/21 | | 1,031,100 | |
| | 560,000 | | West Virginia Economic Development Authority, West Virginia RB, Series A | | 5.00 | | 06/01/26 | | 657,070 | |
| | | 1,688,170 | |
| Wisconsin - 2.2% |
| | 600,000 | | Evansville Community School District, Wisconsin GOB | | 3.00 | | 04/01/19 | | 628,830 | |
| | 1,095,000 | | Wisconsin Health & Educational Facilities Authority, Wisconsin RB | | 5.00 | | 03/01/27 | | 1,296,162 | |
| | Principal | | Security Description | | Rate | | Maturity | | Value | |
| $ | 1,130,000 | | Wisconsin Health & Educational Facilities Authority, Wisconsin RB | | 5.00 | % | 03/01/28 | $ | 1,328,304 | |
| | | 3,253,296 | |
Total Municipal Bonds (Cost $144,783,080) | | 146,063,100 | |
| | Shares | | Security Description | | Value | |
| Money Market Fund - 2.9% |
| | 4,389,856 | | Fidelity Government Money Market Fund, 0.27% (b) (Cost $4,389,856) | | 4,389,856 | |
| | | | |
Total Investments - 100.4% (Cost $149,172,936)* | $ | 150,452,956 | |
| Other Assets & Liabilities, Net – (0.4)% | | (638,453 | ) |
| Net Assets – 100.0% | $ | 149,814,503 | |
| (a) | Zero coupon bond. Interest rate presented is yield to maturity. |
| (b) | Variable rate security. Rate presented is as of September 30, 2016. |
| COP | Certificate of Participation |
| GOB | General Obligation Bond |
* Cost for federal income tax purposes is $149,172,990 and net unrealized appreciation consists of:
| Gross Unrealized Appreciation | | $ | 1,398,161 | |
| Gross Unrealized Depreciation | | | (118,195 | ) |
| Net Unrealized Appreciation | | $ | 1,279,966 | |
The inputs or methodology used for valuing securities are not necessarily an indication of the risks associated with investing in those securities. For more information on valuation inputs, and their aggregation into the levels used in the table below, please refer to the Security Valuation section in Note 2 of the accompanying Notes to Financial Statements.
The following is a summary of the inputs used to value the Fund's investments as of September 30, 2016.
| Valuation Inputs | | Investments in Securities |
| Level 1 - Quoted Prices | | $ | - | |
| Level 2 - Other Significant Observable Inputs | | | 150,452,956 | |
| Level 3 - Significant Unobservable Inputs | | | - | |
| Total | | $ | 150,452,956 | |
The Level 2 value displayed in this table includes Municipal Bonds and a Money Market Fund. Refer to this Schedule of Investments for a further breakout of each Municipal Bond security by state.
The Fund utilizes the end of period methodology when determining transfers. There were no transfers among Level 1, Level 2 and Level 3 for the period ended September 30, 2016.
AFA
| PORTFOLIO HOLDINGS | | |
| % of Total Investments | | |
| Municipal Bonds | 97.1 | % |
| Money Market Fund | 2.9 | % |
| | 100.0 | % |
| ASSETS | | | | |
| . | Total investments, at value (Cost $149,172,936) | | $ | 150,452,956 | |
| | Receivables: | | | | |
| | | Fund shares sold | | | 508,380 | |
| | | Dividends and interest | | | 1,421,856 | |
| | Prepaid expenses | | | 4,130 | |
| | Deferred offering costs | | | 5,066 | |
| Total Assets | | | 152,392,388 | |
| | | | | | | |
| LIABILITIES | | | | |
| | Payables: | | | | |
| | | Investment securities purchased | | | 2,357,768 | |
| | | Fund shares redeemed | | | 134,472 | |
| | | Distributions payable | | | 13,687 | |
| | Accrued Liabilities: | | | | |
| | | Investment adviser fees | | | 34,701 | |
| | | Trustees' fees and expenses | | | 467 | |
| | | Fund services fees | | | 7,882 | |
| | | Other expenses | | | 28,908 | |
| Total Liabilities | | | 2,577,885 | |
| | | | | | | |
| NET ASSETS | | $ | 149,814,503 | |
| | | | | | | |
| COMPONENTS OF NET ASSETS | | | | |
| | Paid-in capital | | $ | 148,500,693 | |
| | Undistributed net investment income | | | 3 | |
| | Accumulated net realized gain | | | 33,787 | |
| | Net unrealized appreciation | | | 1,280,020 | |
| NET ASSETS | | $ | 149,814,503 | |
| SHARES OF BENEFICIAL INTEREST AT NO PAR VALUE (UNLIMITED SHARES AUTHORIZED) | | | 14,604,114 | |
| NET ASSET VALUE, OFFERING AND REDEMPTION PRICE PER SHARE | | $ | 10.26 | |
| | | | | | | |
| INVESTMENT INCOME | | | | | | |
| | Dividend income | . | | $ | 20,297 | | |
| | Interest income | | | 1,051,626 | | |
| Total Investment Income | | | | 1,071,923 | | |
| | | | | | | |
| EXPENSES | | | | | | |
| | Investment adviser fees | | | 230,530 | | |
| | Fund services fees | | | 96,305 | | |
| | Custodian fees | | | 8,392 | | |
| | Registration fees | | | 3,280 | | |
| | Professional fees | | | 27,415 | | |
| | Trustees' fees and expenses | | | 5,231 | | |
| | Offering costs | | | 25,332 | | |
| | Miscellaneous expenses | | | 35,379 | | |
| Total Expenses | | | | 431,864 | | |
| | Fees waived | | | (174,882 | ) | |
| Net Expenses | | | | 256,982 | | |
| | | | | | | | |
| NET INVESTMENT INCOME | | | | 814,941 | | |
| | | | | | | | |
| NET REALIZED AND UNREALIZED GAIN | | | | | | |
| | Net realized gain on investments | | | 33,787 | | |
| | Net change in unrealized appreciation on investments | | | 1,280,020 | | |
| NET REALIZED AND UNREALIZED GAIN | | | | 1,313,807 | | |
| INCREASE IN NET ASSETS RESULTING FROM OPERATIONS | | | $ | 2,128,748 | | |
| | | | | | | | |
| * | Commencement of operations was December 1, 2015. | | | | | | |
| | | | | December 1, 2015* through September 30, 2016 | |
| OPERATIONS | | | | | |
| | Net investment income | | $ | 814,941 | | |
| | Net realized gain | | | 33,787 | | |
| | Net change in unrealized appreciation | | | 1,280,020 | | |
| Increase in Net Assets Resulting from Operations | | | 2,128,748 | | |
| | | | | | | | |
| DISTRIBUTIONS TO SHAREHOLDERS FROM | | | | | |
| | Net investment income | | | (814,938 | ) | |
| | | | | | | | |
| CAPITAL SHARE TRANSACTIONS | | | | | |
| | Sale of shares | | | 165,143,617 | | |
| | Reinvestment of distributions | | | 744,221 | | |
| | Redemption of shares | | | (17,387,145 | ) | |
| Increase in Net Assets from Capital Share Transactions | | | 148,500,693 | | |
| Increase in Net Assets | | | 149,814,503 | | |
| | | | | | | | |
| NET ASSETS | | | | | |
| | Beginning of Period | | | - | | |
| | End of Period (Including line (a)) | | $ | 149,814,503 | | |
| | | | | | | | |
| SHARE TRANSACTIONS | | | | | |
| | Sale of shares | | | 16,240,358 | | |
| | Reinvestment of distributions | | | 72,613 | | |
| | Redemption of shares | | | (1,708,857 | ) | |
| Increase in Shares | | | 14,604,114 | | |
| | | | | | | | |
| (a) | Undistributed net investment income | | $ | 3 | | |
| * | Commencement of operations. | | | | | |
See Notes to Financial Statements. | 34 | |
GURTIN NATIONAL MUNICIPAL INTERMEDIATE VALUE FUND FINANCIAL HIGHLIGHTS
|
These financial highlights reflect selected data for a share outstanding throughout the period.
| |
| | | December 1, 2015 (a) through September 30, 2016 | |
| INSTITUTIONAL CLASS | | | | |
| NET ASSET VALUE, Beginning of Period | $ | 10.00 | | |
| INVESTMENT OPERATIONS | | | | |
| Net investment income (b) | | 0.10 | | |
| Net realized and unrealized gain | | 0.26 | | |
| Total from Investment Operations | | 0.36 | | |
| DISTRIBUTIONS TO SHAREHOLDERS FROM | | | | |
| Net investment income | | (0.10 | ) | |
| NET ASSET VALUE, End of Period | $ | 10.26 | | |
| TOTAL RETURN | | 3.63 | %(c) |
| RATIOS/SUPPLEMENTARY DATA | | | | |
| Net Assets at End of Period (000's omitted) | $149,815 | | |
| Ratios to Average Net Assets: | | | | |
| Net investment income | | 1.24 | %(d) |
| Net expenses | | 0.39 | %(d) |
| Gross expenses (e) | | 0.66 | %(d) |
| PORTFOLIO TURNOVER RATE | | 9 | %(c) |
| | | | | | |
| | | | | | |
| (a) | Commencement of operations. |
| (b) | Calculated based on average shares outstanding during the period. |
| (c) | Not annualized. |
| (d) | Annualized. |
| (e) | Reflects the expense ratio excluding any waivers and/or reimbursements. |
See Notes to Financial Statements. | 35 | |
GURTIN CALIFORNIA MUNICIPAL INTERMEDIATE VALUE FUND A MESSAGE TO OUR SHAREHOLDERS SEPTEMBER 30, 2016
|
Dear Shareholders:
During the fiscal period* ended September 30, 2016, we continued to manage the Gurtin National Municipal Intermediate Value Fund and the Gurtin California Municipal Intermediate Value Fund (the Gurtin Intermediate Value Funds) with a focus on maximizing risk-adjusted long-term income while seeking to preserve capital and liquidity. During this same period, we saw a continued decline in municipal bond yields which made for a difficult investment environment for the Gurtin Intermediate Value Funds – even following an increase in the fed funds rate by the Federal Reserve (the Fed) in December, which was the first rate increase seen since 2006.
Recognizing the importance of the Fed's actions in an eventual reversal of interest rates' downward trajectory, we have remained focused on the Fed for important clues regarding its approach to monetary policy. We believe that such clues were clearly provided in Fed actions and discussions which seemed to indicate its intentions to raise rates, albeit slowly, as long as the domestic economy continues to perform in a similar manner to 2015 and 2016 year-to-date.
In terms of the trajectory of Fed tightening, our research and the Fed's actions and projections lead us to believe that: 1) the Fed will likely only raise rates when the markets are reasonably calm, 2) the Fed wants to make sure that a fed funds rate increase is discounted in the markets prior to any move, and 3) the trajectory of rates will likely be slow and deliberate, but subject to change based upon future market dynamics. Notably, the Fed was willing to be patient in October, 2015 and restrain from a rate hike during a period of significant volatility and uncertainty in overseas markets, the bond market absorbed the December rate hike without a hiccup, and the terminal fed funds rate is not expected to be reached until after 2018.
While we remain reticent to predict the path for interest rates, we believe a rising rate backdrop will likely result in a somewhat rocky and volatile path for intermediate municipal yields. Given the strained liquidity in the markets in general, and the municipal market in particular, we expect that any increase in volatility will result in spread widening – not only between municipals and Treasuries, but also in municipal credit spreads which, if history is a guide, will be somewhat random in nature. We look forward to being able to use market dynamics such as strained liquidity and randomness of spread widening to our advantage by exploiting opportunities presented to the Gurtin Intermediate Value Funds by a volatile market.
Sincerely,
William R. Gurtin
CEO, CIO, Managing Partner
Gurtin Fixed Income Management, LLC
Important Information:
* The Gurtin National Municipal Intermediate Value Fund and the Gurtin California Municipal Intermediate Value Fund commenced operations on December 1, 2015 and December 7, 2015, respectively.
There can be no guarantee that any strategy (risk management) or otherwise will be successful. All investing involves risk, including the potential loss of principal. The Fund is newly formed. Investors in the Fund bear the risk that the Adviser may not be successful in implementing the Fund's investment strategy and the Fund may not achieve scale.
Bonds: Investing in the bond market is subject to certain risks including market, interest-rate, issuer, credit and inflation risk; investments may be worth more or less than the original cost when redeemed. Income from municipal bonds may be subject to state and local taxes and at times the alternative minimum tax; a strategy concentrating in a single or limited number of states is subject to greater risk of adverse economic conditions and regulatory changes. The value of most bond funds and fixed income securities are impacted by changes in interest rates. Bonds and bond funds with longer durations tend to be more sensitive and more volatile than securities with shorter durations; bond prices generally fall as interest rates rise. Credit risk refers to an issuers ability to make interest and principal payments when due.
The following chart reflects the change in the value of a hypothetical $250,000 investment in Insitutional Shares, including reinvested dividends and distributions, in Gurtin California Municipal Intermediate Value Fund (the "Fund") compared with the performance of the benchmark, Bank of America Merrill Lynch Municipal Blended 85% Index ("BAML Muni Blended 85%") and the Bank of America Merrill Lynch 1-12 Year Municipal Index ("BAML 1-12 Muni Index"), since inception. The BAML Muni Blended 85% is a blend of 85% of the Bank of America Merrill Lynch 3-15 Year US Municipal Securities Index, a subset of the Bank of America Merrill Lynch US Municipal Securities Index including all securities with a remaining term to final maturity greater than or equal to three years and less than twelve years, and 15% of the Bank of America Merrill Lynch 1-3 Year US Municipal Securities Index, a subset of the Bank of America Merrill Lynch US Municipal Securities Index including all securities with a remaining term to final maturity greater than or equal to one year and less than three years. BAML 1-12 Year Muni is an unmanaged, market-weighted index that includes investment-grade municipal bonds with maturities greater than one year but less than twelve years. The total returns of both the BAML Muni Blended 85% and the BAML Muni Index 1-12 include the reinvestment of dividends and income. The total return of the Fund includes operating expenses that reduce returns, while the total returns of the BAML Muni Blended 85% and the BAML Muni Index 1-12 do not include expenses. The Fund is professionally managed, while the BAML Muni Blended 85% and the BAML Muni Index 1-12 are unmanaged and are not available for investment.
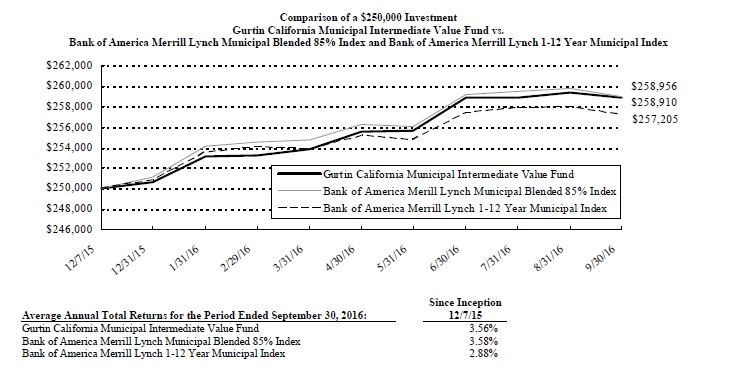
Performance data quoted represents past performance and is no guarantee of future results. Current performance may be lower or higher than the performance data quoted. Investment return and principal value will fluctuate so that shares, when redeemed, may be worth more or less than original cost. For the most recent month-end performance, please call (844) 342-5763. As stated in the Fund's current prospectus, the annual operating expense ratio (gross) is 1.02%. However, the Fund's adviser has contractually agreed to waive its fee and/or reimburse expenses to limit total operating expenses (excluding all taxes, interest, portfolio transaction expenses, acquired fund fees and expenses, proxy expenses and extraordinary expenses) to 0.39%, through January 28, 2017. During the period, certain fees were waived and/or expenses reimbursed; otherwise, returns would have been lower. The performance table and graph do not reflect the deduction of taxes that a shareholder would pay on Fund distributions or the redemption of Fund shares.
The Fund's outperformance of the benchmark BAML Muni Blended 85% and the BAML 1-12 Muni Index during the period December 7, 2015 through September 30, 2016, was primarily attributable to our ability to execute on opportunistic purchases of municipal bond structures and high quality credits which we believe were generally misunderstood and mispriced; additionally, there has also been significant contribution from price appreciation within the Fund as municipal yields fell throughout the year. Although increases in price tend to be universally associated with decreases in interest rates, it is important to recognize the additional role that credit spreads can play. We estimate that about 15% of the overall Fund performance over the past year came from a tightening of option-adjusted spreads. This type of spread tightening can be wide-spread or idiosyncratic. According to Thomson Reuters, as shown in its various Municipal Market Data municipal yield curves, there has been very little change in A spreads over AAA spreads, while there has been notable tightening of BBB spreads over AAA spreads. This provides evidence that some of the performance attained from spread tightening is due to overall market effects, while some is due to security selection through fundamental credit research being performed. Specifically, the Fund saw modest spread tightening in its special assessment debt holdings, as well as its holdings in the lease/appropriation debt of select city, school district and county issuers.
Furthermore, it is interesting to note that price appreciation due to a decline in interest rates is due at least as much to changes in the shape of the municipal yield curve as it is changes in the overall level of the municipal yield curve. Although municipal yields for bonds with less than two years to maturity are actually higher than they were at the beginning of this reporting period, yields across the remainder of the yield curve are significantly lower, particularly farther out on the yield curve. This type of behavior is known as a "bull flattener", which is notable for at least two reasons: 1) Yield curve movements of this type are more commonly associated with looser rather than tighter monetary policy, and 2) Bull flatteners often result in yields across all maturities decreasing. The recent increase in short-term yields, which did produce a moderately negative effect on the Fund's performance, is due to money- market regulatory reforms and possibly also anticipation of tighter monetary policy. The concurrent decline in longer maturity yields is mostly a result of supply and demand factors, resulting in a steep decline in term premiums (the portion of yield not attributable to the market's mean expectations for short-term interest rates over the maturity time horizon), as well as a continued lack of inflationary pressure.
| | Principal | | Security Description | | Rate | | Maturity | | Value | |
| Municipal Bonds - 95.4% |
| Arkansas - 0.7% |
| $ | 420,000 | | Bentonville School District No. 6, Arkansas GOB | | 4.50 | % | 06/01/30 | $ | 430,559 | |
| | | | |
| California - 86.2% |
| | 575,000 | | Baldwin Park Unified School District, California GOB | | 4.00 | | 08/01/19 | | 622,719 | |
| | 715,000 | | Baldwin Park Unified School District, California GOB | | 4.00 | | 08/01/22 | | 824,531 | |
| | 1,035,000 | | California Health Facilities Financing Authority, California RB | | 5.00 | | 10/01/33 | | 1,220,389 | |
| | 200,000 | | California Statewide Communities Development Authority, California RB | | 5.00 | | 11/15/23 | | 247,418 | |
| | 425,000 | | Campbell Union High School District, California COP | | 5.00 | | 08/01/22 | | 439,492 | |
| | 350,000 | | Campbell Union High School District, California COP | | 5.00 | | 08/01/24 | | 361,844 | |
| | 300,000 | | Campbell Union High School District, California COP | | 5.00 | | 08/01/27 | | 309,948 | |
| | 710,000 | | Capistrano Unified School District Community Facilities District No. 90-2, California Special Tax Bond | | 2.50 | | 09/01/21 | | 752,437 | |
| | 800,000 | | Capistrano Unified School District Community Facilities District No. 90-2, California Special Tax Bond | | 3.00 | | 09/01/23 | | 878,760 | |
| | 2,050,000 | | Capistrano Unified School District School Facilities Improvement District No. 1, California GOB, Series B (a) | | 2.29 | | 08/01/20 | | 1,876,467 | |
| | 750,000 | | Centinela Valley Union High School District, California GOB, Series B | | 5.75 | | 08/01/30 | | 960,840 | |
| | Principal | | Security Description | | Rate | | Maturity | | Value | |
| $ | 275,000 | | Central Unified School District, California GOB | | 5.50 | % | 08/01/29 | $ | 310,478 | |
| | 855,000 | | Chula Vista Elementary School District, California COP | | 5.00 | | 09/01/22 | | 1,035,927 | |
| | 610,000 | | Chula Vista Elementary School District, California COP | | 5.00 | | 09/01/23 | | 755,387 | |
| | 380,000 | | Chula Vista Elementary School District, California COP, Series A | | 5.00 | | 09/01/19 | | 423,662 | |
| | 200,000 | | City & County of San Francisco, California COP, Series A | | 5.00 | | 04/01/18 | | 212,398 | |
| | 310,000 | | City of Laguna Beach, California Special Assessment Bond | | 2.00 | | 09/02/21 | | 319,452 | |
| | 400,000 | | City of Los Angeles Department of Airports, California RB, Series B | | 5.00 | | 05/15/30 | | 478,116 | |
| | 840,000 | | City of Rocklin, California Special Tax Bond | | 3.50 | | 09/01/26 | | 918,019 | |
| | 200,000 | | City of Sacramento, California Special Tax Bond | | 5.00 | | 09/01/24 | | 245,654 | |
| | 745,000 | | City of San Clemente, California Special Assessment Bond | | 3.00 | | 09/02/19 | | 786,325 | |
| | 720,000 | | City of Tulare California Sewer Revenue, California RB | | 5.00 | | 11/15/28 | | 898,654 | |
| | 250,000 | | City of Ukiah California Water Revenue, California RB | | 4.00 | | 09/01/18 | | 264,155 | |
| | 275,000 | | Colton Public Financing Authority, California RB, Series A | | 5.00 | | 04/01/24 | | 319,382 | |
| | 500,000 | | Compton Unified School District, California GOB, Series D (a) | | 1.42 | | 06/01/18 | | 489,870 | |
| | 580,000 | | Corona Public Financing Authority, California RB | | 5.00 | | 11/01/26 | | 744,407 | |
| | Principal | | Security Description | | Rate | | Maturity | | Value | |
| $ | 625,000 | | Corona-Norco Unified School District Public Financing Authority, California Special Tax Bond, Series A | | 5.00 | % | 09/01/26 | $ | 760,000 | |
| | 715,000 | | Cosumnes Community Services District, California COP | | 3.00 | | 09/01/19 | | 754,976 | |
| | 520,000 | | Cosumnes Community Services District, California COP | | 3.00 | | 09/01/20 | | 556,551 | |
| | 675,000 | | Cosumnes Community Services District, California COP | | 4.00 | | 09/01/24 | | 792,652 | |
| | 295,000 | | County of Santa Cruz, California COP | | 5.00 | | 08/01/23 | | 362,526 | |
| | 500,000 | | Dinuba Unified School District, California GOB | | 4.13 | | 08/01/29 | | 514,220 | |
| | 510,000 | | Elk Grove Finance Authority, California Special Tax Bond | | 5.00 | | 09/01/25 | | 641,998 | |
| | 365,000 | | Fillmore Unified School District, California GOB | | 4.00 | | 07/01/18 | | 385,090 | |
| | 905,000 | | Folsom Redevelopment Agency Successor Agency, California Tax Allocation Bond, Series A | | 4.00 | | 08/01/28 | | 1,049,827 | |
| | 1,475,000 | | Fresno County Financing Authority, California RB | | 5.00 | | 04/01/27 | | 1,871,229 | |
| | 1,500,000 | | Fresno County Financing Authority, California RB | | 5.00 | | 04/01/28 | | 1,880,325 | |
| | 330,000 | | Gilroy Unified School District, California COP | | 4.00 | | 04/01/26 | | 393,476 | |
| | 1,015,000 | | Golden State Tobacco Securitization Corp., California RB, Series A | | 5.00 | | 06/01/29 | | 1,223,146 | |
| | 250,000 | | Golden State Tobacco Securitization Corp., California RB, Series A | | 5.00 | | 06/01/30 | | 299,885 | |
| | 660,000 | | Imperial Community College District, California GOB | | 5.00 | | 08/01/29 | | 782,621 | |
| | Principal | | Security Description | | Rate | | Maturity | | Value | |
| $ | 580,000 | | Irvine Unified School District No. 1, California Special Tax Bond, Series 1 | | 5.00 | % | 09/01/23 | $ | 723,011 | |
| | 205,000 | | Los Angeles County Redevelopment Refunding Agency, California Tax Allocation Bond, Series A | | 5.00 | | 09/01/20 | | 235,783 | |
| | 510,000 | | Lynwood Unified School District, California COP | | 5.00 | | 10/01/20 | | 586,270 | |
| | 655,000 | | Lynwood Unified School District, California COP | | 5.00 | | 10/01/24 | | 819,837 | |
| | 695,000 | | Lynwood Unified School District, California COP | | 5.00 | | 10/01/25 | | 879,905 | |
| | 375,000 | | Lynwood Unified School District, California COP | | 5.00 | | 10/01/28 | | 467,235 | |
| | 270,000 | | Modesto Irrigation District Electric System Revenue, California RB, Series B | | 5.00 | | 10/01/27 | | 307,625 | |
| | 280,000 | | Mojave Unified School District School Facilities Improvement District No. 1, California GOB | | 4.00 | | 08/01/20 | | 310,825 | |
| | 400,000 | | Orange Redevelopment Agency Successor Agency, California Tax Allocation Bond | | 5.00 | | 09/01/22 | | 480,096 | |
| | 355,000 | | Perris Joint Powers Authority, California Special Tax Bond, Series E | | 2.00 | | 09/01/18 | | 360,346 | |
| | 200,000 | | Placentia-Yorba Linda Unified School District, California COP, Series A | | 5.00 | | 10/01/25 | | 253,210 | |
| | 445,000 | | Placentia-Yorba Linda Unified School District, California COP, Series A | | 5.00 | | 10/01/27 | | 555,320 | |
| | 295,000 | | Poway Redevelopment Agency Successor Agency, California Tax Allocation Bond, Series A | | 5.00 | | 12/15/21 | | 351,652 | |
| | Principal | | Security Description | | Rate | | Maturity | | Value | |
| $ | 250,000 | | Poway Unified School District Public Financing Authority, California Special Tax Bond, Series A | | 5.00 | % | 09/01/24 | $ | 306,723 | |
| | 350,000 | | Poway Unified School District Public Financing Authority, California Special Tax Bond, Series A | | 5.00 | | 09/01/25 | | 432,800 | |
| | 325,000 | | Rio Elementary School District Community Facilities District, California Special Tax Bond | | 3.25 | | 09/01/26 | | 344,403 | |
| | 720,000 | | Riverside County Asset Leasing Corp., California RB | | 5.00 | | 11/01/26 | | 861,408 | |
| | 250,000 | | Riverside County Asset Leasing Corp., California RB | | 4.00 | | 06/01/28 | | 275,435 | |
| | 300,000 | | Riverside County Redevelopment Successor Agency, California Tax Allocation Bond | | 5.00 | | 10/01/25 | | 383,109 | |
| | 300,000 | | Sacramento Redevelopment Agency Successor Agency, California Tax Allocation Bond, Series A | | 5.00 | | 12/01/19 | | 336,075 | |
| | 500,000 | | San Jose Redevelopment Agency, California Tax Allocation Bond, Series D | | 5.00 | | 08/01/22 | | 515,940 | |
| | 1,045,000 | | Santa Ana Unified School District, California GOB, Series 2008-A | | 5.50 | | 08/01/30 | | 1,131,359 | |
| | 225,000 | | Santa Clara County Board of Education, California COP | | 5.00 | | 04/01/21 | | 265,183 | |
| | 1,525,000 | | Solano County Community College District, California GOB (a) | | 1.39 | | 08/01/29 | | 1,351,607 | |
| | 500,000 | | Sonoma Community Development Agency Successor Agency, California Tax Allocation Bond | | 5.00 | | 12/01/30 | | 575,020 | |
| | Principal | | Security Description | | Rate | | Maturity | | Value | |
| $ | 530,000 | | State of California Department of Veterans Affairs, California RB, Series A | | 3.50 | % | 12/01/25 | $ | 571,568 | |
| | 785,000 | | Stockton Unified School District, California GOB | | 4.00 | | 08/01/18 | | 828,073 | |
| | 1,135,000 | | Stockton Unified School District, California GOB | | 5.00 | | 08/01/26 | | 1,440,610 | |
| | 510,000 | | Stockton Unified School District, California GOB, Series A | | 5.00 | | 08/01/28 | | 622,409 | |
| | 415,000 | | Stockton Unified School District, California GOB, Series B | | 5.00 | | 08/01/18 | | 445,619 | |
| | 370,000 | | Stockton Unified School District, California GOB, Series B | | 5.00 | | 08/01/19 | | 411,462 | |
| | 430,000 | | Stockton Unified School District, California GOB, Series B | | 5.00 | | 08/01/24 | | 541,649 | |
| | 1,200,000 | | Stockton Unified School District, California GOB, Series B | | 5.00 | | 08/01/27 | | 1,516,752 | |
| | 310,000 | | Travis Unified School District, California COP | | 4.00 | | 09/01/19 | | 336,722 | |
| | 375,000 | | Travis Unified School District, California COP | | 4.00 | | 09/01/22 | | 433,043 | |
| | 685,000 | | Tulare City School District, California COP | | 2.00 | | 11/01/21 | | 685,486 | |
| | 500,000 | | Val Verde Unified School District, California COP, Series A | | 4.10 | | 03/01/20 | | 536,545 | |
| | 215,000 | | Val Verde Unified School District, California COP, Series A | | 5.00 | | 08/01/26 | | 271,435 | |
| | 1,000,000 | | Val Verde Unified School District, California GOB, Series A | | 5.00 | | 08/01/26 | | 1,282,420 | |
| | 850,000 | | Victor Valley Union High School District, California COP, Series A | | 2.00 | | 11/15/24 | | 879,605 | |
| | 300,000 | | Waugh School District, California Special Tax Bond | | 4.00 | | 09/01/20 | | 334,383 | |
| | | 53,213,211 | |
| | Principal | | Security Description | | Rate | | Maturity | | Value | |
| Illinois - 5.4% |
| $ | 1,175,000 | | Chicago Park District, Illinois GOB, Series C | | 5.00 | % | 01/01/24 | $ | 1,319,525 | |
| | 500,000 | | Chicago Park District, Illinois GOB, Series C | | 5.00 | | 01/01/25 | | 589,690 | |
| | 625,000 | | Chicago Park District, Illinois GOB, Series C | | 5.00 | | 01/01/25 | | 708,025 | |
| | 255,000 | | Grundy & Kendall Counties Consolidated Grade School District No. 60, Illinois GOB, Series C | | 4.00 | | 02/01/21 | | 280,439 | |
| | 425,000 | | Illinois Finance Authority, Illinois RB, Series C | | 4.50 | | 11/15/32 | | 427,010 | |
| | | 3,324,689 | |
| Kentucky - 0.2% |
| | 125,000 | | Corbin Independent School District Finance Corp., Kentucky RB | | 3.00 | | 02/01/26 | | 134,105 | |
| | | | |
| Michigan - 0.5% |
| | 285,000 | | Macomb Township Building Authority, Michigan RB | | 4.25 | | 04/01/23 | | 299,364 | |
| | | | |
| New Jersey - 1.0% |
| | 310,000 | | Middle Township Fire District No. 1, New Jersey GOB | | 4.00 | | 02/01/20 | | 339,258 | |
| | 250,000 | | Township of Berlin, New Jersey GOB, Series A | | 4.50 | | 01/01/21 | | 282,547 | |
| | | 621,805 | |
| Pennsylvania - 0.4% |
| | 225,000 | | Wellsboro Area School District, Pennsylvania GOB | | 3.00 | | 04/15/21 | | 242,552 | |
| | | | |
| Texas - 1.0% |
| | 575,000 | | Travis County Water Control & Improvement District No. 17, Texas GOB | | 3.00 | | 11/01/25 | | 611,041 | |
| | | | |
Total Municipal Bonds (Cost $58,262,428) | | 58,877,326 | |
| | Shares | | Security Description | | Value | |
| Money Market Fund - 5.2% |
| $ | 3,219,156 | | Fidelity Government Money Market Fund, 0.27% (b) (Cost $3,219,156) | $ | 3,219,156 | |
| | | | |
Total Investments - 100.6% (Cost $61,481,584)* | $ | 62,096,482 | |
| Other Assets & Liabilities, Net – (0.6)% | | (347,977 | ) |
| Net Assets – 100.0% | $ | 61,748,505 | |
| (a) | Zero coupon bond. Interest rate presented is yield to maturity. |
| (b) | Variable rate security. Rate presented is as of September 30, 2016. |
| COP | Certificate of Participation |
| GOB | General Obligation Bond |
* Cost for federal income tax purposes is $61,481,584 and net unrealized appreciation consists of:
| Gross Unrealized Appreciation | | $ | 691,571 | |
| Gross Unrealized Depreciation | | | (76,673 | ) |
| Net Unrealized Appreciation | | $ | 614,898 | |
The inputs or methodology used for valuing securities are not necessarily an indication of the risks associated with investing in those securities. For more information on valuation inputs, and their aggregation into the levels used in the table below, please refer to the Security Valuation section in Note 2 of the accompanying Notes to Financial Statements.
The following is a summary of the inputs used to value the Fund's investments as of September 30, 2016.
| Valuation Inputs | | Investments in Securities |
| Level 1 - Quoted Prices | | $ | - | |
| Level 2 - Other Significant Observable Inputs | | | 62,096,482 | |
| Level 3 - Significant Unobservable Inputs | | | - | |
| Total | | $ | 62,096,482 | |
The Level 2 value displayed in this table includes Municipal Bonds and a Money Market Fund. Refer to this Schedule of Investments for a further breakout of each Municipal Bond security by state.
The Fund utilizes the end of period methodology when determining transfers. There were no transfers among Level Level 1, Level 2 and Level 3 for the period ended September 30, 2016.
AFA
| PORTFOLIO HOLDINGS | | |
| % of Total Investments | | |
| Municipal Bonds | 94.8 | % |
| Money Market Fund | 5.2 | % |
| | 100.0 | % |
| ASSETS | | | | |
| . | Total investments, at value (Cost $61,481,584) | | $ | 62,096,482 | |
| | Receivables: | | | | |
| | | Fund shares sold | | | 250,000 | |
| | | Dividends and interest | | | 499,747 | |
| | Prepaid expenses | | | 2,402 | |
| | Deferred offering costs | | | 3,749 | |
| Total Assets | | | 62,852,380 | |
| | | | | | | |
| LIABILITIES | | | | |
| | Payables: | | | | |
| | | Investment securities purchased | | | 1,045,574 | |
| | | Fund shares redeemed | | | 10,765 | |
| | | Distributions payable | | | 481 | |
| | Accrued Liabilities: | | | | |
| | | Investment adviser fees | | | 17,091 | |
| | | Trustees' fees and expenses | | | 187 | |
| | | Fund services fees | | | 6,491 | |
| | | Other expenses | | | 23,286 | |
| Total Liabilities | | | 1,103,875 | |
| | | | | | | |
| NET ASSETS | | $ | 61,748,505 | |
| | | | | | | |
| COMPONENTS OF NET ASSETS | | | | |
| | Paid-in capital | | $ | 61,132,563 | |
| | Undistributed net investment income | | | 3 | |
| | Accumulated net realized gain | | | 1,041 | |
| | Net unrealized appreciation | | | 614,898 | |
| NET ASSETS | | $ | 61,748,505 | |
| SHARES OF BENEFICIAL INTEREST AT NO PAR VALUE (UNLIMITED SHARES AUTHORIZED) | | | 6,018,260 | |
| NET ASSET VALUE, OFFERING AND REDEMPTION PRICE PER SHARE | | $ | 10.26 | |
| | | | | | | |
| INVESTMENT INCOME | | | | | | |
| | Dividend income | . | | $ | 8,169 | | |
| | Interest income | | | 447,313 | | |
| Total Investment Income | | | | 455,482 | | |
| | | | | | | |
| EXPENSES | | | | | | |
| | Investment adviser fees | | | 100,992 | | |
| | Fund services fees | | | 63,977 | | |
| | Custodian fees | | | 4,429 | | |
| | Registration fees | | | 595 | | |
| | Professional fees | | | 24,087 | | |
| | Trustees' fees and expenses | | | 3,287 | | |
| | Offering costs | | | 18,745 | | |
| | Miscellaneous expenses | | | 24,962 | | |
| Total Expenses | | | | 241,074 | | |
| | Fees waived and expenses reimbursed | | | (128,530 | ) | |
| Net Expenses | | | | 112,544 | | |
| | | | | | | | |
| NET INVESTMENT INCOME | | | | 342,938 | | |
| | | | | | | | |
| NET REALIZED AND UNREALIZED GAIN | | | | | | |
| | Net realized gain on investments | | | 1,041 | | |
| | Net change in unrealized appreciation on investments | | | 614,898 | | |
| NET REALIZED AND UNREALIZED GAIN | | | | 615,939 | | |
| INCREASE IN NET ASSETS RESULTING FROM OPERATIONS | | | $ | 958,877 | | |
| | | | | | | | |
| * | Commencement of operations was December 7, 2015. | | | | | | |
| | | | | December 7, 2015* through September 30, 2016 | |
| OPERATIONS | | | | | |
| | Net investment income | | $ | 342,938 | | |
| | Net realized gain | | | 1,041 | | |
| | Net change in unrealized appreciation | | | 614,898 | | |
| Increase in Net Assets Resulting from Operations | | | 958,877 | | |
| | | | | | | | |
| DISTRIBUTIONS TO SHAREHOLDERS FROM | | | | | |
| | Net investment income | | | (342,935 | ) | |
| | | | | | | | |
| CAPITAL SHARE TRANSACTIONS | | | | | |
| | Sale of shares | | | 61,366,574 | | |
| | Reinvestment of distributions | | | 339,173 | | |
| | Redemption of shares | | | (573,184 | ) | |
| Increase in Net Assets from Capital Share Transactions | | | 61,132,563 | | |
| Increase in Net Assets | | | 61,748,505 | | |
| | | | | | | | |
| NET ASSETS | | | | | |
| | Beginning of Period | | | - | | |
| | End of Period (Including line (a)) | | $ | 61,748,505 | | |
| | | | | | | | |
| SHARE TRANSACTIONS | | | | | |
| | Sale of shares | | | 6,041,100 | | |
| | Reinvestment of distributions | | | 33,194 | | |
| | Redemption of shares | | | (56,034 | ) | |
| Increase in Shares | | | 6,018,260 | | |
| | | | | | | | |
| (a) | Undistributed net investment income | | $ | 3 | | |
| * | Commencement of operations. | | | | | |
These financial highlights reflect selected data for a share outstanding throughout the period.
| |
| | | December 7, 2015 (a) through September 30, 2016 | |
| INSTITUTIONAL CLASS | | | | |
| NET ASSET VALUE, Beginning of Period | $ | 10.00 | | |
| INVESTMENT OPERATIONS | | | | |
| Net investment income (b) | | 0.10 | | |
| Net realized and unrealized gain | | 0.26 | | |
| Total from Investment Operations | | 0.36 | | |
| DISTRIBUTIONS TO SHAREHOLDERS FROM | | | | |
| Net investment income | | (0.10 | ) | |
| NET ASSET VALUE, End of Period | $ | 10.26 | | |
| TOTAL RETURN | | 3.56 | %(c) |
| RATIOS/SUPPLEMENTARY DATA | | | | |
| Net Assets at End of Period (000's omitted) | $61,749 | | |
| Ratios to Average Net Assets: | | | | |
| Net investment income | | 1.19 | %(d) |
| Net expenses | | 0.39 | %(d) |
| Gross expenses (e) | | 0.84 | %(d) |
| PORTFOLIO TURNOVER RATE | | 5 | %(c) |
| | | | | | |
| | | | | | |
| (a) | Commencement of operations. |
| (b) | Calculated based on average shares outstanding during the period. |
| (c) | Not annualized. |
| (d) | Annualized. |
| (e) | Reflects the expense ratio excluding any waivers and/or reimbursements. |
Note 1. Organization
Gurtin National Municipal Opportunistic Value Fund, Gurtin California Municipal Opportunistic Value Fund, Gurtin National Municipal Intermediate Value Fund and Gurtin California Municipal Intermediate Value Fund (individually, a "Fund" and collectively, the "Funds") are non-diversified portfolios of Forum Funds II (the "Trust"). The Trust is a Delaware statutory trust that is registered as an open-end, management investment company under the Investment Company Act of 1940, as amended (the "Act"). Under its Trust Instrument, the Trust is authorized to issue an unlimited number of each Fund's shares of beneficial interest without par value. Each Fund currently offers two class of shares: Institutional Shares and Investor Shares. As of September 30, 2016, Investor Shares for each Fund had not commenced operations. The Gurtin National Municipal Opportunistic Value Fund's investment objective is to provide current income exempt from regular federal income tax while seeking to preserve capital and liquidity. The Gurtin California Municipal Opportunistic Value Fund's investment objective is to provide current income exempt from regular federal income tax and California state personal income taxes while seeking to preserve capital and liquidity. The Gurtin National Municipal Intermediate Value Fund's investment objective is to provide current income exempt from regular federal income tax while seeking to preserve capital and liquidity. The Gurtin California Municipal Intermediate Value Fund's investment objective is to provide current income exempt from regular federal income tax and California state personal income taxes while seeking to preserve capital and liquidity.
The Gurtin National Municipal Opportunistic Value Fund and Gurtin California Municipal Opportunistic Value Fund commenced operations on November 3, 2014, after they acquired the net assets of privately offered funds managed by the Funds' adviser and portfolio management team (each a "Predecessor Fund" and collectively the "Predecessor Funds"). The Predecessor Funds of the Gurtin National Municipal Opportunistic Value Fund and Gurtin California Municipal Opportunistic Value Fund commenced operations on May 3, 2010.
On November 3, 2014, the Predecessor Funds reorganized into the Gurtin National Municipal Opportunistic Value Fund and Gurtin California Municipal Opportunistic Value Fund. The reorganization of net assets and unrealized gain from this tax-free transaction were as follows:
| Fund | | Date of Contribution | | Net Assets | | Shares Issued | | Unrealized Gain on Investments Received from Reorganization |
| Gurtin National Municipal Opportunistic Value Fund | | November 3, 2014 | | $46,288,768 | | 4,628,877 | | $2,085,304 |
| | | | | | | | | |
| Gurtin California Municipal Opportunistic Value Fund | | November 3, 2014 | | 83,099,170 | | 8,309,917 | | 4,405,323 |
Effective August 1, 2016 Gurtin National Municipal Value Fund and Gurtin California Municipal Value Fund were renamed Gurtin National Municipal Opportunistic Value Fund and Gurtin California Municipal Opportunistic Value Fund, respectively.
The Gurtin National Municipal Intermediate Value Fund and Gurtin California Municipal Intermediate Value Fund commenced operations on December 1, 2015, and December 7, 2015, respectively.
Note 2. Summary of Significant Accounting Policies
The Funds are investment companies and follow accounting and reporting guidance under Financial Accounting Standards Board ("FASB") Accounting Standards Codification ("ASC") Topic 946, "Financial Services-Investment Companies". These financial statements are prepared in accordance with accounting principles generally accepted in the United States of America ("GAAP"), which require management to make estimates and assumptions that affect the reported amounts of assets and liabilities, the disclosure of contingent liabilities at the date of the financial statements, and the reported amounts of increases and decreases in net assets from operations during the fiscal period. Actual amounts could differ from those estimates. The following summarizes the significant accounting policies of each Fund:
Security Valuation – Exchange-traded securities and over-the-counter securities are valued using the last quoted trade or official closing price, provided by independent pricing services as of the close of trading on the market or exchange for which they are primarily traded, on each Fund business day. In the absence of a sale, such securities are valued at the mean of the last bid and ask price provided by independent pricing services. Non-exchange-traded securities for which quotations are available are valued using the last quoted sales price, or in the absence of a sale, at the mean of the last bid and ask prices provided by independent pricing services. Debt securities may be valued at prices supplied by a fund's pricing agent based on broker or dealer supplied valuations or evaluated bid pricing. Shares of open-end mutual funds are valued at net asset value ("NAV"). Short-term investments that mature in 60 days or less may be valued at amortized cost.
Each Fund values its investments at fair value pursuant to procedures adopted by the Trust's Board of Trustees (the "Board") if (1) market quotations are insufficient or not readily available or (2) the Adviser, as defined in Note 3, believes that the values available are unreliable. The Trust's Valuation Committee, as defined in each Fund's registration statement, performs certain functions as they relate to the administration and oversight of each Fund's valuation procedures. Under these procedures, the Valuation Committee convenes on a regular and ad-hoc basis to review such investments and considers a number of factors, including valuation methodologies and significant unobservable inputs, when arriving at fair value.
The Valuation Committee may work with the Adviser to provide valuation inputs. In determining fair valuations, inputs may include market-based analytics which may consider related or comparable assets or liabilities, recent transactions, market multiples, book values and other relevant investment information. Adviser inputs may include an income-based approach in which the anticipated future cash flows of the investment are discounted in determining fair value. Discounts may also be applied based on the nature or duration of any restrictions on the disposition of the investments. The Valuation Committee performs regular reviews of valuation methodologies, key inputs and assumptions, disposition analysis and market activity.
Fair valuation is based on subjective factors and, as a result, the fair value price of an investment may differ from the security's market price and may not be the price at which the asset may be sold. Fair valuation could result in a different NAV than a NAV determined by using market quotes.
Each Fund has a three-tier fair value hierarchy. The basis of the tiers is dependent upon the various "inputs" used to determine the value of each Fund's investments. These inputs are summarized in the three broad levels listed below:
Level 1 — quoted prices in active markets for identical assets and liabilities
Level 2 — other significant observable inputs (including quoted prices of similar securities, interest rates, prepayment speeds, credit risk, etc.)
Level 3 — significant unobservable inputs (including each Fund's own assumptions in determining the fair value of investments)
The aggregate value by input level, as of September 30, 2016, for each Fund's investments is included at the end of each Fund's schedule of investments.
Security Transactions, Investment Income and Realized Gain and Loss – Investment transactions are accounted for on the trade date. Dividend income is recorded on the ex-dividend date. Interest income is recorded on an accrual basis. Premium is amortized and discount is accreted using the effective interest method. Identified cost of investments sold is used to determine the gain and loss for both financial statement and federal income tax purposes.
Distributions to Shareholders – Distributions to shareholders of net investment income, if any, are declared daily and paid monthly. Distributions to shareholders of net capital gains, if any, are declared and paid annually. Distributions to shareholders are recorded on the ex-dividend date. Distributions are based on amounts calculated in accordance with applicable federal income tax regulations, which may differ from GAAP. These differences are due primarily to differing treatments of income and gain on various investment securities held by each Fund, timing differences and differing characterizations of distributions made by each Fund.
Federal Taxes – Each Fund intends to continue to qualify each year as a regulated investment company under Subchapter M of Chapter 1, Subtitle A, of the Internal Revenue Code of 1986, as amended ("Code"), and to distribute all of their taxable income to shareholders. In addition, by distributing in each calendar year substantially all of their net investment income and capital gains, if any, the Funds will not be subject to a federal excise tax. Therefore, no federal income or excise tax provision is required. Each Fund files a U.S. federal income and excise tax return as required. Each Fund's federal income tax returns are subject to examination by the Internal Revenue Service for a period of three fiscal years after they are filed. As of September 30, 2016, there are no uncertain tax positions that would require financial statement recognition, de-recognition or disclosure.
Income and Expense Allocation – The Trust accounts separately for the assets, liabilities and operations of each of its investment portfolios. Expenses that are directly attributable to more than one investment portfolio are allocated among the respective investment portfolios in an equitable manner.
Offering Costs – Offering costs of $67,862, $60,947, $30,398 and $22,494 for the Gurtin National Municipal Opportunistic Value Fund, Gurtin California Municipal Opportunistic Value Fund, Gurtin National Municipal Intermediate Value Fund and Gurtin California Municipal Intermediate Value Fund, respectively, consist of fees related to certain startup legal costs, initial registration filings, and printing and mailing of the initial prospectus. Such costs are amortized over a twelve-month period beginning with the commencement of operations of the Funds. During the period ended September 30, 2016, the Gurtin National Municipal Opportunistic Value Fund, Gurtin California Municipal Opportunistic Value Fund, Gurtin National Municipal Intermediate Value Fund and Gurtin California Municipal Intermediate Value Fund expensed $5,655, $5,079, $25,332 and $18,745, respectively.
Commitments and Contingencies – In the normal course of business, each Fund enters into contracts that provide general indemnifications by each Fund to the counterparty to the contract. Each Fund's maximum exposure under these arrangements is dependent on future claims that may be made against each Fund and, therefore, cannot be estimated; however, based on experience, the risk of loss from such claims is considered remote.
Note 3. Fees and Expenses
Investment Adviser – Gurtin Municipal Bond Management (the "Adviser") is the investment adviser to the Funds. Pursuant to an Investment Advisory Agreement, the Adviser receives an advisory fee at an annual rate of 0.45% of the average daily net assets of Gurtin National Municipal Opportunistic Value Fund and Gurtin California Municipal Opportunistic Value Fund and 0.35% of the average daily net assets of Gurtin National Municipal Intermediate Value Fund and Gurtin California Municipal Intermediate Value Fund.
Distribution – Foreside Fund Services, LLC serves as each Fund's distributor (the "Distributor"). The Funds have adopted a Distribution Plan (the "Plan") for Investor Shares in accordance with Rule 12b-1 of the Act. Under the Plan, the Funds pay the Distributor and/or any other entity as authorized by the Board a fee of up to 0.25% of the average daily net assets of Investor Shares. The Distributor is not affiliated with the Adviser or Atlantic Fund Administration, LLC (d/b/a Atlantic Fund Services) ("Atlantic") or their affiliates.
Other Service Providers – Atlantic provides fund accounting, fund administration, compliance and transfer agency services to each Fund. Atlantic also provides certain shareholder report production and EDGAR conversion and filing services. Pursuant to an Atlantic services agreement, each Fund pays Atlantic customary fees for its services. Atlantic provides a Principal Executive Officer, a Principal Financial Officer, a Chief Compliance Officer and an Anti-Money Laundering Officer to each Fund, as well as certain additional compliance support functions.
Trustees and Officers – The Trust pays each Independent Trustee an annual fee of $16,000 ($21,000 for the Chairman). The Independent Trustees and Chairman may receive additional fees for special Board meetings. The Independent Trustees are also reimbursed for all reasonable out-of-pocket expenses incurred in connection with their duties as Trustees, including travel and related expenses incurred in attending Board meetings. The amount of Independent Trustees' fees attributable to each Fund is disclosed in the Statements of Operations. Certain officers of the Trust are also officers or employees of the above named service providers, and during their terms of office received no compensation from each Fund.
Note 4. Expense Reimbursement and Fees Waived
The Adviser has contractually agreed to waive a portion of its fee and reimburse certain expenses to limit total annual operating expenses (excluding all taxes, interest, portfolio transaction expenses, acquired fund fees and expenses, proxy expenses and extraordinary expenses) to 0.60% and 0.85% of average daily net assets through January 28, 2017, of the Gurtin National Municipal Opportunistic Value Fund and Gurtin California Municipal Opportunistic Value Fund's Institutional Shares and Investor Shares, respectively and to 0.39% of average daily net assets through January 28, 2017, of the Gurtin National Municipal Intermediate Value Fund and Gurtin California Municipal Intermediate Value Fund's Institutional and Investor Shares. Other fund service providers have voluntarily agreed to waive a portion of their fees. Voluntary fee waivers may be reduced or eliminated at any time. For the period ended September 30, 2016, fees waived and expenses reimbursed were as follows:
| Fund | | | Investment Adviser Fees Waived | | | Investment Adviser Expenses Reimbursed | | | Other Waivers | | | Total Fees Waived and/or Expenses Reimbursed |
| Gurtin National Municipal Opportunistic Value Fund | | $ | 89,915 | | $ | - | | $ | 23,644 | | $ | 113,559 |
| Gurtin California Municipal Opportunistic Value Fund | | | 43,328 | | | - | | | 54,568 | | | 97,896 |
| Gurtin National Municipal Intermediate Value Fund | | | 148,888 | | | - | | | 25,994 | | | 174,882 |
| Gurtin California Municipal Intermediate Value Fund | | | 100,992 | | | 16,210 | | | 11,328 | | | 128,530 |
Note 5. Security Transactions
The cost of purchases and proceeds from sales of investment securities (including maturities), other than short-term investments during the period ended September 30, 2016, were as follows:
| | | Purchases | | Sales |
| Gurtin National Municipal Opportunistic Value Fund | | $ | 74,481,419 | | $ | 57,486,450 |
| Gurtin California Municipal Opportunistic Value Fund | | | 97,290,908 | | | 100,995,402 |
| Gurtin National Municipal Intermediate Value Fund | | | 153,323,656 | | | 7,531,740 |
| Gurtin California Municipal Intermediate Value Fund | | | 60,572,890 | | | 1,787,030 |
Note 6. Line of Credit
The Gurtin National Municipal Opportunistic Value Fund and Gurtin California Municipal Opportunistic Value Fund participate in a committed $14 million unsecured line of credit agreement with MUFG Union Bank, N.A. The Gurtin National Municipal Opportunistic Value Fund and Gurtin California Municipal Opportunistic Value Fund may temporarily borrow from the line of credit to satisfy redemption requests or settle investment transactions. Interest is charged to each Fund based on its borrowings at an amount above the LIBOR rate. Because the line of credit is not available exclusively to Gurtin National Municipal Opportunistic Value Fund and Gurtin California Municipal Opportunistic Value Fund, they may be unable to borrow some or all of the Funds' requested amounts at any particular time. During the year ended September 30, 2016, the Gurtin National Municipal Opportunistic Value Fund and Gurtin California Municipal Opportunistic Value Fund had no outstanding balances pursuant to this line of credit.
Note 7. Federal Income Tax
Distributions paid during the fiscal years ended as noted were characterized for tax purposes as follows:
| | | Tax-Exempt Income | | Ordinary Income | | | Total | |
| Gurtin National Municipal Opportunistic Value Fund | | | | | | | | | | | | |
| 2016 | | $ | 1,699,313 | | | $ | 232,877 | | | $ | 1,932,190 | |
| 2015 | | | 1,101,594 | | | | 187,123 | | | | 1,288,717 | |
| Gurtin California Municipal Opportunistic Value Fund | | | | | | | | | | | | |
| 2016 | | | 3,145,742 | | | | 432,572 | | | | 3,578,314 | |
| 2015 | | | 1,950,479 | | | | 346,029 | | | | 2,296,508 | |
| Gurtin National Municipal Intermediate Value Fund | | | | | | | | | | | | |
| 2016 | | | 783,706 | | | | 17,545 | | | | 801,251 | |
| Gurtin California Municipal Intermediate Value Fund | | | | | | | | | | | | |
| 2016 | | | 335,206 | | | | 7,248 | | | | 342,454 | |
As of September 30, 2016, distributable earnings (accumulated loss) on a tax basis were as follows:
| | | Other Temporary Differences | | Undistributed Tax Exempt Income | | Undistributed Ordinary Income | | Undistributed Long-Term Gain | | Unrealized Appreciation | | Total | |
| Gurtin National Municipal Opportunistic Value Fund | | $ | (14,573 | ) | | $ | 12,626 | | | $ | 208,570 | | | $ | 1,387 | | | $ | 3,486,368 | | | $ | 3,694,378 | |
| Gurtin California Municipal Opportunistic Value Fund | | | (6,075 | ) | | | 5,359 | | | | 306,885 | | | | - | | | | 7,515,777 | | | | 7,821,946 | |
| Gurtin National Municipal Intermediate Value Fund | | | (13,687 | ) | | | 13,387 | | | | 34,144 | | | | - | | | | 1,279,966 | | | | 1,313,810 | |
| Gurtin California Municipal Intermediate Value Fund | | | (481 | ) | | | 484 | | | | 1,041 | | | | - | | | | 614,898 | | | | 615,942 | |
The difference between components of distributable earnings on a tax basis and the amounts reflected in the Statements of Assets and Liabilities are primarily due to end of period distributions payable in each Fund and wash sales in Gurtin National Municipal Intermediate Value Fund.
Note 8. Subsequent Events
Subsequent events occurring after the date of this report through the date these financial statements were issued have been evaluated for potential impact, and each Fund has had no such events.
To the Board of Trustees of Forum Funds II
and the Shareholders of Gurtin National Municipal Opportunistic Value Fund,
Gurtin California Municipal Opportunistic Value Fund,
Gurtin National Municipal Intermediate Value Fund and
Gurtin California Municipal Intermediate Value Fund
We have audited the accompanying statements of assets and liabilities of Gurtin National Municipal Opportunistic Value Fund (formerly Gurtin National Municipal Value Fund), Gurtin California Municipal Opportunistic Value Fund (formerly Gurtin California Municipal Value Fund), Gurtin National Municipal Intermediate Value Fund, and Gurtin California Municipal Intermediate Value Fund (the "Funds"), each a series of shares of beneficial interest in Forum Funds II, including the schedules of investments, as of September 30, 2016, and the related statements of operations for the year then ended and the statements of changes in net assets and financial highlights for the year then ended and for the period November 3, 2014 (commencement of operations) through September 30, 2015 for the Gurtin National Municipal Opportunistic Value Fund and the Gurtin California Municipal Opportunistic Value Fund. In addition, we have audited the related statements of operations and changes in net assets and financial highlights for the period December 1, 2015 (commencement of operations) through September 30, 2016 for the Gurtin National Municipal Intermediate Value Fund and for the period December 7, 2015 (commencement of operations) through September 30, 2016 for the Gurtin California Municipal Intermediate Value Fund. These financial statements and financial highlights are the responsibility of the Funds' management. Our responsibility is to express an opinion on these financial statements and financial highlights based on our audits.
We conducted our audits in accordance with the standards of the Public Company Accounting Oversight Board (United States). Those standards require that we plan and perform the audits to obtain reasonable assurance about whether the financial statements and financial highlights are free of material misstatement. An audit includes examining, on a test basis, evidence supporting the amounts and disclosures in the financial statements. Our procedures included confirmation of securities owned as of September 30, 2016 by correspondence with the custodian and brokers. An audit also includes assessing the accounting principles used and significant estimates made by management, as well as evaluating the overall financial statement presentation. We believe that our audits provide a reasonable basis for our opinion.
In our opinion, the financial statements and financial highlights referred to above present fairly, in all material respects, the financial position of Gurtin National Municipal Opportunistic Value Fund, Gurtin California Municipal Opportunistic Value Fund, Gurtin National Municipal Intermediate Value Fund, and Gurtin California Municipal Intermediate Value Fund as of September 30, 2016, and the results of their operations, the changes in their net assets and their financial highlights for each of the periods detailed above, in conformity with accounting principles generally accepted in the United States of America.
BBD, LLP
Philadelphia, Pennsylvania
November 21, 2016