
Annual Report September 30, 2019
Advised by: SKBA Capital Management, LLC www.baywoodfunds.com |
Beginning in January 2021, as permitted by regulations adopted by the Securities and Exchange Commission, paper copies of the Funds’ shareholder reports will no longer be sent by mail, unless you specifically request paper copies of the reports from the Funds or from your financial intermediary, such as a broker-dealer or bank. Instead, the reports will be made available on a website, and you will be notified by mail each time a report is posted and provided with a website link to access the report.
If you already elected to receive shareholder reports electronically, you will not be affected by this change and you need not take any action. You may elect to receive shareholder reports and other communications from the Funds or your financial intermediary electronically by contacting the Funds at (855) 409-2297 or baywoodfunds.ta@apexfs.com or by contacting your financial intermediary directly.
You may elect to receive all future reports in paper free of charge. You can inform the Funds or your financial intermediary that you wish to continue receiving paper copies of your shareholder reports by contacting the Funds at (855) 409-2297 or baywoodfunds.ta@apexfs.com or by contacting your financial intermediary directly. Your election to receive reports in paper will apply to all funds held with Baywood Funds.
BAYWOOD VALUEPLUS FUND
A MESSAGE TO OUR SHAREHOLDERS (Unaudited)
SEPTEMBER 30, 2019
Dear Shareholders,
We’d like to begin the discussion on what took place in the Baywood ValuePlus strategy over the last fiscal year by highlighting one of the issues we discovered with one of the large capitalization benchmarks we are compared against.
As value investors, one of our benchmarks is the S&P 500 Value Index; the other is the Morningstar Large Cap Value Index. Another index we might choose is the Russell 1000 Value Index. All have their strengths and shortcomings; today, let’s focus on some of the S&P 500 Value’s.
The S&P 500 Value has 382 constituent companies out of the 500 in the broader index, of which some companies market capitalizations are split between the Growth and Value indexes. The mismatch is not unique to this index as over 700 stocks in the Russell 1000 are in the Value benchmark. Although the two are quite similar in overall characteristics, each methodology can lead to significant differences in sector and individual stock weights, and this is where significant holding differences can lead to significant return variances. We decided to take a closer look.
Looking at the sector breakdown chart below, slightly over 20% of the S&P 500 Value index is invested in financials, 16% or so in technology, 11% or so in healthcare and approximately 10% in industrials and consumer staples. Some might quibble over the appropriateness of such weights but generally speaking, this seems to us to be a generally acceptable view of a large capitalization value index.
Sector* Breakdown
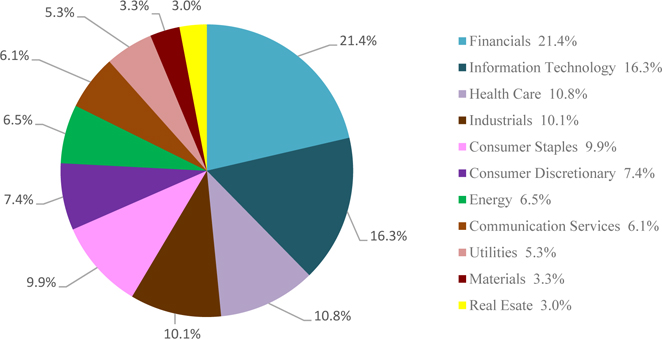
*Based on GICS® sectors
The weightings for each sector of the index are rounded to the nearest tenth of a percent; the aggregate weights for the index may not equal 100%.
The S&P 500 Value index is market capitalization weighted and it is float-adjusted; S&P calls this FMC – Float Adjusted Market Capitalization. Breaking FMC down into its component parts, firstly, the S&P 500 index is market capitalization weighted. The largest companies in terms of size, not revenues or profits mind you, are given the largest weights. Old fashioned investors might think that the level of revenues or profits would contribute prominently to a company’s weight in an index like the S&P 500; they do not. Being of a different mindset, we would consider that to be an issue for the sustainability of the index’s return longer-term.
Secondly, the S&P 500 Value index is float-adjusted. The more shares outstanding (float) a company has the better. As long-term investors, again being of a different mindset, we like to see companies repurchase their shares over time; in other words, we like to see them reduce their float. We also like to see managements be significant owners of their shares, not simply of options. Shares are typically purchased whereas options tend to be granted. Owning shares outright in one’s company speaks highly of management’s alignment of
BAYWOOD VALUEPLUS FUND
A MESSAGE TO OUR SHAREHOLDERS (Unaudited)
SEPTEMBER 30, 2019
interests with those of its shareholders. While we recognize that there are bad apples and exceptions to every rule, shareholder alignment tends to reduce perverse incentives. Perverse incentives include compensation not tied to the well-being of the company and all its stakeholders. Perverse incentives destroy sustainability and economic goodwill. Perverse incentives are widespread in corporations as compensation packages created by outside consultants are typically laden with generous options grants. Owner-operators and vested managers tend to be better operators. Yet float-adjusted benchmarks like the S&P 500 discourage this from taking place by selling companies that reduce their public float. The more management is aligned with shareholders and the more is purchased by companies with the goal of reducing shares outstanding, the less it will be owned in the index.
We would add a caveat that not all share buybacks are created equal. Buybacks should not be done in the place of investing in one’s business. This is another endemic problem we notice with managements and is a direct result of their short term horizons; not enough has been spent in the businesses they run precisely because they are primarily incented with short-term objectives - not the long term well-being of the enterprise and its stakeholders. So one needs to carefully judge when reading about companies initiating significant buybacks. Are they truly significant? Will they in fact reduce the public float – a good outcome for long term shareholders? They most likely will not. Does this mindset make any sense? None whatsoever in the longer term but then benchmarks and most managements cannot concern themselves with the long-term.
So the S&P 500 Value is market cap weighted and it is float-adjusted; two significant issues in and of themselves but secondary to the point of this note. Ignoring those two issues, looking at the S&P 500 Value’s top ten holdings pictured below also seems to us to be a fairly reasonable representation of large companies that may generally not be egregiously overpriced. There are perhaps too many large banks, which makes us ask why not be somewhat more selective, but the point of an index is to be diversified. The list below appears to be diversified since it includes telecom, financials, technology, healthcare; which represent a wide swath of America’s corporate giants. One would likely assume that diversification would increase as companies are added to the list. All appropriate in the construction of the index.
Top 10 Constituents By Index Weight
| CONSTITUENT | SYMBOL | SECTOR* |
| Apple Inc. | AAPL | Information Technology |
| JP Morgan Chase & Co | JPM | Financials |
| AT&T Inc | T | Communication Services |
| Bank of America Corp. | BAC | Financials |
| Chevron Corp | CVX | Energy |
| Unitedhealth Group Inc. | UNH | Health Care |
| Berkshire Hathaway B | BRK.B | Financials |
| Wells Fargo & Co | WFC | Financials |
| Walmart Inc. | WMT | Consumer Staples |
| Citigroup Inc | C | Financials |
| * | Based on GICS® sectors |
What S&P does not state in the index factsheet, for obvious reasons, is that Apple is the largest single position of all companies by a factor of three at minimum. The top holdings table above conveniently and perhaps intentionally fails to disclose the weight of each of the largest holdings. So let us do it for them.
Apple has a weight of 8.5%! To state the obvious, that is nearly a tenth of the entire index – one company – nearly 10% in an index, an index which by its own definition is intended to be diversified. To put this in perspective, 8.5% is over half of the index’s technology weight. So it really doesn’t matter that the index has 16% in technology; all that matters is Apple at half that weight.
One might rightfully question whether Apple should, in a large value index, have a weight that is nearly three times that of JPMorgan, over four times that of ExxonMobil, six times that of WalMart and Citigroup and seven times that of Johnson & Johnson.
The above snapshot is perfectly illustrative of the main driver behind the index; it is one company. The snapshot happens to be taken during an up day in the market; should Apple have a bad day, it won’t matter how the rest of the other 381 companies fare. As we are all aware, indexes tout themselves as being diversified. As such, despite the index being comprised of 382 holdings, the impact that one single security has on the overall returns strikes us as somewhat, if not meaningfully, misleading. In our investment process, we limit the maximum size of a holding to 5% to avoid undue company specific risk, unreasonable volatility which may compromise desirable
BAYWOOD VALUEPLUS FUND
A MESSAGE TO OUR SHAREHOLDERS (Unaudited)
SEPTEMBER 30, 2019
full cycle return characteristics.
Before we leave the topic of the S&P 500 Value, we also find it worth mentioning that periodic updates in index holdings can include a number of growth-stock companies that can scarcely be described as belonging in a value benchmark. Recently, those would include Costco, Home Depot, Starbucks, Booking Holdings (aka Booking.com), Danaher, Zoetis, Charter, and Estee Lauder. All very large companies, which is why they have found their way in the benchmark, but all clearly displaying characteristics tied to growth, NOT value. Each one of these companies trade at a premium to the S&P 500 (regular, not value) and as a group trade at an average of 29X next year’s EPS targets, which is 12X more than the S&P 500’s lofty level of 17X.
At a minimum, we believe it is worthwhile bringing this to prospective investors’ attention.
With respect to the Baywood ValuePlus strategy, the last fiscal year was a difficult one from a relative standpoint. Over the last twelve months, the strategy is essentially flat. The broad U.S. stock market declined significantly in the fourth calendar quarter of last year and has since had a strong rebound. ValuePlus declined in the fourth quarter as well given the degree to which value stocks underperformed growth in that period. Furthermore, another not often noticed side-effect of indexation is that in the most recent downturn, any stock that was not considered a “mega-cap” underperformed significantly. The average stock in the fourth quarter of 2018 declined over 16%, while the most represented stocks in the indices, those with market capitalizations above $200B only declined 6%. That difference in performance meant that if an active manager was indeed different than the index, then chances are they underperformed materially. The rebound in 2019 was just enough to overcome fall of 2018 declines. A single year does not make a full cycle, however, and maintaining a disciplined strategy over time has been more important than chasing trends at the wrong time. Prevailing themes that defy the logic of valuation and fundamental discipline continue to pervade markets. This has happened before and it is taking place as we speak. Over the last year we have continued to purchase industry leading companies selling at discount prices due to the wholesale abandonment of the investing majority, which is perversely becoming narrower and narrower.
For example, at less than 5%, energy has the smallest representation in the S&P 500 that it has had in over forty years. Forty years ago, the allocation to energy was the highest of any sector. S&P’s sector allocation has implications for and is correlated to many of the other benchmarks that are in some way tied to this particular index. Ironically, despite barely being represented, energy companies are much more profitable today than they were three years ago, yet their representation has shrunk dramatically. When sector weights reach extremes, small changes can have dramatic impacts; this goes for sectors at historically high weights as well as those at historically low weights. Technology had the largest allocation of all sectors in the late 1990s. Being cautious and underweight was ultimately proven right. More importantly, it was the prudent thing to do. Financials were nearly 40% of the Russell 1000 Value at the peak of the credit cycle in 2006. The prudent asset allocation at that time would have been to underweight risky financials and overweight neglected sectors. Today, we once again find sectors being neglected. As value investors, this is where we often find opportunities. We currently happen to be overweight energy compared with our benchmarks. We are overweight not simply because of their general absence in most benchmarks but because of their profits and cash flow distributions to shareholders. The same can be said about basic materials. Companies like Dow and DuPont are not becoming disintermediated or eliminated from the industrial supply chain. Yet that is exactly what is taking place in benchmarks; they are being eliminated from economic representation in what are supposed to be diversified benchmarks. At just over 3% in the S&P 500 Value and under 2% in the Morningstar Large Value; the basic materials sector is becoming a rounding error. We also are overweight basic materials.
The reverse is also true. The competitive global currency devaluation, which is directly tied to the decline in rates in most developed countries has also led to excesses in interest sensitive sectors. Those clearly include utilities and many consumer staples. Ultimately, valuations and fundamentals trump momentum and trend following; for this reason we are under-represented compared with our benchmarks and this hurt over the last year. It is striking to us how severe the disappearance of valuation discipline is so soon following the global financial crisis. What is all the more striking is that we are in the midst of real-time examples of excesses being unwound. Yet investors are choosing to ignore any parallels.
Let’s take a look at WeWork, or We Co, as it is now called. No one with any common sense believes that the We Company operates a sustainable business model. We Co has not re-designed the house of cards. What it is doing is quite simply dangerous and has been tried time and time before; it has never succeeded. In short the company has a massive asset-liability mismatch. This is the downfall of any company that has attempted such a scheme before the We Company. Assets, rents in this case, are short-term, typically month-to-month. Liabilities, leases on buildings, tend to be long-term, however, say five to ten years on average. So We Co is locking in long-term obligations while suffering the vagaries of customers which choose to rent every month. Any downturn and this model will self-destruct; and it will do so quickly. In fact, even without a downturn, it appears that the model is imploding. Investors have been content to mostly watch the drama unfold from the sidelines knowing the absurdity of it all. Yet those same investors are ignoring similar excesses in other
BAYWOOD VALUEPLUS FUND
A MESSAGE TO OUR SHAREHOLDERS (Unaudited)
SEPTEMBER 30, 2019
much more liquid markets. In fact, investors are ignoring similar excesses in much more significant asset classes. If We Co disappears, this may not be a significant problem on its own. However, more broadly speaking the impacts could be fairly significant when you consider its effect on commercial real estate prices and the banks with exposure to such real estate. If bond proxies stop being purchased simply due to trend following and momentum, however, the effect will be much more significant. In conclusion, despite being shown a real time example of what to stay away from due to inevitably bad consequences, most refuse to draw comparisons to the much bigger elephant in the room.
We will continue to steer clear of excesses in the marketplace and focus our attention on sectors that are being neglected. Over the last year, this resulted in underperformance compared to benchmarks. But this is a marathon, not a sprint and we find solace in the fact that over time, common sense has prevailed in equity markets. We also take solace in companies that have sound or improving balance sheets, not the other way around. This will be rewarded at some point in time.
We do not lay all the blame on index construction, excesses and abuses. Nevertheless, over half of ValuePlus’ gap with the S&P 500 Value resulted from sector allocation differences. We also were responsible for owning stocks whose investment hypotheses failed to materialize in our favor. Within energy, Schlumberger, Occidental and H&P all detracted from overall returns. Due to their inclusion within energy, it is difficult to specify whether those declines were stock specific or due to the wholesale elimination of energy stocks. Not all is rosy within energy and both Schlumberger and Helmerich & Payne need to experience an improvement in their customers’ orders in order to benefit. Until large energy companies start spending in order to improve their production growth, servicing the sector will be difficult. We will also fault Occidental for its unflattering stock. We exited our position following what we believe to be an overpriced acquisition of Anadarko Petroleum with high priced debt. Management can take complete responsibility for the decline in their stock and we cannot fault other investors for seeking management changes. This is not simply optically bad; it appears bad on all fronts.
Tapestry, CenturyLink and Taubman also detracted significantly during the fiscal year. The three companies fall in distinct categories of underperformers. Ultimately, the question we ask ourselves is whether the issue is temporary or permanent and if it the issues can be resolved within our investment horizon. In the case of Tapestry, trade tensions have clearly had a negative impact. While we believe that US China relationship will improve, the passage of time is not in Tapestry’s favor. Fashion is fickle and products need to be able to sell within a compressed timeframe. Without the ability to do so, the restructuring that the company has been implementing may not succeed, or do so within an indeterminate timeframe. For these reasons, we exited despite attractive valuation. Fundamentals trump valuations whether they be expensive or inexpensive stocks.
In a completely different sector, CenturyLink is a company that generates high levels of cash flow. We simply need it to reduce debt with the proceeds. It is that simple. We have given the company until the end of 2019, more or less, to notice an improvement in its balance sheet. If we fail to see this desired improvement, we will conclude that management is not taking the steps necessary to strengthen itself enough in the case of an economic downturn and we will very likely exit.
Taubman falls in yet another category of high-grading our portfolio in times of general price declines. It should be no secret that mall REIT’s have suffered recently due to retailer bankruptcies. Yet there are good mall operators and there are poor mall operators. Taubman belongs in the former category. Nevertheless, all mall REIT’s have declined significantly, including a couple of more diversified companies, Brookfield Properties and Simon Property Group. We took the opportunity to high-grade into Brookfield due to the decline in all of the companies’ stocks. It is not that we completely lost faith in Taubman; it is simply that we were able to get similar upside potential with a lower probability assigned to a negative outcome.
As we look out towards a new fiscal year, we have no idea what the broad markets will do. Over a reasonable time period, however, we would encourage investors to moderate their overall return expectations. As always, we will continue to manage this strategy with sound investment principles. We will continue to do this because we ourselves are large investors in the fund and we therefore would have it no other way. As a result, while differences between the fund and markets may differ over short to medium time periods, we are confident that we will continue to build wealth over time while being prudent, all the more so during times of excess.
Current and future portfolio holdings are subject to change and risk.
The Morningstar category is used to compare fund performance to its peers. It is not possible to invest directly into an index or category. Past performance is no guarantee of future results.
BAYWOOD VALUEPLUS FUND
A MESSAGE TO OUR SHAREHOLDERS (Unaudited)
SEPTEMBER 30, 2019
Risk Considerations: Mutual fund investing involves risk, including the possible loss of principal. The Fund primarily invests in undervalued securities, which may not appreciate in value as anticipated by the Advisor or remain undervalued for longer than anticipated. The Fund may invest in American Depositary Receipts (ADRs), which involves risks relating to political, economic or regulatory conditions in foreign countries and may cause greater volatility and less liquidity. The Fund may also invest in convertible securities and preferred stock, which may be adversely affected as interest rates rise.
BAYWOOD VALUEPLUS FUND
PERFORMANCE CHART AND ANALYSIS (Unaudited)
SEPTEMBER 30, 2019
The following chart reflects the change in the value of a hypothetical $10,000 investment, including reinvested dividends and distributions, in the Baywood ValuePlus Fund (the “Fund”) compared with the performance of the benchmarks, Morningstar US Large Value TR Index, and the secondary benchmark, S&P 500 Value TR Index (the “indices”), since inception. The Morningstar US Large Value TR Index measures the performance of large-cap stocks with relatively low prices given anticipated per share earnings, book value, cash flow, sales and dividends. The S&P 500 Value TR Index is a market capitalization weighted index. The total return of the indices include the reinvestment of dividends and income. The total return of the Fund includes operating expenses that reduce returns, while the total return of the indices do not include expenses. The Fund is professionally managed, while the indices are unmanaged and are not available for investment.
Comparison of Change in Value of a $10,000 Investment
Institutional Shares vs. Morningstar US Large Value TR Index and S&P 500 Value TR Index
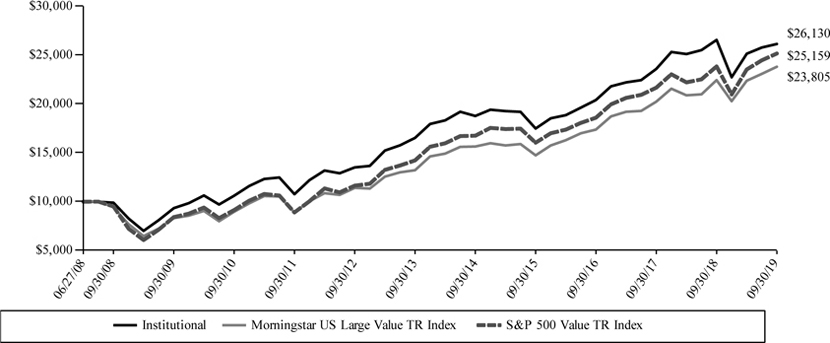
| Average Annual Total Returns Periods Ended September 30, 2019 | One Year | Five Year | Ten Year | Since Inception 06/27/08 | ||||
| Baywood ValuePlus Fund* | -1.55% | 6.84% | 10.84% | 8.90% | ||||
| Morningstar US Large Value TR Index | 6.12% | 8.76% | 11.09% | 8.01% | ||||
| S&P 500 Value TR Index | 5.56% | 8.47% | 11.56% | 8.54% |
| * | The Fund’s Institutional Shares performance for periods prior to the commencement of operations (12/2/13) is that of a collective investment trust managed by the Fund’s Advisor and portfolio management team. The Institutional Shares of the collective investment trust commenced operations on May 2, 2011. |
Performance data quoted represents past performance and is no guarantee of future results. Current performance may be lower or higher than the performance data quoted. Investment return and principal value will fluctuate so that shares, when redeemed, may be worth more or less than original cost. As stated in the Fund’s prospectus, the annual operating expense ratio (gross) is 8.83%. However, the Fund’s advisor has contractually agreed to waive its fee and/or reimburse Fund expenses to limit Total Annual Fund Operating Expenses After Fee Waiver and/or Expense Reimbursement (excluding all taxes, interest, portfolio transaction expenses, acquired fund fees and expenses, proxy expenses and extraordinary expenses) to 0.70%, through January 31, 2020 (the “Expense Cap”). The Expense Cap may be raised or eliminated only with the consent of the Board of Trustees. The advisor may be reimbursed by the Fund for fees waived and expenses reimbursed by the advisor pursuant to the Expense Cap if such payment is approved by the Board, made within three years of the fee waiver or expense reimbursement and does not cause the Total Annual Fund Operating Expenses After Fee Waiver and/or Expense Reimbursement to exceed the lesser of (i) the then-current Expense Cap and (ii) the Expense Cap in place at the time the fees/expenses were waived/reimbursed. Total Annual Fund Operating Expenses After Fee Waiver and/or Expense Reimbursement will increase if exclusions from the Expense Cap apply. During the period, certain fees were waived and/or expenses reimbursed; otherwise, returns would have been lower. The performance table and graph do not reflect the deduction of taxes that a shareholder would pay on Fund distributions or the redemption of Fund shares. Returns greater than one year are annualized. For the most recent month-end performance, please call (855) 409-2297.
BAYWOOD VALUEPLUS FUND
SCHEDULE OF INVESTMENTS
SEPTEMBER 30, 2019
| Shares | Security Description | Value | ||||||
| Common Stock - 97.1% | ||||||||
| Basic Materials - 6.3% | ||||||||
| 966 | Corteva, Inc. | $ | 27,048 | |||||
| 733 | Dow, Inc. | 34,928 | ||||||
| 366 | DuPont de Nemours, Inc. | 26,099 | ||||||
| 1,160 | Nutrien, Ltd. | 57,861 | ||||||
| 300 | Packaging Corp. of America | 31,830 | ||||||
| 177,766 | ||||||||
| Capital Goods / Industrials - 8.7% | ||||||||
| 600 | Cummins, Inc. | 97,602 | ||||||
| 500 | Eaton Corp. PLC | 41,575 | ||||||
| 1,300 | Johnson Controls International PLC | 57,057 | ||||||
| 500 | TE Connectivity, Ltd. | 46,590 | ||||||
| 242,824 | ||||||||
| Communication Services - 6.2% | ||||||||
| 2,100 | CenturyLink, Inc. | 26,208 | ||||||
| 1,400 | Comcast Corp., Class A | 63,112 | ||||||
| 1,400 | Verizon Communications, Inc. | 84,504 | ||||||
| 173,824 | ||||||||
| Consumer Discretionary - 7.2% | ||||||||
| 700 | Kontoor Brands, Inc. | 24,570 | ||||||
| 600 | Lear Corp. | 70,740 | ||||||
| 1,000 | Target Corp. | 106,910 | ||||||
| 202,220 | ||||||||
| Consumer Staples - 8.9% | ||||||||
| 200 | Kimberly-Clark Corp. | 28,410 | ||||||
| 1,000 | Molson Coors Brewing Co., Class B | 57,500 | ||||||
| 700 | Mondelez International, Inc., Class A | 38,724 | ||||||
| 300 | PepsiCo., Inc. | 41,130 | ||||||
| 700 | Walmart, Inc. | 83,076 | ||||||
| 248,840 | ||||||||
| Energy - 10.2% | ||||||||
| 700 | BP PLC, ADR | 26,593 | ||||||
| 600 | Chevron Corp. | 71,160 | ||||||
| 900 | ConocoPhillips | 51,282 | ||||||
| 500 | Helmerich & Payne, Inc. | 20,035 | ||||||
| 600 | Phillips 66 | 61,440 | ||||||
| 1,600 | Schlumberger, Ltd. | 54,672 | ||||||
| 285,182 | ||||||||
| Financials - 20.7% | ||||||||
| 2,000 | American International Group, Inc. | 111,400 | ||||||
| 300 | Ameriprise Financial, Inc. | 44,130 | ||||||
| 700 | BOK Financial Corp. | 55,405 | ||||||
| 1,200 | Citigroup, Inc. | 82,896 | ||||||
| 700 | Fidelity National Financial, Inc. | 31,087 | ||||||
| 300 | M&T Bank Corp. | 47,391 | ||||||
| 1,500 | MetLife, Inc. | 70,740 | ||||||
| 1,000 | Morgan Stanley | 42,670 | ||||||
| 800 | Prosperity Bancshares, Inc. | 56,504 | ||||||
| 700 | U.S. Bancorp | 38,738 | ||||||
| 580,961 | ||||||||
| Health Care - 12.7% | ||||||||
| 200 | AbbVie, Inc. | 15,144 | ||||||
| 300 | Amgen, Inc. | 58,053 | ||||||
| 1,000 | AstraZeneca PLC, ADR | 44,570 | ||||||
| 600 | Cardinal Health, Inc. | 28,314 | ||||||
| 400 | CVS Health Corp. | 25,228 | ||||||
| 800 | Gilead Sciences, Inc. | 50,704 | ||||||
| 1,700 | Koninklijke Philips NV, ADR | 78,421 | ||||||
| 500 | Medtronic PLC | 54,310 | ||||||
| 354,744 | ||||||||
| Shares | Security Description | Value | ||||||
| Real Estate - 4.2% | ||||||||
| 2,100 | Brookfield Property REIT, Inc. | $ | 42,819 | |||||
| 4,600 | VEREIT, Inc. REIT | 44,988 | ||||||
| 1,100 | Weyerhaeuser Co. REIT | 30,470 | ||||||
| 118,277 | ||||||||
| Technology - 7.6% | ||||||||
| 1,800 | Cisco Systems, Inc. | 88,938 | ||||||
| 1,300 | HP, Inc. | 24,596 | ||||||
| 1,100 | Intel Corp. | 56,683 | ||||||
| 800 | NetApp, Inc. | 42,008 | ||||||
| 212,225 | ||||||||
| Transportation - 2.4% | ||||||||
| 1,900 | Seaspan Corp. | 20,197 | ||||||
| 300 | Union Pacific Corp. | 48,594 | ||||||
| 68,791 | ||||||||
| Utilities - 2.0% | ||||||||
| 700 | Dominion Energy, Inc. | 56,728 | ||||||
| Total Common Stock (Cost $2,355,598) | 2,722,382 | |||||||
| Shares | Security Description | Value | ||||||
| Money Market Fund - 2.9% | ||||||||
| 80,976 | Federated Government Obligations Fund, Institutional Class, 1.85% (a) | |||||||
| (Cost $80,976) | 80,976 | |||||||
| Investments, at value - 100.0% (Cost $2,436,574) | $ | 2,803,358 | ||||||
| Other Assets & Liabilities, Net - 0.0% | (1,078 | ) | ||||||
| Net Assets - 100.0% | $ | 2,802,280 | ||||||
| ADR | American Depositary Receipt |
| PLC | Public Limited Company |
| REIT | Real Estate Investment Trust |
| (a) | Dividend yield changes daily to reflect current market conditions. Rate was the quoted yield as of September 30, 2019. |
The following is a summary of the inputs used to value the Fund's instruments as of September 30, 2019.
The inputs or methodology used for valuing securities are not necessarily an indication of the risks associated with investing in those securities. For more information on valuation inputs, and their aggregation into the levels used in the table below, please refer to the Security Valuation section in Note 2 of the accompanying Notes to Financial Statements.
| Valuation Inputs | Investments in Securities | |||
| Level 1 - Quoted Prices | $ | 2,722,382 | ||
| Level 2 - Other Significant Observable Inputs | 80,976 | |||
| Level 3 - Significant Unobservable Inputs | – | |||
| Total | $ | 2,803,358 | ||
The Level 1 value displayed in this table is Common Stock. The Level 2 value displayed in this table is a Money Market Fund. Refer to this Schedule of Investments for a further breakout of each security by industry.
See Notes to Financial Statements.
BAYWOOD VALUEPLUS FUND
SCHEDULE OF INVESTMENTS
SEPTEMBER 30, 2019
| PORTFOLIO HOLDINGS (Unaudited) | ||||
| % of Total Investments | ||||
| Basic Materials | 6.3 | % | ||
| Capital Goods / Industrials | 8.7 | % | ||
| Communication Services | 6.2 | % | ||
| Consumer Discretionary | 7.2 | % | ||
| Consumer Staples | 8.9 | % | ||
| Energy | 10.2 | % | ||
| Financials | 20.7 | % | ||
| Health Care | 12.7 | % | ||
| Real Estate | 4.2 | % | ||
| Technology | 7.6 | % | ||
| Transportation | 2.4 | % | ||
| Utilities | 2.0 | % | ||
| Money Market Fund | 2.9 | % | ||
| 100.0 | % | |||
See Notes to Financial Statements.
BAYWOOD VALUEPLUS FUND
STATEMENT OF ASSETS AND LIABILITIES
SEPTEMBER 30, 2019
| ASSETS | ||||
| Investments, at value (Cost $2,436,574) | $ | 2,803,358 | ||
| Receivables: | ||||
| Fund shares sold | 1,781 | |||
| Dividends | 4,140 | |||
| From investment advisor | 9,464 | |||
| Prepaid expenses | 8,684 | |||
| Total Assets | 2,827,427 | |||
| LIABILITIES | ||||
| Accrued Liabilities: | ||||
| Fund services fees | 4,766 | |||
| Other expenses | 20,381 | |||
| Total Liabilities | 25,147 | |||
| NET ASSETS | $ | 2,802,280 | ||
| COMPONENTS OF NET ASSETS | ||||
| Paid-in capital | $ | 2,411,519 | ||
| Distributable earnings | 390,761 | |||
| NET ASSETS | $ | 2,802,280 | ||
| SHARES OF BENEFICIAL INTEREST AT NO PAR VALUE (UNLIMITED SHARES AUTHORIZED) | ||||
| Institutional Shares | 164,506 | |||
| NET ASSET VALUE, OFFERING AND REDEMPTION PRICE PER SHARE | ||||
| Institutional Shares (based on net assets of $2,802,280) | $ | 17.03 | ||
See Notes to Financial Statements.
BAYWOOD VALUEPLUS FUND
STATEMENT OF OPERATIONS
YEAR ENDED SEPTEMBER 30, 2019
| INVESTMENT INCOME | ||||
| Dividend income (Net of foreign withholding taxes of $604) | $ | 87,081 | ||
| Total Investment Income | 87,081 | |||
| EXPENSES | ||||
| Investment advisor fees | 13,469 | |||
| Fund services fees | 64,935 | |||
| Transfer agent fees: | ||||
| Investor Shares | 15,150 | |||
| Institutional Shares | 18,977 | |||
| Distribution fees: | ||||
| Investor Shares | 3,992 | |||
| Custodian fees | 5,000 | |||
| Registration fees: | ||||
| Investor Shares | 18,905 | |||
| Institutional Shares | 15,512 | |||
| Professional fees | 23,346 | |||
| Trustees' fees and expenses | 2,528 | |||
| Other expenses | 19,497 | |||
| Total Expenses | 201,311 | |||
| Fees waived and expenses reimbursed | (178,264 | ) | ||
| Net Expenses | 23,047 | |||
| NET INVESTMENT INCOME | 64,034 | |||
| NET REALIZED AND UNREALIZED GAIN (LOSS) | ||||
| Net realized gain on investments | 30,295 | |||
| Net change in unrealized appreciation (depreciation) on investments | (139,596 | ) | ||
| NET REALIZED AND UNREALIZED LOSS | (109,301 | ) | ||
| DECREASE IN NET ASSETS RESULTING FROM OPERATIONS | $ | (45,267 | ) | |
See Notes to Financial Statements.
BAYWOOD VALUEPLUS FUND
STATEMENTS OF CHANGES IN NET ASSETS
| For the Years Ended September 30, | ||||||||
| 2019 | 2018 | |||||||
| OPERATIONS | ||||||||
| Net investment income | $ | 64,034 | $ | 52,117 | ||||
| Net realized gain | 30,295 | 113,563 | ||||||
| Net change in unrealized appreciation (depreciation) | (139,596 | ) | 143,093 | |||||
| Increase (Decrease) in Net Assets Resulting from Operations | (45,267 | ) | 308,773 | |||||
| DISTRIBUTIONS TO SHAREHOLDERS | ||||||||
| Investor Shares | (113,003 | ) | (82,827 | )* | ||||
| Institutional Shares | (72,133 | ) | (39,334 | )** | ||||
| Total Distributions Paid | (185,136 | ) | (122,161 | ) | ||||
| CAPITAL SHARE TRANSACTIONS | ||||||||
| Sale of shares: | ||||||||
| Investor Shares | 7,750 | 12,064 | ||||||
| Institutional Shares | 2,204,983 | 137,213 | ||||||
| Reinvestment of distributions: | ||||||||
| Investor Shares | 112,658 | 82,750 | ||||||
| Institutional Shares | 72,102 | 39,334 | ||||||
| Redemption of shares: | ||||||||
| Investor Shares | (1,805,831 | ) | (1,103 | ) | ||||
| Institutional Shares | (435,150 | ) | (8,552 | ) | ||||
| Increase in Net Assets from Capital Share Transactions | 156,512 | 261,706 | ||||||
| Increase (Decrease) in Net Assets | (73,891 | ) | 448,318 | |||||
| NET ASSETS | ||||||||
| Beginning of Year | 2,876,171 | 2,427,853 | ||||||
| End of Year | $ | 2,802,280 | $ | 2,876,171 | *** | |||
| SHARE TRANSACTIONS | ||||||||
| Sale of shares: | ||||||||
| Investor Shares | 477 | 649 | ||||||
| Institutional Shares | 137,725 | 7,574 | ||||||
| Reinvestment of distributions: | ||||||||
| Investor Shares | 7,217 | 4,630 | ||||||
| Institutional Shares | 4,519 | 2,189 | ||||||
| Redemption of shares: | ||||||||
| Investor Shares | (112,284 | ) | (62 | ) | ||||
| Institutional Shares | (27,993 | ) | (474 | ) | ||||
| Increase in Shares | 9,661 | 14,506 | ||||||
| * | Distribution was the result of net investment income and net realized gain of $31,550 and $51,277, respectively, at September 30, 2018. |
| ** | Distribution was the result of net investment income and net realized gain of $16,732 and $22,602, respectively, at September 30, 2018. |
| *** | Includes undistributed net investment income of $5,683 at September 30, 2018. The requirement to disclose the corresponding amount as of September 30, 2019 was eliminated. |
See Notes to Financial Statements.
BAYWOOD VALUEPLUS FUND
FINANCIAL HIGHLIGHTS
These financial highlights reflect selected data for a share outstanding throughout each year or period presented.
| For the Year Ended September 30, 2019 | For the Year Ended September 30, 2018 | For the Year Ended September 30, 2017 | For the Period Ended September 30, 2016 (a) | For the Year Ended November 30, 2015 | December 2, 2013 (b) Through November 30, 2014 | |||||||||||||||||||
| INSTITUTIONAL SHARES | ||||||||||||||||||||||||
| NET ASSET VALUE, Beginning of Period | $ | 18.63 | $ | 17.36 | $ | 15.59 | $ | 17.00 | $ | 19.42 | $ | 17.56 | ||||||||||||
| INVESTMENT OPERATIONS | ||||||||||||||||||||||||
| Net investment income (c) | 0.44 | 0.38 | 0.38 | 0.29 | 0.39 | 0.41 | ||||||||||||||||||
| Net realized and unrealized gain (loss) | (0.84 | ) | 1.76 | 2.02 | 0.94 | (1.06 | ) | 1.50 | ||||||||||||||||
| Total from Investment Operations | (0.40 | ) | 2.14 | 2.40 | 1.23 | (0.67 | ) | 1.91 | ||||||||||||||||
| DISTRIBUTIONS TO SHAREHOLDERS FROM | ||||||||||||||||||||||||
| Net investment income | (0.39 | ) | (0.35 | ) | (0.36 | ) | (2.27 | ) | (0.35 | ) | (0.05 | ) | ||||||||||||
| Net realized gain | (0.81 | ) | (0.52 | ) | (0.27 | ) | (0.37 | ) | (1.40 | ) | – | |||||||||||||
| Total Distributions to Shareholders | (1.20 | ) | (0.87 | ) | (0.63 | ) | (2.64 | ) | (1.75 | ) | (0.05 | ) | ||||||||||||
| NET ASSET VALUE, End of Period | $ | 17.03 | $ | 18.63 | $ | 17.36 | $ | 15.59 | $ | 17.00 | $ | 19.42 | ||||||||||||
| TOTAL RETURN | (1.55 | )% | 12.57 | % | 15.60 | % | 8.65 | %(d) | (3.58 | )% | 10.87 | %(d) | ||||||||||||
| RATIOS/SUPPLEMENTARY DATA | ||||||||||||||||||||||||
| Net Assets at End of Period (000s omitted) | $ | 2,802 | $ | 936 | $ | 711 | $ | 536 | $ | 426 | $ | 11,067 | ||||||||||||
| Ratios to Average Net Assets: | ||||||||||||||||||||||||
| Net investment income | 2.66 | % | 2.10 | % | 2.28 | % | 2.30 | %(e) | 2.23 | % | 2.26 | %(e) | ||||||||||||
| Net expenses | 0.70 | % | 0.70 | % | 0.70 | % | 0.70 | %(e) | 0.70 | % | 0.70 | %(e) | ||||||||||||
| Gross expenses (f) | 8.13 | % | 8.83 | % | 11.16 | % | 14.43 | %(e) | 2.09 | % | 2.50 | %(e) | ||||||||||||
| PORTFOLIO TURNOVER RATE | 49 | % | 34 | % | 48 | % | 22 | %(d) | 32 | % | 35 | %(d) | ||||||||||||
| (a) | Effective March 24, 2016, the Fund changed its fiscal year end from November 30 to September 30. The information presented is for the period December 1, 2015 to September 30, 2016. |
| (b) | Commencement of operations. |
| (c) | Calculated based on average shares outstanding during each period. |
| (d) | Not annualized. |
| (e) | Annualized. |
| (f) | Reflects the expense ratio excluding any waivers and/or reimbursements. |
See Notes to Financial Statements.
BAYWOOD SOCIALLYRESPONSIBLE FUND
A MESSAGE TO OUR SHAREHOLDERS (Unaudited)
SEPTEMBER 30, 2019
Dear Shareholder,
We are pleased to report our economic and financial market perspectives and the investment activities for the Baywood SociallyResponsible Fund (the “Fund”) for the 12 months ended September, 2019. The Fund is a mid-to-large capitalization value-oriented portfolio of stock holdings selected from a universe of stocks created through the application of inclusionary and exclusionary social screens and assessments of the ESG profile of each company. Among these stocks, we further evaluate and assess each prospective holding’s valuation and fundamental business attraction to determine the current portfolio holdings. In selecting investments, we consider social criteria such as an issuer’s community relations, corporate governance, employee diversity, employee relations, environmental impact and sustainability, human rights record and product safety. Using both quantitative and qualitative data, we also evaluate an issuer’s involvement in specific revenue generating activities to determine whether the issuer’s involvement was meaningful or incidental with respect to that activity.
We would like to take a moment to address a troubling trend that has been gaining in popularity in recent years. Indexation has been a boon to the asset-gathering fund supermarkets and a bane to active managers who attempt to keep up with the S&P 500 and all of its offshoots. Without rehashing what is mostly common knowledge by now, we’d like to highlight a single example which perfectly illustrates the situation in which some investors find themselves. Beginning with the conclusion, when this trend breaks down, as it inevitably will, it will pose significant risks to most investors’ and plans’ capital preservation objective.
MSCI, the owner of S&P and its ubiquitous indices recently expanded its list to include an ESG version of the S&P 500, as all good index providers know a large untapped market when they see one. What started as a noble and worthwhile cause—that of owning sustainably run companies across industries for the long-term benefit of all stakeholders—has very quickly morphed into a race for assets. The desired end has shifted as have the means—it is purely and simply about capturing as many assets as possible rather than serving client needs, desires and objectives.
SKBA begins its process by recognizing that for clients that have a passion for investing in companies that, for example, are environmentally responsible and avoiding those that are not, the portfolio that meets their needs, desires and objectives ought to be quite different than the broader index holdings and weights. Just reshuffling the deck of cards (stocks and weights) doesn’t accomplish this.
Indexation, in general, has the beneficial or perverse effect, depending on which side of the table one might be, of lowering profitability for mutual fund and ETF complexes. As with many ideas before it, what started out as a noble cause under Vanguard’s Jack Bogle, has been taken too far and become a dangerous one. The resulting profit compression has prompted the explosion of variants of existing products in order to make up for the deteriorating business model. As such, said supermarkets have been on a frenzied pursuit of growth in order to satisfy their own shareholders’ thirst for higher and higher earnings. One might ask how that, in and of itself, might demonstrate responsibility or sustainability. It does not.
Being students and practitioners of the industry for a number of decades, we have witnessed many examples of such behavior; our observation is that they rarely end well. Financial Products at AIG were not in fact a bad business as long as they remained a small part of the overall business. But a change in management ushered Financial Products to its extreme to which it brought the destruction of AIG.
Attempting to have deeper customer relationships at inception was not a bad idea for Wells Fargo until new management decided that “if some was good, more would be better.” Financial companies aren’t the only ones to fall for this trap but they do figure prominently. Enter ESG.
MSCI, the owner behind the S&P 500 index, introduced the S&P 500 ESG index early this year. As investors in the ESG/SRI space on behalf of many of our clients and shareholders since the inception of our firm in the late 1980s, our curiosity obviously led us to perform some basic investigating.
The S&P 500 index is market capitalization weighted, the same way many indexes are constructed. The largest companies in terms of size, not revenues or profits mind you, are given the largest weights. The size of revenues or profits, in fact, are not considered in constructing the S&P 500. Old fashioned investors might think that the level of revenues or profits should contribute to a company’s weight in an index like the S&P 500; they do not. Being of a different mindset, we would consider that to be an issue for the sustainability of the index’s return longer-term.
There is another issue; the S&P 500 and the S&P 500 ESG are float-adjusted. The more shares outstanding a company has, the better. As long term investors, again being of a different mindset, we like to see companies repurchase their shares over time. We also like to
BAYWOOD SOCIALLYRESPONSIBLE FUND
A MESSAGE TO OUR SHAREHOLDERS (Unaudited)
SEPTEMBER 30, 2019
see managements be significant owners of their shares, not simply of options. Shares are typically purchased whereas options tend to be granted. Owning shares outright in one’s company can speak highly of management’s alignment of interests with those of shareholders. While we recognize that there are bad apples and exceptions to every rule, shareholder alignment tends to reduce perverse incentives. Perverse incentives include compensation not tied to the well-being of the company and all its stakeholders. Perverse incentives destroy sustainability and economic goodwill. Perverse incentives are widespread in corporations as compensation is laden with generous options grants. Owner-operators and vested managers tend to be better operators. Yet float-adjusted benchmarks like the S&P 500 discourage this from taking place by selling companies that reduce their public float. The more management is aligned with shareholders and the more that is purchased by companies with the goal of reducing shares outstanding, the less it will be owned in the index.
So the S&P 500 ESG is market cap weighted and it is float adjusted; two significant issues in and of themselves but secondary to the point of this note. Let’s assume that the motives behind creating an ESG index are virtuous and that the construction is improved over its unscreened relative. Recall that good motives and ideas can lead to bad outcomes when taken to excess.
Below you’ll find the constitution of the largest ten holdings in each, the S&P 500 on the left, the screened S&P 500 ESG on the right.
| S&P 500 | S&P 500 ESG | |||||
| Name | Sector | Weight | Name | Sector | Weight | |
| Alphabet Inc. Class A | Technology | 3.24% | Alphabet Inc. Class A | Communication Services | 1.97% | |
| Amazon.com, Inc. | Consumer Non-Cyclicals | 3.35% | Alphabet Inc. Class C | Communication Services | 2.03% | |
| Apple, Inc. | Technology | 3.75% | Amazon.com, Inc. | Consumer Discretionary | 3.92% | |
| Berkshire Hathaway Inc. Class B | Finance | 1.94% | Apple, Inc. | Information Technology | 5.07% | |
| Facebook, Inc. Class A | Technology | 2.02% | Exxon Mobil Corp. | Energy | 1.61% | |
| Johnson & Johnson | Healthcare | 1.32% | Johnson & Johnson | Health Care | 1.85% | |
| JPMorgan Chase & Co. | Finance | 1.44% | JPMorgan Chase & Co. | Financials | 2.05% | |
| Microsoft Corp. | Technology | 4.03% | Microsoft Corp. | Information Technology | 5.64% | |
| Visa Inc. Class A | Finance | 1.18% | Proctor & Gamble Co. | Consumer Staples | 1.63% | |
| Walmart, Inc. | Consumer Non-Cyclicals | 1.27% | Visa, Inc. Class A | Information Technology | 1.62% | |
Eight of the largest ten holdings are identical, and because the weights in subsequent holdings tend to decline significantly in importance, having this level of overlap is no small detail. In the S&P 500, those holdings represent nearly a fifth of the overall index, a meaningful level, leaving 493 companies to duke it out for the rest. In the S&P 500 ESG, those same holdings account for nearly a fourth of the overall index, an even higher concentration. So, seven companies, or 3% of all of the holdings (the index holds 319 companies as a result of its exclusionary screens), account for one fourth of the index. Seven companies account for a quarter of the index! The ESG index may have as one of its objectives similar sector weights as the overall index—it says nothing about concentration risk, however, for obvious reasons.
Tangentially, some might also find it interesting that Exxon Mobil has found its way in the largest holdings of the ESG index. To anyone with a modicum of ESG sensibilities, energy has been front and center as a significant actor in climate change discussions. Yet, apparently, index providers and their algorithms have short memories. We are not making a judgement as to the merits or lack thereof of the energy complex. We do find it ironic, however, that a company with one of the largest carbon footprints in the world finds its way in the largest holdings of an ESG index by the most widely followed index provider.
The takeaway is that by selecting the ESG index, one gets identical holdings but with even greater concentration of returns from very few securities. At its most basic, everything about the screened index is in fact constructed in a way that should be anathema to an ESG screened benchmark.
Conclusion: if you want an S&P 500 ESG fund that is less socially IR-responsible than the S&P 500 ESG fund, you will be better served by simply buying the unscreened index. The lesson for investors concerned about ESG is to buy the regular S&P, not the one that portends to be ESG focused.
Another lesson might be to diversify away from the S&P 500 and its offshoots altogether. We’d argue that may in fact be a desirable source of risk mitigation.
Now that we have espoused the ways in which we may be different than others in our thinking of how things should be versus how they are, let us begin a discussion of how they are for us, and our shareholders. As significant owners in the fund, our interests are aligned. This year our firm is celebrating its 30th year in business. We have seen many cycles and each one is different than the other, however
BAYWOOD SOCIALLYRESPONSIBLE FUND
A MESSAGE TO OUR SHAREHOLDERS (Unaudited)
SEPTEMBER 30, 2019
when taken as a whole, they tend not to be that dissimilar. For example, the robust returns witnessed in 2019 are no big surprise when you consider how the year began, reeling from the declines witnessed in the fourth quarter of last year, where the average stock in the broad market was down over 16%. Most investors understand that if a stock declines 50%, it takes 100% growth just to get back to the original price. Similarly, since the average stock declined over 16% in the fourth quarter, then it would take nearly a 20% increase in the average stock to regain what it lost. We aren’t quite there yet, but the returns so far this year have driven the average stock pretty close to where it was at the beginning of the year.
We believe it’s prudent to discuss the fiscal year as a tale of two time periods. The first being the fourth quarter of 2018, the second being the calendar year of 2019. We believe the fourth quarter of 2018 was a great buying opportunity, not one to head for the exits. The fact that the Baywood SociallyResponsible strategy has outperformed its benchmark for the calendar year 2019 is testament to the will it took to buy in the face of the major declines. The companies we either initiated a position in or added to existing holdings, have returned an average of 35% this year, which is nearly double the index’s return of 18%. Companies like Disney, Aptiv, CarMax and NXP Semiconductors were initiated in the fourth quarter of 2018 while we increased our holdings in AIG, Mondelez and TRI Pointe Group. Each one of these companies outperformed the benchmark for the calendar year. The top performers in the calendar year are NXP Semiconductors, American International Group, Aptiv and Mondelez which returned 50%, 44%, 43% and 40% respectively and together represent 11% of the portfolio.
The fourth quarter of 2018 was an entirely different animal, however, and the severe declines witnessed were what provided the opportunity for better relative performance in 2019. The market reacted to an intensified trade war and interest rate volatility in somewhat of a predictable fashion (yet not entirely rational in our opinion) given the knee-jerk flight to safety and the largest capitalization companies. We have discussed, ad nauseam, the elevated valuations for bond-proxy and “defensive sectors” that run counter to each group’s collective fundamentals. Currently, in our view, utilities represent a high risk due to the market’s current view of the sector as a safe-haven asset AND a bond-proxy. Yet, we see challenged fundamentals that are likely to become more acute over the near-term. Utilities are likely to suffer as renewable portfolio standards enacted by the individual state regulatory bodies mean that a greater percentage of higher cost renewable energy sources will be forced upon rate payers. This, in turn, is likely to drive further demand for solar, and other consumer focused renewable solutions, as rate payers will continue to put up panels on their roofs to help offset the higher rates. This “spiral” will likely continue, forcing rate payers to exit the market and the burden of a higher level of fixed costs will be placed on a smaller number of rate payers. Combine this with high valuations due to the safe-haven and bond proxy status and we don’t see much of anything good in utilities right now, yet, as with any “knee-jerk reaction,” the market didn’t care for fundamentals, only what it perceived as safe.
One could easily argue the same for consumer staples, and more specifically, packaged food companies, with the exception that a large portion of the group has already had its “day of reckoning.” Up until recently ALL consumer staples enjoyed the dual “safe-haven/bond proxy” status with elevated valuations and low relative yields, until the overwhelmingly poor fundamentals of the food stocks began to be priced in. For example, Kraft-Heinz, loaded up on cheap debt for years to make acquisitions, in an attempt to mask the reality that people are no longer attracted to their products in the middle of the grocery store. As consumers gravitate towards healthier, less processed food, declining revenue problems become compounded by the high levels of debt. This finally pushed their unsustainably high valuations back down to reality, along with dividend cuts and as debt rating downgrades. We believe some utilities may see a similar correction in the not so distant future. Being underweight staples and utilities account for nearly one-third of the relative performance versus the benchmark for the fiscal year, yet we believe that maintaining our underweight in these fundamentally challenged and highly valued sectors is the prudent choice long-term.
Another issue unique to the fourth quarter of 2018 was the difference in returns between the largest, call it mega-capitalization stocks (greater than $200B), and everything else. The average stock in the broad market declined about 16% in the fourth quarter, yet mega-caps’ declines were less than 6%. This is the due to the general effect of indexation, which it is an identity of sorts that the largest companies tend to stay that way as they will become an increasingly larger percent of the indices due to their size, which continues to reinforce itself as investors blindly pour money into the indices or ETF’s that track them. That is, of course, until it doesn’t. The expectations of returns will eventually become so great that not even the best run company can deliver, as any large company knows how difficult it is to grow revenues and earnings at high rates once you achieve scale. The result is that unless an active manager “hugged” the benchmark (which by definition would make her a passive not active manager), in a reactive quarter like the fourth quarter of 2018, it would have been very difficult to outperform. This is not a new phenomenon, by the way. It is part and parcel a phenomenon of investing during ebullient times. While the hit to performance is never easy in the short-run, in the long-run our strategy has benefitted by avoiding these short-term fits and instead using the opportunity to purchase stocks at extremely depressed levels, like we did in the fourth quarter of 2018. The other two-thirds of relative performance versus the benchmark can be explained by our holdings in communications and energy, whereby the average stock’s capitalization is less than $20B. We believe our jobs as active value managers
BAYWOOD SOCIALLYRESPONSIBLE FUND
A MESSAGE TO OUR SHAREHOLDERS (Unaudited)
SEPTEMBER 30, 2019
is not to choose when to look like the index or not, it is simply to purchase companies where the market price is substantially lower than the intrinsic value we place on a company.
This notion is best represented by examining the holdings of the Baywood SociallyResponsible fund over the last year. The changes that were made to the portfolio in this volatile one-year period are fairly stark compared to prior years. The holdings in communication services and real estate have increased more than 50% year-over-year, while our holdings in energy and health care have declined by nearly the same amount. In health care, our holdings decreased as a result of exiting and lowering our holdings in successful long-term investments Encompass Health, Royal Philips, Medtronic and Becton, Dickinson & Co. One common thread is that all of these successful investments either service or produce medical equipment for the healthcare industry. By far, majority of our holdings fall into this category as we chose to avoid headwinds facing many pharmaceutical companies, insurers, and hospitals during a time of bi-partisan support for changes to healthcare pricing. In favor of the holdings in health care and energy we have found opportunities in communications and consumer discretionary. After four years of underperformance, media companies under assault from cord cutting and streaming companies like Netflix finally arrived at valuation extremes, which allowed us to purchase the two companies best positioned to take advantage of the industry transformation. Both Disney and Comcast have massive content and distribution assets to offer exclusive viewing experiences, regardless of how its distributed. While Comcast still has its legacy cable-subscriber base in decline, it is in a much better position as both an internet and content provider than the majority of its peers. Beyond the battle for content, both are well run companies that were trading at a significant discount to their fair values due to concerns their businesses were going to be displaced by Netflix.
In consumer discretionary, we added two companies to the portfolio as of fiscal year-end which were both a result of recent spin-offs and market volatility. Aptiv, formerly known as Delphi, spun-off its powertrain business to focus on its faster growing segments aligned with the content growth in autos. As electric vehicles, hybrids, entertainment and safety features become a much larger part of the overall auto fleet, Aptiv has been capitalizing, growing its revenues well above market rates for a number of years. The content per vehicle, addressable by companies like Aptiv, for a traditional internal combustion engine is approximately $550. Compare that to the content per vehicle addressable by companies like Aptiv for an electrical vehicle of $1,100. The growth in the fleet of electric vehicles, over time, will allow companies like Aptiv to grow for an extended period of time. Furthermore, Aptiv provides autonomous content to one out of every three cars on the road. And, as more safety features tied to levels of autonomous driving like automatic emergency braking and lane assist become standard for fleets like Honda, Toyota, Ford and others, Aptiv should continue to benefit. During the fourth quarter, when stocks related to the auto industry declined on average greater than 40%, we were able to purchase this growth-like company at value-like prices.
Celebrating our 30th year in business and value investing demonstrates tenacity as we tend to lean away from popular investment trends, particularly during extremes. We’ve witnessed many such trends coming and going in and out of favor, whether it be from the perspective of investment style like value versus growth, management styles like active versus passive or from within an ESG/SRI perspective. The one common thread with most trends is that they also predominantly exhibit mean reversion. We’ve already expressed our trepidation when it comes to the trends involved with indexation. When it comes to an ESG/SRI perspective, our thought is that for too long the investment community favored profits first, everything else second. We are clearly now on a long-term trend back towards appreciation for all of a company’s constituents, including putting people and the environment back in focus. This trend should prove to be positive; we can’t say the same for the others. However, if one can glean something positive from the adoption of ESG criteria by the index providers, it could be taken as a sign of more widespread demand and acknowledgement from individual investors towards investing for a cause.
Current and future portfolio holdings are subject to change and risk.
The MSCI KLD 400 Social Index and the Morningstar Category are used to compare fund performance to its peers. It is not possible to invest directly into an index or category. Past performance is no guarantee of future results.
Risk Considerations: Mutual fund investing involves risk, including the possible loss of principal. Socially responsible investment criteria may limit the number of investment opportunities available to the Fund or it may invest a larger portion of its assets in certain sectors which could be more sensitive to market conditions, economic, regulatory and environmental developments. These factors could negatively impact the Fund’s returns. The Fund primarily invests in undervalued securities, which may not appreciate in value as anticipated by the Advisor or remain undervalued for longer than anticipated. The Fund may invest in American Depositary Receipts (ADRs), which involves risks relating to political, economic or regulatory conditions in foreign countries and may cause greater volatility and less liquidity. The Fund may also invest in convertible securities and preferred stock, which may be adversely affected as interest rates rise.
BAYWOOD SOCIALLYRESPONSIBLE FUND
PERFORMANCE CHART AND ANALYSIS (Unaudited)
SEPTEMBER 30, 2019
The following chart reflects the change in the value of a hypothetical $10,000 investment, including reinvested dividends and distributions, in the Baywood SociallyResponsible Fund (the “Fund”) compared with the performance of the primary benchmark, Morningstar U.S. Large Value TR Index, and the secondary benchmark, MSCI KLD 400 Social Index (the “indices”), since inception. The Morningstar US Large Value TR Index measures the performance of large-cap stocks with relatively low prices given anticipated per share earnings, book value, cash flow, sales and dividends. The MSCI KLD 400 Social Index is a capitalization weighted index of 400 US securities that provides exposure to companies with outstanding Environmental, Social and Governance ratings and excludes companies whose products have negative social or environmental impacts. The total return of the indices include the reinvestment of dividends and income. The total return of the Fund includes operating expenses that reduce returns, while the total return of the indices do not include expenses. The Fund is professionally managed, while the indices are unmanaged and are not available for investment.
Comparison of Change in Value of a $10,000 Investment
Institutional Shares vs. Morningstar US Large Value TR Index and MSCI KLD 400 Social Index
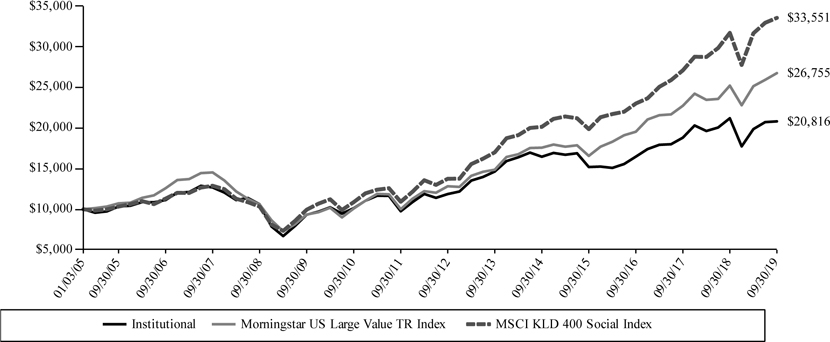
| Average Annual Total Returns Periods Ended September 30, 2019 | One Year | Five Year | Ten Year | Since Inception 01/03/05 | ||||
| Baywood SociallyResponsible Fund* | -1.79% | 4.80% | 8.35% | 5.10% | ||||
| Morningstar US Large Value TR Index | 6.12% | 8.76% | 11.09% | 6.90% | ||||
| MSCI KLD 400 Social Index | 5.81% | 10.75% | 12.93% | 8.56% |
| * | Performance for Institutional Shares for periods prior to January 8, 2016, reflects the performance and expenses of City National Rochdale Socially Responsible Equity Fund, a series of City National Rochdale Funds (the “Predecessor Fund”). |
Performance data quoted represents past performance and is no guarantee of future results. Current performance may be lower or higher than the performance data quoted. Investment return and principal value will fluctuate so that shares, when redeemed, may be worth more or less than original cost. As stated in the Fund’s prospectus, the annual operating expense ratio (gross) is 3.03%. However, the Fund’s advisor has contractually agreed to waive its fee and/or reimburse Fund expenses to limit Total Annual Fund Operating Expenses After Fee Waiver and/or Expense Reimbursement (excluding all taxes, interest, portfolio transaction expenses, acquired fund fees and expenses, proxy expenses and extraordinary expenses) to 0.89%, through January 31, 2020 (the “Expense Cap”). The Expense Cap may be raised or eliminated only with the consent of the Board of Trustees. The advisor may be reimbursed by the Fund for fees waived and expenses reimbursed by the advisor pursuant to the Expense Cap if such payment is approved by the Board, made within three years of the fee waiver or expense reimbursement and does not cause the Total Annual Fund Operating Expenses After Fee Waiver and/or Expense Reimbursement to exceed the lesser of (i) the then-current Expense Cap and (ii) the Expense Cap in place at the time the fees/expenses were waived/reimbursed. Total Annual Fund Operating Expenses After Fee Waiver and/or Expense Reimbursement will increase if exclusions from the Expense Cap apply. During the period, certain fees were waived and/or expenses reimbursed; otherwise, returns would have been lower. The performance table and graph do not reflect the deduction of taxes that a shareholder would pay on Fund distributions or the redemption of Fund shares. Returns greater than one year are annualized. For the most recent month-end performance, please call (855) 409-2297.
BAYWOOD SOCIALLYRESPONSIBLE FUND
SCHEDULE OF INVESTMENTS
SEPTEMBER 30, 2019
| Shares | Security Description | Value | ||||||
| Common Stock - 96.3% | ||||||||
| Basic Materials - 4.6% | ||||||||
| 1,900 | Nutrien, Ltd. | $ | 94,772 | |||||
| 300 | Packaging Corp. of America | 31,830 | ||||||
| 2,400 | The Mosaic Co. | 49,200 | ||||||
| 175,802 | ||||||||
| Capital Goods / Industrials - 4.8% | ||||||||
| 500 | Cummins, Inc. | 81,335 | ||||||
| 2,000 | Sensata Technologies Holding PLC (a) | 100,120 | ||||||
| 181,455 | ||||||||
| Communication Services - 11.0% | ||||||||
| 3,300 | CenturyLink, Inc. | 41,184 | ||||||
| 1,700 | Comcast Corp., Class A | 76,636 | ||||||
| 3,300 | Discovery, Inc., Class C (a) | 81,246 | ||||||
| 900 | The Walt Disney Co. | 117,288 | ||||||
| 1,700 | Verizon Communications, Inc. | 102,612 | ||||||
| 418,966 | ||||||||
| Consumer Discretionary - 6.4% | ||||||||
| 1,100 | Aptiv PLC | 96,162 | ||||||
| 800 | Kontoor Brands, Inc. | 28,080 | ||||||
| 8,100 | TRI Pointe Group, Inc. (a) | 121,824 | ||||||
| 246,066 | ||||||||
| Consumer Staples - 5.1% | ||||||||
| 2,000 | Mondelez International, Inc., Class A | 110,640 | ||||||
| 600 | PepsiCo., Inc. | 82,260 | ||||||
| 192,900 | ||||||||
| Energy - 3.4% | ||||||||
| 3,800 | Devon Energy Corp. | 91,428 | ||||||
| 1,100 | Schlumberger, Ltd. | 37,587 | ||||||
| 129,015 | ||||||||
| Financials - 25.1% | ||||||||
| 3,300 | Air Lease Corp. | 138,006 | ||||||
| 1,300 | American Express Co. | 153,764 | ||||||
| 2,200 | American International Group, Inc. | 122,540 | ||||||
| 3,700 | Bank of America Corp. | 107,929 | ||||||
| 1,600 | BOK Financial Corp. | 126,640 | ||||||
| 3,490 | Brookfield Asset Management, Inc., | |||||||
| Class A | 185,259 | |||||||
| 400 | M&T Bank Corp. | 63,188 | ||||||
| 2,800 | Radian Group, Inc. | 63,952 | ||||||
| 961,278 | ||||||||
| Health Care - 13.6% | ||||||||
| 1,300 | AstraZeneca PLC, ADR | 57,941 | ||||||
| 500 | Becton Dickinson and Co. | 126,480 | ||||||
| 700 | Gilead Sciences, Inc. | 44,366 | ||||||
| 2,400 | Koninklijke Philips NV, ADR | 110,712 | ||||||
| 400 | Laboratory Corp. of America Holdings (a) | 67,200 | ||||||
| 800 | Medtronic PLC | 86,896 | ||||||
| 100 | Regeneron Pharmaceuticals, Inc. (a) | 27,740 | ||||||
| 521,335 | ||||||||
| Real Estate - 5.2% | ||||||||
| 4,000 | Brookfield Property Partners LP | 81,200 | ||||||
| 6,000 | VEREIT, Inc. REIT | 58,680 | ||||||
| 2,100 | Weyerhaeuser Co. REIT | 58,170 | ||||||
| 198,050 | ||||||||
| Technology - 12.9% | ||||||||
| 2,800 | Cisco Systems, Inc. | 138,348 | ||||||
| 3,500 | Corning, Inc. | 99,820 | ||||||
| 3,400 | HP, Inc. | 64,328 | ||||||
| 1,800 | Intel Corp. | 92,754 | ||||||
| 900 | NXP Semiconductors NV | 98,208 | ||||||
| 493,458 | ||||||||
| Shares | Security Description | Value | ||||||
| Transportation - 4.2% | ||||||||
| 4,400 | AP Moller - Maersk A/S, ADR | $ | 24,728 | |||||
| 5,300 | Seaspan Corp. | 56,339 | ||||||
| 500 | Union Pacific Corp. | 80,990 | ||||||
| 162,057 | ||||||||
| Total Common Stock (Cost $2,917,721) | 3,680,382 | |||||||
| Shares | Security Description | Value | ||||||
| Money Market Fund - 3.1% | ||||||||
| 119,394 | Morgan Stanley Institutional Liquidity Funds Government Portfolio, Institutional Class, 1.85% (b) | |||||||
| (Cost $119,394) | 119,394 | |||||||
| Investments, at value - 99.4% (Cost $3,037,115) | $ | 3,799,776 | ||||||
| Other Assets & Liabilities, Net - 0.6% | 24,607 | |||||||
| Net Assets - 100.0% | $ | 3,824,383 | ||||||
| ADR | American Depositary Receipt |
| LP | Limited Partnership |
| PLC | Public Limited Company |
| REIT | Real Estate Investment Trust |
| (a) | Non-income producing security. |
| (b) | Dividend yield changes daily to reflect current market conditions. Rate was the quoted yield as of September 30, 2019. |
The following is a summary of the inputs used to value the Fund's instruments as of September 30, 2019.
The inputs or methodology used for valuing securities are not necessarily an indication of the risks associated with investing in those securities. For more information on valuation inputs, and their aggregation into the levels used in the table below, please refer to the Security Valuation section in Note 2 of the accompanying Notes to Financial Statements.
| Valuation Inputs | Investments in Securities | |||
| Level 1 - Quoted Prices | $ | 3,680,382 | ||
| Level 2 - Other Significant Observable Inputs | 119,394 | |||
| Level 3 - Significant Unobservable Inputs | – | |||
| Total | $ | 3,799,776 | ||
The Level 1 value displayed in this table is Common Stock. The Level 2 value displayed in this table is a Money Market Fund. Refer to this Schedule of Investments for a further breakout of each security by industry.
| PORTFOLIO HOLDINGS (Unaudited) | ||||
| % of Total Investments | ||||
| Basic Materials | 4.6 | % | ||
| Capital Goods / Industrials | 4.8 | % | ||
| Communication Services | 11.0 | % | ||
| Consumer Discretionary | 6.5 | % | ||
| Consumer Staples | 5.1 | % | ||
| Energy | 3.4 | % | ||
| Financials | 25.3 | % | ||
| Health Care | 13.7 | % | ||
| Real Estate | 5.2 | % | ||
| Technology | 13.0 | % | ||
| Transportation | 4.3 | % | ||
| Money Market Fund | 3.1 | % | ||
| 100.0 | % | |||
See Notes to Financial Statements.
BAYWOOD SOCIALLYRESPONSIBLE FUND
STATEMENT OF ASSETS AND LIABILITIES
SEPTEMBER 30, 2019
| ASSETS | ||||
| Investments, at value (Cost $3,037,115) | $ | 3,799,776 | ||
| Cash | 575 | |||
| Receivables: | ||||
| Fund shares sold | 1,242 | |||
| Investment securities sold | 38,457 | |||
| Dividends | 7,076 | |||
| From investment advisor | 9,515 | |||
| Prepaid expenses | 6,409 | |||
| Total Assets | 3,863,050 | |||
| LIABILITIES | ||||
| Payables: | ||||
| Fund shares redeemed | 12,753 | |||
| Accrued Liabilities: | ||||
| Fund services fees | 5,044 | |||
| Other expenses | 20,870 | |||
| Total Liabilities | 38,667 | |||
| NET ASSETS | $ | 3,824,383 | ||
| COMPONENTS OF NET ASSETS | ||||
| Paid-in capital | $ | 3,070,047 | ||
| Distributable earnings | 754,336 | |||
| NET ASSETS | $ | 3,824,383 | ||
| SHARES OF BENEFICIAL INTEREST AT NO PAR VALUE (UNLIMITED SHARES AUTHORIZED) | ||||
| Institutional Shares | 341,013 | |||
| NET ASSET VALUE, OFFERING AND REDEMPTION PRICE PER SHARE | ||||
| Institutional Shares (based on net assets of $3,824,383) | $ | 11.21 | ||
See Notes to Financial Statements.
BAYWOOD SOCIALLYRESPONSIBLE FUND
STATEMENT OF OPERATIONS
YEAR ENDED SEPTEMBER 30, 2019
| INVESTMENT INCOME | ||||
| Dividend income (Net of foreign withholding taxes of $1,598) | $ | 92,552 | ||
| Total Investment Income | 92,552 | |||
| EXPENSES | ||||
| Investment advisor fees | 27,266 | |||
| Fund services fees | 68,582 | |||
| Transfer agent fees: | ||||
| Investor Shares | 15,150 | |||
| Institutional Shares | 18,977 | |||
| Distribution fees: | ||||
| Investor Shares | 5,107 | |||
| Custodian fees | 5,000 | |||
| Registration fees: | ||||
| Investor Shares | 18,265 | |||
| Institutional Shares | 15,131 | |||
| Professional fees | 23,187 | |||
| Trustees' fees and expenses | 2,656 | |||
| Other expenses | 21,814 | |||
| Total Expenses | 221,135 | |||
| Fees waived and expenses reimbursed | (181,188 | ) | ||
| Net Expenses | 39,947 | |||
| NET INVESTMENT INCOME | 52,605 | |||
| NET REALIZED AND UNREALIZED GAIN (LOSS) | ||||
| Net realized gain on investments | 102,477 | |||
| Net change in unrealized appreciation (depreciation) on investments | (260,772 | ) | ||
| NET REALIZED AND UNREALIZED LOSS | (158,295 | ) | ||
| DECREASE IN NET ASSETS RESULTING FROM OPERATIONS | $ | (105,690 | ) | |
See Notes to Financial Statements.
BAYWOOD SOCIALLYRESPONSIBLE FUND
STATEMENTS OF CHANGES IN NET ASSETS
| For the Years Ended September 30, | ||||||||
| 2019 | 2018 | |||||||
| OPERATIONS | ||||||||
| Net investment income | $ | 52,605 | $ | 68,010 | ||||
| Net realized gain | 102,477 | 890,310 | ||||||
| Net change in unrealized appreciation (depreciation) | (260,772 | ) | (186,732 | ) | ||||
| Increase (Decrease) in Net Assets Resulting from Operations | (105,690 | ) | 771,588 | |||||
| DISTRIBUTIONS TO SHAREHOLDERS | ||||||||
| Investor Shares | (204,892 | ) | (51,496 | )* | ||||
| Institutional Shares | (149,124 | ) | (120,653 | )** | ||||
| Total Distributions Paid | (354,016 | ) | (172,149 | ) | ||||
| CAPITAL SHARE TRANSACTIONS | ||||||||
| Sale of shares: | ||||||||
| Investor Shares | 167,328 | 48,352 | ||||||
| Institutional Shares | 2,373,806 | 190,483 | ||||||
| Reinvestment of distributions: | ||||||||
| Investor Shares | 193,403 | 48,772 | ||||||
| Institutional Shares | 146,187 | 120,102 | ||||||
| Redemption of shares: | ||||||||
| Investor Shares | (2,701,698 | ) | (542,020 | ) | ||||
| Institutional Shares | (295,860 | ) | (4,342,445 | ) | ||||
| Decrease in Net Assets from Capital Share Transactions | (116,834 | ) | (4,476,756 | ) | ||||
| Decrease in Net Assets | (576,540 | ) | (3,877,317 | ) | ||||
| NET ASSETS | ||||||||
| Beginning of Year | 4,400,923 | 8,278,240 | ||||||
| End of Year | $ | 3,824,383 | $ | 4,400,923 | *** | |||
| SHARE TRANSACTIONS | ||||||||
| Sale of shares: | ||||||||
| Investor Shares | 14,949 | 3,910 | ||||||
| Institutional Shares | 218,445 | 15,647 | ||||||
| Reinvestment of distributions: | ||||||||
| Investor Shares | 19,029 | 4,058 | ||||||
| Institutional Shares | 14,302 | 10,021 | ||||||
| Redemption of shares: | ||||||||
| Investor Shares | (248,092 | ) | (44,965 | ) | ||||
| Institutional Shares | (26,646 | ) | (363,462 | ) | ||||
| Decrease in Shares | (8,013 | ) | (374,791 | ) | ||||
| * | Distribution was the result of net investment income and net realized gain of $14,499 and $36,997, respectively, at September 30, 2018. |
| ** | Distribution was the result of net investment income and net realized gain of $45,236 and $75,417, respectively, at September 30, 2018. |
| *** | Includes undistributed net investment income of $1,735 at September 30, 2018. The requirement to disclose the corresponding amount as of September 30, 2019 was eliminated. |
See Notes to Financial Statements.
BAYWOOD SOCIALLYRESPONSIBLE FUND
FINANCIAL HIGHLIGHTS
These financial highlights reflect selected data for a share outstanding throughout each year.
| For the Years Ended September 30, | ||||||||||||||||||||
| 2019 | 2018 | 2017 | 2016 | 2015 | ||||||||||||||||
| INSTITUTIONAL SHARES | ||||||||||||||||||||
| NET ASSET VALUE, Beginning of Year | $ | 12.60 | $ | 11.43 | $ | 10.15 | $ | 10.18 | $ | 11.45 | ||||||||||
| INVESTMENT OPERATIONS | ||||||||||||||||||||
| Net investment income (a) | 0.18 | 0.12 | 0.10 | 0.14 | 0.14 | |||||||||||||||
| Net realized and unrealized gain (loss) | (0.53 | ) | 1.31 | 1.33 | 0.66 | (0.99 | ) | |||||||||||||
| Total from Investment Operations | (0.35 | ) | 1.43 | 1.43 | 0.80 | (0.85 | ) | |||||||||||||
| DISTRIBUTIONS TO SHAREHOLDERS FROM | ||||||||||||||||||||
| Net investment income | (0.16 | ) | (0.10 | ) | (0.15 | ) | (0.30 | ) | (0.13 | ) | ||||||||||
| Net realized gain | (0.88 | ) | (0.16 | ) | – | (0.53 | ) | (0.29 | ) | |||||||||||
| Total Distributions to Shareholders | (1.04 | ) | (0.26 | ) | (0.15 | ) | (0.83 | ) | (0.42 | ) | ||||||||||
| NET ASSET VALUE, End of Year | $ | 11.21 | $ | 12.60 | $ | 11.43 | $ | 10.15 | $ | 10.18 | ||||||||||
| TOTAL RETURN | (1.79 | )% | 12.66 | % | 14.18 | % | 8.40 | % | (7.70 | )% | ||||||||||
| RATIOS/SUPPLEMENTARY DATA | ||||||||||||||||||||
| Net Assets at End of Year (000s omitted) | $ | 3,824 | $ | 1,699 | $ | 5,404 | $ | 5,555 | $ | 238,379 | ||||||||||
| Ratios to Average Net Assets: | ||||||||||||||||||||
| Net investment income | 1.60 | % | 1.01 | % | 0.92 | % | 1.35 | % | 1.22 | % | ||||||||||
| Net expenses | 0.89 | % | 0.89 | % | 0.89 | % | 0.89 | % | 0.89 | %(b) | ||||||||||
| Gross expenses(c) | 5.78 | % | 3.03 | % | 2.64 | % | 1.00 | % | 0.87 | % | ||||||||||
| PORTFOLIO TURNOVER RATE | 33 | % | 31 | % | 42 | % | 57 | % | 29 | % | ||||||||||
| (a) | Calculated based on average shares outstanding during each year. |
| (b) | Ratio includes waivers and previously waived investment advisory fees recovered. The impact of the recovered fees may cause a higher net expense ratio. |
| (c) | Reflects the expense ratio excluding any waivers and/or reimbursements. |
See Notes to Financial Statements.
BAYWOOD FUNDS
NOTES TO FINANCIAL STATEMENTS
SEPTEMBER 30, 2019
Note 1. Organization
Baywood ValuePlus Fund and Baywood SociallyResponsible Fund (individually, a “Fund” and collectively, the “Funds”) are diversified portfolios of Forum Funds II (the “Trust”). The Trust is a Delaware statutory trust that is registered as an open-end, management investment company under the Investment Company Act of 1940, as amended (the “Act”). Under its Trust Instrument, the Trust is authorized to issue an unlimited number of each Fund’s shares of beneficial interest without par value. The Baywood ValuePlus Fund commenced operations on December 2, 2013, through a reorganization of a collective investment trust into the Baywood ValuePlus Fund. The collective investment trust was previously managed by the Baywood ValuePlus Fund’s Advisor and portfolio management team. This collective investment trust was organized and commenced operations on June 27, 2008. The Baywood ValuePlus Fund currently offers Institutional Shares. The Baywood ValuePlus Fund seeks to achieve long-term capital appreciation by investing in undervalued equity securities. The Baywood SociallyResponsible Fund commenced operations on January 3, 2005. The Baywood SociallyResponsible Fund currently offers Institutional Shares. The Baywood SociallyResponsible Fund seeks to provide long-term capital growth.
On December 7, 2015, at a special meeting of shareholders of Baywood SociallyResponsible Fund, formerly City National Rochdale Socially Responsible Equity Fund, a series of City National Rochdale Funds (the "Predecessor Fund"), the shareholders approved a proposal to reorganize the Predecessor Fund into the Baywood SociallyResponsible Fund, a newly created series of the Forum Funds II. The Predecessor Fund was sub-advised by the Fund's Advisor, SKBA Capital Management, LLC, with the same portfolio managers as the Baywood SociallyResponsible Fund. The Baywood SociallyResponsible Fund is managed in a manner that is in all material respects equivalent to the management of the Predecessor Fund, including the investment objective, strategies, guidelines and restrictions. The primary purpose of the reorganization was to move the Predecessor Fund to a newly created series of Forum Funds II. As a result of the reorganization, the Baywood SociallyResponsible Fund is now operating under the supervision of the Trust’s board of trustees. On January 8, 2016, the Baywood SociallyResponsible Fund acquired all of the assets, subject to liabilities, of the Predecessor Fund. The shares of the Predecessor Fund were, in effect, exchanged on a tax-free basis for Shares of the Baywood SociallyResponsible Fund with the same aggregate value. No commission or other transactional fees were imposed on shareholders in connection with the tax-free exchange of their shares.
On June 14, 2019, the Trust’s Board of Trustees approved the conversion of the outstanding shares of the Funds’ Investor Shares, in a tax-free exchange into shares of the Funds’ Institutional Shares and the closure of the Investor Shares to new investments. On August 19, 2019, each shareholder of the Funds’ Investor Shares received Institutional Shares in a dollar amount equal to their investment in the Investor Shares as of that date.
Note 2. Summary of Significant Accounting Policies
The Funds are investment companies and follow accounting and reporting guidance under Financial Accounting Standards Board (“FASB”) Accounting Standards Codification (“ASC”) Topic 946, “Financial Services – Investment Companies.” These financial statements are prepared in accordance with accounting principles generally accepted in the United States of America (“GAAP”), which require management to make estimates and assumptions that affect the reported amounts of assets and liabilities, the disclosure of contingent liabilities at the date of the financial statements, and the reported amounts of increases and decreases in net assets from operations during the fiscal year. Actual amounts could differ from those estimates. The following summarizes the significant accounting policies of each Fund:
Security Valuation – Securities are valued at market prices using the last quoted trade or official closing price from the principal exchange where the security is traded, as provided by independent pricing services on each Fund business day. In the absence of a last trade, securities are valued at the mean of the last bid and ask price provided by the pricing service. Shares of non-exchange traded open-end mutual funds are valued at net asset value (“NAV”). Short-term investments that mature in sixty days or less may be valued at amortized cost.
Each Fund values its investments at fair value pursuant to procedures adopted by the Trust’s Board of Trustees (the “Board”) if (1) market quotations are not readily available or (2) the Advisor, as defined in Note 3, believes that the values available are unreliable. The Trust’s Valuation Committee, as defined in each Fund’s registration statement, performs certain functions as they relate to the administration and oversight of each Fund’s valuation procedures. Under these procedures, the Valuation Committee convenes on a regular and ad hoc basis to review such investments and considers a number of factors, including valuation methodologies and significant unobservable inputs, when arriving at fair value.
BAYWOOD FUNDS
NOTES TO FINANCIAL STATEMENTS
SEPTEMBER 30, 2019
The Valuation Committee may work with the Advisor to provide valuation inputs. In determining fair valuations, inputs may include market-based analytics that may consider related or comparable assets or liabilities, recent transactions, market multiples, book values and other relevant investment information. Advisor inputs may include an income-based approach in which the anticipated future cash flows of the investment are discounted in determining fair value. Discounts may also be applied based on the nature or duration of any restrictions on the disposition of the investments. The Valuation Committee performs regular reviews of valuation methodologies, key inputs and assumptions, disposition analysis and market activity.
Fair valuation is based on subjective factors and, as a result, the fair value price of an investment may differ from the security’s market price and may not be the price at which the asset may be sold. Fair valuation could result in a different NAV than a NAV determined by using market quotes.
GAAP has a three-tier fair value hierarchy. The basis of the tiers is dependent upon the various “inputs” used to determine the value of each Fund’s investments. These inputs are summarized in the three broad levels listed below:
Level 1 - Quoted prices in active markets for identical assets and liabilities.
Level 2 - Prices determined using significant other observable inputs (including quoted prices for similar securities, interest rates, prepayment speeds, credit risk, etc.). Short-term securities with maturities of sixty days or less are valued at amortized cost, which approximates market value, and are categorized as Level 2 in the hierarchy. Municipal securities, long-term U.S. government obligations and corporate debt securities are valued in accordance with the evaluated price supplied by a pricing service and generally categorized as Level 2 in the hierarchy. Other securities that are categorized as Level 2 in the hierarchy include, but are not limited to, warrants that do not trade on an exchange, securities valued at the mean between the last reported bid and ask quotation and international equity securities valued by an independent third party with adjustments for changes in value between the time of the securities’ respective local market closes and the close of the U.S. market.
Level 3 - Significant unobservable inputs (including each Fund’s own assumptions in determining the fair value of investments).
The aggregate value by input level, as of September 30, 2019, for each Fund’s investments is included at the end of each Fund’s Schedule of Investments.
Security Transactions, Investment Income and Realized Gain and Loss – Investment transactions are accounted for on the trade date. Dividend income is recorded on the ex-dividend date. Foreign dividend income is recorded on the ex-dividend date or as soon as possible after determining the existence of a dividend declaration after exercising reasonable due diligence. Interest income is recorded on an accrual basis. Premium is amortized and discount is accreted using the effective interest method. Identified cost of investments sold is used to determine the gain and loss for both financial statement and federal income tax purposes.
Distributions to Shareholders – Distributions to shareholders of net investment income, if any, are declared and paid at least annually. Distributions to shareholders of net capital gains, if any, are declared and paid at least at least annually. Distributions to shareholders are recorded on the ex-dividend date. Distributions are based on amounts calculated in accordance with applicable federal income tax regulations, which may differ from GAAP. These differences are due primarily to differing treatments of income and gain on various investment securities held by each Fund, timing differences and differing characterizations of distributions made by each Fund.
Federal Taxes – Each Fund intends to continue to qualify each year as a regulated investment company under Subchapter M of Chapter 1, Subtitle A, of the Internal Revenue Code of 1986, as amended (“Code”), and to distribute all of its taxable income to shareholders. In addition, by distributing in each calendar year substantially all of its net investment income and capital gains, if any, the Funds will not be subject to a federal excise tax. Therefore, no federal income or excise tax provision is required. Each Fund files a U.S. federal income and excise tax return as required. Each Fund’s federal income tax returns are subject to examination by the Internal Revenue Service for a period of three fiscal years after they are filed. As of September 30, 2019, there are no uncertain tax positions that would require financial statement recognition, de-recognition or disclosure.
Income and Expense Allocation – The Trust accounts separately for the assets, liabilities and operations of each of its investment portfolios. Expenses that are directly attributable to more than one investment portfolio are allocated among the respective investment portfolios in an equitable manner.
BAYWOOD FUNDS
NOTES TO FINANCIAL STATEMENTS
SEPTEMBER 30, 2019
Each Fund's class-specific expenses are charged to the operations of that class of shares. Income and expenses (other than expenses attributable to a specific class) and realized and unrealized gains or losses on investments are allocated to each class of shares based on the class’ respective net assets to the total net assets of each Fund.
Commitments and Contingencies – In the normal course of business, each Fund enters into contracts that provide general indemnifications by each Fund to the counterparty to the contract. Each Fund’s maximum exposure under these arrangements is dependent on future claims that may be made against each Fund and, therefore, cannot be estimated; however, based on experience, the risk of loss from such claims is considered remote. Each Fund has determined that none of these arrangements requires disclosure on each Fund’s balance sheet.
Note 3. Fees and Expenses
Investment Advisor – SKBA Capital Management, LLC (the “Advisor”) is the investment adviser to the Funds. Pursuant to an investment advisory agreement, the Advisor receives an advisory fee, payable monthly, at an annual rate of 0.50% and 0.70% of the average daily net assets of Baywood ValuePlus Fund and Baywood SociallyResponsible Fund, respectively.
Distribution – Foreside Fund Services, LLC serves as each Fund’s distributor (the “Distributor”). The Funds have adopted a Distribution Plan (the “Plan”) in accordance with Rule 12b-1 of the Act. Under the Plan, each Fund may pay the Distributor and/or any other entity as authorized by the Board a fee of up to 0.25% of each Fund’s average daily net assets of Investor Shares for providing distribution and/ or shareholder services to the Funds. The Distributor is not affiliated with the Advisor or Atlantic Fund Administration, LLC, a wholly owned subsidiary of Apex US Holdings, LLC (d/b/a Apex Fund Services) (“Apex”) or their affiliates.
Other Service Providers – Apex provides fund accounting, fund administration, compliance and transfer agency services to each Fund. The fees related to these services are included in Fund services fees within the Statements of Operations. Apex also provides certain shareholder report production and EDGAR conversion and filing services. Pursuant to an Apex services agreement, each Fund pays Apex customary fees for its services. Apex provides a Principal Executive Officer, a Principal Financial Officer, a Chief Compliance Officer and an Anti-Money Laundering Officer to each Fund, as well as certain additional compliance support functions.
Trustees and Officers – The Trust pays each Independent Trustee an annual fee of $16,000 ($21,000 for the Chairman) for service to the Trust. The Independent Trustees and Chairman may receive additional fees for special Board meetings. The Independent Trustees are also reimbursed for all reasonable out-of-pocket expenses incurred in connection with their duties as Trustees, including travel and related expenses incurred in attending Board meetings. The amount of Independent Trustees’ fees attributable to each Fund is disclosed in the Statements of Operations. Certain officers of the Trust are also officers or employees of the above named service providers, and during their terms of office received no compensation from each Fund.
Note 4. Expense Reimbursement and Fees Waived
The Advisor has contractually agreed to waive its fee and/or reimburse certain expenses to limit total operating expenses (excluding all taxes, interest, portfolio transaction expenses, acquired fund fees and expenses, proxy expenses and extraordinary expenses) for Institutional Shares to 0.70% through January 31, 2020, for Baywood ValuePlus Fund. The Advisor also has contractually agreed to waive its fees and/or reimburse certain expenses to limit total operating expenses (excluding all taxes, interest, portfolio transaction expenses, acquired fund fees and expenses, proxy expenses and extraordinary expenses) for Institutional Shares to 0.89% through January 31, 2020, for Baywood SociallyResponsible Fund. Other Fund service providers have voluntarily agreed to waive and reimburse a portion of their fees. These voluntary fee waivers and reimbursements may be reduced or eliminated at any time. For the year ended September 30, 2019, fees waived and expenses reimbursed were as follows:
| Investment Adviser Fees Waived | Investment Adviser Expenses Reimbursed | Other Waivers | Total Fees Waived and Expenses Reimbursed | |||||||||||||
| Baywood ValuePlus Fund | $ | 13,469 | $ | 122,400 | $ | 42,395 | $ | 178,264 | ||||||||
| Baywood SociallyResponsible Fund | 27,266 | 111,527 | 42,395 | 181,188 | ||||||||||||
The Advisor may be reimbursed by each Fund for fees waived and expenses reimbursed by the Advisor pursuant to the Expense Cap if such payment is approved by the Board, made within three years of the fee waiver or expense reimbursement, and does not cause the Total Annual Fund Operating Expenses After Fee Waiver and/or Expense Reimbursement to exceed the lesser of (i) the then-current expense cap, or (ii) the expense cap in place at the time the fees/expenses were waived/reimbursed. As of September 30, 2019, $401,989
BAYWOOD FUNDS
NOTES TO FINANCIAL STATEMENTS
SEPTEMBER 30, 2019
and $411,576 in the Baywood ValuePlus Fund and Baywood SociallyResponsible Fund, respectively, is subject to recapture by the Advisor. Other Waivers are not eligible for recoupment.
Note 5. Security Transactions
The cost of purchases and proceeds from sales of investment securities (including maturities), other than short-term investments during the year ended September 30, 2019, were as follows:
| Purchases | Sales | |||||||
| Baywood ValuePlus Fund | $ | 1,351,805 | $ | 1,280,570 | ||||
| Baywood SociallyResponsible Fund | 1,236,507 | 1,589,185 | ||||||
Note 6. Federal Income Tax
As of September 30, 2019, the cost for federal income tax purposes and the components of net unrealized appreciation were as follows:
| Tax Cost of Investments | Gross Unrealized Appreciation | Gross Unrealized Depreciation | Net Unrealized Appreciation | |||||||||||||
| Baywood ValuePlus Fund | $ | 2,439,654 | $ | 414,864 | $ | (51,160 | ) | $ | 363,704 | |||||||
| Baywood SociallyResponsible Fund | 3,098,608 | 735,300 | (34,132 | ) | 701,168 | |||||||||||
Distributions paid during the fiscal years ended as noted were characterized for tax purposes as follows:
| Ordinary Income | Long-Term Capital Gain | Total | ||||||||||
| Baywood ValuePlus Fund | ||||||||||||
| 2019 | $ | 60,075 | $ | 125,061 | $ | 185,136 | ||||||
| 2018 | 48,282 | 73,879 | 122,161 | |||||||||
| Baywood SociallyResponsible Fund | ||||||||||||
| 2019 | 50,594 | 303,422 | 354,016 | |||||||||
| 2018 | 58,464 | 391,883 | 450,347 | |||||||||
There are amounts included in the above relating to equalization debits.
| Ordinary Income | Long-Term Capital Gain | Total | ||||||||||
| Baywood SociallyResponsible Fund | ||||||||||||
| 2018 | $ | - | $ | 278,198 | $ | 278,198 | ||||||
As of September 30, 2019, distributable earnings (accumulated loss) on a tax basis were as follows:
Undistributed Ordinary Income | Undistributed Long-Term Gain | Unrealized Appreciation | Total | |||||||||||||
| Baywood ValuePlus Fund | $ | 1,141 | $ | 25,916 | $ | 363,704 | $ | 390,761 | ||||||||
| Baywood SociallyResponsible Fund | 1,807 | 51,361 | 701,168 | 754,336 | ||||||||||||
The difference between components of distributable earnings on a tax basis and the amounts reflected in the Statements of Assets and Liabilities are primarily due to wash sales, partnerships and equity return of capital.
Note 7. Recent Accounting Pronouncements
In August 2018, the Financial Accounting Standards Board (“FASB”) issued Accounting Standards Update No. 2018-13 “Fair Value Measurement (Topic 820): Disclosure Framework – Changes to the Disclosure Requirements for Fair Value Measurement” (“ASU 2018-13”) which includes amendments intended to improve the effectiveness of disclosures in the notes to financial statements. For example, ASU 2018-13 includes additional disclosures regarding the range and weighted average of significant unobservable inputs used to develop Level 3 fair value measurements, and clarifications to the narrative description of measurement uncertainty disclosures. ASU 2018-13 is effective for interim and annual periods beginning after December 15, 2019. Early adoption is permitted and the Funds have adopted ASU 2018-13 within these financial statements.
In September 2018, the Securities and Exchange Commission released Final Rule 33-10532 captioned “Disclosure Update and Simplification,” which includes: (i) an amendment to require presentation of the total, rather than the components, of distributable earnings on the Statements of Assets and Liabilities; and (ii) an amendment to require presentation of the total, rather than the components, of distributions to shareholders, except for tax return of capital distributions, on the Statements of Changes in Net Assets. The amendments
BAYWOOD FUNDS
NOTES TO FINANCIAL STATEMENTS
SEPTEMBER 30, 2019
also removed the requirement for parenthetical disclosure of undistributed net investment income on the Statements of Changes in Net Assets. These changes were effective November 5, 2018. These amendments are reflected in the Funds' financial statements for the year ended September 30, 2019.
Note 8. Subsequent Events
Subsequent events occurring after the date of this report through the date these financial statements were issued have been evaluated for potential impact, and each Fund has had no such events.
REPORT OF INDEPENDENT REGISTERED PUBLIC ACCOUNTING FIRM
To the Shareholders of Baywood ValuePlus Fund and Baywood SociallyResponsible Fund
and the Board of Trustees of Forum Funds II
Opinion on the Financial Statements
We have audited the accompanying statements of assets and liabilities of Baywood ValuePlus Fund and Baywood SociallyResponsible Fund, each a series of shares of beneficial interest in Forum Funds II (the “Funds”), including the schedules of investments, as of September 30, 2019, and the related statements of operations for the year then ended, the statements of changes in net assets for each of the years in the two-year period then ended and the financial highlights for each of the years and periods presented in the table below, and the related notes (collectively referred to as the “financial statements”). In our opinion, the financial statements present fairly, in all material respects, the financial position of the Funds as of September 30, 2019, and the results of their operations for the year then ended, the changes in their net assets for each of the years in the two-year period then ended and their financial highlights for each of the years and periods presented in the table below, in conformity with accounting principles generally accepted in the United States of America.
| Fund | Financial Highlights |
| Baywood ValuePlus Fund | Financial highlights for the period December 2, 2013 (commencement of operations) through November 30, 2014, for the year ended November 30, 2015, for the period December 1, 2015 through September 30, 2016, and for each of the years in the three-year period ended September 30, 2019. |
| Baywood SociallyResponsible Fund | Financial highlights for each of the years in the five-year period then ended. |
Basis for Opinion
These financial statements are the responsibility of the Funds' management. Our responsibility is to express an opinion on the Funds’ financial statements based on our audits. We are a public accounting firm registered with the Public Company Accounting Oversight Board (United States) (“PCAOB”) and are required to be independent with respect to the Funds in accordance with the U.S. federal securities law and the applicable rules and regulations of the Securities and Exchange Commission and the PCAOB.
We conducted our audits in accordance with the standards of the PCAOB. Those standards require that we plan and perform the audits to obtain reasonable assurance about whether the financial statements are free of material misstatement, whether due to error or fraud. The Funds are not required to have, nor were we engaged to perform, an audit of their internal control over financial reporting. As part of our audits we are required to obtain an understanding of internal control over financial reporting but not for the purpose of expressing an opinion on the effectiveness of the Funds’ internal control over financial reporting. Accordingly, we express no such opinion.
Our audits included performing procedures to assess the risk of material misstatement of the financial statements, whether due to error or fraud, and performing procedures that respond to those risks. Such procedures included examining, on a test basis, evidence regarding the amounts and disclosures in the financial statements. Our procedures included confirmation of securities owned as of September 30, 2019 by correspondence with the custodian. Our audits also included evaluating the accounting principles used and significant estimates made by management, as well as evaluating the overall presentation of the financial statements. We believe that our audits provide a reasonable basis for our opinion.

BBD, LLP
We have served as the auditor of one or more of the Funds in the Forum Funds II since 2013.
Philadelphia, Pennsylvania
November 26, 2019
BAYWOOD FUNDS
ADDITIONAL INFORMATION (Unaudited)
SEPTEMBER 30, 2019
Investment Advisory Agreement Approval
At the September 12, 2019 Board meeting (“September meeting”), the Board, including the Independent Trustees, met in person and considered the approval of the continuance of the investment advisory agreement between the Advisor and the Trust pertaining to the Funds (the “Advisory Agreement”). In preparation for the September meeting, the Board was presented with a range of information to assist in its deliberations. The Board requested and reviewed written responses from the Adviser to a letter circulated on the Board's behalf concerning the Adviser’s personnel, operations, financial condition, performance, and services provided to the Funds by the Adviser. During its deliberations, the Board received an oral presentation from the Adviser and discussed the materials with the Adviser, independent legal counsel to the Independent Trustees (“Independent Legal Counsel”), and, as necessary, with the Trust's administrator. The Independent Trustees also met in executive session with Independent Legal Counsel while deliberating.
At the September meeting, the Board reviewed, among other matters, the topics discussed below:
Nature, Extent and Quality of Services
Based on written materials received and the presentation from senior representatives of the Adviser regarding the Adviser’s personnel, operations, and financial condition, the Board considered the quality of services provided by the Adviser under the Advisory Agreement. In this regard, the Board considered information regarding the experience, qualifications and professional background of the portfolio managers and other personnel at the Adviser with principal responsibility for the Funds, as well as the investment philosophy and decision-making process of those professionals and the capability and integrity of the Adviser’s senior management and staff.
The Board considered also the adequacy of the Adviser’s resources. The Board noted the Adviser’s representation that the firm is financially stable and has the operational capability and necessary staffing and experience to continue providing quality investment advisory services to the Funds. Based on the presentation and the materials provided by the Adviser in connection with the Board’s consideration of the renewal of the Advisory Agreement, and other relevant considerations, the Board concluded that, overall, it was satisfied with the nature, extent and quality of services to be provided to the Funds under the Advisory Agreement.
Performance
In connection with a presentation by the Adviser regarding its approach to managing the Funds, the Board reviewed the historical performance of the Funds, including the performance of each Fund compared to its respective primary benchmark index and compared to independent peer groups of funds identified by Broadridge Financial Solutions, Inc. (“Broadridge”) believed to have characteristics similar to those of the Funds.
The Board observed that the ValuePlus Fund underperformed its primary benchmark index, the Morningstar US Large Value Total Return Index, for the one-, three-, five-, and 10-year periods ended June 30, 2019, and for the period since the ValuePlus Fund’s inception on June 27, 2008. The Board also observed that, based on the information provided by Broadridge, the ValuePlus Fund underperformed the median of its Broadridge peers for the one-year period ended June 30, 2019, outperformed the median of its Broadridge peers for the three-year period ended June 30, 2019, and performed at the median of the Broadridge peers over the five-year period ended June 30, 2019. The Board noted the Adviser’s representation that the ValuePlus Fund’s relative underperformance could be attributed, in part, to the Fund’s overweight exposure to the energy sector and underweight exposure to the utilities sector, the benchmark’s worst-performing and best-performing sectors during the period, respectively. The Board also noted the Adviser’s representation that the ValuePlus Fund’s underperformance over longer periods was largely a result of a distortion in performance due to a significant shareholder redemption in 2015.
The Board observed that the SociallyResponsible Fund had underperformed its primary benchmark index, the Morningstar US Large Value Total Return Index, for the one-, three-, five-, and 10-year periods ended June 30, 2019, as well as the period since the SociallyResponsible Fund’s inception on January 3, 2005. The Board observed that the SociallyResponsible Fund outperformed the median of its Broadridge peers for the one- and three-year periods ended June 30, 2019 and underperformed the median of the Broadridge peers for the five-year period ended June 30, 2019. The Board noted the Adviser’s representation that the SociallyResponsible Fund’s underperformance relative to the primary benchmark index and Broadridge peers over the short term was due, at least in part, to the Fund’s individual stock selection in, and overweight exposure to, the financials sector. The Board also noted the Adviser’s representation that the SociallyResponsible Fund’s underperformance over the longer term could be attributed, at least in part, to a significant shareholder redemption that occurred prior to the SociallyResponsible Fund’s reorganization into the Trust at the beginning of 2016, which disproportionately impacted the SociallyResponsible Fund’s long-term performance. The Board further noted the Adviser’s
BAYWOOD FUNDS
ADDITIONAL INFORMATION (Unaudited)
SEPTEMBER 30, 2019
representation that the Morningstar US Large Value Total Return Index was not a perfect comparison for the SociallyResponsible Fund’s investment strategy because the benchmark did not have the same constraints of a socially responsible strategy.
Based on the foregoing and other applicable considerations, the Board determined that each Fund’s performance was reasonable and that each Fund and their respective shareholders could benefit from the Adviser’s continued management of the Funds.
Compensation
The Board evaluated the Adviser’s compensation for providing advisory services to the Funds and analyzed comparative information on actual advisory fee rates and actual total expense ratios of the Funds’ as compared to those of their respective Broadridge peer groups. The Board observed that the Adviser’s actual advisory fee rate and actual total expense ratio for each of the Funds was less than the median of their respective Broadridge peer groups. Based on the foregoing, and other relevant considerations, the Board concluded that the Adviser’s advisory fee rates charged to the Funds were fair and reasonable.
Cost of Services and Profitability
The Board evaluated information provided by the Adviser regarding the costs of services and its profitability with respect to the Funds. In this regard, the Board considered the Adviser’s resources devoted to the Funds, as well as the information provided by the Adviser regarding the costs and profitability of its Fund activities. The Board noted the Adviser’s representation that, as a result of the contractual expense limitation arrangement in place for each of the Funds, the Adviser was not earning any profit from its mutual fund operations but that the Adviser was willing to continue subsidizing the Funds in an effort to support growth initiatives. Based on these and other applicable considerations, including financial statements from the Adviser indicating its profitability and expenses from overall operations, the Board concluded that the Adviser’s costs of services and profits attributable to management of the Funds were reasonable in the context of all factors considered.
Economies of Scale
The Board evaluated whether the Funds would benefit from any economies of scale. In this respect, the Board considered the Funds’ fee structures, asset sizes, and net expense ratios. The Board noted the Adviser’s representation that economies of scale could be experienced by shareholders of the Funds upon reaching significantly higher asset levels but that, in light of the Funds’ current asset levels, breakpoints in the advisory fee were not believed by the Adviser to be appropriate at this time. Based on the foregoing information and other applicable considerations, the Board concluded that the asset levels of the Funds were not indicative of economies of scale such that economies of scale were not a material factor in approving the Advisory Agreement.
Other Benefits
The Board noted the Adviser’s representation that, aside from its contractual advisory fees, it does not benefit in a material way from its relationship with the Funds. Based on the foregoing representation and the materials presented, the Board concluded that other benefits received by the Adviser from its relationship with the Funds were not a material factor to consider in approving the continuation of the Advisory Agreement.
Conclusion
The Board did not identify any single factor as being of paramount importance, and different Trustees may have given different weight to different factors. The Board reviewed a memorandum from Fund counsel discussing the legal standards applicable to its consideration of the Advisory Agreement. Based on its review, including consideration of each of the factors referenced above, the Board determined, in the exercise of its reasonable business judgment, that the advisory arrangement, as outlined in the Advisory Agreement, was fair and reasonable in light of the services performed or to be performed, expenses incurred or to be incurred and such other matters as the Board considered relevant.
Proxy Voting Information
A description of the policies and procedures that each Fund uses to determine how to vote proxies relating to securities held in each Fund’s portfolio is available, without charge and upon request, by calling (855) 409-2297 and on the SEC’s website at www.sec.gov.
BAYWOOD FUNDS
ADDITIONAL INFORMATION (Unaudited)
SEPTEMBER 30, 2019
Each Fund’s proxy voting record for the most recent twelve-month period ended June 30 is available, without charge and upon request, by calling (855) 409-2297 and on the SEC’s website at www.sec.gov.
Availability of Quarterly Portfolio Schedules
Each Fund files its complete schedule of portfolio holdings with the SEC for the first and third quarters of each fiscal year on Form N-Q. These filings are available, without charge and upon request on the SEC’s website at www.sec.gov or may be reviewed and copied at the SEC’s Public Reference Room in Washington, D.C. Information on the operation of the Public Reference Room may be obtained by calling (800) SEC-0330.
Shareholder Expense Example
As a shareholder of the funds, you incur ongoing costs, including management fees, and other Fund expenses. This example is intended to help you understand your ongoing costs (in dollars) of investing in the funds and to compare these costs with the ongoing costs of investing in other mutual funds.
The example is based on an investment of $1,000 invested at the beginning of the period and held for the entire period from April 1, 2019 through September 30, 2019.
Actual Expenses – The first line of the table below provides information about actual account values and actual expenses. You may use the information in this line, together with the amount you invested, to estimate the expenses that you paid over the period. Simply divide your account value by $1,000 (for example, an $8,600 account value divided by $1,000 = 8.6), then multiply the result by the number in the first line under the heading entitled “Expenses Paid During Period” to estimate the expenses you paid on your account during the period.
Hypothetical Example for Comparison Purposes – The second line of the table below provides information about hypothetical account values and hypothetical expenses based on each Fund’s actual expense ratio and an assumed rate of return of 5% per year before expenses, which is not each Fund’s actual return. The hypothetical account values and expenses may not be used to estimate the actual ending account balance or expenses you paid for the period. You may use this information to compare the ongoing costs of investing in each Fund and other funds. To do so, compare this 5% hypothetical example with the 5% hypothetical examples that appear in the shareholder reports of other funds.
Please note that the expenses shown in the table are meant to highlight your ongoing costs only. Therefore, the second line of the table is useful in comparing ongoing costs only and will not help you determine the relative total costs of owning different funds.
| Beginning Account Value April 1, 2019 | Ending Account Value September 30, 2019 | Expenses Paid During Period* | Annualized Expense Ratio* | |
| Baywood ValuePlus Fund | ||||
| Actual | $1,000.00 | $1,039.41 | $3.58 | 0.70% |
| Hypothetical (5% return before expenses) | $1,000.00 | $1,021.56 | $3.55 | 0.70% |
| Baywood SociallyResponsible Fund | ||||
| Actual | $1,000.00 | $1,047.85 | $4.57 | 0.89% |
| Hypothetical (5% return before expenses) | $1,000.00 | $1,020.61 | $4.51 | 0.89% |
| * | Expenses are equal to the Fund’s annualized expense ratio multiplied by the average account value over the period, multiplied by the number of days in the most recent fiscal half-year (183) divided by 365 to reflect the half-year period. |
Federal Tax Status of Dividends Declared during the Fiscal Year
For federal income tax purposes, dividends from short-term capital gains are classified as ordinary income. Each Fund designates 100.00% of its income dividend distributed as qualifying for the corporate dividends-received deduction (DRD) and 100.00% for the qualified dividend rate (QDI) as defined in Section 1(h)(11) of the Internal Revenue Code.
BAYWOOD FUNDS
ADDITIONAL INFORMATION (Unaudited)
SEPTEMBER 30, 2019
Trustees and Officers of the Trust
The Board is responsible for oversight of the management of the Trust’s business affairs and of the exercise of all the Trust’s powers except those reserved for the shareholders. The following table provides information about each Trustee and certain officers of the Trust. Each Trustee and officer holds office until the person resigns, is removed, or is replaced. Unless otherwise noted, the persons have held their principal occupations for more than five years. The address for all Trustees and officers is Three Canal Plaza, Suite 600, Portland, Maine 04101. Each Fund’s Statement of Additional Information includes additional information about the Trustees and is available, without charge and upon request, by calling (855) 409-2297.
| Name and Year of Birth | Position with the Trust | Length of Time Served | Principal Occupation(s) During Past Five Years | Number of Series in Fund Complex Overseen By Trustee | Other Directorships Held By Trustee During Past Five Years |
| Independent Trustees | |||||
David Tucker Born: 1958 | Chairman of the Board; Trustee; Chairman, Nominating Committee and Qualified Legal Compliance Committee | Since 2013 | Director, Blue Sky Experience (a charitable endeavor), since 2008; Senior Vice President & General Counsel, American Century Companies (an investment management firm), 1998-2008. | 2 | Trustee, Forum Funds; Trustee, U.S. Global Investors Funds. |
Mark D. Moyer Born: 1959 | Trustee; Chairman Audit Committee | Since 2013 | Chief Financial Officer, Freedom House (a NGO advocating political freedom and democracy), since 2017; independent consultant providing interim CFO services, principally to non-profit organizations, 2011-2017; Chief Financial Officer, Institute of International Education (a NGO administering international educational exchange programs), 2008-2011; Chief Financial Officer and Chief Restructuring Officer, Ziff Davis Media Inc. (an integrated media company), 2005-2008; Adjunct Professor of Accounting, Fairfield University from 2009-2012. | 2 | Trustee, Forum Funds; Trustee, U.S. Global Investors Funds. |
| Jennifer Brown-Strabley Born: 1964 | Trustee | Since 2013 | Principal, Portland Global Advisors (a registered investment adviser), 1996-2010. | 2 | Trustee, Forum Funds; Trustee, U.S. Global Investors Funds. |
| Interested Trustees(1) | |||||
| Stacey E. Hong Born: 1966 | Trustee | Since 2013 | Director, Apex Fund Services since 2019; President, Atlantic Fund Services 2008-2019. | 2 | Trustee, Forum Funds, Trustee, U.S. Global Investors Funds. |
| Jessica Chase Born: 1970 | Trustee | Since 2019 | Director, Apex Fund Services since 2019; Senior Vice President, Atlantic Fund Services 2008-2019. | 2 | Trustee, Forum Funds, Trustee, U.S. Global Investors Funds. |
| (1) | Stacey E. Hong and Jessica Chase are currently treated as interested persons of the Trust, as defined in the 1940 Act, due to their affiliation with Apex Fund Services. Apex Fund Services is a wholly owned subsidiary of Apex US Holdings LLC. Jessica Chase is also currently an interested person of the Trust, as defined in the 1940 Act, due to her role as President of the Trust. |
BAYWOOD FUNDS
ADDITIONAL INFORMATION (Unaudited)
SEPTEMBER 30, 2019
| Name and Year of Birth | Position with the Trust | Length of Time Served | Principal Occupation(s) During Past 5 Years |
| Officers | |||
| Jessica Chase Born: 1970 | President; Principal Executive Officer | Since 2015 | Director, Apex Fund Services since 2019. Senior Vice President, Atlantic Fund Services 2008-2019. |
| Karen Shaw Born: 1972 | Treasurer; Principal Financial Officer | Since 2008 | Senior Vice President, Apex Fund Services since 2019; Senior Vice President, Atlantic Fund Services 2008-2019. |
| Zachary Tackett Born: 1988 | Vice President; Secretary and Anti-Money Laundering Compliance Officer | Since 2014 | Counsel, Apex Fund Services since 2019; Counsel, Atlantic Fund Services 2014-2019. |
| Michael J. McKeen Born: 1971 | Vice President | Since 2009 | Senior Vice President, Apex Fund Services since 2019; Senior Vice President, Atlantic Fund Services 2008-2019. |
| Timothy Bowden Born: 1969 | Vice President | Since 2009 | Manager, Apex Fund Services since 2019; Manager, Atlantic Fund Services 2008-2019. |
| Geoffrey Ney Born: 1975 | Vice President | Since 2013 | Manager, Apex Fund Services since 2019; Manager, Atlantic Fund Services 2013-2019. |
| Todd Proulx Born: 1978 | Vice President | Since 2013 | Manager, Apex Fund Services since 2019; Manager, Atlantic Fund Services 2013-2019. |
| Carlyn Edgar Born: 1963 | Vice President | Since 2008 | Senior Vice President, Apex Fund Services since 2019; Senior Vice President, Atlantic Fund Services 2008-2019; Chief Compliance Officer, 2008-2016. |
| Dennis Mason Born: 1967 | Chief Compliance Officer | Since 2016 | Fund Compliance Officer, Apex Fund Services since 2019; Fund Compliance Officer, Atlantic Fund Services 2013-2019. |
FOR MORE INFORMATION:
P.O. Box 588
Portland, ME 04112
(855) 409-2297 (toll free)
INVESTMENT ADVISOR
SKBA Capital Management, LLC
44 Montgomery Street, Suite 3500
San Francisco, CA 94104
TRANSFER AGENT
Apex Fund Services
P.O. Box 588
Portland, ME 04112
www.theapexgroup.com
DISTRIBUTOR
Foreside Fund Services, LLC
Three Canal Plaza, Suite 100
Portland, ME 04101
www.foreside.com
This report is submitted for the general information of the shareholders of the Funds. It is not authorized for distribution to prospective investors unless preceded or accompanied by an effective prospectus, which includes information regarding the Funds’ risks, objectives, fees and expenses, experience of its management, and other information.
217-ANR-0919

CARAVAN FRONTIER MARKETS OPPORTUNITIES FUND
SUPRA INSTITUTIONAL SHARES (CSFOX)
ANNUAL REPORT
SEPTEMBER 30, 2019
Beginning in January 2021, as permitted by regulations adopted by the Securities and Exchange Commission, paper copies of the Fund’s shareholder reports will no longer be sent by mail, unless you specifically request paper copies of the reports from the Fund or from your financial intermediary, such as a broker-dealer or bank. Instead, the reports will be made available on a website, and you will be notified by mail each time a report is posted and provided with a website link to access the report.
If you already elected to receive shareholder reports electronically, you will not be affected by this change and you need not take any action. You may elect to receive shareholder reports and other communications from the Fund or your financial intermediary electronically by contacting the Fund at (844) 856-1516, caravan.ta@apexfs.com, or by contacting your financial intermediary directly.
You may elect to receive all future reports in paper free of charge. You can inform the Fund or your financial intermediary that you wish to continue receiving paper copies of your shareholder reports by contacting the Fund at (844) 856-1516, caravan.ta@apexfs.com, or by contacting your financial intermediary directly. Your election to receive reports in paper will apply to the Caravan Frontier Markets Opportunities Fund.
CARAVAN FRONTIER MARKETS OPPORTUNITIES FUND
A MESSAGE TO OUR SHAREHOLDERS (Unaudited)
SEPTEMBER 30, 2019
Dear Shareholder,
The 12-month period ending in September 2019 was a particularly challenging time for the Caravan Frontier Markets Equity Fund (the “Fund”). Much has been discussed about “value” and “small cap” being out of favor in the developed markets. During this past fiscal year, these biases appear to have reached the frontier emerging market universe and unfortunately, proved to be a pair of very strong, short-term headwinds to overcome for the Fund in particular. We believe liquidity flows in favor of large caps driven by a structural shift in the global asset management industry towards more passive index tracking funds also partially explains the divergence of returns between large and small caps. Over the period, the Fund’s Supra Institutional Shares returned -10.5% net of fees, underperforming its benchmark MSCI Frontier Emerging Markets Net Total Return Index return of +2.6%i by -13.1%.
We view the Fed’s surprise about-face from a tightening to a loosening monetary policy as a catalyst that breathed more life into growth stocks. The Fed’s reversal has given leeway for other central banks to follow suit, driving equity markets globally to favor higher-priced growth stocks over value stocks. We believe lower interest rates give growth companies, both large and small, some additional cushion to go after risky, higher growth opportunities at lower cost of capital – making them relatively more attractive versus value stocks. Persistently low long-term interest rates around the world (with some having fallen into negative territory) has been an ongoing tailwind for growth names for nearly a decade.
Concerns about a global economic slowdown has been another main market driver during the period. This fear has been exacerbated by the escalation in US-China trade tensions that has been blamed for a contraction in global manufacturing activities and a hold on business investments. While the US has been the main instigator behind the trade conflict and the associated market volatility, non-US markets have taken the brunt of the negative repercussions in terms of both GDP growth and market returns. While the US economy is also slowing, the market appears to view it as continuing to have the brightest outlook among the bunch. In our frontier emerging universe, we believe this US-exceptionalism is manifesting itself in a flight of funds to the “safety” of the US and redemptions in actively managed funds that have been leading to forced selling of stocks. As for now at least, the market appears to be preferring the growth story offered by large caps in the US tech sector over the higher GDP growth stories of the frontier emerging world, which we believe is unfairly being lumped together with the slower growth, more trade-dependent international developed and emerging markets.
Throughout the year, at conferences, in management meetings, and via brokers, we have heard anecdotal accounts of stocks being sold due to fund redemptions and closures particularly in the frontier markets. While this is a continuation of a multiyear trend of fund outflows from the frontier markets, this year is the first year in our view and experience that this selling is materially impacting smaller cap names. This forced selling has had a magnified downward effect on our small cap holdings due to the illiquidity of the shares relative to the size of the positions being liquidated by our rival funds. We believe many of these stocks have been cut down to oversold levels where valuations are grossly misaligned with their fundamentals. While this process has been painful, we are hopeful that we may be at the final stages of this multi-year sell-down in this space if we are correct in assuming that the most illiquid names are the last holdings to be completely sold in a portfolio liquidation.
We believe there has been an opposite trend among large caps where indiscriminate buying has pushed valuations too high, a sharp contrast to small caps. We attribute this dynamic to the increased market share gains of passive funds, which mostly track market cap weighted indices that consist mostly of large cap stocks. As these passive funds receive additional funding, they tend to buy more of these large cap index components, agnostic of the fundamentals. In our view, smaller cap names typically benefit less from this inflow while off-benchmark small caps don’t usually benefit at all. We also highlight a passive fund driven investment behavior that is peculiar to the frontier markets. When countries in the frontier market benchmark get upgraded to emerging market status (usually 6 to 12 months before their inclusion into the emerging market index), there is buying of large caps that are earmarked to be constituents in the emerging market index, in anticipation of a “wall of liquidity” that will come from passive funds – again, independent of fundamentals.
The Fund’s value-driven diversified approach to frontier emerging markets is a long-term investment strategy that seeks a more balanced exposure to this faster growing universe relative to the MSCI Frontier Emerging Markets Index. We have generally found larger cap countries and companies in these markets to have higher valuations, but equivalent or lower economic growth outlook. The Fund, therefore, underweights the larger countries of the MSCI Frontier Emerging Markets Index, and over-weights the “long tail” of smaller countries that includes not only small countries in the benchmark but extends into off-benchmark ones – creating what we believe to be a diverse, rich exposure that attempts to minimize single country risk. Within countries, the Fund generally favors smaller market cap
| i | USD Net Return of the MSCI Frontier Emerging Markets Index |
CARAVAN FRONTIER MARKETS OPPORTUNITIES FUND
A MESSAGE TO OUR SHAREHOLDERS (Unaudited)
SEPTEMBER 30, 2019
names (many of which are consumer-facing) that have lower valuations but tend to have similar if not better growth prospects compared to the larger cap names that are typically benchmark constituents.
Our strategy generally underperforms against the benchmark when the larger countries in the benchmark to which the Fund is underweight rally ahead of the rest of the index. During this period, the Philippines, the largest benchmark constituent by far with a beginning of period weight of 22.7%ii (therefore our largest underweight) returned +11.7%iii versus the benchmark’s overall +2.6%iv return. Stock selection partially offset the lag from the Fund’s significant underweight in the first half, but unfortunately became an additional drag in the second half. Overall, the Philippines was the largest detractor of relative performance for the 12 months.
In the second half of our fiscal year, we increased our Philippines exposure to nearly the maximum allowed under our balanced strategy, to reflect our incrementally positive view on the country’s macro outlook. The central bank’s aggressive rate hikes implemented between May and November of 2018 was beginning to bring inflation under control and stabilize the currency. We added a commercial and residential property developer Megaworld based on our expectation that the central bank is set to reverse course and begin a monetary loosening cycle that may benefit the real estate sector. Unfortunately, Megaworld turned out to be a major detractor to the fund’s performance when the local property sector sold-off on concerns that the Chinese government may force closures of Philippines-based online Chinese gaming operators (POGOs), a sector from which these developers draw a good portion of their corporate tenants. Megaworld was particularly hard-hit given that it was one of the first to bring on these Chinese companies as clients and is perceived to have the largest POGO exposure. We believe the sharp drop in the stock price as being overblown and have purchased more shares into price weakness. We continue to like the name based on attractive locations of its landbank, its healthy pipeline of projects, and its dominant presence as an office space supplier to the business processing outsourcing sector where the management sees a revival in demand after a period of softness. We also believe the risk of outright closures of the existing POGOs as minimal and Megaworld’s exposure to POGOs is set to get smaller as its BPO and residential property business grow faster.
The second largest detractor to the Fund’ s performance was our off-benchmark position in small cap Gulf Marine Services (GMS), a UAE-based offshore oil services operator and manufacturer of self-propelled, self-elevating support vessels (SESVs). An unexpected announcement in which the company lowered its outlook and disclosed that it was about to breach its debt covenant caused a sharp collapse in the share price. The ensuing management turnover, a delay in announcement of interim financial results, and a weaker oil price contributed to further share price weakness. The new management team is currently negotiating a longer-term debt restructuring agreement. Based on our discussions with the management, we believe that there is a difference in perception about the debt covenant breach between the equity investors (GMS is listed in the UK) and the UAE banks to which the loans are owed. The equity investors, as evident from the steep share price sell-off, consider it a significantly more negative event than the local UAE banks who, in our view, consider covenant breaches and subsequent resolutions as a not atypical part of business in the region that should not incite such alarm and disruptions. Our view is that this perception gap has been a source of a mispricing of GMS shares that has the potential to resolve on announcement of a new debt agreement.
On the positive side, Vietnam was the largest contributor to the Fund’s relative performance. Our holdings in the country outperformed the benchmark’s +0.3%v return by over 11 percentage points. Main positive contributors were LS Cable & Systems Asia (Vietnam-based subsidiary of Korea’s LS Group – a manufacturer of power and optical cables) and FPT (an IT services, fixed broadband telecom, and education company). As the largest local manufacturer of power cables and the only player with in-country high-voltage cable production capability, we believe that LS Cable & Systems Asia is well-positioned to benefit from Vietnam’s FDI-driven manufacturing and infrastructure buildout story. Its investments over the last couple of years to expand capacity and product offerings are beginning to bear fruit amid healthy demand that appears to have strengthened further as more manufacturers relocate into Vietnam from China to avoid US tariffs. After spinning off its retail and distribution arms in early 2018, a more focused FPT under a new management team has begun to deliver sustained higher earnings growth from its remaining core businesses in 2019 than in the past. In our view FPT shares continue to be undervalued, given its forward PE of just 11x vi and our expected long-term growth prospects. We believe a major overhang on its valuation has been its low foreign ownership limit of 49% set by the government given its designation of telecom as a
| ii | MSCI Country weighting data |
| iii | USD Net Return of the MSCI Philippines Index |
| iv | USD Net Return of the MSCI Frontier Emerging Markets Index |
| v | USD Net Return of the MSCI Vietnam Index |
| vi | Bloomberg API, BEST PE as of September 30, 2019 |
CARAVAN FRONTIER MARKETS OPPORTUNITIES FUND
A MESSAGE TO OUR SHAREHOLDERS (Unaudited)
SEPTEMBER 30, 2019
“sensitive and important” sector. While there is low probability that this limit will be lifted in the near to medium term, our understanding is that there are partial solutions that the regulator is considering including introduction of NVDRs (non-voting depository receipts)vii for companies in Vietnam that would allow foreign investors to own their shares indirectly without ownership limits. If this should occur, we believe NVDRs could be a catalyst to potentially re-rate FPT shares.
The Fund’s position in Colombia also added to relative performance. Colombia is a case where our lower weight in a relatively poorly performing large country contributed positively. Colombia’s economy is highly dependent on the oil sector, which accounted for over 33%viii of its exports in 2017 and is a significant contributor to fiscal revenues. The weakness in oil prices which prevailed throughout our fiscal period was a significant overhang that manifested itself through a fall in the local currency and increased concerns about a widening in both current and fiscal account deficits. Over the course of the fiscal year, the Colombian Peso depreciated by approximately 15%ix against the US dollar and was the primary driver behind the country’s trailing returns.
Looking ahead, we are cautiously optimistic about the prospects for the frontier emerging market universe and the Fund’s value-oriented, small cap-biased strategy within it. The US Fed has led a global monetary easing cycle that we believe could benefit our universe through a greater risk appetite and search for higher returns. Although the Fed appears to be leaning towards a pause after its most recent interest rate cut, we believe the cumulative effects of cuts will continue to provide a supportive environment. If we are correct about lower rates boosting growth stocks, we believe a Fed pause will likely tilt value stocks into favor relative to growth stocks.
We think a slowing US economy that has grabbed headlines and raised investor concerns may ultimately be constructive for the frontier emerging markets. Barring an outright economic collapse which we view as a low probability scenario, slowing growth in the major economies of the US, China, and Europe will bring relatively higher GDP growth in the frontier emerging markets into sharper focus. In an environment where GDP growth is increasingly scarce, we believe our markets are likely to become increasingly attractive, particularly given their recent and lower valuations.
We note that the frontier emerging market economies, for the most part, are disconnected from the global trade flows and are driven more by internal factors such as political developments and market reforms that are uncorrelated with global economic trends. While some countries do have material exposure to the US or China, we note that these countries generally tend to be the heavyweights in the benchmark index to which the Fund is underweight. Some countries such as Vietnam and Bangladesh actually benefit from the trade war as manufacturers accelerate their factory relocations out of China to avoid tariff risks. We view the ongoing US-China conflict as a deeper structural rivalry between two superpowers that extends beyond just trade and may continue to have negative economic and market repercussions for the trade dependent economies as politics and economics increasingly get intertwined. We consider the recent optimism surrounding the Phase 1 trade deal as a temporary reprieve and that the volatility in the developed and emerging markets will continue to be influenced by the back and forth of this super-power rivalry. Given these gyrations, we believe the Fund’s relatively higher exposure to smaller countries and companies in the frontier and emerging economies that are mostly insulated from the trade war could prove to be beneficial.
The frontier emerging market equities asset class has witnessed persistent outflows since late 2014. With news of fund closures and redemption-driven selling of illiquid small cap stocks appearing to us to have crescendoed this year, we may be nearing the end of negative investor sentiment against this asset class. In our view, a pause or a reversal of these fund outflows could have a positive effect on returns.
Thank you very much for your investment in the Caravan Frontier Markets Opportunities Fund.
CARAVAN CAPITAL MANAGEMENT
Cliff Quisenberry, CFA
CEO/Chief Investment Officer
Caravan Capital Management, LLC
| vii | Vietnam Investment Review, “SCC rethinks acceptance of non-voting depository receipts”, 23 October 2018 |
| viii | https://oec.world/en/visualize/tree_map/hs92/export/col/all/show/2017/ |
| ix | Bloomberg London Composite |
CARAVAN FRONTIER MARKETS OPPORTUNITIES FUND
A MESSAGE TO OUR SHAREHOLDERS (Unaudited)
SEPTEMBER 30, 2019
Important Disclosure
An investment in the Fund is subject to risk, including the possible loss of principal. Derivatives, such as options, futures, forwards and swaps, can be volatile, and a small investment in a derivative can have a large impact on the performance of the Fund. Foreign investments may be subject to additional risks which include international trade, currency, political, regulatory and diplomatic risks. Emerging markets investments additional risks include greater political and economic uncertainties as well as a relative lack of information about companies in such markets.
Securities traded on frontier and emerging markets are potentially illiquid and may be subject to volatility and high transaction costs. Frontier markets may be concentrated in the Commercial Banks industry, which can be affected by global and local economic conditions. Mid, Small and micro capitalization companies may be less liquid and their securities’ prices may fluctuate more than those of larger, more established companies.
CARAVAN FRONTIER MARKETS OPPORTUNITIES FUND
PERFORMANCE CHART AND ANALYSIS (Unaudited)
SEPTEMBER 30, 2019
The following chart reflects the change in the value of a hypothetical $5,000,000 investment in Supra Institutional Shares, including reinvested dividends and distributions, in Caravan Frontier Markets Opportunities Fund (the “Fund”) compared with the performance of the benchmarks, the MSCI Frontier Emerging Markets Index and the secondary benchmark, MSCI Frontier Emerging Markets Net Total Return Index (the "indices"), since inception. The MSCI Frontier Emerging Markets Index is a capitalization weighted index that is designed to measure equity performance across large and mid cap companies across frontier emerging market countries. The total return of the indices includes the reinvestment of dividends and income. The total return of the Fund includes operating expenses that reduce returns, while the total return of the indices do not include expenses. The Fund is professionally managed, while the indices are unmanaged and are not available for investment.
Comparison of Change in Value of a $5,000,000 Investment
Caravan Frontier Markets Opportunities Fund – Supra Institutional Shares vs. MSCI Frontier Emerging Markets Index vs. MSCI Frontier Emerging Markets Net Total Return Index
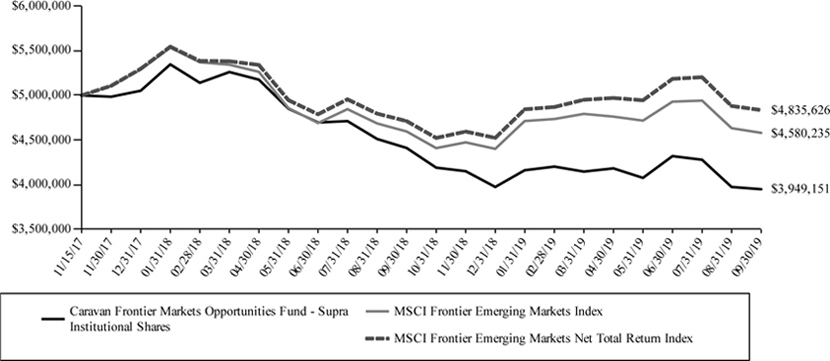
Average Annual Total Returns Periods Ended September 30, 2019 | One Year | Since Inception 11/15/17* | ||
| Caravan Frontier Markets Opportunities Fund - Supra Institutional Shares | -10.48% | -11.83% | ||
| MSCI Frontier Emerging Markets Index | -0.33% | -4.57% | ||
| MSCI Frontier Emerging Markets Net Total Return Index | 2.63% | -1.77% |
| * | Commencement of operations for Supra Institutional Shares. |
Performance data quoted represents past performance and is no guarantee of future results. Current performance may be lower or higher than the performance data quoted. Investment return and principal value will fluctuate so that shares, when redeemed, may be worth more or less than original cost. As stated in the Fund’s prospectus, the annual operating expense ratio (gross) is 3.09% and (net) 1.35%. However, the Fund’s adviser has contractually agreed to waive its fee and/or reimburse Fund expenses to limit Total Annual Fund Operating Expenses After Fee Waiver and/or Expense Reimbursement (excluding all taxes, interest, portfolio transaction expenses, acquired fund fees and expenses, proxy expenses and extraordinary expenses) to 1.30%, through February 1, 2020 (the “Expense Cap”). The Expense Cap may be raised or eliminated only with the consent of the Board of Trustees. The adviser may be reimbursed by the Fund for fees waived and expenses reimbursed by the adviser pursuant to the Expense Cap if such payment is approved by the Board, made within three years of the fee waiver or expense reimbursement and does not cause the Total Annual Fund Operating Expenses After Fee Waiver and/or Expense Reimbursement to exceed the lesser of (i) the then-current Expense Cap and (ii) the Expense Cap in place at the time the fees/expenses were waived/reimbursed. Total Annual Fund Operating Expenses After Fee Waiver and/or Expense Reimbursement will increase if exclusions from the Expense Cap apply. During the period, certain fees were waived and/or expenses reimbursed; otherwise, returns would have been lower. Shares redeemed or exchanged within 90 days of purchase will be charged a 2.00% redemption fee. The performance table and graph do not reflect the deduction of taxes that a shareholder would pay on Fund distributions or the redemption of Fund shares. Returns greater than one year are annualized. For the most recent month-end performance, please call (844) 856-1516.
CARAVAN FRONTIER MARKETS OPPORTUNITIES FUND
SCHEDULE OF INVESTMENTS
SEPTEMBER 30, 2019
| Shares | Security Description | Value | ||||||
| Common Stock - 93.8% | ||||||||
| Argentina - 4.0% | ||||||||
| 32,200 | Adecoagro SA (a) | $ | 187,726 | |||||
| 12,500 | Banco BBVA Argentina SA, ADR | 54,125 | ||||||
| 3,300 | Banco Macro SA, ADR | 85,866 | ||||||
| 91,551 | Bolsas y Mercados Argentinos SA (b)(c) | 321,690 | ||||||
| 15,217 | Grupo Clarin SA, GDR (a)(b)(c) | 14,676 | ||||||
| 664,083 | ||||||||
| Bangladesh - 4.9% | ||||||||
| 760,198 | Beximco Pharmaceuticals, Ltd., GDR | 345,839 | ||||||
| 560,097 | Golden Harvest Agro Industries, Ltd. (a)(c) | 205,492 | ||||||
| 8,704 | Youngone Corp. | 259,777 | ||||||
| 811,108 | ||||||||
| Colombia - 6.5% | ||||||||
| 134,550 | Almacenes Exito SA (b) | 681,256 | ||||||
| 4,100 | Bancolombia SA, ADR | 202,745 | ||||||
| 161,862 | CEMEX Latam Holdings SA (a) | 198,141 | ||||||
| 1,082,142 | ||||||||
| Cyprus - 1.4% | ||||||||
| 149,757 | Bank of Cyprus Holdings PLC (a) | 230,477 | ||||||
| Egypt - 5.2% | ||||||||
| 30,861 | Commercial International Bank Egypt SAE | 147,026 | ||||||
| 160,528 | Egyptian Financial Group-Hermes Holding Co. | 191,588 | ||||||
| 35,501 | Egyptian International Pharmaceuticals EIPICO | 145,842 | ||||||
| 171,940 | ElSewedy Electric Co. | 141,418 | ||||||
| 19,331 | Integrated Diagnostics Holdings PLC (d) | 88,923 | ||||||
| 82,396 | Obour Land For Food Industries | 26,571 | ||||||
| 199,817 | Oriental Weavers | 128,015 | ||||||
| 869,383 | ||||||||
| Estonia - 1.6% | ||||||||
| 260,478 | Tallink Grupp AS (c) | 268,577 | ||||||
| Georgia - 4.7% | ||||||||
| 15,740 | Bank of Georgia Group PLC | 258,557 | ||||||
| 21,658 | Georgia Capital PLC (a) | 271,622 | ||||||
| 17,358 | TBC Bank Group PLC | 263,794 | ||||||
| 793,973 | ||||||||
| Kazakhstan - 4.5% | ||||||||
| 50,826 | Halyk Savings Bank of Kazakhstan JSC, GDR | 617,536 | ||||||
| 23,797 | KCell JSC, GDR (c) | 129,932 | ||||||
| 747,468 | ||||||||
| Kenya - 4.8% | ||||||||
| 522,600 | Equity Group Holdings PLC | 188,458 | ||||||
| 527,400 | KCB Group, Ltd. | 213,296 | ||||||
| 1,502,200 | Safaricom PLC | 397,790 | ||||||
| 799,544 | ||||||||
| Kuwait - 9.5% | ||||||||
| 153,363 | Gulf Bank KSCP | 140,108 | ||||||
| 57,327 | Human Soft Holding Co. KSC | 588,718 | ||||||
| 159,102 | Mabanee Co. SAK | 399,455 | ||||||
| 104,625 | Mobile Telecommunications Co. KSC | 184,976 | ||||||
| 86,963 | National Bank of Kuwait SAKP | 270,634 | ||||||
| 1,583,891 | ||||||||
| Lithuania - 1.7% | ||||||||
| 508,077 | Siauliu Bankas AB | 282,427 | ||||||
| Mauritius - 1.7% | ||||||||
| 35,400 | MCB Group, Ltd. | 289,108 | ||||||
| Nigeria - 5.0% | ||||||||
| 7,036,390 | Guaranty Trust Bank PLC | 566,138 | ||||||
| 5,255,882 | Zenith Bank PLC | 270,817 | ||||||
| 836,955 | ||||||||
| Shares | Security Description | Value | ||||||
| Pakistan - 2.8% | ||||||||
| 63,850 | Lucky Cement, Ltd. | $ | 139,741 | |||||
| 60,500 | MCB Bank, Ltd. | 65,626 | ||||||
| 24,952 | NetSol Technologies, Inc. (a) | 138,483 | ||||||
| 158,500 | Oil & Gas Development Co., Ltd. | 124,742 | ||||||
| 468,592 | ||||||||
| Peru - 6.3% | ||||||||
| 147,698 | Alicorp SAA, Class C | 407,557 | ||||||
| 2,100 | Credicorp, Ltd. | 437,724 | ||||||
| 340,435 | Ferreycorp SAA | 213,132 | ||||||
| 1,058,413 | ||||||||
| Philippines - 9.2% | ||||||||
| 5,153,100 | Cosco Capital, Inc. (c) | 649,233 | ||||||
| 3,332,600 | Megaworld Corp. | 280,985 | ||||||
| 273,670 | Metropolitan Bank & Trust Co. | 361,162 | ||||||
| 19,141,000 | STI Education Systems Holdings, Inc. (c) | 251,126 | ||||||
| 1,542,506 | ||||||||
| Romania - 4.3% | ||||||||
| 637,601 | Banca Transilvania SA | 351,542 | ||||||
| 109,602 | BRD-Groupe Societe Generale SA | 360,560 | ||||||
| 712,102 | ||||||||
| Senegal - 1.2% | ||||||||
| 8,000 | Sonatel SA | 199,461 | ||||||
| Slovenia - 0.8% | ||||||||
| 2,000 | Krka dd Novo mesto | 136,026 | ||||||
| Sri Lanka - 2.3% | ||||||||
| 463,819 | John Keells Holdings PLC | 391,630 | ||||||
| Ukraine - 1.6% | ||||||||
| 31,184 | MHP SE, GDR | 273,172 | ||||||
| United Arab Emirates - 0.4% | ||||||||
| 948,036 | Gulf Marine Services PLC (a)(c) | 66,909 | ||||||
| Vietnam - 9.4% | ||||||||
| 1,374,000 | CP Pokphand Co., Ltd. | 117,455 | ||||||
| 116,600 | FPT Corp. | 289,980 | ||||||
| 53,514 | LS Cable & System Asia, Ltd. | 358,803 | ||||||
| 128,520 | Military Commercial Joint Stock Bank | 126,299 | ||||||
| 225,128 | PetroVietnam Technical Services Corp. | 189,216 | ||||||
| 4 | Superdong Fast Ferry Kien Giang JSC | 2 | ||||||
| 57,490 | Taseco Air Services JSC | 164,533 | ||||||
| 139,500 | Vietnam Engine & Agricultural Machinery Corp. (a) | 330,096 | ||||||
| 1,576,384 | ||||||||
| Total Common Stock (Cost $19,546,092) | 15,684,331 | |||||||
| Investment Company - 2.1% | ||||||||
| 1,246,675 | Fondul Proprietatea SA | |||||||
| (Cost $276,701) | 340,813 | |||||||
| Exchange Traded Fund - 1.7% | ||||||||
| 10,300 | iShares MSCI Frontier 100 ETF | |||||||
| (Cost $296,632) | 289,842 | |||||||
| Money Market Fund - 3.5% | ||||||||
| 590,170 | First American Government Obligations | |||||||
| Fund, Class X, 1.84% (e) | ||||||||
| (Cost $590,170) | 590,170 | |||||||
| Investments, at value - 101.1% (Cost $20,709,595) | $ | 16,905,156 | ||||||
| Other Assets & Liabilities, Net - (1.1)% | (186,567 | ) | ||||||
| Net Assets - 100.0% | $ | 16,718,589 | ||||||
See Notes to Financial Statements.
CARAVAN FRONTIER MARKETS OPPORTUNITIES FUND
SCHEDULE OF INVESTMENTS
SEPTEMBER 30, 2019
| ADR | American Depositary Receipt |
| ETF | Exchange Traded Fund |
| GDR | Global Depositary Receipt |
| JSC | Joint Stock Company |
| PLC | Public Limited Company |
| (a) | Non-income producing security. |
| (b) | Security fair valued in accordance with procedures adopted by the Board of Trustees. At the period end, the value of these securities amounted to $1,017,622 or 6.1% of net assets. |
| (c) | Illiquid Security. |
| (d) | Security exempt from registration under Rule 144A under the Securities Act of 1933. At the period end, the value of these securities amounted to $88,923 or 0.5% of net assets. |
| (e) | Dividend yield changes daily to reflect current market conditions. Rate was the quoted yield as of September 30, 2019. |
The following is a summary of the inputs used to value the Fund's investments as of September 30, 2019.
The inputs or methodology used for valuing securities are not necessarily an indication of the risks associated with investing in those securities. For more information on valuation inputs, and their aggregation into the levels used in the table below, please refer to the Security Valuation section in Note 2 of the accompanying Notes to Financial Statements.
| Level 1 | Level 2 | Level 3 | Total | |||||||||||||
| Investments at Value | ||||||||||||||||
| Common Stock | ||||||||||||||||
| Argentina | $ | 327,717 | $ | 336,366 | $ | – | $ | 664,083 | ||||||||
| Bangladesh | 811,108 | – | – | 811,108 | ||||||||||||
| Colombia | 400,886 | 681,256 | – | 1,082,142 | ||||||||||||
| Cyprus | 230,477 | – | – | 230,477 | ||||||||||||
| Egypt | 869,383 | – | – | 869,383 | ||||||||||||
| Estonia | 268,577 | – | – | 268,577 | ||||||||||||
| Georgia | 793,973 | – | – | 793,973 | ||||||||||||
| Kazakhstan | 747,468 | – | – | 747,468 | ||||||||||||
| Kenya | 799,544 | – | – | 799,544 | ||||||||||||
| Kuwait | 1,583,891 | – | – | 1,583,891 | ||||||||||||
| Lithuania | 282,427 | – | – | 282,427 | ||||||||||||
| Mauritius | 289,108 | – | – | 289,108 | ||||||||||||
| Nigeria | 836,955 | – | – | 836,955 | ||||||||||||
| Pakistan | 468,592 | – | – | 468,592 | ||||||||||||
| Peru | 1,058,413 | – | – | 1,058,413 | ||||||||||||
| Philippines | 1,542,506 | – | – | 1,542,506 | ||||||||||||
| Romania | 712,102 | – | – | 712,102 | ||||||||||||
| Senegal | 199,461 | – | – | 199,461 | ||||||||||||
| Slovenia | 136,026 | – | – | 136,026 | ||||||||||||
| Sri Lanka | 391,630 | – | – | 391,630 | ||||||||||||
| Ukraine | 273,172 | – | – | 273,172 | ||||||||||||
| United Arab Emirates | 66,909 | – | – | 66,909 | ||||||||||||
| Vietnam | 1,576,384 | – | – | 1,576,384 | ||||||||||||
| Investment Company | 340,813 | – | – | 340,813 | ||||||||||||
| Exchange Traded Fund | 289,842 | – | – | 289,842 | ||||||||||||
| Money Market Fund | – | 590,170 | – | 590,170 | ||||||||||||
| Investments at Value | $ | 15,297,364 | $ | 1,607,792 | $ | – | $ | 16,905,156 | ||||||||
The following is a reconciliation of Level 3 investments for which significant unobservable inputs were used to determine fair value.
| Common Stock | ||||
| Balance as of September 30, 2018 | $ | 50,416 | ||
| Transfer Out | (14,676 | ) | ||
| Change in Unrealized Appreciation/ (Depreciation) | (35,740 | ) | ||
| Balance as of September 30, 2019 | $ | - | ||
| Net change in unrealized appreciation (depreciation) from investments held as of September 30, 2019* | $ | (35,740 | ) | |
| * | The change in unrealized appreciation/(depreciation) is included in net change in unrealized appreciation (depreciation) of investments in the accompanying Statement of Operations. |
PORTFOLIO HOLDINGS (Unaudited)
% of Total Investments
| Argentina | 3.9 | % | ||
| Bangladesh | 4.8 | % | ||
| Colombia | 6.4 | % | ||
| Cyprus | 1.4 | % | ||
| Egypt | 5.1 | % | ||
| Estonia | 1.6 | % | ||
| Georgia | 4.7 | % | ||
| Kazakhstan | 4.4 | % | ||
| Kenya | 4.7 | % | ||
| Kuwait | 9.4 | % | ||
| Lithuania | 1.7 | % | ||
| Mauritius | 1.7 | % | ||
| Nigeria | 5.0 | % | ||
| Pakistan | 2.8 | % | ||
| Peru | 6.3 | % | ||
| Philippines | 9.1 | % | ||
| Romania | 4.2 | % | ||
| Senegal | 1.2 | % | ||
| Slovenia | 0.8 | % | ||
| Sri Lanka | 2.3 | % | ||
| Ukraine | 1.6 | % | ||
| United Arab Emirates | 0.4 | % | ||
| Vietnam | 9.3 | % | ||
| Investment Company | 2.0 | % | ||
| Exchange Traded Fund | 1.7 | % | ||
| Money Market Fund | 3.5 | % | ||
| 100.0 | % |
See Notes to Financial Statements.
CARAVAN FRONTIER MARKETS OPPORTUNITIES FUND
STATEMENT OF ASSETS AND LIABILITIES
SEPTEMBER 30, 2019
| ASSETS | ||||
| Investments, at value (Cost $20,709,595) | $ | 16,905,156 | ||
| Cash | 8,596 | |||
| Foreign currency (Cost $3,513) | 3,487 | |||
| Receivables: | ||||
| Fund shares sold | 1,152,328 | |||
| Investment securities sold | 100,797 | |||
| Dividends | 39,025 | |||
| From investment adviser | 2,479 | |||
| Prepaid expenses | 4,666 | |||
| Total Assets | 18,216,534 | |||
| LIABILITIES | ||||
| Payables: | ||||
| Investment securities purchased | 297,519 | |||
| Fund shares redeemed | 1,127,928 | |||
| Foreign capital gains tax payable | 29,991 | |||
| Accrued Liabilities: | ||||
| Fund services fees | 7,763 | |||
| Other expenses | 34,744 | |||
| Total Liabilities | 1,497,945 | |||
| NET ASSETS | $ | 16,718,589 | ||
| COMPONENTS OF NET ASSETS | ||||
| Paid-in capital | $ | 21,003,571 | ||
| Distributable earnings | (4,284,982 | ) | ||
| NET ASSETS | $ | 16,718,589 | ||
| SHARES OF BENEFICIAL INTEREST AT NO PAR VALUE (UNLIMITED SHARES AUTHORIZED) | ||||
| Supra Institutional Shares | 2,149,675 | |||
| NET ASSET VALUE, OFFERING AND REDEMPTION PRICE PER SHARE* | ||||
| Supra Institutional Shares (based on net assets of $16,718,589) | $ | 7.78 | ||
| * | Shares redeemed or exchanged within 90 days of purchase are charged a 2.00% redemption fee. |
See Notes to Financial Statements.
CARAVAN FRONTIER MARKETS OPPORTUNITIES FUND
STATEMENT OF OPERATIONS
YEAR ENDED SEPTEMBER 30, 2019
| INVESTMENT INCOME | ||||
| Dividend income (Net of foreign withholding taxes of $43,735) | $ | 660,721 | ||
| Total Investment Income | 660,721 | |||
| EXPENSES | ||||
| Investment adviser fees | 181,262 | |||
| Fund services fees | 92,000 | |||
| Transfer agent fees: | ||||
| Institutional Shares* | 18,780 | |||
| Supra Institutional Shares | 18,780 | |||
| Custodian fees | 39,527 | |||
| Registration fees: | ||||
| Institutional Shares* | 1,434 | |||
| Supra Institutional Shares | 3,509 | |||
| Professional fees | 41,166 | |||
| Trustees' fees and expenses | 4,034 | |||
| Offering costs | 2,244 | |||
| Other expenses | 31,545 | |||
| Total Expenses | 434,281 | |||
| Fees waived and expenses reimbursed | (216,327 | ) | ||
| Net Expenses | 217,954 | |||
| NET INVESTMENT INCOME | 442,767 | |||
| NET REALIZED AND UNREALIZED GAIN (LOSS) | ||||
| Net realized loss on: | ||||
| Investments (Net of foreign withholding taxes of $(875)) | (797,596 | ) | ||
| Foreign currency transactions | (23,047 | ) | ||
| Net realized loss | (820,643 | ) | ||
| Net change in unrealized appreciation (depreciation) on: | ||||
| Investments | (1,458,416 | ) | ||
| Deferred foreign capital gains taxes | (17,269 | ) | ||
| Foreign currency translations | 31 | |||
| Net change in unrealized appreciation (depreciation) | (1,475,654 | ) | ||
| NET REALIZED AND UNREALIZED LOSS | (2,296,297 | ) | ||
| DECREASE IN NET ASSETS RESULTING FROM OPERATIONS | $ | (1,853,530 | ) | |
| * | Institutional Shares liquidated September 30, 2019. |
See Notes to Financial Statements.
CARAVAN FRONTIER MARKETS OPPORTUNITIES FUND
STATEMENTS OF CHANGES IN NET ASSETS
For the Year Ended September 30, 2019 | November 14, 2017* through September 30, 2018 | |||||||
| OPERATIONS | ||||||||
| Net investment income | $ | 442,767 | $ | 244,283 | ||||
| Net realized loss | (820,643 | ) | (99,075 | ) | ||||
| Net change in unrealized appreciation (depreciation) | (1,475,654 | ) | (2,358,869 | ) | ||||
| Decrease in Net Assets Resulting from Operations | (1,853,530 | ) | (2,213,661 | ) | ||||
| DISTRIBUTIONS TO SHAREHOLDERS | ||||||||
| Institutional Shares | (13,207 | ) | – | |||||
| Supra Institutional Shares | (201,950 | ) | (2,634 | )** | ||||
| Total Distributions Paid | (215,157 | ) | (2,634 | ) | ||||
| CAPITAL SHARE TRANSACTIONS | ||||||||
| Sale of shares: | ||||||||
| Institutional Shares | 51,975 | 1,588,304 | ||||||
| Supra Institutional Shares | 5,937,954 | † | 16,647,153 | |||||
| Reinvestment of distributions: | ||||||||
| Institutional Shares | 13,207 | – | ||||||
| Supra Institutional Shares | 201,950 | 2,634 | ||||||
| Redemption of shares: | ||||||||
| Institutional Shares | (1,243,346 | )† | (40,015 | ) | ||||
| Supra Institutional Shares | (1,831,369 | ) | (327,422 | ) | ||||
| Redemption fees: | ||||||||
| Institutional Shares | – | 186 | ||||||
| Supra Institutional Shares | 913 | 1,447 | ||||||
| Increase in Net Assets from Capital Share Transactions | 3,131,284 | 17,872,287 | ||||||
| Increase in Net Assets | 1,062,597 | 15,655,992 | *** | |||||
| NET ASSETS | ||||||||
| Beginning of Period | 15,655,992 | – | ||||||
| End of Period | $ | 16,718,589 | $ | 15,655,992 | ||||
| SHARE TRANSACTIONS | ||||||||
| Sale of shares: | ||||||||
| Institutional Shares | 6,434 | 155,632 | ||||||
| Supra Institutional Shares | 724,996 | † | 1,656,430 | |||||
| Reinvestment of distributions: | ||||||||
| Institutional Shares | 1,691 | – | ||||||
| Supra Institutional Shares | 25,891 | 263 | ||||||
| Redemption of shares: | ||||||||
| Institutional Shares | (159,422 | )† | (4,335 | ) | ||||
| Supra Institutional Shares | (224,763 | ) | (33,142 | ) | ||||
| Increase in Shares | 374,827 | 1,774,848 | ||||||
| * | Commencement of operations. |
| ** | Distribution was the result of net investment income for the period ending September 30, 2018. |
| *** | Includes undistributed net investment income of $175,851 at September 30, 2018. The requirement to disclose the corresponding amount as of September 30, 2019 was eliminated. |
| † | The above figure includes transfers of $1,127,928 and 145,164 and 144,978 shares from the Institutional Shares to the Supra Institutional Shares, respectively, as a result of the liquidation of the Institutional Shares on September 30, 2019. |
See Notes to Financial Statements.
CARAVAN FRONTIER MARKETS OPPORTUNITIES FUND
FINANCIAL HIGHLIGHTS
These financial highlights reflect selected data for a share outstanding throughout each period.
For the Year Ended September 30, 2019 | November 15, 2017 (a) Through September 30, 2018 | |||||||
| SUPRA INSTITUTIONAL SHARES | ||||||||
| NET ASSET VALUE, Beginning of Period | $ | 8.82 | $ | 10.00 | ||||
| INVESTMENT OPERATIONS | ||||||||
| Net investment income (b) | 0.22 | 0.19 | ||||||
| Net realized and unrealized loss | (1.14 | ) | (1.37 | ) | ||||
| Total from Investment Operations | (0.92 | ) | (1.18 | ) | ||||
| DISTRIBUTIONS TO SHAREHOLDERS FROM | ||||||||
| Net investment income | (0.12 | ) | (0.00 | )(c) | ||||
| Total Distributions to Shareholders | (0.12 | ) | (0.00 | ) | ||||
| REDEMPTION FEES(b) | 0.00 | (c) | 0.00 | (c) | ||||
| NET ASSET VALUE, End of Period | $ | 7.78 | $ | 8.82 | ||||
| TOTAL RETURN | (10.48 | )% | (11.77 | )%(d) | ||||
| RATIOS/SUPPLEMENTARY DATA | ||||||||
| Net Assets at End of Period (000s omitted) | $ | 16,719 | $ | 14,324 | ||||
| Ratios to Average Net Assets: | ||||||||
| Net investment income | 2.71 | % | 2.15 | %(e) | ||||
| Net expenses | 1.30 | % | 1.30 | %(e) | ||||
| Gross expenses (f) | 2.51 | % | 3.04 | %(e) | ||||
| PORTFOLIO TURNOVER RATE | 24 | % | 12 | %(d) | ||||
| (a) | Commencement of operations. |
| (b) | Calculated based on average shares outstanding during each period. |
| (c) | Less than $0.01 per share. |
| (d) | Not annualized. |
| (e) | Annualized. |
| (f) | Reflects the expense ratio excluding any waivers and/or reimbursements. |
See Notes to Financial Statements.
CARAVAN FRONTIER MARKETS OPPORTUNITIES FUND
NOTES TO FINANCIAL STATEMENTS
SEPTEMBER 30, 2019
Note 1. Organization
The Caravan Frontier Markets Opportunities Fund (the “Fund”) is a diversified portfolio of Forum Funds II (the “Trust”). The Trust is a Delaware statutory trust that is registered as an open-end, management investment company under the Investment Company Act of 1940, as amended (the “Act”). Under its Trust Instrument, the Trust is authorized to issue an unlimited number of the Fund’s shares of beneficial interest without par value. The Fund commenced operations on November 14, 2017 and currently offers Supra Institutional Shares. Supra Institutional Shares commenced operations on November 15, 2017. The Fund’s investment objective is long-term capital appreciation. On August 6, 2019, the Trust’s Board of Trustees approved the conversion of the outstanding shares of the Fund’s Institutional Shares, in a tax-free exchange into shares of the Fund’s Supra Institutional Shares and the closure of the Institutional Shares to new investments. On September 30, 2019, each shareholder of the Institutional Shares received Supra Institutional Shares in a dollar amount equal to their investment in the Institutional Shares as of that date.
Note 2. Summary of Significant Accounting Policies
The Fund is an investment company and follows accounting and reporting guidance under Financial Accounting Standards Board (“FASB”) Accounting Standards Codification (“ASC”) Topic 946, “Financial Services – Investment Companies.” These financial statements are prepared in accordance with accounting principles generally accepted in the United States of America (“GAAP”), which require management to make estimates and assumptions that affect the reported amounts of assets and liabilities, the disclosure of contingent liabilities at the date of the financial statements, and the reported amounts of increases and decreases in net assets from operations during the fiscal year. Actual amounts could differ from those estimates. The following summarizes the significant accounting policies of the Fund:
Security Valuation – Securities are valued at market prices using the last quoted trade or official closing price from the principal exchange where the security is traded, as provided by independent pricing services on each Fund business day. In the absence of a last trade, securities are valued at the mean of the last bid and ask price provided by the pricing service. Shares of non-exchange traded open-end mutual funds are valued at net asset value (“NAV”). Short-term investments that mature in sixty days or less may be valued at amortized cost.
The Fund values its investments at fair value pursuant to procedures adopted by the Trust’s Board of Trustees (the “Board”) if (1) market quotations are not readily available or (2) the Adviser, as defined in Note 3, believes that the values available are unreliable. The Trust’s Valuation Committee, as defined in the Fund’s registration statement, performs certain functions as they relate to the administration and oversight of the Fund’s valuation procedures. Under these procedures, the Valuation Committee convenes on a regular and ad hoc basis to review such investments and considers a number of factors, including valuation methodologies and significant unobservable inputs, when arriving at fair value.
The Valuation Committee may work with the Adviser to provide valuation inputs. In determining fair valuations, inputs may include market-based analytics that may consider related or comparable assets or liabilities, recent transactions, market multiples, book values and other relevant investment information. Adviser inputs may include an income-based approach in which the anticipated future cash flows of the investment are discounted in determining fair value. Discounts may also be applied based on the nature or duration of any restrictions on the disposition of the investments. The Valuation Committee performs regular reviews of valuation methodologies, key inputs and assumptions, disposition analysis and market activity.
Fair valuation is based on subjective factors and, as a result, the fair value price of an investment may differ from the security’s market price and may not be the price at which the asset may be sold. Fair valuation could result in a different NAV than a NAV determined by using market quotes.
GAAP has a three-tier fair value hierarchy. The basis of the tiers is dependent upon the various “inputs” used to determine the value of the Fund’s investments. These inputs are summarized in the three broad levels listed below:
Level 1 - Quoted prices in active markets for identical assets and liabilities.
Level 2 - Prices determined using significant other observable inputs (including quoted prices for similar securities, interest rates, prepayment speeds, credit risk, etc.). Short-term securities with maturities of sixty days or less are valued at amortized cost, which approximates market value, and are categorized as Level 2 in the hierarchy. Municipal securities, long-term U.S. government obligations and corporate debt securities are valued in accordance with the evaluated price supplied by a pricing service and generally categorized as
CARAVAN FRONTIER MARKETS OPPORTUNITIES FUND
NOTES TO FINANCIAL STATEMENTS
SEPTEMBER 30, 2019
Level 2 in the hierarchy. Other securities that are categorized as Level 2 in the hierarchy include, but are not limited to, warrants that do not trade on an exchange, securities valued at the mean between the last reported bid and ask quotation and international equity securities valued by an independent third party with adjustments for changes in value between the time of the securities’ respective local market closes and the close of the U.S. market.
Level 3 - Significant unobservable inputs (including the Fund’s own assumptions in determining the fair value of investments).
The aggregate value by input level, as of September 30, 2019, for the Fund’s investments is included in the Fund’s Schedule of Investments.
Security Transactions, Investment Income and Realized Gain and Loss – Investment transactions are accounted for on the trade date. Dividend income is recorded on the ex-dividend date. Foreign dividend income is recorded on the ex-dividend date or as soon as possible after determining the existence of a dividend declaration after exercising reasonable due diligence. Income and capital gains on some foreign securities may be subject to foreign withholding taxes, which are accrued as applicable. Interest income is recorded on an accrual basis. Premium is amortized and discount is accreted using the effective interest method. Identified cost of investments sold is used to determine the gain and loss for both financial statement and federal income tax purposes.
Foreign Currency Translations – Foreign currency amounts are translated into U.S. dollars as follows: (1) assets and liabilities at the rate of exchange at the end of the respective period; and (2) purchases and sales of securities and income and expenses at the rate of exchange prevailing on the dates of such transactions. The portion of the results of operations arising from changes in the exchange rates and the portion due to fluctuations arising from changes in the market prices of securities are not isolated. Such fluctuations are included with the net realized and unrealized gain or loss on investments.
Foreign Currency Transactions – The Fund may enter into transactions to purchase or sell foreign currency contracts and options on foreign currency. Forward currency contracts are agreements to exchange one currency for another at a future date and at a specified price. A fund may use forward currency contracts to facilitate transactions in foreign securities, to manage a fund’s foreign currency exposure and to protect the U.S. dollar value of its underlying portfolio securities against the effect of possible adverse movements in foreign exchange rates. These contracts are intrinsically valued daily based on forward rates, and a fund’s net equity therein, representing unrealized gain or loss on the contracts as measured by the difference between the forward foreign exchange rates at the dates of entry into the contracts and the forward rates at the reporting date, is recorded as a component of NAV. These instruments involve market risk, credit risk, or both kinds of risks, in excess of the amount recognized in the Statement of Assets and Liabilities. Risks arise from the possible inability of counterparties to meet the terms of their contracts and from movement in currency and securities values and interest rates. Due to the risks associated with these transactions, a fund could incur losses up to the entire contract amount, which may exceed the net unrealized value included in its NAV.
Distributions to Shareholders – The Fund declares any dividends from net investment income and pays them annually. Any net capital gains and net foreign currency gains realized by the Fund are distributed at least annually. Distributions to shareholders are recorded on the ex-dividend date. Distributions are based on amounts calculated in accordance with applicable federal income tax regulations, which may differ from GAAP. These differences are due primarily to differing treatments of income and gain on various investment securities held by the Fund, timing differences and differing characterizations of distributions made by the Fund.
Federal Taxes – The Fund intends to continue to qualify each year as a regulated investment company under Subchapter M of Chapter 1, Subtitle A, of the Internal Revenue Code of 1986, as amended (“Code”), and to distribute all of its taxable income to shareholders. In addition, by distributing in each calendar year substantially all of its net investment income and capital gains, if any, the Fund will not be subject to a federal excise tax. Therefore, no federal income or excise tax provision is required. The Fund will file a U.S. federal income and excise tax return as required. The Fund’s federal income tax returns are subject to examination by the Internal Revenue Service for a period of three fiscal years after they are filed. As of September 30, 2019, there are no uncertain tax positions that would require financial statement recognition, de-recognition or disclosure.
Income and Expense Allocation – The Trust accounts separately for the assets, liabilities and operations of each of its investment portfolios. Expenses that are directly attributable to more than one investment portfolio are allocated among the respective investment portfolios in an equitable manner.
CARAVAN FRONTIER MARKETS OPPORTUNITIES FUND
NOTES TO FINANCIAL STATEMENTS
SEPTEMBER 30, 2019
The Fund's class-specific expenses are charged to the operations of that class of shares. Income and expenses (other than expenses attributable to a specific class) and realized and unrealized gains or losses on investments are allocated to each class of shares based on the class’ respective net assets to the total net assets of the Fund.
Offering Costs – Offering costs for the Caravan Frontier Markets Opportunities Fund of $26,929 consisted of fees related to the mailing and printing of the initial prospectus, certain startup legal costs, and initial registration filings. Such costs are amortized over a twelve-month period beginning with the commencement of operations of the Caravan Frontier Markets Opportunities Fund. During the year ended September 30, 2019, the Fund expensed $2,244.
Redemption Fees – A shareholder who redeems or exchanges shares within 90 days of purchase will incur a redemption fee of 2.00% of the current NAV of shares redeemed or exchanged, subject to certain limitations. The fee is charged for the benefit of the remaining shareholders and will be paid to the Fund to help offset transaction costs. The fee is accounted for as an addition to paid-in capital. The Fund reserves the right to modify the terms of or terminate the fee at any time. There are limited exceptions to the imposition of the redemption fee. Redemption fees incurred for the Fund, if any, are reflected on the Statement of Changes in Net Assets.
Commitments and Contingencies – In the normal course of business, the Fund enters into contracts that provide general indemnifications by the Fund to the counterparty to the contract. The Fund’s maximum exposure under these arrangements is dependent on future claims that may be made against the Fund and, therefore, cannot be estimated; however, based on experience, the risk of loss from such claims is considered remote. The Fund has determined that none of these arrangements requires disclosure on the Fund’s balance sheet.
Note 3. Fees and Expenses
Investment Adviser – Caravan Capital Management, LLC (the “Adviser”) is the investment adviser to the Fund. Pursuant to an investment advisory agreement, the Adviser receives an advisory fee, payable monthly, from the Fund at an annual rate of 1.10% of the Fund’s average daily net assets.
Distribution – Foreside Fund Services, LLC serves as the Fund’s distributor (the “Distributor”). The Fund does not have a distribution (12b-1) plan; accordingly, the Distributor does not receive compensation from the Fund for its distribution services. The Adviser compensates the Distributor directly for its services. The Distributor is not affiliated with the Adviser or Atlantic Fund Administration, LLC, a wholly owned subsidiary of Apex US Holdings, LLC (d/b/a Apex Fund Services) (“Apex”) or their affiliates.
Other Service Providers – Apex provides fund accounting, fund administration, compliance and transfer agency services to the Fund. The fees related to these services are included in Fund services fees within the Statement of Operations. Apex also provides certain shareholder report production and EDGAR conversion and filing services. Pursuant to an Apex services agreement, the Fund pays Apex customary fees for its services. Apex provides a Principal Executive Officer, a Principal Financial Officer, a Chief Compliance Officer and an Anti-Money Laundering Officer to the Fund, as well as certain additional compliance support functions.
Trustees and Officers – The Trust pays each Independent Trustee an annual fee of $16,000 ($21,000 for the Chairman) for service to the Trust. The Independent Trustees and Chairman may receive additional fees for special Board meetings. The Independent Trustees are also reimbursed for all reasonable out-of-pocket expenses incurred in connection with their duties as Trustees, including travel and related expenses incurred in attending Board meetings. The amount of Independent Trustees’ fees attributable to the Fund is disclosed in the Statement of Operations. Certain officers of the Trust are also officers or employees of the above named service providers, and during their terms of office received no compensation from the Fund.
Note 4. Expense Reimbursement and Fees Waived
The Adviser has contractually agreed to waive its fee and/or reimburse Fund expenses to limit total annual fund operating expenses (excluding all taxes, interest, portfolio transaction expenses, acquired fund fees and expenses, proxy expenses and extraordinary expenses) to 1.30% through February 1, 2020. Other fund service providers have voluntarily agreed to waive and reimburse a portion of their fees. These voluntary fee waivers and reimbursements may be reduced or eliminated at any time. For the year ended September 30, 2019, fees waived and/or reimbursed expenses were as follows:
Investment Adviser Fees Waived | Investment Adviser Expenses Reimbursed | Other Waivers | Total Fees Waived and Expenses Reimbursed | |||||||||||
| $ | 181,262 | $ | 1,665 | $ | 33,400 | $ | 216,327 | |||||||
CARAVAN FRONTIER MARKETS OPPORTUNITIES FUND
NOTES TO FINANCIAL STATEMENTS
SEPTEMBER 30, 2019
The Adviser may be reimbursed by the Fund for fees waived and expenses reimbursed by the Adviser pursuant to the Expense Cap if such payment is approved by the Board, made within three years of the fee waiver or expense reimbursement, and does not cause the Total Annual Fund Operating Expenses After Fee Waiver and/or Expense Reimbursement to exceed the lesser of (i) the then-current expense cap, or (ii) the expense cap in place at the time the fees/expenses were waived/reimbursed. As of September 30, 2019, $370,012 is subject to recapture by the Adviser.
Note 5. Security Transactions
The cost of purchases and proceeds from sales of investment securities (including maturities), other than short-term investments during the year ended September 30, 2019, were $6,990,641 and $3,738,347, respectively.
Note 6. Federal Income Tax
As of September 30, 2019, the cost of investments for federal income tax purposes is $20,800,869 and the components of net unrealized depreciation were as follows:
| Gross Unrealized Appreciation | $ | 606,516 | ||
| Gross Unrealized Depreciation | (4,502,229 | ) | ||
| Net Unrealized Depreciation | $ | (3,895,713 | ) |
Distributions paid during the fiscal periods ended as noted were characterized for tax purposes as follows:
| 2019 | 2018 | |||||||
| Ordinary Income | $ | 215,157 | $ | 2,634 | ||||
As of September 30, 2019, distributable earnings (accumulated loss) on a tax basis were as follows:
| Undistributed Ordinary Income | $ | 448,269 | ||
| Capital and Other Losses | (807,454 | ) | ||
| Unrealized Depreciation | (3,925,797 | ) | ||
| Total | $ | (4,284,982 | ) |
The difference between components of distributable earnings on a tax basis and the amounts reflected in the Statement of Assets and Liabilities are primarily due to investments in passive foreign investment companies (“PFIC”) and wash sales.
As of September 30, 2019, the Fund had $90,207 of available short-term capital loss carryforwards and $717,247 of available long-term capital loss carryforwards that have no expiration date.
Note 7. Recent Accounting Pronouncements
In August 2018, the Financial Accounting Standards Board (“FASB”) issued Accounting Standards Update No. 2018-13 “Fair Value Measurement (Topic 820): Disclosure Framework – Changes to the Disclosure Requirements for Fair Value Measurement” (“ASU 2018-13”) which includes amendments intended to improve the effectiveness of disclosures in the notes to financial statements. For example, ASU 2018-13 includes additional disclosures regarding the range and weighted average of significant unobservable inputs used to develop Level 3 fair value measurements, and clarifications to the narrative description of measurement uncertainty disclosures. ASU 2018-13 is effective for interim and annual periods beginning after December 15, 2019. Early adoption is permitted and the Fund has adopted ASU 2018-13 within these financial statements.
In September 2018, the Securities and Exchange Commission released Final Rule 33-10532 captioned “Disclosure Update and Simplification,” which includes: (i) an amendment to require presentation of the total, rather than the components, of distributable earnings on the Statement of Assets and Liabilities; and (ii) an amendment to require presentation of the total, rather than the components, of distributions to shareholders, except for tax return of capital distributions, on the Statement of Changes in Net Assets. The amendments also removed the requirement for parenthetical disclosure of undistributed net investment income on the Statement of Changes in Net Assets. These changes were effective November 5, 2018. These amendments are reflected in the Fund's financial statements for the year ended September 30, 2019.
CARAVAN FRONTIER MARKETS OPPORTUNITIES FUND
NOTES TO FINANCIAL STATEMENTS
SEPTEMBER 30, 2019
Note 8. Subsequent Events
Subsequent events occurring after the date of this report through the date these financial statements were issued have been evaluated for potential impact, and the Fund has had no such events.
REPORT OF INDEPENDENT REGISTERED PUBLIC ACCOUNTING FIRM
To the Board of Trustees of Forum Funds II
and the Shareholders of Caravan Frontier Markets Opportunities Fund
Opinion on the Financial Statements
We have audited the accompanying statement of assets and liabilities of Caravan Frontier Markets Opportunities Fund, a series of shares of beneficial interest in Forum Funds II (the “Fund”), including the schedule of investments, as of September 30, 2019, and the related statement of operations, the statements of changes in net assets and the financial highlights as noted in the table below, and the related notes to the financial statements (“financial statements”). In our opinion, the financial statements present fairly, in all material respects, the financial position of the Fund as of September 30, 2019, and the results of its operations, the changes in its net assets and its financial highlights as noted in the table below, in conformity with accounting principles generally accepted in the United States of America.
| Fund | Statements of Operations and Changes in Net Assets and the Financial Highlights |
| Caravan Frontier Markets Opportunities Fund | The statement of operations for the year ended September 30, 2019, the statements of changes in net assets for the year ended September 30, 2019 and the period from November 14, 2017 (commencement of operations) through September 30, 2018 and the financial highlights for the year ended September 30, 2019 and the period from November 15, 2017 (commencement of operations) through September 30, 2018 |
Basis for Opinion
These financial statements are the responsibility of the Fund’s management. Our responsibility is to express an opinion on the Fund’s financial statements based on our audits. We are a public accounting firm registered with the Public Company Accounting Oversight Board (United States) (“PCAOB”) and are required to be independent with respect to the Fund in accordance with the U.S. federal securities law and the applicable rules and regulations of the Securities and Exchange Commission and the PCAOB.
We conducted our audits in accordance with the standards of the PCAOB. Those standards require that we plan and perform the audits to obtain reasonable assurance about whether the financial statements are free of material misstatement, whether due to error or fraud. The Fund is not required to have, nor were we engaged to perform, an audit of its internal control over financial reporting. As part of our audits we are required to obtain an understanding of internal control over financial reporting but not for the purpose of expressing an opinion on the effectiveness of the Fund’s internal control over financial reporting. Accordingly, we express no such opinion.
Our audits included performing procedures to assess the risk of material misstatement of the financial statements, whether due to error or fraud, and performing procedures that respond to those risks. Such procedures included examining, on a test basis, evidence regarding the amounts and disclosures in the financial statements. Our procedures included confirmation of securities owned as of September 30, 2019 by correspondence with the custodian and broker. Our audits also included evaluating the accounting principles used and significant estimates made by management, as well as evaluating the overall presentation of the financial statements. We believe that our audits provide a reasonable basis for our opinion.
BBD, LLP
We have served as the auditor of one or more of the Funds in the Forum Funds II since 2013.
Philadelphia, Pennsylvania
November 26, 2019
CARAVAN FRONTIER MARKETS OPPORTUNITIES FUND
ADDITIONAL INFORMATION (Unaudited)
SEPTEMBER 30, 2019
Proxy Voting Information
A description of the policies and procedures that the Fund uses to determine how to vote proxies relating to securities held in the Fund’s portfolio is available, without charge and upon request, by calling (844) 856-1516 and on the U.S. Securities and Exchange Commission's (the "SEC") website at www.sec.gov. The Fund’s proxy voting record for the most recent twelve-month period ended June 30 is available, without charge and upon request, by calling (844) 856-1516 and on the SEC’s website at www.sec.gov.
Availability of Quarterly Portfolio Schedules
The Fund files its complete schedule of portfolio holdings with the SEC for the first and third quarters of each fiscal year on Form N-Q. These filings are available, without charge and upon request on the SEC’s website at www.sec.gov or may be reviewed and copied at the SEC’s Public Reference Room in Washington, D.C. Information on the operation of the Public Reference Room may be obtained by calling (800) SEC-0330.
Shareholder Expense Example
As a shareholder of the Fund, you incur two types of costs: (1) transaction costs, including redemption fees, and (2) ongoing costs, including management fees and other Fund expenses. This example is intended to help you understand your ongoing costs (in dollars) of investing in the Fund, and to compare these costs with the ongoing costs of investing in other mutual funds.
The example is based on an investment of $1,000 invested at the beginning of the period and held for the entire period from April 1, 2019 through September 30, 2019.
Actual Expenses – The first line of the table below provides information about actual account values and actual expenses. You may use the information in this line, together with the amount you invested, to estimate the expenses that you paid over the period. Simply divide your account value by $1,000 (for example, an $8,600 account value divided by $1,000 = 8.6), then multiply the result by the number in the first line under the heading entitled “Expenses Paid During Period” to estimate the expenses you paid on your account during the period.
Hypothetical Example for Comparison Purposes – The second line of the table below provides information about hypothetical account values and hypothetical expenses based on the Fund’s actual expense ratio and an assumed rate of return of 5% per year before expenses, which is not the Fund’s actual return. The hypothetical account values and expenses may not be used to estimate the actual ending account balance or expenses you paid for the period. You may use this information to compare the ongoing costs of investing in the Fund and other funds. To do so, compare this 5% hypothetical example with the 5% hypothetical examples that appear in the shareholder reports of other funds.
Please note that the expenses shown in the table are meant to highlight your ongoing costs only and do not reflect any transactional costs, such as redemption fees. Therefore, the second line of the table is useful in comparing ongoing costs only and will not help you determine the relative total costs of owning different funds. In addition, if these transactional costs were included, your costs would have been higher.
Beginning Account Value April 1, 2019 | Ending Account Value September 30, 2019 | Expenses Paid During Period* | Annualized Expense Ratio* | |||||||||||||
| Supra Institutional Shares | ||||||||||||||||
| Actual | $1,000.00 | $952.26 | $6.36 | 1.30% | ||||||||||||
| Hypothetical (5% return before expenses) | $1,000.00 | $1,018.55 | $6.58 | 1.30% | ||||||||||||
| * | Expenses are equal to the Fund’s annualized expense ratio multiplied by the average account value over the period, multiplied by the number of days in the most recent fiscal half-year (183) divided by 365 to reflect the half-year period. |
Federal Tax Status of Dividends Declared during the Fiscal Year
For federal income tax purposes, dividends from short-term capital gains are classified as ordinary income. The Fund designates 81.37% of its income dividend distributed for the qualified dividend rate (QDI) as defined in Section 1(h)(11) of the Code. The Fund also designates 1.21% of its income dividends as qualified interest income exempt from U.S. tax for foreign shareholders (QII).
CARAVAN FRONTIER MARKETS OPPORTUNITIES FUND
ADDITIONAL INFORMATION (Unaudited)
SEPTEMBER 30, 2019
Trustees and Officers of the Trust
The Board is responsible for oversight of the management of the Trust’s business affairs and of the exercise of all the Trust’s powers except those reserved for the shareholders. The following table provides information about each Trustee and certain officers of the Trust. Each Trustee and officer holds office until the person resigns, is removed, or is replaced. Unless otherwise noted, the persons have held their principal occupations for more than five years. The address for all Trustees and officers is Three Canal Plaza, Suite 600, Portland, Maine 04101. The Fund’s Statement of Additional Information includes additional information about the Trustees and is available, without charge and upon request, by calling (844) 856-1516.
Name and Year of Birth | Position with the Trust | Length of Time Served | Principal Occupation(s) During Past Five Years | Number of Series in Fund Complex Overseen By Trustee | Other Directorships Held By Trustee During Past Five Years |
| Independent Trustees | |||||
David Tucker Born: 1958 | Chairman of the Board; Trustee; Chairman, Nominating Committee and Qualified Legal Compliance Committee | Since 2013 | Director, Blue Sky Experience (a charitable endeavor), since 2008; Senior Vice President & General Counsel, American Century Companies (an investment management firm), 1998-2008. | 1 | Trustee, Forum Funds; Trustee, U.S. Global Investors Funds. |
Mark D. Moyer Born: 1959 | Trustee; Chairman Audit Committee | Since 2013 | Chief Financial Officer, Freedom House (a NGO advocating political freedom and democracy), since 2017; independent consultant providing interim CFO services, principally to non-profit organizations, 2011-2017; Chief Financial Officer, Institute of International Education (a NGO administering international educational exchange programs), 2008-2011; Chief Financial Officer and Chief Restructuring Officer, Ziff Davis Media Inc. (an integrated media company), 2005-2008; Adjunct Professor of Accounting, Fairfield University from 2009-2012. | 1 | Trustee, Forum Funds; Trustee, U.S. Global Investors Funds. |
Jennifer Brown-Strabley Born: 1964 | Trustee | Since 2013 | Principal, Portland Global Advisors (a registered investment adviser), 1996-2010. | 1 | Trustee, Forum Funds; Trustee, U.S. Global Investors Funds. |
| Interested Trustees(1) | |||||
Stacey E. Hong Born: 1966 | Trustee | Since 2013 | Director, Apex Fund Services since 2019; President, Atlantic Fund Services 2008-2019. | 1 | Trustee, Forum Funds, Trustee, U.S. Global Investors Funds. |
Jessica Chase Born: 1970 | Trustee | Since 2019 | Director, Apex Fund Services since 2019; Senior Vice President, Atlantic Fund Services 2008-2019. | 1 | Trustee, Forum Funds, Trustee, U.S. Global Investors Funds. |
| (1) | Stacey E. Hong and Jessica Chase are currently treated as interested persons of the Trust, as defined in the 1940 Act, due to their affiliation with Apex Fund Services. Apex Fund Services is a wholly owned subsidiary of Apex US Holdings LLC. Jessica Chase is also currently an interested person of the Trust, as defined in the 1940 Act, due to her role as President of the Trust. |
CARAVAN FRONTIER MARKETS OPPORTUNITIES FUND
ADDITIONAL INFORMATION (Unaudited)
SEPTEMBER 30, 2019
Name and Year of Birth | Position with the Trust | Length of Time Served | Principal Occupation(s) During Past 5 Years |
| Officers | |||
Jessica Chase Born: 1970 | President; Principal Executive Officer | Since 2015 | Director, Apex Fund Services since 2019; Senior Vice President, Atlantic Fund Services 2008-2019. |
Karen Shaw Born: 1972 | Treasurer; Principal Financial Officer | Since 2013 | Senior Vice President, Apex Fund Services since 2019; Senior Vice President, Atlantic Fund Services 2008-2019. |
Zachary Tackett Born: 1988 | Vice President; Secretary and Anti-Money Laundering Compliance Officer | Since 2014 | Counsel, Apex Fund Services since 2019; Counsel, Atlantic Fund Services 2014-2019. |
Timothy Bowden Born: 1969 | Vice President | Since 2013 | Manager, Apex Fund Services since 2019; Manager, Atlantic Fund Services 2008-2019. |
Michael J. McKeen Born: 1971 | Vice President | Since 2013 | Senior Vice President, Apex Fund Services since 2019; Senior Vice President, Atlantic Fund Services 2008-2019. |
Geoffrey Ney Born: 1975 | Vice President | Since 2013 | Manager, Apex Fund Services since 2019; Manager, Atlantic Fund Services 2013-2019. |
Todd Proulx Born: 1978 | Vice President | Since 2013 | Manager, Apex Fund Services since 2019; Manager, Atlantic Fund Services 2013-2019. |
Carlyn Edgar Born: 1963 | Chief Compliance Officer | Since 2013 | Senior Vice President, Apex Fund Services since 2019; Senior Vice President, Atlantic Fund Services 2008-2019. |
CARAVAN FRONTIER MARKETS OPPORTUNITIES FUND
SUPRA INSTITUTIONAL SHARES (CSFOX)
FOR MORE INFORMATION:
P.O. Box 588
Portland, ME 04112
(844) 856-1516 (toll free)
INVESTMENT ADVISER
Caravan Capital Management, LLC
950 Pacific Avenue, Suite 500
Tacoma, WA 98402
TRANSFER AGENT
Apex Fund Services
P.O. Box 588
Portland, ME 04112
www.theapexgroup.com
DISTRIBUTOR
Foreside Fund Services, LLC
Three Canal Plaza, Suite 100
Portland, Maine 04101
www.foreside.com
This report is submitted for the general information of the shareholders of the Fund. It is not authorized for distribution to prospective investors unless preceded or accompanied by an effective prospectus, which includes information regarding the Fund’s risks, objectives, fees and expenses, experience of its management, and other information.
206-ANR-0919
| (a) | As of the end of the period covered by this report, Forum Funds II (the “Registrant”) has adopted a code of ethics, which applies to its Principal Executive Officer and Principal Financial Officer (the “Code of Ethics”). |
| (a) | Included as part of report to shareholders under Item 1. |
| (b) | Not applicable. |
| By: | /s/ Jessica Chase | |
| Jessica Chase, Principal Executive Officer | ||
| Date: | November 26, 2019 |
| By: | /s/ Jessica Chase | |
| Jessica Chase, Principal Executive Officer | ||
| Date: | November 26, 2019 |
| By: | /s/ Karen Shaw | |
| Karen Shaw, Principal Financial Officer | ||
| Date: | November 26, 2019 |