As filed on May 14, 2013
UNITED STATES
SECURITIES AND EXCHANGE COMMISSION
WASHINGTON, D.C. 20549
FORM 10
GENERAL FORM FOR REGISTRATION OF SECURITIES
Pursuant to Section 12(b) or 12(g) of the Securities Exchange Act of 1934
UBL INTERACTIVE, INC.
(Exact name of registrant as specified in its charter)
Delaware
(State of other jurisdiction of incorporation)
27-1077850
I.R.S. Employer Identification Number
6701 Carmel Road, Suite 202
Charlotte, NC 28226
(Address of Principal Executive Office) (Zip Code)
704-930-0297
(Registrant’s Telephone Number)
Copies to:
Marc Ross, Esq.
Marcelle S. Balcombe, Esq.
Sichenzia Ross Friedman Ference LLP
61 Broadway, 32nd Floor
NY, NY 10006
(212)930-9700
Securities to be registered under Section 12(b) of the Act:
| Title of each class | | Name of each exchange on which |
| To be so registered | | each class is to be registered |
| None | | None |
Securities to be registered under Section 12(g) of the Act:
| Common stock, par value $0. 01 per share | | None |
| (Title of class) | | |
Indicate by check mark whether the registrant is a large accelerated filer, an accelerated filer, a non-accelerated filer, or a smaller reporting company. See definitions of “large accelerated filer,” “accelerated filer,” and “smaller reporting company” in Rule 12b-2 of the Exchange Act. (Check one):
Large accelerated filer o | | Accelerated filer o |
| | | |
Non-accelerated filer o | | Smaller reporting company x |
| (Do not check if a smaller reporting company) | | |
| Item 1. | Business | 3 |
| Item 1A. | Risk Factors | 9 |
| Item 2. | Financial Information | 14 |
| Item 3. | Properties | 22 |
| Item 4. | Security Ownership of Certain Beneficial Owners and Management | 23 |
| Item 5. | Directors and Executive Officers | 23 |
| Item 6. | Executive Compensation | 25 |
| Item 7. | Certain Relationships and Related Transactions, and Director Independence | 27 |
| Item 8. | Legal Proceedings. | 27 |
| Item 9. | Market Price of and Dividends on the Registrant’s Common Equity and Related Stockholder Matters. | 28 |
| Item 10. | Recent Sales of Unregistered Securities | 28 |
| Item 11. | Description of Registrant’s Securities to be Registered | 32 |
| Item 12. | Indemnification of Directors and Officers | 33 |
| Item 13. | Financial Statements and Supplementary Data | 33 |
| Item 14. | Changes in and Disagreements with Accountants on Accounting and Financial Disclosure | 33 |
| Item 15. | Financial Statements and Exhibits | 34 |
Forward Looking Statements
There are statements in this Registration Statement that are not historical facts. These "forward-looking statements" can be identified by use of terminology such as "believe," "hope," "may," "anticipate," "should," "intend," "plan," "will," "expect," "estimate," "project," "positioned," "strategy" and similar expressions. You should be aware that these forward-looking statements are subject to risks and uncertainties that are beyond our control. Although we believe that the expectations reflected in such forward-looking statements, including those regarding future operations, are reasonable, we can give no assurance that such expectations will prove to be correct. Forward-looking statements are not guarantees of future performance and they involve various risks and uncertainties. Forward-looking statements contained in this document include statements regarding our proposed products, market opportunities and acceptance, expectations for revenues, cash flows and financial performance, and intentions for the future. Such forward-looking statements are included under Item 1. “Business” and Item 2. “Financial Information - Management’s Discussion and Analysis of Financial Condition and Results of Operation.” All forward-looking statements included in this document are made as of the date hereof, based on information available to us as of such date, and we assume no obligation to update any forward-looking statement. It is important to note that such statements may not prove to be accurate and that our actual results and future events could differ materially from those anticipated in such statements. Among the factors that could cause actual results to differ materially from our expectations are those described under Item 1. “Business” and Item 2. “Financial Information - Management’s Discussion and Analysis of Financial Condition and Results of Operations.” All subsequent written and oral forward-looking statements attributable to us or persons acting on our behalf are expressly qualified in their entirety by this section and other factors included elsewhere in this document. You should assume that the information contained in this document is accurate as of the date of this Form 10 only.
Overview
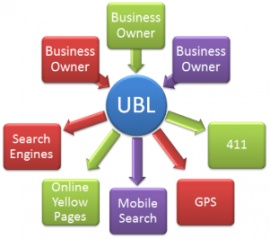
UBL Interactive Inc. (“we”, “us”, “our” or the “Company”) provides a comprehensive set of online identity management tools and services to businesses seeking to optimize their presence in location based search results on web, mobile and social platforms. These search results typically are highly structured and include name, address, phone number and enhanced profile information, as opposed to excerpts of website information. Our Universal Business Listing (www.UBL.org) service provides a cost-effective method for ensuring the distribution and accuracy of individual business listing data across hundreds of local web directories, search engines, mobile applications and other sources of local listings data. Our profile management services allow businesses to take control of profile pages in leading, highly trafficked, search engines and social media sites, providing enhanced content about their products and services. As part of these services we also provide an expanding range of analytical and monitoring tools to increase our customer value proposition. We offer services in the USA, Canada, The United Kingdom and Australia.
Identity management services are key building blocks for businesses seeking an affordable way to exploit consumer usage on web, mobile and social platforms. Accurate listings generate value for clients in the form of customer leads and sales by increasing the relevance of businesses in search results. These profile management services allow companies to build and manage representations of their businesses, and provide access to large populations of consumers directly within leading search, social and mobile platforms. Given the rapidly growing volumes of local search and social activity through the web and mobile devices, we believe the services we provide are valuable to any company, from single-owner home-operated businesses, to multi-location enterprises.
We believe our revenue model is simple and powerful for users and partners alike. Our product offerings have grown from a simple single-offer “Business Listing Syndication” service at $30/year, to our current portfolio “Business Profile Management” products, targeting all sizes of businesses with a range from $79/year up to $799/year per outlet. By providing the right mix of listing and analytics products, we believe that we will be able to increase our average revenue per unit (ARPU), strengthen our relationships with customers and increase retention. With substantial discounts for wholesale agencies and commissions for online affiliates, we also believe we represent an attractive revenue generating opportunity for traditional and emerging channels seeking to transition from legacy media to online models.
We provide our listing services to businesses directly from our site, and through interactive marketing agencies and channel sales partnerships. Through our website, UBL.org (“UBL”), we offer a centralized platform for businesses to manage their online profile information and distribute accurate listing data to more than 300 search engines, directory publishers, social networks and mobile services, which collectively process substantially all of the local search queries in the United States. In addition to direct submissions through our website, we also manage bulk listing feeds from agencies and channel partners through database templates and application programming interfaces (APIs), which are direct data connections. We also operate an affiliate program which shares revenues with publishers for referrals and have over 300 agency and 200 affiliate partners under contract, who manage tens of thousands of businesses submitted through the platform.
Our distribution network consists of a broad set of online business directories including Supermedia.com and YP.com, search engines including, Google, Yahoo! and Bing, social networks, like Facebook and Twitter, and local guides including AOL, CitySearch and Yelp. We also distribute listings across a wide range of 411 directory assistance, GPS navigation, mobile data services, and other mobile services including OnStar. Augmenting our direct data submissions with publishers, we also have contractual relationships with large data aggregators such as Infogroup and Acxiom, which provide the primary databases of business listings to major search sites such as Google and Bing. Infogroup and other large data aggregators, as well as emerging suppliers like Factual are significant players in business profile visibility.
The Problem
Businesses of all sizes now need to be found online, and they invest resources in achieving that goal, principally through interactive marketing including advertising, website creation, search engine optimization, managing external directory listings and creating business profile pages on highly trafficked web sites. While many businesses use paid search and search engine optimization (SEO) to improve visibility, the intense competition among businesses seeking to reach consumers through paid search and SEO has led to a rapid increase in costs. Managing paid listing campaigns across multiple search providers is also complicated and time consuming for most companies, particularly small businesses. Managing SEO campaigns can also be expensive and there is no guarantee of success in a rapidly changing search landscape. As a result of the high overall costs of search marketing, many businesses, large and small, are expanding their activities to include listing and profile page management.
While the opportunity for businesses seeking to take advantage of online traffic through listing and profile management is clear, the large number of directories and the resulting fragmentation of consumer usage makes maintaining a fully-distributed, accurate, online identity difficult for businesses of every size. As the popular ” Local Search Ecosystem” map from GetListed.org below illustrates, the sheer volume and complexity of listing traffic sources makes the task of identifying and listing accurate and consistent information across the directory landscape burdensome. Ongoing maintenance of listing information is a critical and time consuming process particularly for large enterprises with hundreds or thousands of outlets. Our tests show it would take approximately 40 hours annually for even a single-location business to manually submit their listings data to a representative group of the most popular directories. In many instances publishers do not permit submissions.
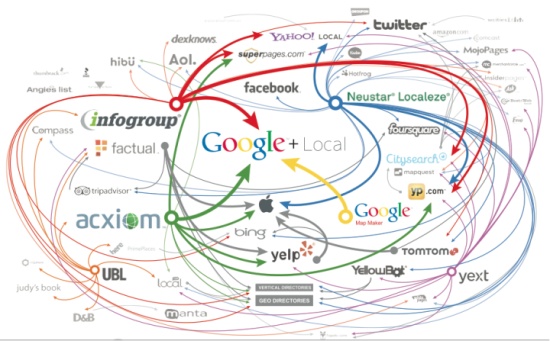
(Graphic courtesy GetListed.org)
Based on our research there are errors in over 30% of the name, address, phone number and website address information of small business and enterprise listings. Enhanced profile information, such as product descriptions and hours of operation, is regularly found to be inconsistent, incomplete or missing entirely. While small business listings are less volatile, at the enterprise level, changes caused by mergers, office relocations, branch closures, phone system changes and local managers not following corporate branding conventions, frequently result in inaccurate information across listings. Correcting these issues requires regular maintenance and management on a broad scale.
Profile pages, particularly on large, highly trafficked search engines, social media sites and vertical content sites represent a key source of information about the business and drive significant volume of their customer connections. As the web evolves, profile “places” pages in major search engines and “fan” pages on social media sites are becoming a key element in their strategies to capture rich, relevant business information and establish relationships with small businesses and enterprises. In a similar way, profile pages on vertical and local media sites in high value categories are an increasingly important part of the underlying business models of these publishers.
For businesses, profile pages represent a powerful format for converting consumers into active sales leads, particularly in search engines where competition is fierce and listings are prominently featured at the top of search results. The combination of prominence, rich presentation attributes, and a growing set of promotional tools gives businesses, small and large, the ability to generate free leads and lower acquisition costs. In the same way, highly trafficked search, social, vertical and local sites competing to attract a critical mass of consumers for high frequency local searches, benefit from rich and relevant business content and offers. Given high levels of competition between these sites in the race to lock in local search audiences, competitors in all of these categories will continue to promote business profiles, expanding the range of features and tools to stimulate adoption.
For small businesses and multi-location enterprises, managing owner-verified or “claimed” business profiles across search, social and vertical sites presents many of the same challenges as basic listings management. Regular updates, proprietary tool sets and data elements, particularly for businesses that need representation across multiple search, social and vertical sites, make the process time consuming and complex. As with listings management, we believe that for many, if not all small businesses and multi-outlet enterprises the complexities of profile management will ultimately force them to out-source these activities to specialist companies like us, which operate at scale and have the processes and technologies to manage identity management across thousands of businesses.
The other aspect of the problem is that businesses find it difficult to analyze the accuracy of their data online as well as to monitor the activity coming from these listings. Whilst website analytics are very established for owned sites, the ability to analyze information across numerous publishers is very challenging. This includes data reports on where the listings are present, and if they are accurate or incomplete. In addition, Companies are increasingly looking for additional data on user interactions including reviews, ratings, and what pageviews, clicks, or calls have occurred.
Our solution:
We provide a self-serve platform and managed services that help businesses of all sizes to manage listing information and business profiles across key distribution networks. Our platform operates as a direct-to-business e-commerce platform for purchase and management of profiles through a user-friendly interface and reporting dashboard. The platform is highly scalable and can be used by agencies and resellers for bulk uploading of enterprise files. To facilitate bulk uploads the platform has APIs and can be private labeled for partners looking to manage customers under their own brands. As part of our offering, we also provide managed services for customers who do not want to use our self-service interfaces.
Listings managed by us are normalized and distributed to more than 300 directory publishers. Profile pages are distributed across major search engines, social media and directory sites. At the listing level our platform ensures accurate and current business data are regularly updated and distributed across the web. At an owner-verified profile page level, our managed services ensure that information about a business is available to consumers in highly trafficked search, social and vertical sites. By using our platform and profile claiming services, we believe businesses save time and money, immediately increase their visibility (online and mobile), improve organic search results, increase the number of leads and sales, and minimize the opportunity cost of inaccurate data.
For the individual entity the value of our service is seen as cost-efficient and more comprehensive than they could do themselves. For the reseller channels there is the additional value of ease of integration, and pure white labeling of a service that adds to their revenue and customer retention.
As part of our service we provide identity “audits” for both individual businesses and enterprises, which analyze the consistency of listings across the major search, and directory sites, highlighting inaccuracies. Based on this data, we are able to show our customers the effectiveness of our listing management processes. We also provide customers with visibility reports across the time-span of the year, so they can track the growth and effectiveness of the number of sites that display the profiles. Advanced agencies are able to track clicks or visits from such links and leverage this information to extrapolate a financial return for their clients.
Products
Our products, which serve the need for business identity management, can be categorized as follows:
Listing Syndication – Our listing syndication packages are sold as tiered packages, with components based on the varying needs of businesses, from basic identity distribution to full optimization of content for search engine visibility. In addition to our use of large database aggregators like Infogroup and Acxiom for listing syndication and distribution, we are increasingly establishing direct data relationships with publishers in the interests of speed, reporting and performance. The move to direct relationships is made possible by the increasing availability of APIs that allow automated export of listing and profile data directly into publisher databases .We expect that this trend will continue and that over time, we will have a much broader base of direct listing partnerships. We call our publisher feeds, UBL Direct. The syndication packages we currently sell include:
| ● | Basic – Core listing to over 300 consumer search locations (e.g. local search, yellow pages, 411, GPS, social networks) through submission to the main listings databases, and public SEO-optimized web card, showing the profile. This is only available to Enterprise customers with many locations, and often includes bulk Google and Bing data uploads. |
| ● | Essential – Includes the basic package described above and UBL Direct submissions to 20 major sites and distributors (eg: Yelp, Yahoo Local, Foursquare, Local.com, Factual) and visibility report which shows the growth of distribution as a result of the syndication. |
| ● | Premium – Includes the Essential package described above, plus password-protection claimed “ownership” of profiles on key search and social sites (e.g. Yahoo, Bing, Google, Facebook, Twitter, SuperPages, Mapquest and YP.com). |
| ● | Professional – Includes premium package described above, as well as content, features and functions to optimize a business identity for search engine discovery. This includes production of a video profile and submission to video search engines, articles creation and blog submissions. |
| ● | UBL Express – Adds real-time capability for insertion and updating of listings, as well as activity data. |
Analytics and Reputation Management – We also sell a set of presence auditing tools that analyze, monitor and send alerts to businesses about information relating to the visibility, accuracy or their business profiles online. This includes monitoring reviews, ratings, sentiments and blog mentions on local businesses. It also includes visibility reports that show in detail the accuracy of listings online and the growing numbers of links generated on external directories from the UBL syndication process. These are sold individually or a series of reports, as well as a subscription service under the company’s LocationMonitor.com branded website. LocationMonitor is also available as a white-label and API solution for large partners and channels.
Technology
We own and control our technology platform, but also integrate third party data sources, solutions and technologies depending on factors such as the cost/benefit of development, market experimentation and competition. Our platform runs on Microsoft .Net and Sequel technologies, housed in a secure data center in Charlotte, North Carolina backed up daily, off-site and with redundant fail-over servers. Our team is experienced in managing customer-facing web sites and content databases. We have developed specialized technologies and processes for the purpose of listing syndication and identity analytics. We intend to continue to invest in these technologies to provide the most advanced set of solutions for our customer base.
We believe that we have among the most comprehensive lists of data fields of any listing management provider, so that virtually all information sought by publishers is available for their data-bases. We are continually expanding our data model to broaden the range of products and services we can represent for our customers. We have also developed advanced conversion systems that allow us to categorize, convert and structure data in the wide range of proprietary formats required by database vendors and publishers.
We believe we have valuable intellectual property and are preparing multiple patents for our methods of managing the claiming process of listing management, as well as certain analytics aggregation.
Sales and Marketing
We sell our products through four distinct sales channels, (1) Direct Website Sales, (2) Enterprise Customers and their Marketing Agencies, and (3) Channel Resellers as described below.
| 1) | Direct Website Sales – Direct e-commerce customers are typically small businesses or their agents in local markets |
| 2) | Enterprise & Agencies: Multi-outlet enterprises such as national or regional bank chains, national insurance agencies, rental car firms, retailers, restaurant chains and franchises. Agency customers are typically stand-alone specialized internet marketing or SEO, local SEO, web design firms or groups within general agencies. |
| 3) | Channel partners: Channel partners are typically publishers and business services suppliers with large bases of small and medium businesses such as Yellow Page directories, newspapers, check and business card printers, or telecommunication companies. |
UBL Direct E-Commerce – Sales to businesses via Website
We promote our services through both “inbound” and “outbound” marketing programs. Inbound marketing programs focus on search engine optimization (SEO), and search engine marketing (SEM) which lead users from major search engines to our website. Businesses that purchase directly from us or their agencies can log on via our website to submit listings, select packages, pay, and subsequently manage their listings within us through a self-service dashboard.
Social media promotion focuses on UBL and independent industry commentators publishing articles, blogs, and “tweets”, about the success of our solution. We also promote our direct retail services through an affiliate program where referrers to our website earn a commission on resultant sales.
Our marketing strategy for retail acquisition includes:
| ● | Search Engine Optimization – ensuring all our site pages communicate their content well |
| ● | Site design, communication and customer purchase flow – adding shopping cart, videos and instructions |
| ● | Search Marketing – buying keywords on Google, Bing |
| ● | Industry sites and blogs – advertising on content-specific forums |
| ● | Social Advertising – LinkedIn, Facebook, Twitter |
| ● | Social Networks and Blogs – creating compelling content and communications |
| ● | Public Relations – Press releases, article contributions and comments |
| ● | Email marketing – list marketing and re-marketing to existing customers |
| ● | Affiliate network promotions |
Agency Sales
Sales of our products through ad agencies and other resellers are an important part of our business and we use a variety of methods to promote our services to them. For the reseller market, in particular the large interactive agencies and agencies selling into the business directories, we staff a small dedicated national sales team with decades of marketing experience in the field. This consultative sales team maintains an active database of potential customers and will regularly call and visit with them in person around the country or at the trade conferences.
We promote our services through presentations and exhibition at industry events and actively participate in industry organizations serving the advertising, franchise and enterprises marketing industries. As members of the Interactive Advertising Bureau (IAB) we were key contributors to the IAB Local Search White Paper. Our website presents multiple opportunities for agencies, SEO and Search Engine Marking companies, website designers, and other businesses to understand our products and the opportunity to resell our services. We also provide a wide range of resellers the ability to log on to our website to submit listings, select packages, pay, and manage their customers’ listings utilizing our self-service user interface.
Channel Resellers
Larger resellers with substantial numbers of small and medium sized businesses include our services as integral components of their own offerings, sometimes directly to end businesses and sometimes integrated into platforms that they provide to their own channel partners. We anticipate that these resellers, who combined, touch most small businesses in the USA, will continue to be an important part of our customer mix. Many of these channels are seeking to expand their relationships with their customers and products like ours fit well in their strategies.
We reach channel resellers through promotion methods similar to those we use to reach agency channels and through targeted business development activities. Reseller partnerships have a longer sales cycle and typically require technical integration and ongoing marketing and sales assistance. In many cases our channel partners’ users interact with our own sales channels, which may be tele-sales, field-sales, or self-service website dashboard and require targeted messaging related to their bundles of other services, integration through the UBL service APIs and/or through our bulk upload.
Market Opportunity
The market size for location based services is expected to reach $10 billion by 2016. In the United States, there are approximately 29 million business establishments, approximately 2.2 million in the U.K., approximately and1 million in Canada.) It is important for every one of these locations that their identity is well managed. Furthermore, additional data points and meaningful identity descriptors are being added every year. Through our work online with global interactive advertising agencies and channel partners, we believe we are in a position to provide foundational identity services to businesses worldwide.
We also believe that profile claiming and management will become increasingly important for businesses as highly trafficked search, social and vertical sites promote proprietary profile formats in their search results and extend functionality in an effort to stimulate adoption and usage among businesses of all sizes. As the number and importance of profile products increases, we believe that businesses of all sizes will begin outsourcing profile management to specialists like UBL.
Competition
We operate in a competitive industry. We face competition from some data aggregators, such as Localeze, who feed business listings to search platforms. These data aggregators offer a service to have clients feed direct into their dataset, but each is limited only to their own distribution channels. We also face competition from interactive agencies. Several of the larger interactive agencies, particularly those from the Yellow Pages industry, have contracted direct with data aggregators and offer aspects of our service. We also face competition from emerging platform providers focused on real-time updating of listing information within limited paid syndication networks of secondary sites.
We believe success in the listings management space is driven by an integrated combination of data, distribution relationships, managed services, analytics and technologies. Assets and expertise in each of these areas are required to stay competitive today and will become increasingly important as the market matures. We believe that we are well positioned in all of these areas:
Distribution - We have a broad and expanding listings distribution network and a growing number of direct publisher relationships. We also have long standing partnerships with key database distributors who supply national and international directories, search engines and device manufacturers with core date sets.
Product & Services - Our platform provides a single direct website for clients, enterprise clients and resellers, allowing us to balance our revenues and opportunities with a single platform. Additionally, any marketing that is targeted to one sector spills over in value to the others. We offer a wide range of products and services for small businesses and large volume enterprises
Analytics & Reputation Management – We provide detailed reporting on the presence and accuracy of business listings. We also provide reputation management tools that offer details and alerts about reviews, ratings and other user engagement with listings.
Technology - We believe we have developed patentable IP to blend automated and hand-crafted submission activities in a way that produces higher yields and more cost effective lead generation.
Intellectual Property
We are filing for provisional patents on our platform and two of our programming applications. We have filed for a trademark on the name Universal Business Listing but this had not yet been approved by the trademark office.
Research and Development (R&D)
We are engaged in ongoing R&D across our whole range of products and services. We intend to improve our customer-interfaces and refine our processes for syndication, analysis, presentation and validation, which will consist primarily of improvements to core existing products. The development will also be to support marketing campaigns and methods with tools and special promotional pages. We regularly research new geographic markets, technology enhancements and related identity management concepts as part of standard business development and technology activities. We have not undertaken any material research and development activities or for third parties, outside of work done in the course of operating and improving our services through the efforts of our technical staff and do not expect to in the future.
Government Regulation
We are subject to numerous domestic and foreign laws and regulations covering a wide variety of subject matter. New laws and regulations (or new interpretations of existing laws and regulations) may also impact our business. The costs of compliance with these laws and regulations are high and are likely to increase in the future and any failure on our part to comply with these laws may subject us to significant liabilities and other penalties.
Corporate Information
We are a Delaware corporation headquartered in Charlotte, NC. We also have staff presence in California and New York. Our principal office is located at 6701 Carmel Road, Suite 202, Charlotte, NC 28226 and our telephone number is 704-930-0302. We maintain a website at www.UBL.org. The contents of our website are not part of this prospectus and should not be relied upon with respect to this offering.
Employees
We currently have 23 employees, of which 18 are full time employees.
Risks Related to Our Business
We are a development stage company and may never commercialize any of our products or services or earn a profit.
We are a development stage company and have incurred losses since we were formed. As of December 31, 2012 and September 30, 2012, we have an accumulated total deficit of $4,697,308 and $4,052,534, respectively. For the fiscal year ended September 30, 2012 and the three months ended December 31, 2012, we had net losses attributable to common stockholders of $2,036,216 and $644,774, respectively. We cannot predict the extent of future net losses, or when we may attain profitability, if at all. If we are unable to generate significant revenue or attain profitability, we will not be able to sustain operations.
Because of the numerous risks and uncertainties associated with developing and commercializing our technology, we are unable to predict the extent of any future losses or when we will become profitable, if ever. We may never become profitable and you may never receive a return on an investment in our common stock. An investor in our common stock must carefully consider the substantial challenges, risks and uncertainties inherent in the attempted development and commercialization of our technology.
We have a limited operating history and are subject to the risks encountered by early-stage companies.
Because we have a limited operating history, we encounter risks and uncertainties frequently experienced by early-stage companies in rapidly evolving markets. For us, these risks include:
| ● | risks associated with our dependence on our premier platforms and related services; |
| | |
| ● | risks that our growth strategy may not be successful; and |
| | |
| ● | risks that fluctuations in our operating results will be significant relative to our revenues. |
Our future growth will depend substantially on our ability to address these and the other risks described in this section. If we do not successfully address these risks, our business would be significantly harmed.
Our independent registered public accounting firm has expressed doubt about our ability to continue as a going concern, which may hinder our ability to obtain future financing.
In their report dated May 1, 2013 our independent registered public accountants stated that our financial statements for the year ended September 30, 2012 were prepared assuming that we would continue as a going concern. Our ability to continue as a going concern, which may hinder our ability to obtain future financing, is an issue raised as a result of recurring losses from operations. We continue to experience net operating losses. Our ability to continue as a going concern is subject to our ability to generate a profit and/or obtain necessary funding from outside sources, including obtaining additional funding from the sale of our securities, increasing sales or obtaining loans and grants from various financial institutions where possible. Our continued net operating losses increase the difficulty in meeting such goals and there can be no assurances that such methods will prove successful.
We will need to raise substantial additional capital to commercialize our technology, and our failure to obtain funding when needed may force us to delay, reduce or eliminate our product development programs or collaboration efforts.
As of December 31, 2012 our cash balance was $337,465 and our working capital deficit was $1,537,037. Our existing capital resources are not sufficient to fund our operations for the next 12 months. At our current burn rate, we estimate that our existing capital resources will fund our operations for the next 10 months. We estimate that we will require approximately $2.0 million over the next 12 months in order to sustain our operations and implement our business strategy. Consequently, we will be required to raise additional capital to complete the development and commercialization of our current product candidates. The development of our business will require substantial additional capital in the future to conduct research and development and commercialize our technology. When we seek additional capital, we may seek to sell additional equity and/or debt securities or to obtain a credit facility, which we may not be able to do on favorable terms, or at all. Our ability to obtain additional financing will be subject to a number of factors, including market conditions, our operating performance and investor sentiment. If we are unable to raise additional capital when required or on acceptable terms, we may have to significantly delay, scale back or discontinue the development and/or commercialization of one or more of our product candidates, restrict our operations or obtain funds by entering into agreements on unattractive terms.
Our stockholders may experience significant dilution as a result of any additional financing using our equity securities and/or debt securities
To the extent that we raise additional funds by issuing equity securities or convertible debt securities, our stockholders may experience significant dilution. Sale of additional equity and/or convertible debt securities at prices below certain levels will trigger anti-dilution provisions with respect to certain securities we have previously sold. If additional funds are raised through a credit facility or the issuance of debt securities or preferred stock, lenders under the credit facility or holders of these debt securities or preferred stock would likely have rights that are senior to the rights of holders of our common stock, and any credit facility or additional securities could contain covenants that would restrict our operations.
If our product is unable to compete effectively with current and future online media and web marketing companies targeting similar markets as our potential products, our commercial opportunities will be reduced or eliminated.
The web marketing industry is intensely competitive and characterized by rapid technological progress. In each of our potential product areas, we face significant competition from larger and better funded companies. The technologies associated with the web marketing and online media industry are evolving rapidly and there is intense competition within such industry. Moreover, these and other future competitors have or may have considerably greater resources than we do in terms of technology, sales, marketing, commercialization and capital resources. These competitors may have substantial advantages over us in terms of research and development expertise, brand name exposure and expertise in sales and marketing as well as in operating web marketing services. Many of these organizations have financial, marketing and human resources greater than ours; therefore, there can be no assurance that we can successfully compete with present or potential competitors or that such competition will not have a materially adverse effect on our business, financial position or results of operations.
Our business depends on a strong brand, and if we are not able to maintain and enhance our brand, or if we receive unfavorable media coverage, our ability to expand our base of clients will be impaired and our business and operating results will be harmed.
We believe that the brand identity that we have developed has significantly contributed to the success of our business. We also believe that maintaining and enhancing the "UBL" brand is critical to expanding our base of clients. Maintaining and enhancing our brand may require us to make substantial investments and these investments may not be successful. If we fail to promote and maintain the "UBL" brand, or if we incur excessive expenses in this effort, our business, prospects, operating results and financial condition will be materially and adversely affected. We anticipate that, as our market becomes increasingly competitive, maintaining and enhancing our brand may become increasingly difficult and expensive. Unfavorable publicity or consumer perception of our platforms, applications, practices or services, could adversely affect our reputation, resulting in difficulties in recruiting, decreased revenue and a negative impact on the number of clients and the size of our, the loyalty of our clients and the number and variety of services we offer each day. As a result, our business, prospects, results of operation and financial condition could be materially and adversely affected.
New tax treatment of companies engaged in internet commerce may adversely affect the commercial use of our services and our financial results.
Due to the global nature of internet services, it is possible that various states or foreign countries might attempt to regulate our transmissions or levy sales, income or other taxes relating to our activities. Tax authorities at the international, federal, state and local levels are currently reviewing the appropriate treatment of companies engaged in internet commerce. New or revised international, federal, state or local tax regulations may subject us or our publishers to additional sales, income and other taxes. We cannot predict the effect of current attempts to impose sales, income or other taxes on commerce over social media. New or revised taxes and, in particular, sales taxes, VAT and similar taxes would likely increase the cost of doing business online and decrease the attractiveness of advertising and selling goods and services over social media. New taxes could also create significant increases in internal costs necessary to capture data, and collect and remit taxes. Any of these events could have an adverse effect on our business and results of operations.
Our business depends on our ability to maintain and scale the network infrastructure necessary to operate our platforms and applications, and any significant disruption in service on our platforms and applications could result in a loss of publishers or clients.
Clients access our services through our platforms and applications. Our reputation and ability to acquire, retain and serve our clients are dependent upon the reliable performance of our platforms and applications and the underlying network infrastructure. As our client base continues to grow, we will need an increasing amount of network capacity and computing power. We have spent and expect to continue to spend substantial amounts for data centers and equipment and related network infrastructure to handle the traffic on our platforms and applications. The operation of these systems is expensive and complex and could result in operational failures. In the event that our client base or the amount of traffic on our platforms and applications grows more quickly than anticipated, we may be required to incur significant additional costs. Interruptions in these systems, whether due to system failures, computer viruses or physical or electronic break-ins, could affect the security or availability of our platforms and applications, and prevent our publishers and advertisers from accessing our services. A substantial portion of our network infrastructure is hosted by third-party providers. Any disruption in these services or any failure of these providers to handle existing or increased traffic could significantly harm our business. Any financial or other difficulties these providers face may adversely affect our business, and we exercise little control over these providers, which increases our vulnerability to problems with the services they provide. If we do not maintain or expand our network infrastructure successfully or if we experience operational failures, we could lose current and potential publishers and clients, which could harm our operating results and financial condition.
We depend upon our officers, and if we are not able to retain them or recruit additional qualified personnel, the commercialization of our product candidates and any future tests that we develop could be delayed or negatively impacted.
Our success is largely dependent upon the continued contributions of our officers such as our current key employee, Mr. Doyal Bryant, Chief Executive Officer. Our success also depends in part on our ability to attract and retain highly qualified scientific, commercial and administrative personnel. In order to pursue our business strategies, we will need to attract and hire, or engage as consultants, additional personnel with specialized experience in a number of disciplines. There is intense competition for personnel in the fields in which we operate. If we are unable to attract new employees and retain existing employees, the development and commercialization of our product candidates could be delayed or negatively impacted.
A variety of new and existing U.S. and foreign laws could subject us to claims or otherwise harm our business.
We are subject to numerous U.S. and foreign laws and regulations covering a wide variety of subject matters. New laws and regulations (or new interpretations of existing laws and regulations) may also impact our business. The costs of compliance with these laws and regulations are high and are likely to increase in the future. Any failure on our part to comply with these laws and regulations can result in negative publicity and diversion of management time and effort and may subject us to significant liabilities and other penalties.
Furthermore, many of these laws were adopted prior to the advent of the internet and related technologies and, as a result, do not contemplate or address the unique issues of the internet and related technologies. The laws that do reference the internet are being interpreted by the courts, but their applicability and scope remain uncertain.
If we are unable to protect our intellectual property effectively, we may be unable to prevent third parties from using our technologies, which would impair our competitive advantage.
We rely on a combination of trade secret protection, and other contractual restrictions to protect our proprietary technologies, all of which provide limited protection and may not adequately protect our rights or permit us to gain or keep any competitive advantage. If we fail to protect our intellectual property, we will be unable to prevent third parties from using our technologies and they will be able to compete more effectively against us.
We cannot assure you that any of our currently pending or future patent applications will result in issued patents, or that any patents issued to us will not be challenged, invalidated or held unenforceable. We cannot guarantee you that we will be successful in defending challenges made in connection with our patents and patent applications.
We rely on contractual restrictions to protect our proprietary technology. We require our employees and third parties to sign confidentiality agreements and employees to also sign agreements assigning to us all intellectual property arising from their work for us. Nevertheless, we cannot guarantee that these measures will be effective in protecting our intellectual property rights.
If we fail to maintain effective internal controls over financial reporting, the price of our common stock may be negatively affected.
Because we have not yet evaluated the effectiveness of our internal control over financial reporting, it may have weaknesses and conditions that could require correction or remediation, the disclosure of which may have a negative impact on the price of our common stock. We are required to establish and maintain appropriate internal controls over financial reporting. Failure to establish those controls, or any failure of those controls once established, could adversely impact our public disclosures regarding our business, financial condition or results of operations. In addition, management’s assessment of internal controls over financial reporting may identify weaknesses and conditions that need to be addressed in our internal controls over financial reporting or other matters that may raise concerns for investors. Any actual or perceived weaknesses and conditions that need to be addressed in our internal control over financial reporting, disclosure of management’s assessment of our internal controls over financial reporting or disclosure of our public accounting firm’s attestation to or report on management’s assessment of our internal controls over financial reporting may have a negative impact on the price of our common stock.
If we fail to comply in a timely manner with Section 404 of the Sarbanes Oxley Act of 2002, our business could be harmed and our stock price could decline.
Rules adopted by the SEC pursuant to Section 404 of the Sarbanes-Oxley Act of 2002 require annual assessment of our internal controls over financial reporting. The standards that must be met for management to assess the internal controls over financial reporting as effective are evolving and complex, and require significant documentation, testing and possible remediation to meet the detailed standards. We expect to incur significant expenses and to devote resources to Section 404 compliance on an ongoing basis. It is difficult for us to predict how long it will take or costly it will be to complete the assessment of the effectiveness of our internal control over financial reporting for each year and to remediate any deficiencies in our internal control over financial reporting. As a result, we may not be able to complete the assessment and remediation process on a timely basis. In the event that our chief executive officer or chief financial officer determine that our internal control over financial reporting is not effective as defined under Section 404, we cannot predict how regulators will react or how the market price of our shares will be affected; as such, we believe that there is a risk that investor confidence and share value may be negatively impacted.
Risks Related to Our Common Stock
There is no established trading market for our common stock and as a result you may not be able to sell our common stock.
There is no established market for our common stock and there may never be a market for our common stock. In the absence of an active trading market, you may have difficulty buying and selling or obtaining market quotations; the market visibility for our stock may be limited, and the lack of visibility for our common stock may have a depressive effect on the market price for our common stock.
The rights of the holders of common stock may be impaired by the potential issuance of preferred stock.
Our certificate of incorporation gives our board of directors the right to create new series of preferred stock. As a result, the board of directors may, without stockholder approval, issue preferred stock with voting, dividend, conversion, liquidation or other rights which could adversely affect the voting power and equity interest of the holders of common stock. Preferred stock, which could be issued with the right to more than one vote per share, could be utilized as a method of discouraging, delaying or preventing a change of control. The possible impact on takeover attempts could adversely affect the price of our common stock. Although we have no present intention to issue any additional shares of preferred stock or to create any new series of preferred stock, we may issue such shares in the future.
Our common stock price may be volatile and could fluctuate widely in price, which could result in substantial losses for investors.
The market price of our common stock is likely to be highly volatile and could fluctuate widely in price in response to various factors, many of which are beyond our control, including:
| ● | technological innovations or new products and services by us or our competitors; |
| ● | the establishment of partnerships with third parties; |
| | |
| ● | intellectual property disputes; |
| | |
● | additions or departures of key personnel; |
| | |
| ● | sales of our common stock; |
| | |
| ● | our ability to integrate operations, technology, products and services; |
| | |
| ● | our ability to execute our business plan; |
| | |
| ● | operating results below expectations; |
| | |
| ● | loss of any strategic relationship; |
| | |
| ● | industry developments; |
| | |
| ● | economic and other external factors; and |
| | |
| ● | period-to-period fluctuations in our financial results. |
In addition, trading in stock traded over the counter on the pink sheets is often thin and characterized by wide fluctuations in trading prices, due to many factors that may have little to do with a company’s operations or business prospects. This volatility could depress the market price of our common stock for reasons unrelated to our business or operating performance. Moreover, trading is often more sporadic than the trading of securities listed on a quotation system like NASDAQ or a stock exchange like the NYSE Amex. Accordingly, shareholders may have difficulty reselling any of their shares of common stock.
If our common stock is subject to the SEC’s penny stock rules, broker-dealers may experience difficulty in completing customer transactions and trading activity in our securities may be adversely affected.
Unless our securities are listed on a national securities exchange, or we have net tangible assets of $5,000,000 or more and our common stock has a market price per share of $5.00 or more, transactions in our common stock will be subject to the SEC’s “penny stock” rules. If our common stock is subject to the “penny stock” rules promulgated under the Securities Exchange Act of 1934, broker-dealers may find it difficult to effectuate customer transactions and trading activity in our securities may be adversely affected.
Under these rules, broker-dealers who recommend such securities to persons other than institutional accredited investors must:
| ● | make a special written suitability determination for the purchaser; |
| | |
| ● | receive the purchaser’s written agreement to the transaction prior to sale; |
| | |
| ● | provide the purchaser with risk disclosure documents which identify certain risks associated with investing in “penny stocks” and which describe the market for these “penny stocks” as well as a purchaser’s legal remedies; and |
| | |
| ● | obtain a signed and dated acknowledgment from the purchaser demonstrating that the purchaser has actually received the required risk disclosure document before a transaction in a “penny stock” can be completed. |
As a result, if our common stock becomes subject to the penny stock rules, the market price of our securities may be depressed, and you may find it more difficult to sell our securities.
Because certain of our stockholders control a significant number of shares of our common stock, they may have effective control over actions requiring stockholder approval.
As of May 13, 2013, our directors, executive officers and principal stockholders, and their respective affiliates, beneficially own approximately 39.1% of our outstanding shares of common stock. As a result, these stockholders, acting together, would have the ability to control the outcome of matters submitted to our stockholders for approval, including the election of directors and any merger, consolidation or sale of all or substantially all of our assets. In addition, these stockholders, acting together, would have the ability to control the management and affairs of our company. Accordingly, this concentration of ownership might harm the market price of our common stock by:
| ● | delaying, deferring or preventing a change in corporate control; |
| ● | impeding a merger, consolidation, takeover or other business combination involving us; or |
| | |
| ● | discouraging a potential acquirer from making a tender offer or otherwise attempting to obtain control of us. |
We have not paid dividends on our common stock in the past and do not expect to pay dividends on our common stock for the foreseeable future. Any return on investment may be limited to the value of our common stock.
No cash dividends have been paid on our common stock. We expect that any income received from operations will be devoted to our future operations and growth. We do not expect to pay cash dividends on our common stock in the near future. Payment of dividends would depend upon our profitability at the time, cash available for those dividends, and other factors as our board of directors may consider relevant. If we do not pay dividends, our common stock may be less valuable because a return on an investor’s investment will only occur if our stock price appreciates. Investors in our common stock should not rely on an investment in our company if they require dividend income.
Delaware law and our corporate charter and bylaws will contain anti-takeover provisions that could delay or discourage takeover attempts that stockholders may consider favorable.
Provisions in our certificate of incorporation and bylaws may have the effect of delaying or preventing a change of control or changes in our management. For example, our board of directors have the authority to issue up to 10,000,000 shares of preferred stock in one or more series and to fix the powers, preferences and rights of each series without stockholder approval. The ability to issue preferred stock could discourage unsolicited acquisition proposals or make it more difficult for a third party to gain control of our company, or otherwise could adversely affect the market price of our common stock. Our bylaws require that any stockholder proposals or nominations for election to our board of directors must meet specific advance notice requirements and procedures, which make it more difficult for our stockholders to make proposals or director nominations.
Furthermore, because we are incorporated in Delaware, we are governed by the provisions of Section 203 of the Delaware General Corporation Law. These provisions may prohibit or restrict large stockholders, in particular those owning 15% or more of our outstanding voting stock, from merging or combining with us. These provisions in our certificate of incorporation and bylaws and under Delaware law could discourage potential takeover attempts and could reduce the price that investors might be willing to pay for shares of our common stock in the future and result in our market price being lower than it would without these provisions.
A sale of a substantial number of shares of our common stock may cause the price of our common stock to decline and may impair our ability to raise capital in the future.
The market price of our common stock could decline as a result of sales of substantial amounts of our common stock in the public market, or the perception that these sales could occur. In addition, these factors could make it more difficult for us to raise funds through future offerings of common stock.
| Item 2. | Management’s Discussion and Analysis of Financial Condition and Results of Operations. |
You should read this discussion together with the Financial Statements, related Notes and other financial information included elsewhere in this Form 10. The following discussion contains assumptions, estimates and other forward-looking statements that involve a number of risks and uncertainties, including those discussed under “Risk Factors,” and elsewhere in this Form 10. These risks could cause our actual results to differ materially from those anticipated in these forward-looking statements.
OVERVIEW
We provide a comprehensive set of online identity management tools and services to businesses seeking to optimize their presence in location based search results on Web, Mobile and Social platforms. These search results typically highly structured and include name, address, phone number and enhanced profile information, as opposed to excerpts of website information. Our Universal Business Listing (www.UBL.org) service provides a powerful, cost-effective method for ensuring the distribution and accuracy of individual business listing data across hundreds of local web directories, search engines, mobile applications and other sources of local listings data. Our profile management services allow businesses to take control of profile pages in leading, highly trafficked, search engines, social media sites, providing enhanced content about their products and services. As part of these services we also provide an expanding range of analytical and monitoring tools to increase our customer value proposition. The company offers services in the USA, Canada, The United Kingdom and Australia.
Results of Operations for the three months ended December 31, 2012 and 2011
The following table sets forth the summary income statement for the three months ended December 31, 2012 and 2011:
| | | Three Months Ended | |
| | | December 31, 2012 | | | December 31, 2011 | |
| | | | | | | |
| Revenues | | $ | 830,678 | | | $ | 531,156 | |
| Gross Margin | | $ | 472,531 | | | $ | 296,894 | |
| Operating Expenses | | $ | (664,803 | ) | | $ | (561,680 | ) |
| Other Income (Expense), net | | $ | (452,502 | ) | | $ | 35,366 | |
| Net Loss | | $ | (644,774 | ) | | $ | (229,420 | ) |
Revenues: Revenue, increased by approximately 56% to $830,678 during the three months ended December 31, 2012, from $531,156 during the corresponding three months ended December 31, 2011. The increased revenue was primarily related to increased unit sales, which was partially offset by a reduction in selling price per unit. We introduced new products and improved certain products over this period which contributed to the growth in unit sales. Additionally, we increased our number of agency and channel partners who resell our products.
Gross Margin: The gross profit margin increased by approximately 1.0% of sales during the three months ended December 31, 2012 as compared to the three months ended December 31, 2011. The increased margin was due primarily to decreased cost per unit, partially offset by a decrease in selling price per unit. Growth in sales of Reputation Monitoring services, as a percentage of overall sales, were a significant factor in this change in cost and revenue per unit.
Operating Expenses: Operating expenses increased by 18% during the three months ended December 31, 2012, as compared to the three months ended December 31, 2011. The $103,123 increase in operating expenses is primarily attributable to the following approximate increases (decreases) in operating expenses: an increase of payroll and related expenses of $139,000, an increase in marketing expenses of $13,000, an increase of research and development expenses of $28,000, an increase of travel related expenses of $28,000, an increase in miscellaneous general and administrative expenses of $5,000, a decrease in commission expense of $14,000, a decrease in stock based compensation expense of $8,000 and a decrease in legal and professional fees of $88,000.
Other Income (Expense)-net: Other income (expenses) - net increased by $487,868 to $(452,502) for the three months ended December 31, 2012 as compared to other income (expenses) - net of $35,366 during the three months ended December 31, 2011. For the three months ended December 31, 2012 other income (expenses) consisted of $296 in interest income, $(60,210) in interest expense, a loss on change in fair value of derivative liabilities of $(59,436), derivative expense of (181,426), loss on extinguishment of debt of $(151,610) and miscellaneous expenses of $(116). For the three months ended December 31, 2011 other income (expenses) consisted of $7 in interest income, $(13,055) in interest expense, a gain on change in fair value of derivative liabilities of $47,242, and miscellaneous income of $1,172.
Results of Operations for the years ended September 30, 2012 and 2011
The following table sets forth the summary income statement for the years ended September 30, 2012 and 2011:
| | | For The Years Ended | |
| | | September 30, 2012 | | | September 30, 2011 | |
| | | | | | | |
| Revenues | | $ | 2,655,985 | | | $ | 1,174,584 | |
| Gross Margin | | $ | 1,401,458 | | | $ | 588,013 | |
| Operating Expenses | | $ | (3,290,105 | ) | | $ | (2,913,224 | ) |
| Other Income (Expense), net | | $ | (147,569 | ) | | $ | (55,963 | ) |
| Net Loss | | $ | (2,036,216 | ) | | $ | (2,381,174 | ) |
Revenues: Revenue, increased by approximately 126% to $2,655,985 during the year ended September 30, 2012, from $1,174,584 during the corresponding year ended September 30, 2011. The increased revenue was primarily related to increased unit sales and improved selling price per unit. For the periods, the Company continued to increase the number of Agencies and Channel Partners reselling its products, and in some cases increased its business with existing strong partners. The Company introduced new higher priced products during the period. Combined, these factors contributed to the revenue growth.
Gross Margin: The gross profit margin increased by approximately 3.0% of sales during the year ended September 30, 2012 as compared to the year ended September 30, 2011. The increased margin was primarily related to an increased selling price per unit, partially offset by an increased cost per unit.
Operating Expenses: Operating expenses increased by 13% during the year ended September 30, 2012, as compared to the year ended September 30, 2011. The $376,881 increase in operating expenses is primarily attributable the following approximate increases (decreases) in operating expenses: an increase of payroll and related expenses of $116,000, an increase in stock based compensation of $490,000, an increase in commission expense of $58,000, a decrease in legal and professional fees of $63,000, a decrease in marketing expenses of $42,000, a decrease of research and development expenses of $14,000, a decrease in impairment expense of $62,000, a decrease in depreciation expense of $50,000, a decrease in bad debt expense of $10,000, a decrease in travel related expenses of $41,000 and a decrease in miscellaneous general and administrative expenses of $9,000.
Other Income (Expense)-net: Other income (expenses) - net increased by $91,606 to $(147,569) for the year ended September 30, 2012 as compared to other income (expenses) - net of $(55,963) during the year ended September 30, 2011. For the year ended September 30, 2012 other income (expenses) consisted of $8 in interest income, $(221,565) in interest expense, a gain on change in fair value of derivative liabilities of $590,737, derivative expense of (538,460), loss on extinguishment of debt of $(8,667), loss on disposition of fixed assets of $(5,455), gain on settlement of employee liabilities of $34,988 and miscellaneous income of $845. For the year ended September 30, 2011 other income (expenses) consisted of $29,034 in interest income, $(70,437) in interest expense, a gain on change in fair value of derivative liabilities of $23,741, derivative expense of (14,888), loss on extinguishment of debt of $(34,390) and miscellaneous income of $10,977.
Liquidity and Capital Resources
The following table summarizes total current assets, liabilities and working capital at December 31, 2012 compared to September 30, 2012:
| | | Period ended | | | | |
| | | December 31, 2012 | | | September 30, 2012 | | | Increase/(Decrease) | |
| Current Assets | | $ | 1,235,568 | | | $ | 929,271 | | | $ | 306,297 | |
| Current Liabilities | | $ | 2,772,605 | | | $ | 2,448,993 | | | $ | 323,612 | |
| Working Capital Deficit | | $ | (1,537,037 | ) | | $ | (1,519,722 | ) | | $ | 17,315 | |
As of December 31, 2012, we had a working capital deficit of $1,537,037 as compared to a working capital deficit of $1,519,722 as of September 30, 2012, an increase of $17,315. Our working capital deficit is primarily attributable to our growing accounts payable and deferred revenues.
Net cash provided by operating activities for the three months ended December 31, 2012 and 2011 was 25,498 and $6,821, respectively. The Net Loss for the three months ended December 31, 2012 and 2011 was $(644,774) and $(229,420), respectively.
Net cash used in all investing activities for the three months ended December 31, 2012 was $8,768 as compared to $1,185 for the three months ended December 31, 2011. The Company paid $8,768 and $1,185 for the acquisition of equipment during the three months ended December 31, 2012 and 2011, respectively.
Net cash provided by (used in) all financing activities for the three months ended December 31, 2012 was $193,970 as compared to $(2,309) for the three months ended December 31, 2011. During the three months ended December 31, 2012 the Company received net proceeds from convertible notes in the amount of $200,000, made principal payments on notes in the amount of $5,223 and made principal payments on capital leases of $807. During the three months ended December 31, 2011 the Company made principal payments on notes in the amount of $2,309.
Going Concern
The Company expects its current resources to be insufficient to fund its operations for the next 12 months unless additional financing is received. Management has determined that additional capital will be required in the form of equity or debt securities. In addition, if we cannot raise additional short term capital we will be forced to continue to further accrue liabilities due to our limited cash reserves. There are no assurances that management will be able to raise capital on terms acceptable to the Company. If we are unable to obtain sufficient amounts of additional capital, we may be required to reduce the scope of our planned development, which could harm our business, financial condition and operating results. If we obtain additional funds by selling any of our equity securities or by issuing common stock to pay current or future obligations, the percentage ownership of our stockholders will be reduced, stockholders may experience additional dilution, or the equity securities may have rights preferences or privileges senior to the common stock. If adequate funds are not available to us when needed on satisfactory terms, we may be required to cease operating or otherwise modify our business strategy.
As reflected in the accompanying consolidated financial statements, the Company has a net loss and net cash provided by operations of $(644,744) and $25,498, respectively, for the three months ended December 31, 2012.
The ability of the Company to continue its operations is dependent on Management’s plans, which include the raising of capital through debt and/or equity markets with some additional funding from other traditional financing sources, including term notes, until such time that funds provided by operations are sufficient to fund working capital requirements. The Company may need to incur additional liabilities with certain related parties to sustain the Company’s existence.
The Company may require additional funding to finance the growth of its current and expected future operations as well as to achieve its strategic objectives. There can be no assurance that financing will be available in amounts or terms acceptable to the Company, if at all. In that event, the Company would be required to change its growth strategy and seek funding on that basis, if at all.
Our auditor in its report dated May 1, 2013, has expressed substantial doubt about our ability to continue as a going concern. Our plan regarding these matters is to raise additional debt and/or equity financing to allow us the ability to cover our current cash flow requirements and meet our obligations as they become due. There can be no assurances that financing will be available or if available, that such financing will be available under favorable terms. In the event that we are unable to generate adequate revenues to cover expenses and cannot obtain additional financing in the near future, we may seek protection under bankruptcy laws. The accompanying financial statements have been prepared on a going concern basis, which contemplates the realization of assets and the satisfaction of liabilities in the normal course of business. These financial statements do not include any adjustments relating to the recovery of the recorded assets or the classification of the liabilities that might be necessary should the Company be unable to continue as a going concern.
Recent Accounting Pronouncements
FASB Accounting Standards Update No. 2011-08
In September 2011, the FASB issued the FASB Accounting Standards Update No. 2011-08 “Intangibles—Goodwill and Other: Testing Goodwill for Impairment” (“ASU 2011-08”). This Update is to simplify how public and nonpublic entities test goodwill for impairment. The amendments permit an entity to first assess qualitative factors to determine whether it is more likely than not that the fair value of a reporting unit is less than its carrying amount as a basis for determining whether it is necessary to perform the two-step goodwill impairment test described in Topic 350. Under the amendments in this Update, an entity is not required to calculate the fair value of a reporting unit unless the entity determines that it is more likely than not that its fair value is less than its carrying amount.
The guidance is effective for interim and annual periods beginning on or after December 15, 2011. Early adoption is permitted.
FASB Accounting Standards Update No. 2011-11
In December 2011, the FASB issued the FASB Accounting Standards Update No. 2011-11 “Balance Sheet: Disclosures about Offsetting Assets and Liabilities” (“ASU 2011-11”). This Update requires an entity to disclose information about offsetting and related arrangements to enable users of its financial statements to understand the effect of those arrangements on its financial position. The objective of this disclosure is to facilitate comparison between those entities that prepare their financial statements on the basis of U.S. GAAP and those entities that prepare their financial statements on the basis of IFRS.
The amended guidance is effective for annual reporting periods beginning on or after January 1, 2013, and interim periods within those annual periods.
FASB Accounting Standards Update No. 2012-02
In July 2012, the FASB issued the FASB Accounting Standards Update No. 2012-02 “Intangibles—Goodwill and Other (Topic 350) Testing Indefinite-Lived Intangible Assets for Impairment” (“ASU 2012-02”).
This Update is intended to reduce the cost and complexity of testing indefinite-lived intangible assets other than goodwill for impairment. This guidance builds upon the guidance in ASU 2011-08, entitled Testing Goodwill for Impairment. ASU 2011-08 was issued on September 15, 2011, and feedback from stakeholders during the exposure period related to the goodwill impairment testing guidance was that the guidance also would be helpful in impairment testing for intangible assets other than goodwill.
The revised standard allows an entity the option to first assess qualitatively whether it is more likely than not (that is, a likelihood of more than 50 percent) that an indefinite-lived intangible asset is impaired, thus necessitating that it perform the quantitative impairment test. An entity is not required to calculate the fair value of an indefinite-lived intangible asset and perform the quantitative impairment test unless the entity determines that it is more likely than not that the asset is impaired.
This Update is effective for annual and interim impairment tests performed in fiscal years beginning after September 15, 2012. Earlier implementation is permitted.
Other Recently Issued, but Not Yet Effective Accounting Pronouncements
Management does not believe that any other recently issued, but not yet effective accounting pronouncements, if adopted, would have a material effect on the accompanying consolidated financial statements.
Critical Accounting Policies
Our financial statements and related public financial information are based on the application of accounting principles generally accepted in the United States (“GAAP”). GAAP requires the use of estimates; assumptions, judgments and subjective interpretations of accounting principles that have an impact on the assets, liabilities, revenues and expense amounts reported. These estimates can also affect supplemental information contained in our external disclosures including information regarding contingencies, risk and financial condition. We believe our use of estimates and underlying accounting assumptions adhere to GAAP and are consistently and conservatively applied. We base our estimates on historical experience and on various other assumptions that we believe to be reasonable under the circumstances. Actual results may differ materially from these estimates under different assumptions or conditions. We continue to monitor significant estimates made during the preparation of our financial statements.
Our significant accounting policies are summarized in Note 2 of our financial statements. While all these significant accounting policies impact our financial condition and results of operations, we view certain of these policies as critical. Policies determined to be critical are those policies that have the most significant impact on our financial statements and require management to use a greater degree of judgment and estimates. Actual results may differ from those estimates. Our management believes that given current facts and circumstances, it is unlikely that applying any other reasonable judgments or estimate methodologies would cause effect on our consolidated results of operations, financial position or liquidity for the periods presented in this report.
We believe the following critical accounting policies and procedures, among others, affect our more significant judgments and estimates used in the preparation of our consolidated financial statements:
Use of Estimates and Assumptions
The preparation of financial statements in conformity with accounting principles generally accepted in the United States of America requires management to make estimates and assumptions that affect the reported amounts of assets and liabilities and disclosure of contingent assets and liabilities at the date of the financial statements and the reported amounts of revenues and expenses during the reporting period.
The Company’s significant estimates and assumptions include the fair value of financial instruments; the carrying value, recoverability and impairment, if any, of long-lived assets; interest rate, income tax rate, income tax provision and valuation allowance of deferred tax assets; and the assumption that the Company will continue as a going concern. Those significant accounting estimates or assumptions bear the risk of change due to the fact that there are uncertainties attached to those estimates or assumptions, and certain estimates or assumptions are difficult to measure or value.
Management bases its estimates on historical experience and on various assumptions that are believed to be reasonable in relation to the financial statements taken as a whole under the circumstances, the results of which form the basis for making judgments about the carrying values of assets and liabilities that are not readily apparent from other sources.
Management regularly evaluates the key factors and assumptions used to develop the estimates utilizing currently available information, changes in facts and circumstances, historical experience and reasonable assumptions. After such evaluations, if deemed appropriate, those estimates are adjusted accordingly.
Actual results could differ from those estimates.
Fair Value of Financial Instruments
The Company follows paragraph 825-10-50-10 of the FASB Accounting Standards Codification for disclosures about fair value of its financial instruments and has adopted paragraph 820-10-35-37 of the FASB Accounting Standards Codification (“Paragraph 820-10-35-37”) to measure the fair value of its financial instruments. Paragraph 820-10-35-37 establishes a framework for measuring fair value in accounting principles generally accepted in the United States of America (U.S. GAAP), and expands disclosures about fair value measurements. To increase consistency and comparability in fair value measurements and related disclosures, Paragraph 820-10-35-37 establishes a fair value hierarchy which prioritizes the inputs to valuation techniques used to measure fair value into three (3) broad levels. The three (3) levels of fair value hierarchy defined by Paragraph 820-10-35-37 are described below:
| Level 1 | | Quoted market prices available in active markets for identical assets or liabilities as of the reporting date. |
| | | |
| Level 2 | | Pricing inputs other than quoted prices in active markets included in Level 1, which are either directly or indirectly observable as of the reporting date. |
| | | |
| Level 3 | | Pricing inputs that are generally observable inputs and not corroborated by market data. |
Financial assets are considered Level 3 when their fair values are determined using pricing models, discounted cash flow methodologies or similar techniques and at least one significant model assumption or input is unobservable.
The fair value hierarchy gives the highest priority to quoted prices (unadjusted) in active markets for identical assets or liabilities and the lowest priority to unobservable inputs. If the inputs used to measure the financial assets and liabilities fall within more than one level described above, the categorization is based on the lowest level input that is significant to the fair value measurement of the instrument.
The carrying amounts of the Company’s financial assets and liabilities, such as cash, accounts receivable, prepaid expense, deferred costs, accounts payable and accrued liabilities, deferred revenues, approximate their fair values because of the short maturity of these instruments.
The Company’s capital lease liability, notes payable and convertible notes payable approximate the fair value of such instruments based upon management’s best estimate of interest rates that would be available to the Company for similar financial arrangements at December 31, 2012 and September 30, 2012.
The Company’s Level 3 financial liabilities consist of the derivative warrant issued in connection with the Company’s convertible promissory notes (the "Notes"), for which there is no current market for these securities such that the determination of fair value requires significant judgment or estimation. The Company valued the automatic conditional conversion, re-pricing/down-round, change of control; default and follow-on offering provisions using a lattice model, with the assistance of an independent valuation expert, for which management understands the methodologies. These models incorporate transaction details such as Company stock price, contractual terms, maturity, risk free rates, as well as assumptions about future financings, volatility, and holder behavior as of the date of issuance and each balance sheet date.
Transactions involving related parties cannot be presumed to be carried out on an arm's-length basis, as the requisite conditions of competitive, free-market dealings may not exist. Representations about transactions with related parties, if made, shall not imply that the related party transactions were consummated on terms equivalent to those that prevail in arm's-length transactions unless such representations can be substantiated.
It is not, however, practical to determine the fair value of accounts payable - related party, if any, due to their related party nature.
Fair Value of Financial Assets and Liabilities Measured on a Recurring Basis
Level 3 Financial Liabilities – Derivative Financial Instruments
The Company uses Level 3 of the fair value hierarchy to measure the fair value of the derivative liabilities and revalues its derivative convertible note and warrant liabilities at every reporting period and recognizes gains or losses in the statements of operations that are attributable to the change in the fair value of the derivative convertible notes and warrant liabilities.
Derivative Instruments
The Company evaluates its convertible debt, warrants or other contracts to determine if those contracts or embedded components of those contracts qualify as derivatives to be separately accounted for in accordance with Paragraph 810-10-05-4 of the Codification and Paragraph 815-40-25 of the Codification. The result of this accounting treatment is that the fair value of the embedded derivative is marked-to-market each balance sheet date and recorded as a liability. In the event that the fair value is recorded as a liability, the change in fair value is recorded in the consolidated statements of operations as other income or expense. Upon conversion or exercise of a derivative instrument, the instrument is marked to fair value at the conversion date and then that fair value is reclassified to equity.
In circumstances where the embedded conversion option in a convertible instrument is required to be bifurcated and there are also other embedded derivative instruments in the convertible instrument that are required to be bifurcated, the bifurcated derivative instruments are accounted for as a single, compound derivative instrument.
The classification of derivative instruments, including whether such instruments should be recorded as liabilities or as equity, is re-assessed at the end of each reporting period. Equity instruments that are initially classified as equity that become subject to reclassification are reclassified to liability at the fair value of the instrument on the reclassification date. Derivative instrument liabilities will be classified in the balance sheet as current or non-current based on whether or not net-cash settlement of the derivative instrument is expected within 12 months of the balance sheet date.
The Company marks to market the fair value of the remaining embedded derivative warrants at each balance sheet date and records the change in the fair value of the remaining embedded derivative warrants as other income or expense in the consolidated statements of operations and comprehensive income (loss).
The Company utilizes the Lattice model that values the liability of the derivative warrants based on a probability weighted discounted cash flow model with the assistance of the third party valuation firm. The reason the Company picks the Lattice model is that in many cases there may be multiple embedded features or the features of the bifurcated derivatives may be so complex that a Black-Scholes valuation does not consider all of the terms of the instrument. Therefore, the fair value may not be appropriately captured by simple models. In other words, simple models such as Black-Scholes may not be appropriate in many situations given complex features and terms of conversion option (e.g., combined embedded derivatives). The Lattice model is based on future projections of the various potential outcomes. The features that were analyzed and incorporated into the model included the exercise and full reset features. Based on these features, there are two primary events that can occur; the Holder exercises the Warrants or the Warrants are held to expiration. The Lattice model analyzed the underlying economic factors that influenced which of these events would occur, when they were likely to occur, and the specific terms that would be in effect at the time (i.e. stock price, exercise price, volatility, etc.). Projections were then made on the underlying factors which led to potential scenarios. Probabilities were assigned to each scenario based on management projections. This led to a cash flow projection and a probability associated with that cash flow. A discounted weighted average cash flow over the various scenarios was completed to determine the value of the derivative warrants.
Revenue Recognition
The Company follows paragraph 605-10-S99-1 of the FASB Accounting Standards Codification for revenue recognition. The Company will recognize revenue when it is realized or realizable and earned. The Company considers revenue realized or realizable and earned when all of the following criteria are met: (i) persuasive evidence of an arrangement exists, (ii) the product has been shipped or the services have been rendered to the customer, (iii) the sales price is fixed or determinable, and (iv) collectability is reasonably assured.
The Company receives non-refundable up-front payments for services. These payments are initially deferred and subsequently recognized over the subscription period, typically one year.
Stock-Based Compensation for Obtaining Employee Services
The Company accounts for its stock based compensation in which the Company obtains employee services in share-based payment transactions under the recognition and measurement principles of the fair value recognition provisions of section 718-10-30 of the FASB Accounting Standards Codification. Pursuant to paragraph 718-10-30-6 of the FASB Accounting Standards Codification, all transactions in which goods or services are the consideration received for the issuance of equity instruments are accounted for based on the fair value of the consideration received or the fair value of the equity instrument issued, whichever is more reliably measurable. The measurement date used to determine the fair value of the equity instrument issued is the earlier of the date on which the performance is complete or the date on which it is probable that performance will occur. If the Company is a newly formed corporation or shares of the Company are thinly traded the use of share prices established in the Company’s most recent private placement memorandum (“PPM”), or weekly or monthly price observations would generally be more appropriate than the use of daily price observations as such shares could be artificially inflated due to a larger spread between the bid and asked quotes and lack of consistent trading in the market.
The fair value of share options and similar instruments is estimated on the date of grant using a Black-Scholes option-pricing valuation model. The ranges of assumptions for inputs are as follows:
● | Expected term of share options and similar instruments: The expected life of options and similar instruments represents the period of time the option and/or warrant are expected to be outstanding. Pursuant to Paragraph 718-10-50-2(f)(2)(i) of the FASB Accounting Standards Codification the expected term of share options and similar instruments represents the period of time the options and similar instruments are expected to be outstanding taking into consideration of the contractual term of the instruments and employees’ expected exercise and post-vesting employment termination behavior into the fair value (or calculated value) of the instruments. Pursuant to paragraph 718-10-S99-1, it may be appropriate to use the simplified method, i.e., expected term = ((vesting term + original contractual term) / 2), if (i) A company does not have sufficient historical exercise data to provide a reasonable basis upon which to estimate expected term due to the limited period of time its equity shares have been publicly traded; (ii) A company significantly changes the terms of its share option grants or the types of employees that receive share option grants such that its historical exercise data may no longer provide a reasonable basis upon which to estimate expected term; or (iii) A company has or expects to have significant structural changes in its business such that its historical exercise data may no longer provide a reasonable basis upon which to estimate expected term. The Company uses the simplified method to calculate expected term of share options and similar instruments as the company does not have sufficient historical exercise data to provide a reasonable basis upon which to estimate expected term. |
| ● | Expected volatility of the entity’s shares and the method used to estimate it. Pursuant to ASC Paragraph 718-10-50-2(f)(2)(ii) a thinly-traded or nonpublic entity that uses the calculated value method shall disclose the reasons why it is not practicable for the Company to estimate the expected volatility of its share price, the appropriate industry sector index that it has selected, the reasons for selecting that particular index, and how it has calculated historical volatility using that index. The Company uses the average historical volatility of the comparable companies over the expected contractual life of the share options or similar instruments as its expected volatility. If shares of a company are thinly traded the use of weekly or monthly price observations would generally be more appropriate than the use of daily price observations as the volatility calculation using daily observations for such shares could be artificially inflated due to a larger spread between the bid and asked quotes and lack of consistent trading in the market. |
| ● | Expected annual rate of quarterly dividends. An entity that uses a method that employs different dividend rates during the contractual term shall disclose the range of expected dividends used and the weighted-average expected dividends. The expected dividend yield is based on the Company’s current dividend yield as the best estimate of projected dividend yield for periods within the expected term of the share options and similar instruments. |
| ● | Risk-free rate(s). An entity that uses a method that employs different risk-free rates shall disclose the range of risk-free rates used. The risk-free interest rate is based on the U.S. Treasury yield curve in effect at the time of grant for periods within the expected term of the share options and similar instruments. |
The Company’s policy is to recognize compensation cost for awards with only service conditions and a graded vesting schedule on a straight-line basis over the requisite service period for the entire award.
Equity Instruments Issued to Parties Other Than Employees for Acquiring Goods or Services
The Company accounts for equity instruments issued to parties other than employees for acquiring goods or services under guidance of Sub-topic 505-50 of the FASB Accounting Standards Codification (“Sub-topic 505-50”).
Pursuant to ASC Section 505-50-30, all transactions in which goods or services are the consideration received for the issuance of equity instruments are accounted for based on the fair value of the consideration received or the fair value of the equity instrument issued, whichever is more reliably measurable. The measurement date used to determine the fair value of the equity instrument issued is the earlier of the date on which the performance is complete or the date on which it is probable that performance will occur. If the Company is a newly formed corporation or shares of the Company are thinly traded the use of share prices established in the Company’s most recent private placement memorandum (“PPM”), or weekly or monthly price observations would generally be more appropriate than the use of daily price observations as such shares could be artificially inflated due to a larger spread between the bid and asked quotes and lack of consistent trading in the market.
The fair value of share options and similar instruments is estimated on the date of grant using a Black-Scholes option-pricing valuation model. The ranges of assumptions for inputs are as follows:
| ● | Expected term of share options and similar instruments: Pursuant to Paragraph 718-10-50-2(f)(2)(i) of the FASB Accounting Standards Codification the expected term of share options and similar instruments represents the period of time the options and similar instruments are expected to be outstanding taking into consideration of the contractual term of the instruments and holder’s expected exercise behavior into the fair value (or calculated value) of the instruments. The Company uses historical data to estimate holder’s expected exercise behavior. If the Company is a newly formed corporation or shares of the Company are thinly traded the contractual term of the share options and similar instruments is used as the expected term of share options and similar instruments as the Company does not have sufficient historical exercise data to provide a reasonable basis upon which to estimate expected term. |
| ● | Expected volatility of the entity’s shares and the method used to estimate it. Pursuant to ASC Paragraph 718-10-50-2(f)(2)(ii) a thinly-traded or nonpublic entity that uses the calculated value method shall disclose the reasons why it is not practicable for the Company to estimate the expected volatility of its share price, the appropriate industry sector index that it has selected, the reasons for selecting that particular index, and how it has calculated historical volatility using that index. The Company uses the average historical volatility of the comparable companies over the expected contractual life of the share options or similar instruments as its expected volatility. If shares of a company are thinly traded the use of weekly or monthly price observations would generally be more appropriate than the use of daily price observations as the volatility calculation using daily observations for such shares could be artificially inflated due to a larger spread between the bid and asked quotes and lack of consistent trading in the market. |
| ● | Expected annual rate of quarterly dividends. An entity that uses a method that employs different dividend rates during the contractual term shall disclose the range of expected dividends used and the weighted-average expected dividends. The expected dividend yield is based on the Company’s current dividend yield as the best estimate of projected dividend yield for periods within the expected term of the share options and similar instruments. |
| ● | Risk-free rate(s). An entity that uses a method that employs different risk-free rates shall disclose the range of risk-free rates used. The risk-free interest rate is based on the U.S. Treasury yield curve in effect at the time of grant for periods within the expected term of the share options and similar instruments. |
Pursuant to ASC paragraph 505-50-25-7, if fully vested, non-forfeitable equity instruments are issued at the date the grantor and grantee enter into an agreement for goods or services (no specific performance is required by the grantee to retain those equity instruments), then, because of the elimination of any obligation on the part of the counterparty to earn the equity instruments, a measurement date has been reached. A grantor shall recognize the equity instruments when they are issued (in most cases, when the agreement is entered into). Whether the corresponding cost is an immediate expense or a prepaid asset (or whether the debit should be characterized as contra-equity under the requirements of paragraph 505-50-45-1) depends on the specific facts and circumstances. Pursuant to ASC paragraph 505-50-45-1, a grantor may conclude that an asset (other than a note or a receivable) has been received in return for fully vested, non-forfeitable equity instruments that are issued at the date the grantor and grantee enter into an agreement for goods or services (and no specific performance is required by the grantee in order to retain those equity instruments). Such an asset shall not be displayed as contra-equity by the grantor of the equity instruments. The transferability (or lack thereof) of the equity instruments shall not affect the balance sheet display of the asset. This guidance is limited to transactions in which equity instruments are transferred to other than employees in exchange for goods or services. Section 505-50-30 provides guidance on the determination of the measurement date for transactions that are within the scope of this Subtopic.
Pursuant to Paragraphs 505-50-25-8 and 505-50-25-9, an entity may grant fully vested, non-forfeitable equity instruments that are exercisable by the grantee only after a specified period of time if the terms of the agreement provide for earlier exercisability if the grantee achieves specified performance conditions. Any measured cost of the transaction shall be recognized in the same period(s) and in the same manner as if the entity had paid cash for the goods or services or used cash rebates as a sales discount instead of paying with, or using, the equity instruments. A recognized asset, expense, or sales discount shall not be reversed if a share option and similar instrument that the counterparty has the right to exercise expires unexercised.
Pursuant to ASC paragraph 505-50-30-S99-1, if the Company receives a right to receive future services in exchange for unvested, forfeitable equity instruments, those equity instruments are treated as unissued for accounting purposes until the future services are received (that is, the instruments are not considered issued until they vest). Consequently, there would be no recognition at the measurement date and no entry should be recorded.
Off Balance Sheet Arrangements:
We do not have any off-balance sheet arrangements, financings, or other relationships with unconsolidated entities or other persons, also known as “special purpose entities” (SPEs).
The Company currently has a four year lease agreement expiring in December 2016 for its headquarters in Charlotte, North Carolina. The lease requires base annual rent of approximately $130,000 for the first year, with 2.5% increments each year thereafter. The lease contains a five (5) month rent abatement period which commenced on January 1, 2013. The lease contains one option to renew for a term of thirty-six (36) months.
Item 4. Security Ownership of Certain Beneficial Owners And Management.
The following table sets forth information regarding the beneficial ownership of our common stock, par value $.01, per share, as of May 13, 2013 by (a) each person who is known by us to beneficially own 5% or more of our common stock, (b) each of our directors and named executive officers, and (c) all of our directors and executive officers as a group.
| Name and Address of Beneficial Owner | | Amount and nature of beneficial ownership (1) | | | Percent of class (2) | |
| Officer and Directors | | | | | | |
| Doyal Bryant (3) | | | 6,976,000 | | | | 19.7 | % |
| Chris Travers (4) | | | 6,964,000 | | | | 19.7 | % |
| David Jaques (5) | | | 195,000 | | | | * | |
| Jeff Guzy (6) | | | 48,000 | | | | * | |
| All Directors and Officers as a group (4 persons) | | | 14,183,000 | | | | 39.18 | % |
| 5% or greater stockholder | | | | | | | | |
| Radeon, LLC (7) | | | 5,514,000 | | | | 16.0 | % |
| Jack Pilger | | | 6,014,000 | | | | 17.4 | % |
| Scott Nedderman | | | 2,295,000 | | | | 6.6 | % |
* Less than 1%
| (1) | The address of each person is c/o of the Company unless otherwise indicated herein. |
| | |
| (2) | The calculation in this column is based upon 34,564,969 shares of common stock outstanding on May 13, 2013. Beneficial ownership is determined in accordance with the rules of the SEC and generally includes voting or investment power with respect to the subject securities. Shares of common stock that are currently exercisable or exercisable within 60 days of May 13, 2013 are deemed to be beneficially owned by the person holding such securities for the purpose of computing the percentage beneficial ownership of such person, but are not treated as outstanding for the purpose of computing the percentage beneficial ownership of any other person. |
| | |
| (3) | Includes 100,000 shares held by Mr. Bryant’s spouse, Deborah Bryant. Also includes options to purchase 750,000 shares of the Company’s common stock held by Mr. Bryant and options to purchase 12,000 shares of the Company’s common stock held by Mrs. Bryant which are fully vested. |
| | |
| | (4) Includes stock held by Radeon, LLC. Includes an option to purchase 750,000 shares of the Company’s common stock which are fully vested. |
| | |
| (5) | Includes option to purchase 120,000 shares of the Company’s common which are fully vested. |
| | |
| (6) | Includes options to purchase an aggregate of 48,000 shares of the Company’s common which are fully vested. |
Item 5. Directors and Executive Officers.
The names, ages and positions of our directors and executive officers as of May 13, 2013 are as follows:
| Name | | Age | | Position |
| Doyal Bryant | | 59 | | Chief Executive Officer |
| Chris Travers | | 55 | | Chief Revenue Officer and President |
| David Jaques | | 56 | | Director |
| Jeff Guzy | | 61 | | Director |
All directors hold office until the next annual meeting of stockholders and the election and qualification of their successors. Officers are elected annually by the board of directors and serve at the discretion of the board.
The principal occupations for the past five years (and, in some instances, for prior years) of each of our directors and executive officers are as follows:
Doyal Bryant. Mr. Bryant is a co-founder of the Company. Since January 2010, Mr. Bryant has served as our Chief Executive Officer and previously served as EVP of Strategic Partnership Development from September 2007 through January 2010. Mr. Bryant also is serving as Chairman of the Board of Directors since June of 2012 of the Company. Mr. Bryant has served as a Director of the Company since 2010 From March 2004 through November 2006, Mr. Bryant served as CEO at Scientigo, Inc., a local and Enterprise search platform with 4 issued patents and acquirer of Find.com . Mr. Bryant has served as Managing Partner at BlueLake Capital Partners from 2008 to 2010 which provides advisory services and management support to growth stage companies. Mr. Bryant has also served as President of IGC Acquisitions, Inc. a facilities based International VoIP Telecom Carrier, a position he held from 2007 to 2009. Mr. Bryant holds a B.S. in Business Administration from Drury University. The Board has concluded that Mr. Bryant is qualified to serve as a director of the Company because of the depth of his knowledge and experience in the identity in which we operate.
Chris Travers. Mr. Travers, a co-founder of the Company, currently serves as the Company’s Chief Revenue Officer and President, a position he held since January 2010. Mr. Travers has served as a Director of the Company since 2010. Mr. Travers previously served as the Company’s CEO from September 2007 through January 2010. Mr. Travers was the principal of Radeon LLC from October 2001 through September 2007. Mr. Travers currently serves as a director of Bone Medical, a biotechnology development company based in Britain. Mr. Travers holds a diploma in English from the Curtin University, Australia. The Board has concluded that Mr. Travers is qualified to serve as a director of the Company because he is one of the co-founders of the Company and has demonstrated his knowledge of the online listing business.
David Jaques. Mr. Jaques has served as a director since August 2010. Mr. Jaques previously served as the CFO of the Company from February 2010 through August 2010. Since 2008, Mr. Jaques has served as a partner in Greenough Consulting Group, Inc. a company which provides financial consulting services, and is CFO of the venture capital entity 500 Startups. Mr. Jaques previously served as the founding CFO of Paypal and CFO of BlueRun Ventures LP, a Venture capital firm. The Board has concluded that Mr.Jaques is qualified to serve as a director of the Company because of his experience in working with similar types of companies in the Internet sector and his extensive finance background.
Jeff Guzy. Mr. Guzy currently heads up business development for GeoPay Inc, a mobile money platform. He is the former president of Leatt Corporation (LEAT), (2007-2011) a worldwide provider of revolutionary protection systems for the helmeted, motor-sports industry. He is currently on the Leatt Board of Directors. From 2000 through 2002, Mr. Guzy was General Manager at Loral Space Systems, responsible for developing their satellite internet access business in North and South America. Before Loral Space Systems, Mr. Guzy was a founder of FaciliCom International (1994-1999), an international telecom carrier. He was instrumental in building the company’s service in 10 countries, across Europe and North America, as EVP of Sales, Marketing, Product and Business Development. He played a key role in the sale of FCI to World Access. Mr. Guzy has had key executive positions at several large international carriers, including Comsat International, Sprint International, and Bell Atlantic’s Information Services group. He has held program and project start-up responsibilities along with senior business development positions at all these firms. Mr. Guzy has an MBA from the Wharton School of Finance, University of Pennsylvania, and an MS in systems engineering from the Moore School of Engineering, University of Pennsylvania. He has a BS in electrical engineering from Penn State University and a certificate in theology from Georgetown University. The Board has concluded that Mr.Guzy is qualified to serve as a director of the Company because of his expertise in working with small public companies as well as with national and international business development.
Family Relationships
None
Involvement in Certain Legal Proceedings
To our knowledge, during the last ten years, none of our directors, executive officers (including those of our subsidiaries), promoters or control persons have:
| ● | Had a bankruptcy petition filed by or against any business of which such person was a general partner or executive officer either at the time of the bankruptcy or within two years prior to that time. |
| | |
| ● | Been convicted in a criminal proceeding or been subject to a pending criminal proceeding, excluding traffic violations and other minor offenses. |
| | |
| ● | Been subject to any order, judgment or decree, not subsequently reversed, suspended or vacated, of any court of competent jurisdiction, permanently or temporarily enjoining, barring, suspending or otherwise limiting his involvement in any type of business, securities or banking activities. |
| | |
| ● | Been found by a court of competent jurisdiction (in a civil action), the SEC, or the Commodities Futures Trading Commission to have violated a federal or state securities or commodities law, and the judgment has not been reversed, suspended or vacated. |
| | |
| ● | Been the subject to, or a party to, any sanction or order, not subsequently reverse, suspended or vacated, of any self-regulatory organization, any registered entity, or any equivalent exchange, association, entity or organization that has disciplinary authority over its members or persons associated with a member. |
Item 6. Executive Compensation.
SUMMARY COMPENSATION TABLE
The table below sets forth, for the last two fiscal years, the compensation earned by each person acting as our Principal Executive Officer, Principal Financial Officer and our other most highly compensated executive officers whose total annual compensation exceeded $100,000 (together, the “Named Executive Officers”).
| Name & Principal Position | | Year | | Salary ($) | | Bonus ($) | | Stock Awards ($) (1) | | Option Awards ($) (2)(3) | | All Other Compensation ($) | | Total ($) | |
| | | | | | | | | | | | | | | | |
| Doyal Bryant | | 2012 | | | 84,038 | | | | | | | 102,978 | | | | | 187,016 | |
| CEO | | 2011 | | | 55,846 | | | | | | | - | | | | | 55,846 | |
| | | | | | | | | | | | | | | | | | | |
| Chris Travers | | 2012 | | | 84,038 | | | | | | | 102,978 | | | | | 187,016 | |
| CRO and President | | 2011 | | | 55,846 | | | | | | | - | | | | | 55,846 | |
| | | | | | | | | | | | | | | | | | | |
| Damian Rollison | | 2012 | | | 108,692 | | | | | | | 2,513 | | | | | 111,205 | |
| VP Product and Technology | | 2011 | | | 88,661 | | | | | | | - | | | | | 88,661 | |
| | | | | | | | | | | | | | | | | | | |
| Tom Wells | | 2012 | | | 101,961 | | | | - | | | | | | | | 101,961 | |
| Director of Information Technology | | 2011 | | | 100,384 | | | | 6,600 | | | | | | | | 106,984 | |
1. The fair value of the common shares granted is obtained by multiplying the number of the company’s common shares granted by the fair market value of the company’s common stock according to the trading price on the date of issue.
2. Includes all options granted by us as compensation for employment services or office.
3. The fair value of the options granted is obtained by multiplying the number of options granted by their value established according to the Black - Scholes pricing model. This value is the same as the fair value established in accordance with generally accepted accounting principles. The following assumptions were used for options granted in 2012: expected volatility – 151%; risk-free rate – 0.72%; forfeiture rate – 0.00%; expected life – 2.5 years; dividend yield – 0%.
OUTSTANDING EQUITY AWARDS AT FISCAL YEAR-END
The following table sets forth information for the named executive officers regarding the number of shares subject to both exercisable and unexercisable stock options, as well as the exercise prices and expiration dates thereof, as of September 30, 2012.
| Option Awards | | | | | | |
| Name | | Number of Securities Underlying Unexercised Options (#) | | Number of Securities Underlying Unexercised Options (#) | | Option Exercise Price ($) | | Option Expiration Date | | Market Value of Shares or Units of Stock That Have Not Vested ($) | | Equity Incentive Plan Awards: Number of Unearned Shares, Units or Other Rights That Have Not Vested (#) | | Equity Incentive Plan Awards: Market or Payout Value of Unearned Shares, Units or Other Rights That Have Not Vested ($) |
| Doyal Bryant | | | | 750,000 | | | $0.12 | | 9/16/17 | | - | | - | | - |
| | | | | | | | | | | | | | | | |
| Chris Travers | | | | 750,000 | | | $0.12 | | 9/16/17 | | - | | - | | - |
DIRECTOR COMPENSATION
The following table sets forth with respect to the named directors, compensation information inclusive of equity awards and payments made for the fiscal year ended September 30, 2012 in the director's capacity as director.
| Name (1) | | Fees Earned or Paid in Cash ($) | | Stock Awards ($) | | Option Awards ($)(1)(2) | | Non-Equity Incentive Plan Compensation ($) | | Change in Pension Value and Nonqualified Deferred Compensation Earnings | | All Other Compensation ($) | | Total ($) |
| Doyal Bryant | | | - | | - | | | - | | - | | | - | | - | | - |
| Chris Travers | | | - | | - | | | - | | - | | | - | | - | | - |
| David Jaques | | | - | | - | | | 13,084 | | - | | | - | | - | | 13,084 |
| Jack Pilger | | | - | | - | | | 31,252 | | - | | | - | | - | | 31,252 |
| (1) Includes all options granted by us as compensation for employment services or office. |
| (2) The fair value of the options granted is obtained by multiplying the number of options granted by their value established according to the Black - Scholes pricing model. This value is the same as the fair value established in accordance with generally accepted accounting principles. The following assumptions were used for options granted in 2012: expected volatility – 156%; risk-free rate – 0.37%; forfeiture rate – 0.00%; expected life – 1.5 years; dividend yield – 0%. |
Employment Agreements
On January 1, 2013, we entered into an employment agreement with Doyal Bryant to serve as our Chief Executive Officer. This Agreement was for initial three-year term which shall automatically renew for successive one-year terms unless otherwise terminated by either party pursuant to the Agreement. Under the agreement, Mr. Bryant will receive a base annual salary of $225,000, with $25,000 increase per year. Additionally, Mr. Bryant is entitled to an annual bonus if the Company meets or exceeds criteria adopted by the board of directors. Mr. Bryant is also eligible for grants of awards under any plan for equity compensation that the Company may adopt. Mr. Bryant will receive all benefits granted to the Company’s senior executive including full health, dental and disability insurance.
Unless Mr. Bryant’s employment is terminated for cause, then upon termination of Mr. Bryant’s employment prior to expiration of his employment period, Mr. Bryant shall be entitled to receive a severance amount equal to Mr. Bryant’s then current annual base salary plus his then current bonus amount for a severance period that begins on the date of termination and ends on the later of the either (i) second anniversary of such termination date, or (ii) the end of the current term of the Agreement (the “Severance Period”), together with the amount of all accrued but previously unpaid base salary through the date of such termination, any expenses incurred, any benefits then due through the Severance Period, and Mr. Bryant’s pro rata bonus as of the date of termination. Moreover, upon termination without cause, all Company stock, stock options, stock appreciation rights, or phantom stock granted to Mr. Bryant previously shall automatically vest.
Additionally, if, during the first 12 months immediately following a Change in Control, as defined in the Agreement, should Mr. Bryant’s employment be terminated without cause, Mr. Bryant, shall be entitled to severance in an amount equal to two (2) times the sum of Mr. Bryant’s then base salary and his bonus amount.
The Agreement also contains standard confidentiality, indemnification, non-compete, and non-solicitation clauses.
On January 1, 2013, we entered into an employment agreement with Chris Travers to serve as our President and Chief Revenue Officer. This Agreement was for initial three-year term which shall automatically renew for successive one-year terms unless otherwise terminated by either party pursuant to the Agreement. Under the agreement, Mr. Travers will receive a base annual salary of $200,000, with $25,000 increase per year. Additionally, Mr. Travers is entitled to an annual bonus if the Company meets or exceeds criteria adopted by the board of directors. Mr. Travers is also eligible for grants of awards under any plan for equity compensation that the Company may adopt. Mr. Travers will receive all benefits granted to the Company’s senior executive, to be determined by the Board.
Unless Mr. Travers’s employment is terminated for cause, then upon termination of Mr. Travers’s employment prior to expiration of his employment period, Mr. Travers shall be entitled to receive a severance amount equal to Mr. Travers’s then current annual base salary plus his then current bonus amount for a severance period that begins on the date of termination and ends on the later of the either (i) second anniversary of such termination date, or (ii) the end of the current term of the Agreement (the “Severance Period”), together with the amount of all accrued but previously unpaid base salary through the date of such termination, any expenses incurred, any benefits then due through the Severance Period, and Mr. Travers’s pro rata bonus as of the date of termination. Moreover, upon termination without cause, all Company stock, stock options, stock appreciation rights, or phantom stock granted to Mr. Travers previously shall automatically vest.
Additionally, if, during the first 12 months immediately following a Change in Control, as defined in the Agreement, should Mr. Travers’s employment be terminated without cause, Mr. Travers, shall be entitled to severance in an amount equal to two (2) times the sum of Mr. Travers’s then base salary and his bonus amount.
The Agreement also contains standard confidentiality, indemnification, non-compete, and non-solicitation clauses.
Item 7. Certain Relationships And Related Transactions, And Director Independence.
SBA Loan
On January 16, 2006, our predecessor, BounceBack secured a loan from the Small Business Administration (“SBA”) in the original amount of $386,300. The loan was being offered by the SBA as relief for companies that sustained losses in 2005 as a result of Hurricane Katrina. BounceBack's office sustained significant damages since it was located in Ocean Springs, Mississippi at the time of the hurricane.
Any future transactions with officers, directors or 5% stockholders will be on terms no less favorable to us than could be obtained from independent parties. Any affiliated transactions must be approved by a majority of our independent and disinterested directors who have access to our counsel or independent legal counsel at our expense.
Director Independence
Our board of directors has determined that Jeffrey Guzy and David Jaques are currently “independent” as that term is defined under current listing standards of NASDAQ.
Item 8. Legal Proceedings.
The Company is not aware of any material, active, pending or threatened proceeding against us or our subsidiaries, nor are we, or any subsidiary, involved as a plaintiff or defendant in any material proceeding or pending litigation.
Item 9. Market Price of and Dividends on the Registrant’s Common Equity and Related Stockholder Matters.
There is currently no market for our common stock. Currently none of our shares are eligible for resale pursuant to Rule 144. As of May 10, 2013, we have outstanding warrants to purchase 1,417,500 shares of common stock. We currently have outstanding options to purchase 5,171,000 share of our common stock, 5,032,250 of which are vested and currently exercisable. The Company does not have any current plans to offer any of its shares in a public offering.
Holders
As of May 13, 2013, there were 330 holders of record of our common stock. Our transfer agent is Broadridge Corporate Issuer Solutions, 1717 Arch Street, Suite 1300, Philadelphia, PA 19103.
Dividend Policy
Historically, we have not paid any dividends to the holders of our common stock and we do not expect to pay any such dividends in the foreseeable future as we expect to retain our future earnings for use in the operation and expansion of our business.
Equity Compensation Plan Information
The following table summarizes information about our equity compensation plans as of September 30, 2012.
| Plan Category | | Number of Shares of Common Stock to be Issued upon Exercise of Outstanding Options and Warrants | | Weighted-Average Exercise Price of Outstanding Options and Warrants | | Number of Options Remaining Available for Future Issuance Under Equity Compensation Plans (excluding securities reflected in column (a)) |
| | | (a) | | (b) | | © |
| Equity Compensation Plans Approved by Stockholders | | 6,004,500 | | $ | 0.11 | | 798,000 |
| Equity Compensation Plans Not Approved by Stockholders | | - | | | - | | - |
| Total | | 6,004,500 | | | | 798,000 |
Item 10. Recent Sales of Unregistered Securities.
Issuance of Common Stock in Exchange for Intellectual Property
On January 14, 2010, the Company issued 2,483,000 shares of common stock at a fair value of $148,980 in exchange for certain intellectual property.
Conversion of Convertible Notes into Shares of Common Stock
On December 21, 2011, a holder of convertible notes converted an aggregate of $26,473 in principal and accrued interest into an aggregate of 176,484 shares of common stock.
On February 6, 2012, a holder of convertible notes converted an aggregate of $26,301 in principal and accrued interest into an aggregate of 176,343 shares of common stock.
Exercise of Options
On April 11, 2012, an option holder exercised options for an aggregate of 150,000 shares of common stock at an exercise price of $0.00 per share.
On June 1, 2012, an option holder exercised options for an aggregate of 500,000 shares of common stock at an exercise price of $0.00 per share.
Issuance of Shares for Services
On September 30, 2010, the Company issued a consultant 115,000 shares of common stock for services at a fair value of $33,700 ($0.29 per share).
On September 30, 2010, the Company issued a consultant 102,000 shares of common stock for services at a fair value of $6,900 ($0.06 per share).
On April 1, 2011, the Company issued an employee 5,000 shares of common stock for services at a fair value of $2,462 ($0.33 per share).
On May 5, 2011, the Company issued to certain employees an aggregate of 44,000 shares of common stock for services at a fair value of $14,520 ($0.33 per share).
On May 5, 2011, the Company issued a consultant 66,667 shares of common stock for services at a fair value of $22,000 ($0.33 per share).
On September 1, 2011, the Company issued consultants 120,000 shares of common stock for services at a fair value of $31,200 ($0.26 per share).
On April 11, 2012, the Company issued a consultant 125,000 shares of common stock for services at a fair value of $18,750 ($0.15 per share).
On September 16, 2011, the Company issued a consultant 200,000 shares of common stock for services at a fair value of $48,396 ($0.24 per share).
On August 9, 2012, the Company issued a consultant 2,527,332 shares of common stock for services at a fair value of $505,466 ($0.20 per share).
Issuance of Options for Services
On October 18, 2010, the Company issued employees 42,000 common stock options for services at a fair value of $7,498. The Company valued these issuances at fair value, utilizing a Black-Scholes option valuation model.
On October 18, 2010, the Company issued a consultant 12,000 common stock options for services at a fair value of $1,965. The Company valued these issuances at fair value, utilizing a Black-Scholes option valuation model.
On December 8, 2010, the Company issued the Former Chairman and Chief Executive Officer 400,000 common stock options as per a settlement agreement at a fair value of $89,528. The Company valued these issuances at fair value, utilizing a Black-Scholes option valuation model.
At September 30, 2010, the Company had 1,155,000 stock options issued and outstanding. On December 17, 2010, all 1,155,000 options issued and outstanding were cancelled and reissued with changes in expiration terms. The Company applied the Black-Scholes option valuation model and determined additional compensation cost of $43,450 during the year ended September 30, 2011.
On December 17, 2010, the Company issued the Former Chairman and Chief Executive Officer 144,000 common stock options for services at a fair value of $33,830. The Company valued these issuances at fair value, utilizing a Black-Scholes option valuation model.
On December 17, 2010, the Company issued a board member 220,000 common stock options for services at a fair value of $51,829. The Company valued these issuances at fair value, utilizing a Black-Scholes option valuation model.
On December 17, 2010, the Company issued consultants 250,000 common stock options for services at a fair value of $58,733. The Company valued these issuances at fair value, utilizing a Black-Scholes option valuation model.
On December 17, 2010, the Company issued an employee 25,000 common stock options for services at a fair value of $6,223. The Company valued these issuances at fair value, utilizing a Black-Scholes option valuation model.
On December 23, 2010, the Company issued consultants 51,000 common stock options for services at a fair value of $8,656. The Company valued these issuances at fair value, utilizing a Black-Scholes option valuation model.
On July 1, 2011, the Company issued an employee 50,000 common stock options for services at a fair value of $9,774. The Company valued these issuances at fair value, utilizing a Black-Scholes option valuation model.
On August 1, 2011, the Company issued an employee 50,000 common stock options for services at a fair value of $11,900. The Company valued these issuances at fair value, utilizing a Black-Scholes option valuation model.
On September 1, 2011, the Company issued an employee 50,000 common stock options for services at a fair value of $9,895. The Company valued these issuances at fair value, utilizing a Black-Scholes option valuation model.
On September 1, 2011, the Company issued a consultant 36,000 common stock options for services at a fair value of $7,332. The Company valued these issuances at fair value, utilizing a Black-Scholes option valuation model.
On September 16, 2011, the Company issued consultant s 750,000 common stock options for services at a fair value of $181,978. The Company valued these issuances at fair value, utilizing a Black-Scholes option valuation model.
On December 1, 2011, the Company issued a consultant 12,000 common stock options for services at a fair value of $1,880. The Company valued these issuances at fair value, utilizing a Black-Scholes option valuation model.
On December 6, 2011, the Company issued consultants 125,000 common stock options for services at a fair value of $19,702. The Company valued these issuances at fair value, utilizing a Black-Scholes option valuation model.
On December 9, 2011, the Company issued consultants 48,000 common stock options for services at a fair value of $3,912. The Company valued these issuances at fair value, utilizing a Black-Scholes option valuation model.
On December 9, 2011, the Company issued an employee 50,000 common stock options for services at a fair value of $5,924. The Company valued these issuances at fair value, utilizing a Black-Scholes option valuation model.
On January 3, 2012, the Company issued employees 100,000 common stock options for services at a fair value of $13,557. The Company valued these issuances at fair value, utilizing a Black-Scholes option valuation model.
On February 9, 2012, the Company issued a consultant 25,000 common stock options for services at a fair value of $4,697. The Company valued these issuances at fair value, utilizing a Black-Scholes option valuation model.
On February 29, 2012, the Company issued an employee 25,000 common stock options for services at a fair value of $3,539. The Company valued these issuances at fair value, utilizing a Black-Scholes option valuation model.
On March 1, 2012, the Company issued an employee 12,000 common stock options for services at a fair value of $2,231. The Company valued these issuances at fair value, utilizing a Black-Scholes option valuation model.
On March 19, 2012, the Company issued employees 20,000 common stock options for services at a fair value of $3,743. The Company valued these issuances at fair value, utilizing a Black-Scholes option valuation model.
On April 12, 2012, the Company issued an employee 1,000 common stock options for services at a fair value of $124. The Company valued these issuances at fair value, utilizing a Black-Scholes option valuation model.
On May 12, 2012, the Company issued an employee 1,000 common stock options for services at a fair value of $161. The Company valued these issuances at fair value, utilizing a Black-Scholes option valuation model.
On May 14, 2012, the Company issued the Former Chairman and Chief Executive Officer 216,000 common stock options for services at a fair value of $31,252. The Company valued these issuances at fair value, utilizing a Black-Scholes option valuation model.
On May 15, 2012, the Company issued a board member 120,000 common stock options for services at a fair value of $13,084. The Company valued these issuances at fair value, utilizing a Black-Scholes option valuation model.
On June 12, 2012, the Company issued an employee 1,000 common stock options for services at a fair value of $217. The Company valued these issuances at fair value, utilizing a Black-Scholes option valuation model.
On July 12, 2012, the Company issued an employee 1,000 common stock options for services at a fair value of $5. The Company valued these issuances at fair value, utilizing a Black-Scholes option valuation model.
On August 12, 2012, the Company issued an employee 1,000 common stock options for services at a fair value of $178. The Company valued these issuances at fair value, utilizing a Black-Scholes option valuation model.
On September 12, 2012, the Company issued an employee 1,000 common stock options for services at a fair value of $122. The Company valued these issuances at fair value, utilizing a Black-Scholes option valuation model.
On September 16, 2012, the Company issued employees 2,500,000 common stock options for services at a fair value of $346,363. The Company valued these issuances at fair value, utilizing a Black-Scholes option valuation model.
On October 16, 2012, the Company issued an employee 25,000 common stock options for services at a fair value of $2,860. The Company valued these issuances at fair value, utilizing a Black-Scholes option valuation model.
Convertible Debt Issuances
I. On May 3, 2011, June 13, 2011 and August 1, 2011, the Company sold three (3) unsecured subordinate convertible debentures in the principal amount of $25,000 each or an aggregate or $75,000. During the fiscal year ended September 30, 2012, two (2) note holders converted their notes and related accrued interest of $52,774 at $0.15 per share into 351,827 shares of common stock. On March 1, 2013, the remaining note holder, having a note in the principal amount of $25,000, signed a note amendment extending the maturity date of the note to the earlier of: (i) December 31, 2013; or (ii) the closing of an equity investment where the Company receives net proceeds of more than $500,000
Each of the three (3) note holders received a warrant to purchase shares of the Company's common stock equal to 30% of the principal amount of their note. These warrants are exercisable at $0.75 per share expiring three (3) years from the date of issuance, i.e. October 1, 2014, June 1, 2015 and June 1, 2015, respectively.
II. On January 31, 2012, the Company sold two (2) $130,000 notes or $260,000 in aggregate of secured, subordinated convertible notes (the "January 2012 Notes")
The January 2012 Notes, as amended have the following terms:
| ● | Mature on January 31, 2014 as amended (see below), |
| ● | Interest rate at 5% per annum, with interest payable semi-annually, |
| ● | Default interest rate is 10%, |
| ● | Convertible into common shares at $0.10 per share, |
| ● | Secured by all assets of the Company. |
The Company issued three (3) year warrants to purchase an aggregate of 780,000 shares of common stock, with an exercise price of $0.15 per share to the January 2013 Notes.
On November 30, 2012 the maturity date of these notes was extended from January 31, 2013 to January 31, 2014. As consideration for the extension, the Company issued the Note holders 307,500 warrants, with an exercise price of $0.15 per share.
III. On November 19, 2012, the Company sold two (2) $102,500 notes or $205,000 in aggregate of secured, subordinated convertible notes (the "November 2012 Notes")
The Notes have the following terms:
| ● | Mature on January 31, 2014, |
| ● | Interest rate at 5% per annum, with interest payable semi-annually, |
| ● | Default interest rate is 10%, |
| ● | Convertible to common shares at $0.10 per share (see discussion of ratchet feature below), |
| ● | Secured by all assets of the Company. |
The Company issued three (3) year warrants to purchase an aggregate of 615,000 shares of common stock, with an exercise price of $0.15 per share..
Unless otherwise stated, the sales of the above securities were deemed to be exempt from registration under the Securities Act in reliance upon Section 4(2) of the Securities Act (or Regulation D or Regulation S promulgated thereunder), or Rule 701 promulgated under Section 3(b) of the Securities Act as transactions by an issuer not involving any public offering or pursuant to benefit plans and contracts relating to compensation as provided under Rule 701. The recipients of the securities in each of these transactions represented their intentions to acquire the securities for investment only and not with a view to or for sale in connection with any distribution thereof, and appropriate legends were placed upon the stock certificates issued in these transactions.
Item 11. Description Of Registrant’s Securities To Be Registered.
General
Our authorized capital stock consisted of 200,000,000 shares of common stock, $0.01 par value per share, and 10,000,000 million shares of preferred stock, $0.01 par value per share. Our board of directors may establish the rights and preferences of the preferred stock from time to time. As of May 13, 2013, there are 34,564,969 shares of our common stock issued and outstanding and 0 shares of preferred stock issued and outstanding.
Common Stock
Holders of our common stock are entitled to one vote per share. Our certificate of incorporation does not provide for cumulative voting. Upon liquidation, dissolution or winding-up, the holders of our common stock are entitled to share ratably in all of our assets which are legally available for distribution, after payment of or provision for all liabilities and the liquidation preference of any outstanding Series A convertible preferred stock. The holders of our common stock have no preemptive, subscription, redemption or conversion rights.
Preferred Stock
Our certificate of incorporation provides that the preferred stock of the Company shall have the rights and preferences set forth in one or more certificates of designation, as determined by our board of directors.
Stock Options
We currently have outstanding options to purchase 5,171,000 shares of our common stock, 5,032,250 of which are vested and can be exercised at this time.
Warrants
We currently have outstanding warrants to purchase 1,417,500 shares of common stock at a weighted average exercise price of $0.16 1,395,000 of the outstanding warrants provide for cashless exercise and an adjustment to the exercise price if the Company issues additional shares of common stock as a dividend or other distribution, subdivides its outstanding common stock or combine its outstanding shares into a smaller number of shares of common stock.
In January 2012, we issued secured convertible promissory notes in the principal amount of $260,000. The promissory notes, as amended, mature on January 31, 2014 and bear interest at a rate of 5%. The promissory notes are convertible at a price of $0.10 per share. In November 2012, we issued additional convertible promissory notes in the principal amount of $205,000. The notes mature on January 31, 2014 and bear interest at a rate of 5%.
In August 2011, we issued an unsecured convertible debenture to an investor in the principal amount of $25,000. The debenture, as amended, matures on the earlier of (i) December 31, 2013 or the closing of an equity investment where the Company receives net proceeds of more than $500,000.
ITEM 12.. INDEMNIFICATION OF DIRECTORS AND OFFICERS.
Indemnification of Directors and Officers
Section 145 of the Delaware General Corporation Law (“DGCL”) provides, in general, that a corporation incorporated under the laws of the State of Delaware, such as we are, may indemnify any person who was or is a party or is threatened to be made a party to any threatened, pending or completed action, suit or proceeding (other than a derivative action by or in the right of the corporation) by reason of the fact that such person is or was a director, officer, employee or agent of the corporation, or is or was serving at the request of the corporation as a director, officer, employee or agent of another enterprise, against expenses (including attorneys’ fees), judgments, fines and amounts paid in settlement actually and reasonably incurred by such person in connection with such action, suit or proceeding if such person acted in good faith and in a manner such person reasonably believed to be in or not opposed to the best interests of the corporation, and, with respect to any criminal action or proceeding, had no reasonable cause to believe such person’s conduct was unlawful. In the case of a derivative action, a Delaware corporation may indemnify any such person against expenses (including attorneys’ fees) actually and reasonably incurred by such person in connection with the defense or settlement of such action or suit if such person acted in good faith and in a manner such person reasonably believed to be in or not opposed to the best interests of the corporation, except that no indemnification will be made in respect of any claim, issue or matter as to which such person will have been adjudged to be liable to the corporation unless and only to the extent that the Court of Chancery of the State of Delaware or any other court in which such action was brought determines such person is fairly and reasonably entitled to indemnity for such expenses.
Our Certificate of Incorporation and Bylaws provide that we will indemnify our directors, officers, employees and agents to the extent and in the manner permitted by the provisions of the DGCL, as amended from time to time.
Any repeal or modification of these provisions approved by our stockholders shall be prospective only, and shall not adversely affect any limitation on the liability of any of our directors or officers existing as of the time of such repeal or modification.
We are also permitted to apply for insurance on behalf of any director, officer, employee or other agent for liability arising out of his actions, whether or not the DGCL would permit indemnification.
Disclosure of Commission Position on Indemnification for Securities Act Liabilities
Insofar as indemnification for liabilities arising under the Securities Act of 1933, as amended, may be permitted to our directors, officers and persons controlling us, we have been advised that it is the Securities and Exchange Commission’s opinion that such indemnification is against public policy as expressed in the Securities Act of 1933, as amended, and is, therefore, unenforceable.
Item 13. Financial Statements
See Item 15 — “Financial Statements and Exhibits.”
Item 14. Changes in and Disagreements with Accountants on Accounting and Financial Disclosure.
On February 1, 2013, the Company dismissed Berman & Company, P.A. (“Berman”) as the Company’s independent registered public accounting firm. The dismissal was approved by the Company’s board of directors on January 31, 2013.
Berman’s reports on the Company’s financial statements for the fiscal year ended September 30, 2011 contained an explanatory paragraph indicating that there was substantial doubt as to the Company’s ability to continue as a going concern. Other than such statement, no reports of Berman contained an adverse opinion or disclaimer of opinion, and was qualified or modified as to uncertainty, audit scope or accounting principles.
During the fiscal year ended September 30, 2011 and the subsequent interim period through February 1, 2013, (i) there were no disagreements between the Company and Berman on any matter of accounting principles or practices, financial statement disclosure or auditing scope or procedure which, if not resolved to the satisfaction of Berman, would have caused Berman to make reference to the subject matter of the disagreement in connection with its report on the Company’s financial statements; and (ii) there were no reportable events as described in paragraph (a)(1)(v) of Item 304 of Regulation S-K.
On January 31, 2013, the Company’s Board of Directors approved the engagement of Li & Company, P.C. (“Li”) as its independent registered public accounting firm for the Company’s fiscal year ending September 30, 2012.
During the year ended September 30, 2012 and the subsequent interim period through, the date of engagement of Li, the Company did not consult with Li regarding either (i) the application of accounting principles to a specified transaction, either completed or proposed, or the type of audit opinion that might be rendered on the Company’s financial statements; or (ii) any matter that was either the subject of a disagreement (as defined in paragraph (a)(1)(iv) of Item 304 of Regulation S-K and the related instructions thereto) or a reportable event (as described in paragraph (a)(1)(v) of Item 304 of Regulation S-K).