Exhibit 99.1
CENTURY
COMMUNITIES
Investor Presentation
March 2015
CENTURY
COMMUNITIES
Forward-Looking Statements
Certain statements in this Investor Presentation may be regarded as “forward-looking statements” within the meaning of the Private Securities Litigation Reform Act of 1995, as amended. Certain forward-looking statements discuss the Company’s plans, strategies and intentions, and may be identified by reference to a future period or periods or by the use of forward-looking terminology, such as “expects,” “may,” “will,” “believes,” “should,” “would,” “could,” “approximately,” “anticipates,” “estimates,” “targets,” “intends,” “likely,” “projects,” “positioned,” “strategy,” “future,” and “plans.” In addition, these words may use the positive or negative or other variations of those terms. All statements other than statements of historical fact are “forward–looking statements” for purposes of federal and state securities laws. There is no guarantee that any of the events anticipated by these forward-looking statements will occur. These statements involve known and unknown risks, uncertainties and other factors that may cause our actual results, levels of activity, performance or achievements to differ from those expressed or implied by the forward-looking statement.
These forward-looking statements are based on various assumptions and the current expectations of the management of the Company, and may not be accurate because of risks and uncertainties surrounding these assumptions and expectations. Certain factors may cause actual results to differ significantly from these forward-looking statements. If any of the events occur, there is no guarantee what effect they will have on the operations or financial condition of the Company. Major risks, uncertainties and assumptions include, but are not limited to, risks relating to: the Company’s capital and financing needs and availability; any unforeseen changes to or effects on liabilities, future capital expenditures, revenues, expenses, earnings, synergies, indebtedness, financial condition, losses and future prospects; the Company’s ability to integrate and operate assets successfully after the closing of an acquisition; the effect of general economic conditions, including employment rates, housing starts, interest rate levels, availability of financing for home mortgages, and the strength of the U.S. dollar; and other factors. However, it is not possible to predict or identify all such factors.
In addition, the Company has disclosed under the heading “Risk Factors” in its Annual Report on Form 10-K for the fiscal year ended December 31, 2014 (the “Annual Report”), filed with the U.S. Securities and Exchange Commission on March 6, 2015, the risk factors which materially affect its business, financial condition and operating results. Investors are encouraged to review the Annual Report for additional information regarding the risks and uncertainties that may cause actual results to differ materially from those expressed in any forward-looking statement. Forward-looking statements included herein are made as of the date hereof, and the Company undertakes no obligation to publicly update or revise any forward-looking statement to reflect future events, developments or otherwise, except as may be required by applicable law.
2
CENTURY
COMMUNITIES
Seasoned and Aligned Management Team
Dale Francescon
Chairman & Co-Chief Executive Officer Co-founded Century and served as Co-CEOs since 2002.
Since then, Century has become a Top-50 U.S. Builder(1)
Robert Francescon
Co-Chief Executive Officer & President Own a combined 27% of the Company(2)
David Messenger 10 years of public company experience at UDR, Inc., a
Chief Financial Officer multi-billion dollar multifamily REIT, served as CFO, CAO
and Controller
(1) Based on 2013 closings, as ranked by BUILDER Online, including recent acquisitions.
(2) As of March 27, 2015.
3
CENTURY
COMMUNITIES
Key Credit Highlights
CENTURY
COMMUNITIES
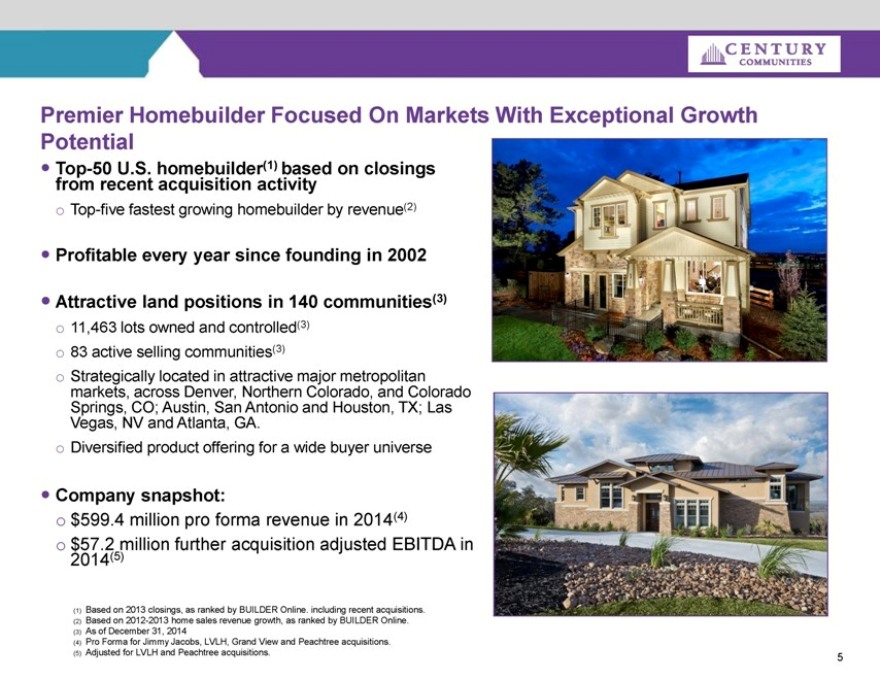
Premier Homebuilder Focused On Markets With Exceptional Growth Potential
Potential
Top-50 U.S. homebuilder(1) based on closings from recent acquisition activity
Top-five fastest growing homebuilder by revenue(2)
Profitable every year since founding in 2002
Attractive land positions in 140 communities(3)
11,463 lots owned and controlled(3)
83 active selling communities(3)
Strategically located in attractive major metropolitan markets, across Denver, Northern Colorado, and Colorado Springs, CO; Austin, San Antonio and Houston, TX; Las Vegas, NV and Atlanta, GA.
Diversified product offering for a wide buyer universe
Company snapshot:
$599.4 million pro forma revenue in 2014(4)
$57.2 million further acquisition adjusted EBITDA in 2014(5)
(1) Based on 2013 closings, as ranked by BUILDER Online. including recent acquisitions.
(2) Based on 2012-2013 home sales revenue growth, as ranked by BUILDER Online.
(3) As of December 31, 2014
(4) Pro Forma for Jimmy Jacobs, LVLH, Grand View and Peachtree acquisitions.
(5) Adjusted for LVLH and Peachtree acquisitions.
5
CENTURY
COMMUNITIES
Key Credit Highlights
Cycle-Tested and Aligned Management Team
Superior Operating Performance
Diversified Operating Strategy
Strong and Growing Geographical Footprint
Attractive and Well-Located Land Positions
Proven and Profitable Results
Conservative Capital Structure
6
CENTURY
COMMUNITIES
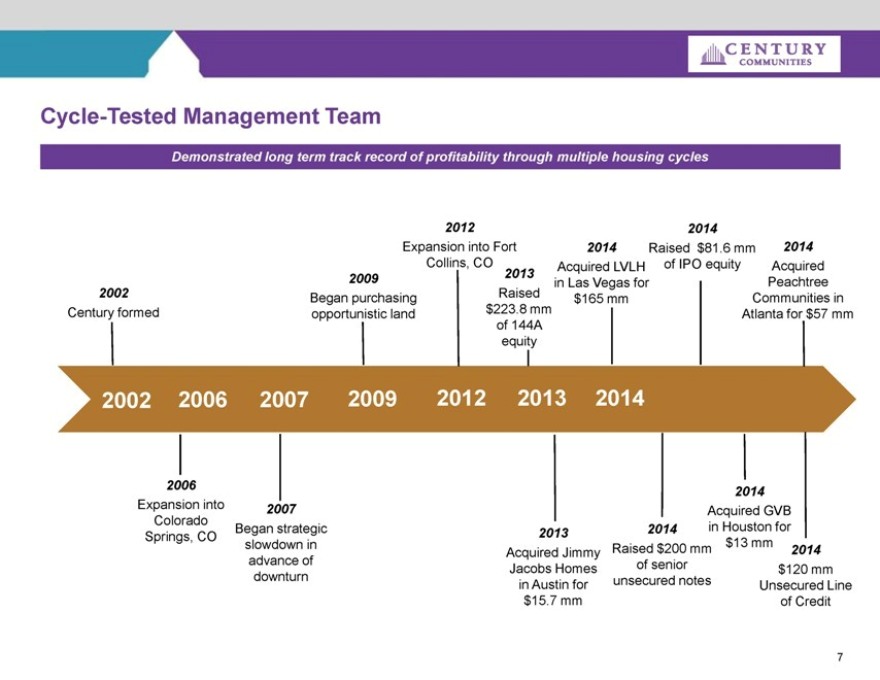
Cycle-Tested Management Team
Demonstrated long term track record of profitability through multiple housing cycles
2002
Century formed
2009
Began purchasing opportunistic land
2012
Expansion into Fort Collins, CO
2013
Raised $223.8 mm of 144A equity
2014
Acquired LVLH in Las Vegas for $165 mm
2014
Raised $81.6 mm of IPO equity
2014 Acquired Peachtree Communities in Atlanta for $57 mm
2002 2006 2007 2009 2012 2013 2014
2006
Expansion into Colorado Springs, CO
2007
Began strategic slowdown in advance of downturn
2013
Acquired Jimmy Jacobs Homes in Austin for $15.7 mm
2014
Raised $200 mm of senior unsecured notes
2014
Acquired GVB in Houston for $13 mm
2014
$120 mm Unsecured Line of Credit
7
CENTURY
COMMUNITIES
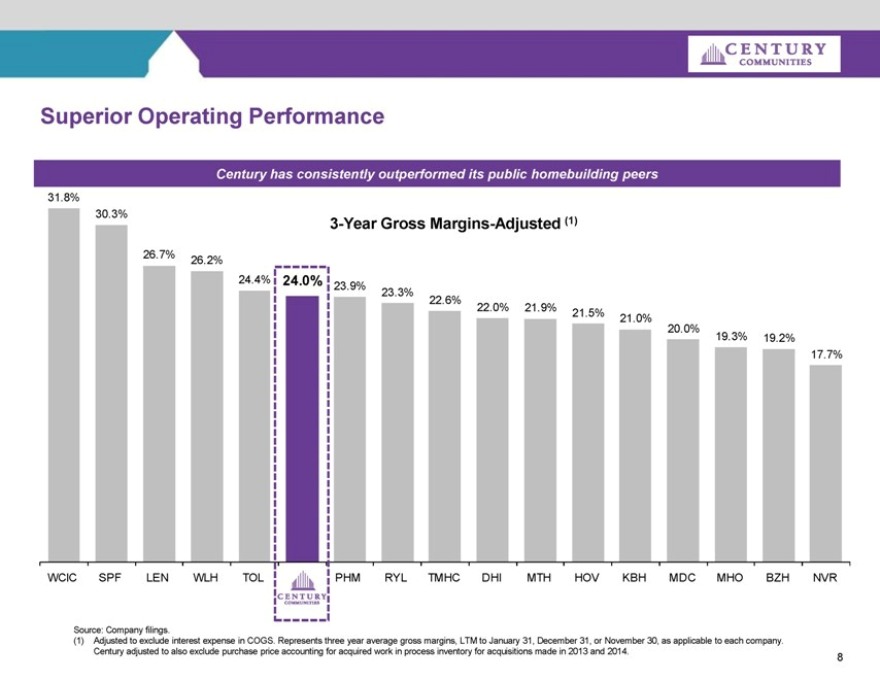
Superior Operating Performance
Century has consistently outperformed its public homebuilding peers
31.8%
30.3%
3-Year Gross Margins-Adjusted (1)
26.7% 26.2%
24.4% 24.0% 23.9%
23.3%
22.6%
22.0% 21.9% 21.5% 21.0%
20.0%
19.3% 19.2%
17.7%
WCIC SPF LEN WLH TOL CENTURY COMMUNITIES PHM RYL TMHC DHI MTH HOV KBH MDC MHO BZH NVR
Source: Company filings.
(1) Adjusted to exclude interest expense in COGS. Represents three year average gross margins, LTM to January 31, December 31, or November 30, as applicable to each company. Century adjusted to also exclude purchase price accounting for acquired work in process inventory for acquisitions made in 2013 and 2014.
8
CENTURY
COMMUNITIES
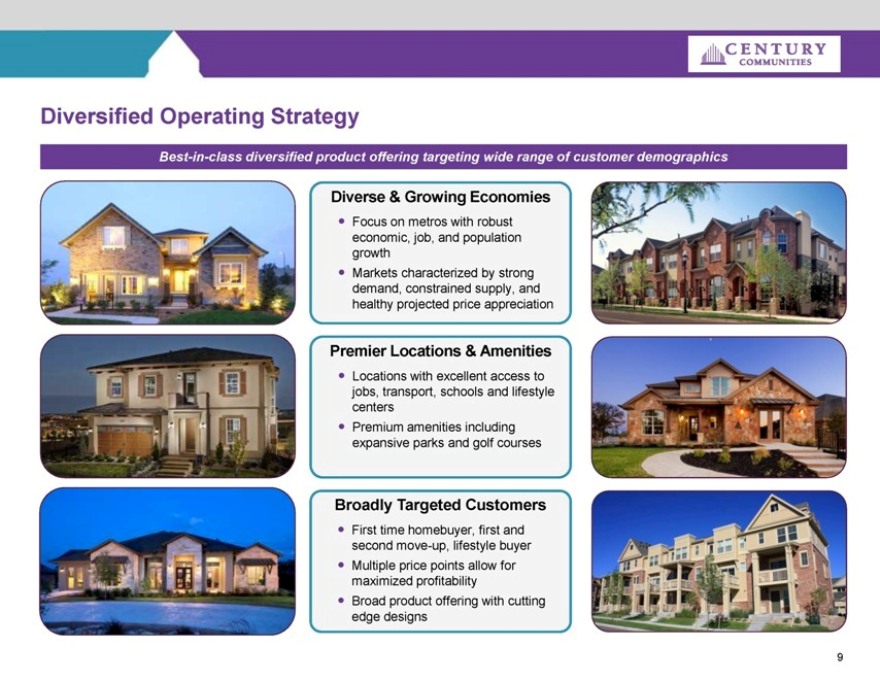
Diversified Operating Strategy
Best-in-class diversified product offering targeting wide range of customer demographics
Diverse & Growing Economies
Focus on metros with robust economic, job, and population growth
Markets characterized by strong demand, constrained supply, and healthy projected price appreciation
Premier Locations & Amenities
Locations with excellent access to jobs, transport, schools and lifestyle centers
Premium amenities including expansive parks and golf courses
Broadly Targeted Customers
First time homebuyer, first and second move-up, lifestyle buyer
Multiple price points allow for maximized profitability
Broad product offering with cutting edge designs
9
CENTURY
COMMUNITIES
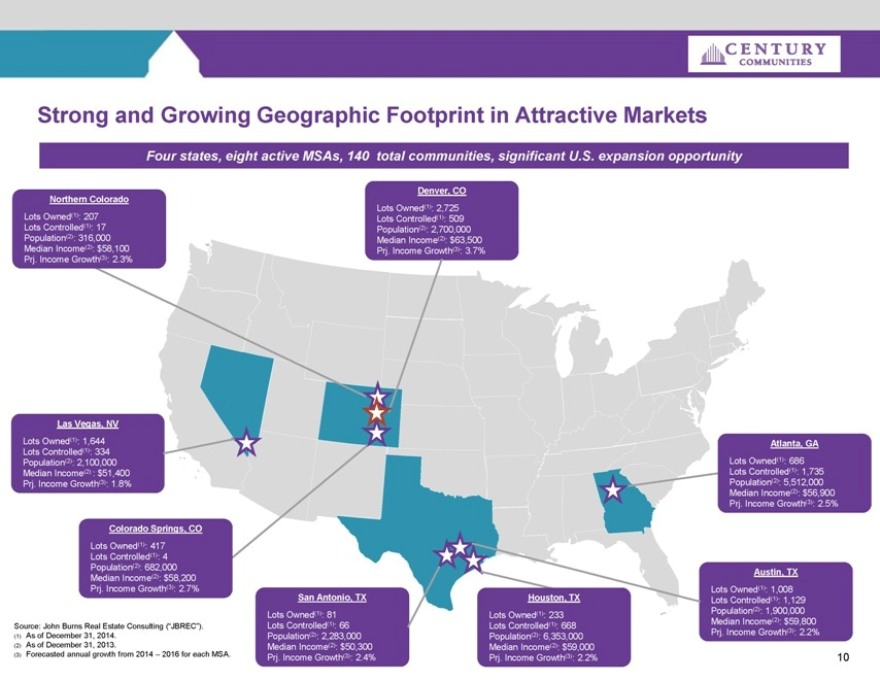
Strong and Growing Geographic Footprint in Attractive Markets
Four states, eight active MSAs, 140 total communities, significant U.S. expansion opportunity
Northern Colorado
Lots Owned(1): 207 Lots Controlled(1): 17 Population(2): 316,000 Median Income(2): $58,100 Prj. Income Growth(3): 2.3%
Denver, CO
Lots Owned(1): 2,725 Lots Controlled(1): 509 Population(2): 2,700,000 Median Income(2): $63,500 Prj. Income Growth(3): 3.7%
Las Vegas, NV
Lots Owned(1): 1,644 Lots Controlled(1): 334 Population(2): 2,100,000 Median Income(2) : $51,400 Prj. Income Growth(3): 1.8%
Colorado Springs, CO
Lots Owned(1): 417 Lots Controlled(1): 4 Population(2): 682,000 Median Income(2): $58,200 Prj. Income Growth(3): 2.7%
San Antonio, TX
Lots Owned(1): 81 Lots Controlled(1): 66 Population(2): 2,283,000 Median Income(2): $50,300 Prj. Income Growth(3): 2.4%
Houston, TX
Lots Owned(1): 233 Lots Controlled(1): 668 Population(2): 6,353,000 Median Income(2): $59,000 Prj. Income Growth(3): 2.2%
Atlanta, GA
Lots Owned(1): 686 Lots Controlled(1): 1,735 Population(2): 5,512,000 Median Income(2): $56,900 Prj. Income Growth(3): 2.5%
Austin, TX
Lots Owned(1): 1,008 Lots Controlled(1): 1,129 Population(2): 1,900,000 Median Income(2): $59,800 Prj. Income Growth(3): 2.2%
Source: John Burns Real Estate Consulting (“JBREC”).
(1) As of December 31, 2014.
(2) As of December 31, 2013.
(3) Forecasted annual growth from 2014 – 2016 for each MSA.
10
CENTURY
COMMUNITIES
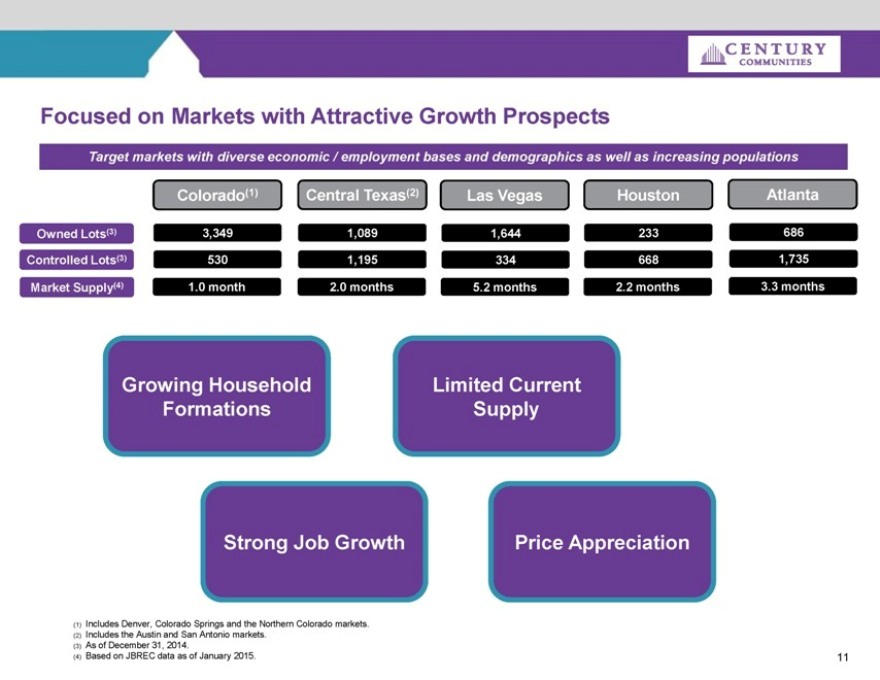
Focused on Markets with Attractive Growth Prospects
Target markets with diverse economic / employment bases and demographics as well as increasing populations
Colorado(1) Central Texas(2) Las Vegas Houston Atlanta
Owned Lots(3) 3,349 1,089 1,644 233 686
Controlled Lots(3) 530 1,195 334 668 1,735
Market Supply(4) 1.0 month 2.0 months 5.2 months 2.2 months 3.3 months
Growing Household Formations
Limited Current Supply
Strong Job Growth
Price Appreciation
(1) Includes Denver, Colorado Springs and the Northern Colorado markets.
(2) Includes the Austin and San Antonio markets.
(3) As of December 31, 2014.
(4) Based on JBREC data as of January 2015.
11
CENTURY
COMMUNITIES
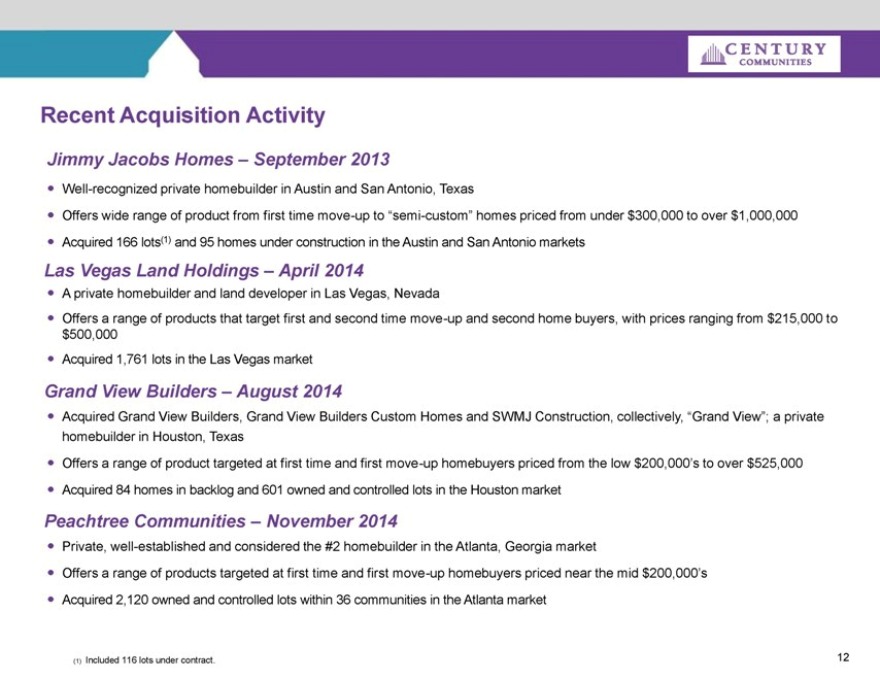
Recent Acquisition Activity
Jimmy Jacobs Homes – September 2013
Well-recognized private homebuilder in Austin and San Antonio, Texas
Offers wide range of product from first time move-up to “semi-custom” homes priced from under $300,000 to over $1,000,000
Acquired 166 lots(1) and 95 homes under construction in the Austin and San Antonio markets
Las Vegas Land Holdings – April 2014
A private homebuilder and land developer in Las Vegas, Nevada
Offers a range of products that target first and second time move-up and second home buyers, with prices ranging from $215,000 to $500,000
Acquired 1,761 lots in the Las Vegas market
Grand View Builders – August 2014
Acquired Grand View Builders, Grand View Builders Custom Homes and SWMJ Construction, collectively, “Grand View”; a private homebuilder in Houston, Texas
Offers a range of product targeted at first time and first move-up homebuyers priced from the low $200,000’s to over $525,000
Acquired 84 homes in backlog and 601 owned and controlled lots in the Houston market
Peachtree Communities – November 2014
Private, well-established and considered the #2 homebuilder in the Atlanta, Georgia market
Offers a range of products targeted at first time and first move-up homebuyers priced near the mid $200,000’s
Acquired 2,120 owned and controlled lots within 36 communities in the Atlanta market
(1) Included 116 lots under contract.
12
CENTURY
COMMUNITIES
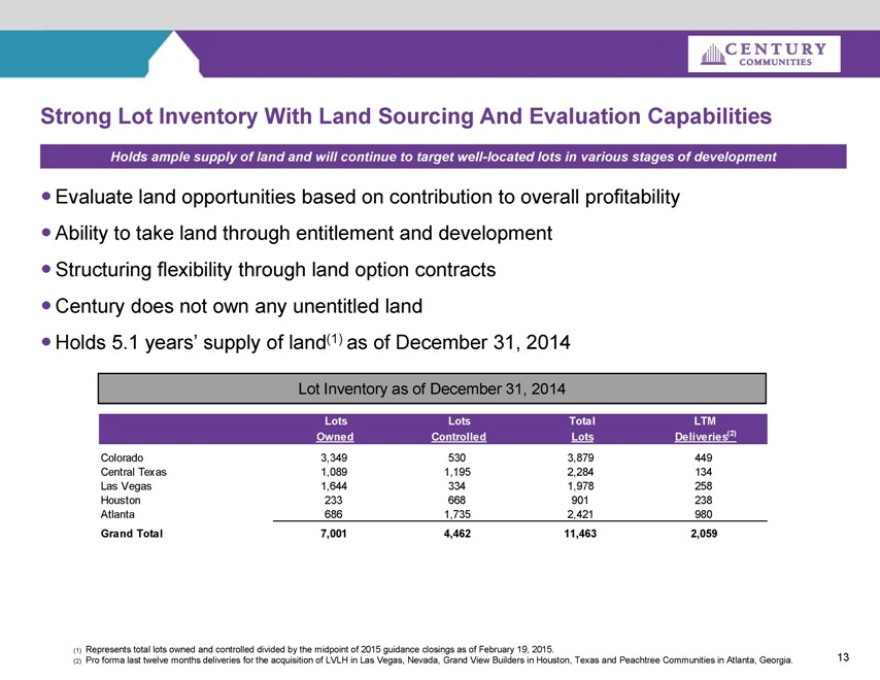
Strong Lot Inventory With Land Sourcing And Evaluation Capabilities
Holds ample supply of land and will continue to target well-located lots in various stages of development
Evaluate land opportunities based on contribution to overall profitability
Ability to take land through entitlement and development
Structuring flexibility through land option contracts
Century does not own any unentitled land
Holds 5.1 years’ supply of land(1) as of December 31, 2014
Lot Inventory as of December 31, 2014
Lots Lots Total LTM
Owned Controlled Lots Deliveries(2)
Colorado 3,349 530 3,879 449
Central Texas 1,089 1,195 2,284 134
Las Vegas 1,644 334 1,978 258
Houston 233 668 901 238
Atlanta 686 1,735 2,421 980
Grand Total 7,001 4,462 11,463 2,059
(1) Represents total lots owned and controlled divided by the midpoint of 2015 guidance closings as of February 19, 2015.
(2) Pro forma last twelve months deliveries for the acquisition of LVLH in Las Vegas, Nevada, Grand View Builders in Houston, Texas and Peachtree Communities in Atlanta, Georgia.
13
CENTURY
COMMUNITIES
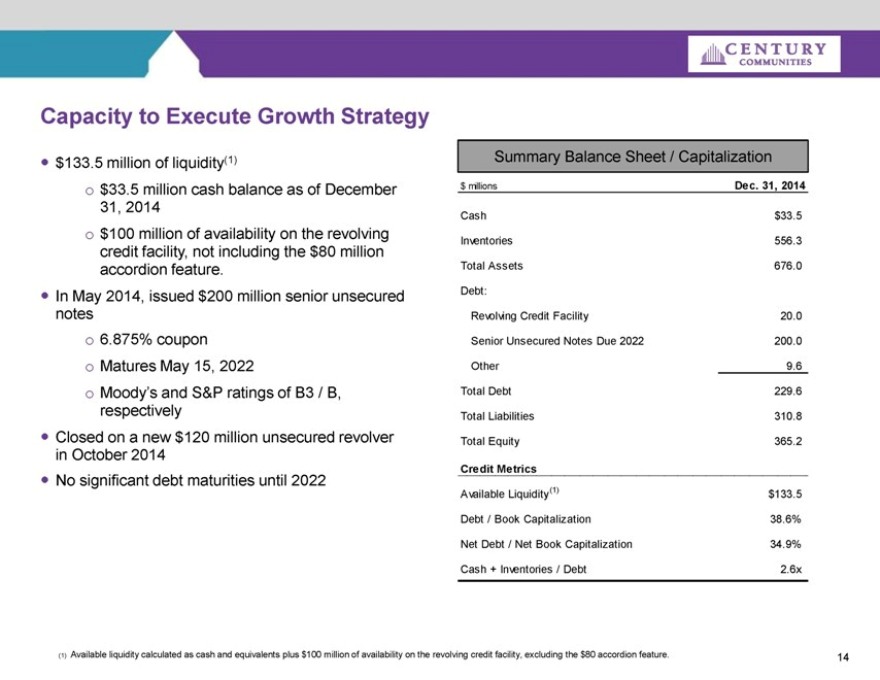
Capacity to Execute Growth Strategy
$133.5 million of liquidity(1)
$33.5 million cash balance as of December 31, 2014
$100 million of availability on the revolving credit facility, not including the $80 million accordion feature.
In May 2014, issued $200 million senior unsecured notes
6.875% coupon
Matures May 15, 2022
Moody’s and S&P ratings of B3 / B, respectively
Closed on a new $120 million unsecured revolver in October 2014
No significant debt maturities until 2022
Summary Balance Sheet / Capitalization
$ millions Dec. 31, 2014
Cash $33.5
Inventories 556.3
Total Assets 676.0
Debt:
Revolving Credit Facility 20.0
Senior Unsecured Notes Due 2022 200.0
Other 9.6
Total Debt 229.6
Total Liabilities 310.8
Total Equity 365.2
Credit Metrics
Available Liquidity(1) $133.5
Debt / Book Capitalization 38.6%
Net Debt / Net Book Capitalization 34.9%
Cash + Inventories / Debt 2.6x
(1) Available liquidity calculated as cash and equivalents plus $100 million of availability on the revolving credit facility, excluding the $80 accordion feature.
14
CENTURY
COMMUNITIES
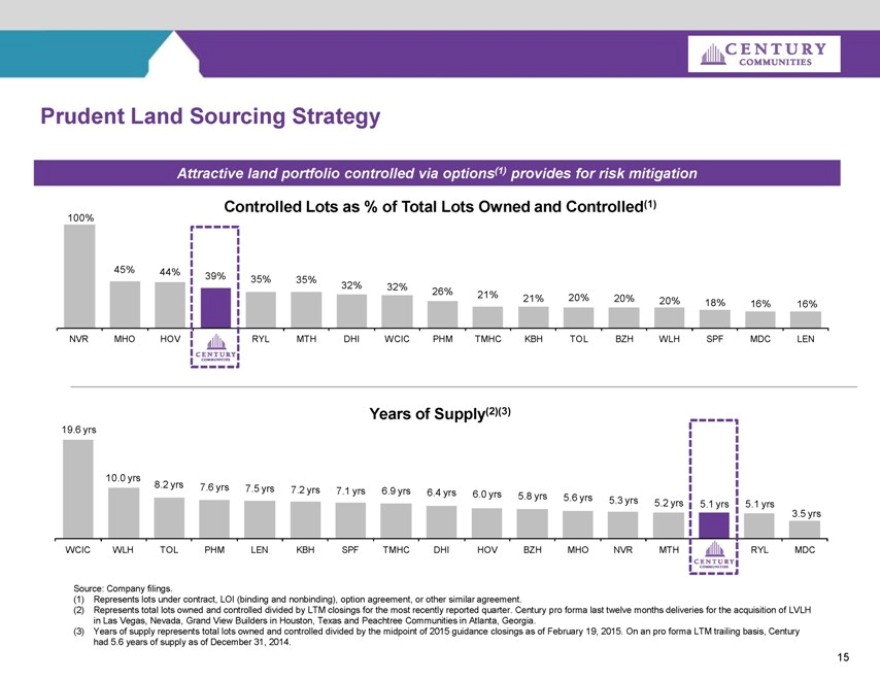
Prudent Land Sourcing Strategy
Attractive land portfolio controlled via options(1) provides for risk mitigation
Controlled Lots as % of Total Lots Owned and Controlled(1)
100%
45% 44% 39% 35% 35%
32% 32% 26%
21% 21% 20% 20% 20% 18% 16% 16%
NVR MHO HOV CENTURY COMMUNITIES RYL MTH DHI WCIC PHM TMHC KBH TOL BZH WLH SPF MDC LEN
Years of Supply(2)(3)
19.6 yrs
10.0 yrs
8.2 yrs 7.6 yrs 7.5 yrs 7.2 yrs 7.1 yrs 6.9 yrs 6.4 yrs 6.
0 yrs 5.8 yrs 5.6 yrs 5.3 yrs 5.2 yrs 5.1 yrs 5.1 yrs
3.5 yrs
WCIC WLH TOL PHM LEN KBH SPF TMHC DHI HOV BZH MHO NVR MTH CENTURY COMMUNITIES RYL MDC
Source: Company filings.
(1) Represents lots under contract, LOI (binding and nonbinding), option agreement, or other similar agreement.
(2) Represents total lots owned and controlled divided by LTM closings for the most recently reported quarter. Century pro forma last twelve months deliveries for the acquisition of LVLH in Las Vegas, Nevada, Grand View Builders in Houston, Texas and Peachtree Communities in Atlanta, Georgia.
(3) Years of supply represents total lots owned and controlled divided by the midpoint of 2015 guidance closings as of February 19, 2015. On an pro forma LTM trailing basis, Century had 5.6 years of supply as of December 31, 2014.
15
CENTURY
COMMUNITIES
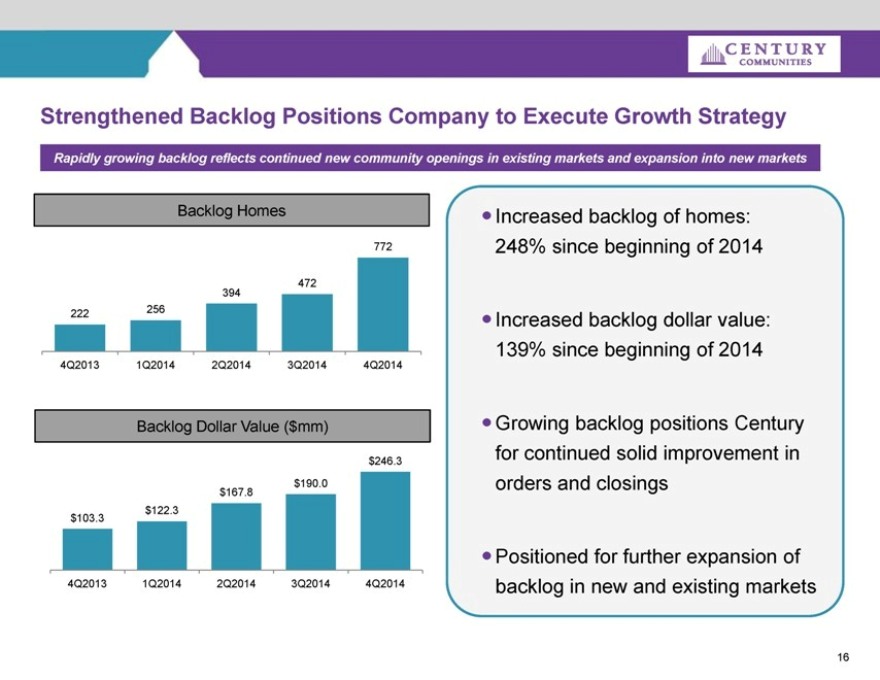
Strengthened Backlog Positions Company to Execute Growth Strategy
Rapidly growing backlog reflects continued new community openings in existing markets and expansion into new markets
Backlog Homes
772
472
394
222 256
4Q2013 1Q2014 2Q2014 3Q2014 4Q2014
Backlog Dollar Value ($mm)
$246.3
$190.0
$167.8
$122.3
$103.3
4Q2013 1Q2014 2Q2014 3Q2014 4Q2014
Increased backlog of homes: 248% since beginning of 2014
Increased backlog dollar value: 139% since beginning of 2014
Growing backlog positions Century for continued solid improvement in orders and closings
Positioned for further expansion of backlog in new and existing markets
16
Century Communities
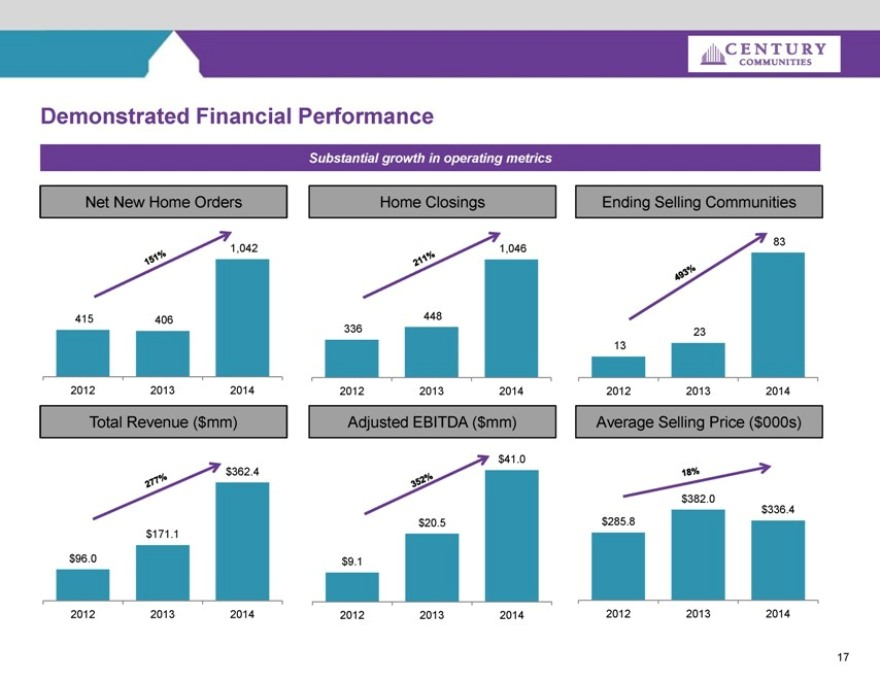
Demonstrated Financial Performance
Substantial growth in operating metrics
Net New Home Orders Home Closings Ending Selling Communities
151% 1,042 211% 1,046 493% 83
415 406 448
336 23
13
2012 2013 2014 2012 2013 2014 2012 2013 2014
Total Revenue ($mm) Adjusted EBITDA ($mm) Average Selling Price ($000s)
$41.0
277% $362.4 352% 18%
$382.0
$336.4
$20.5 $285.8
$171.1
$96.0 $9.1
2012 2013 2014 2012 2013 2014 2012 2013 2014
17
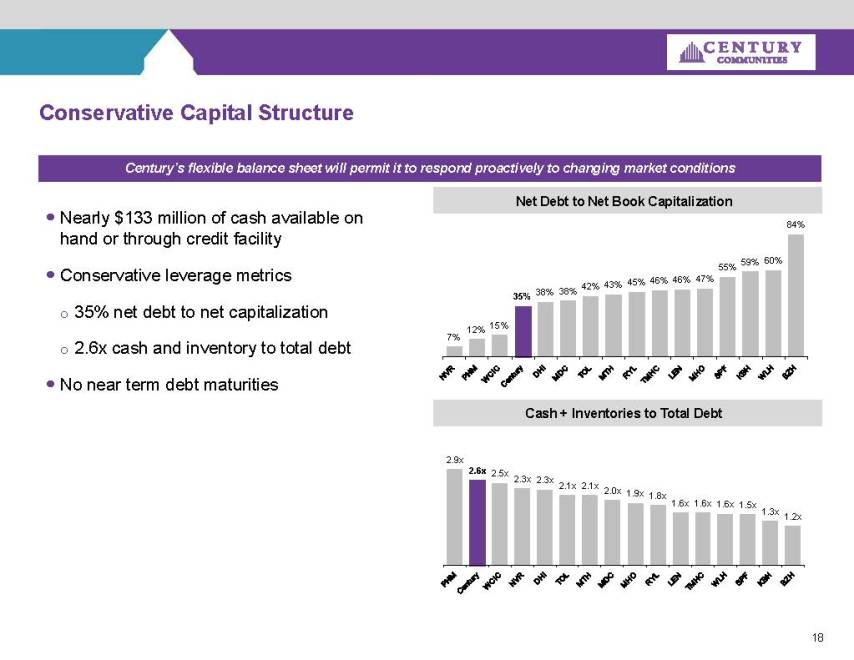
Century’s flexible balance sheet will permit it to respond proactively to changing market conditions
Nearly $133 million of cash available on hand or through credit facility
Conservative leverage metrics
35% net debt to net capitalization
2.6x cash and inventory to total debt
No near term debt maturities
Net Debt to Net Book Capitalization
84%
59% 60% 55% 45% 46% 46% 47% 42% 43% 38% 38%
35%
15%
7% 12%
NVR PHM WCIC CENTURY DHI MDC TOL MTH RYL TMHC LEN MHO SPF KBH BZH
Cash + Inventories to Total Debt
2.9x
2.6x 2.5x
2.3x 2.3x
2.1x 2.1x
2.0x 1.9x
1.8x
1.6x 1.6x 1.6x 1.5x 1.3x
1.2x
PHM CENTURY WCIC NVR DHI TOL MTH MDC MHO RYL LEN TMHC WLH SPF KBH BZH
18

CENTURY
COMMUNITIES
Key Credit Highlights
Cycle-Tested and Aligned Management Team
Superior Operating Performance
Diversified Operating Strategy
Strong and Growing Geographical Footprint
Attractive and Well-Located Land Positions
Proven and Profitable Results
Conservative Capital Structure
19
CENTURY
COMMUNITIES
Recent Acquisitions
CENTURY
COMMUNITIES
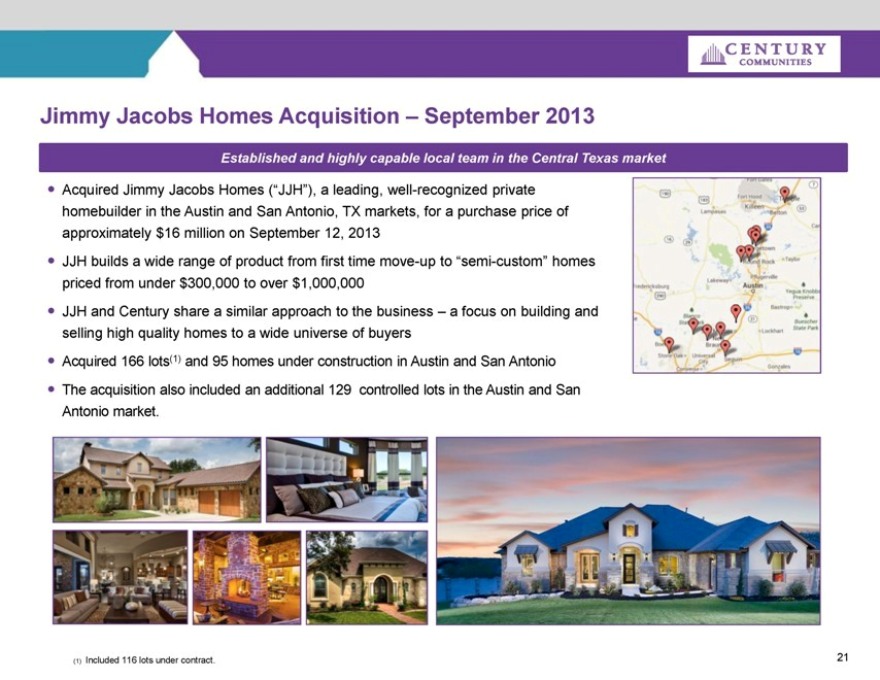
Jimmy Jacobs Homes Acquisition – September 2013
Established and highly capable local team in the Central Texas market
Acquired Jimmy Jacobs Homes (“JJH”), a leading, well-recognized private homebuilder in the Austin and San Antonio, TX markets, for a purchase price of approximately $16 million on September 12, 2013
JJH builds a wide range of product from first time move-up to “semi-custom” homes priced from under $300,000 to over $1,000,000
JJH and Century share a similar approach to the business – a focus on building and selling high quality homes to a wide universe of buyers
Acquired 166 lots(1) and 95 homes under construction in Austin and San Antonio
The acquisition also included an additional 129 controlled lots in the Austin and San Antonio market.
(1) Included 116 lots under contract. 21
CENTURY
COMMUNITIES
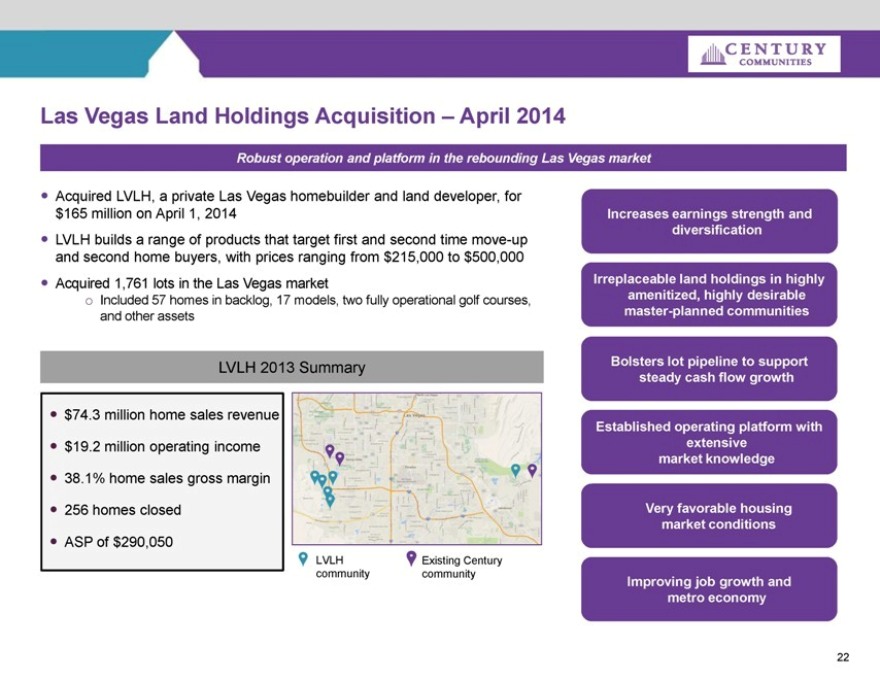
Las Vegas Land Holdings Acquisition – April 2014
Robust operation and platform in the rebounding Las Vegas market
Acquired LVLH, a private Las Vegas homebuilder and land developer, for $165 million on April 1, 2014
LVLH builds a range of products that target first and second time move-up and second home buyers, with prices ranging from $215,000 to $500,000
Acquired 1,761 lots in the Las Vegas market
Included 57 homes in backlog, 17 models, two fully operational golf courses, and other assets
LVLH 2013 Summary
$74.3 million home sales revenue
$19.2 million operating income
38.1% home sales gross margin
256 homes closed
ASP of $290,050
LVLH
community
Existing Century
community
Increases earnings strength and diversification
Irreplaceable land holdings in highly amenitized, highly desirable master-planned communities
Bolsters lot pipeline to support steady cash flow growth
Established operating platform with extensive market knowledge
Very favorable housing market conditions
Improving job growth and metro economy
22
CENTURY
COMMUNITIES
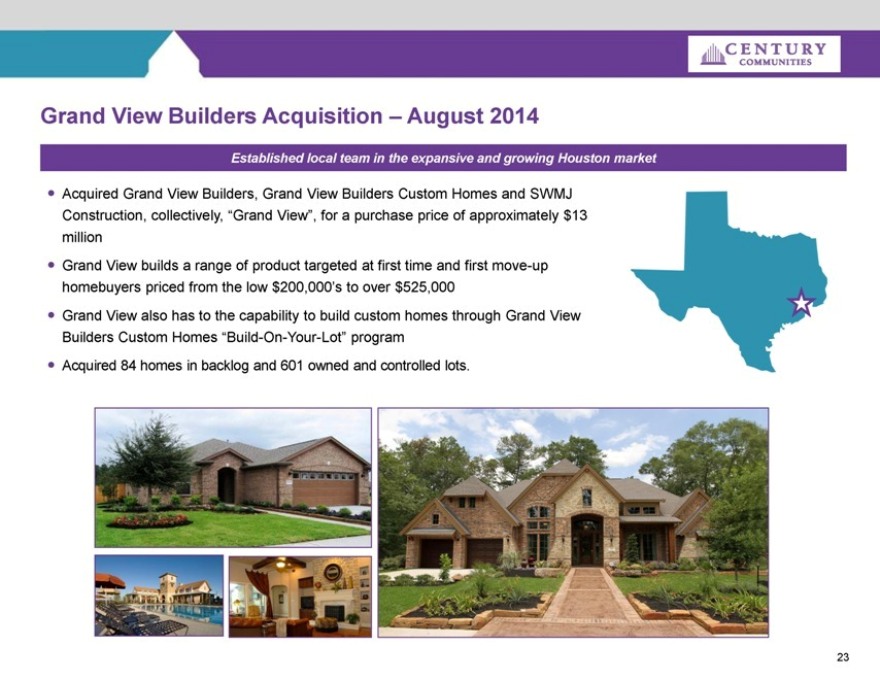
Grand View Builders Acquisition – August 2014
Established local team in the expansive and growing Houston market
Acquired Grand View Builders, Grand View Builders Custom Homes and SWMJ
Construction, collectively, “Grand View”, for a purchase price of approximately $13 million
Grand View builds a range of product targeted at first time and first move-up homebuyers priced from the low $200,000’s to over $525,000
Grand View also has to the capability to build custom homes through Grand View
Builders Custom Homes “Build-On-Your-Lot” program
Acquired 84 homes in backlog and 601 owned and controlled lots.
23
CENTURY
COMMUNITIES
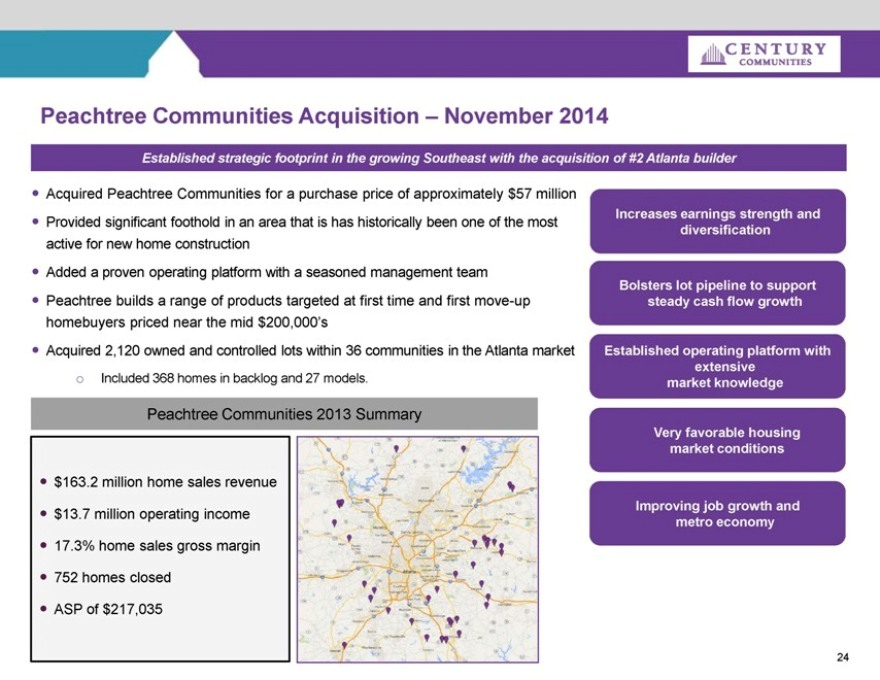
Peachtree Communities Acquisition – November 2014
Established strategic footprint in the growing Southeast with the acquisition of #2 Atlanta builder
Acquired Peachtree Communities for a purchase price of approximately $57 million
Provided significant foothold in an area that is has historically been one of the most active for new home construction
Added a proven operating platform with a seasoned management team
Peachtree builds a range of products targeted at first time and first move-up homebuyers priced near the mid $200,000’s
Acquired 2,120 owned and controlled lots within 36 communities in the Atlanta market
Included 368 homes in backlog and 27 models.
Peachtree Communities 2013 Summary
$163.2 million home sales revenue
$13.7 million operating income
17.3% home sales gross margin
752 homes closed
ASP of $217,035
Increases earnings strength and diversification
Bolsters lot pipeline to support steady cash flow growth
Established operating platform with extensive market knowledge
Very favorable housing market conditions
Improving job growth and metro economy
24
CENTURY
COMMUNITIES
Historical Financial Performance
25
CENTURY
COMMUNITIES
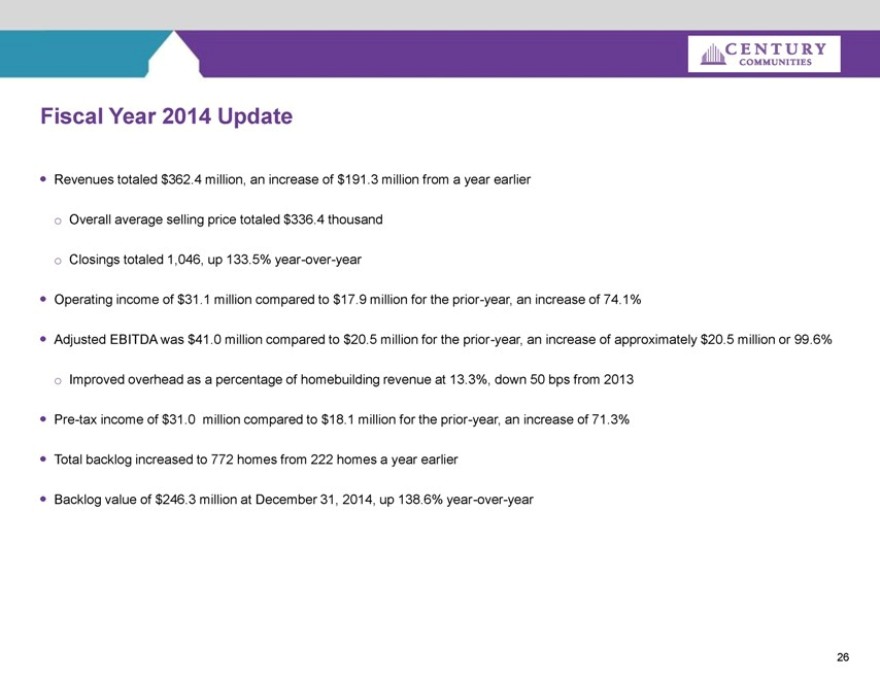
Fiscal Year 2014 Update
Revenues totaled $362.4 million, an increase of $191.3 million from a year earlier
Overall average selling price totaled $336.4 thousand
Closings totaled 1,046, up 133.5% year-over-year
Operating income of $31.1 million compared to $17.9 million for the prior-year, an increase of 74.1%
Adjusted EBITDA was $41.0 million compared to $20.5 million for the prior-year, an increase of approximately $20.5 million or 99.6%
Improved overhead as a percentage of homebuilding revenue at 13.3%, down 50 bps from 2013
Pre-tax income of $31.0 million compared to $18.1 million for the prior-year, an increase of 71.3%
Total backlog increased to 772 homes from 222 homes a year earlier
Backlog value of $246.3 million at December 31, 2014, up 138.6% year-over-year
26
CENTURY
COMMUNITIES
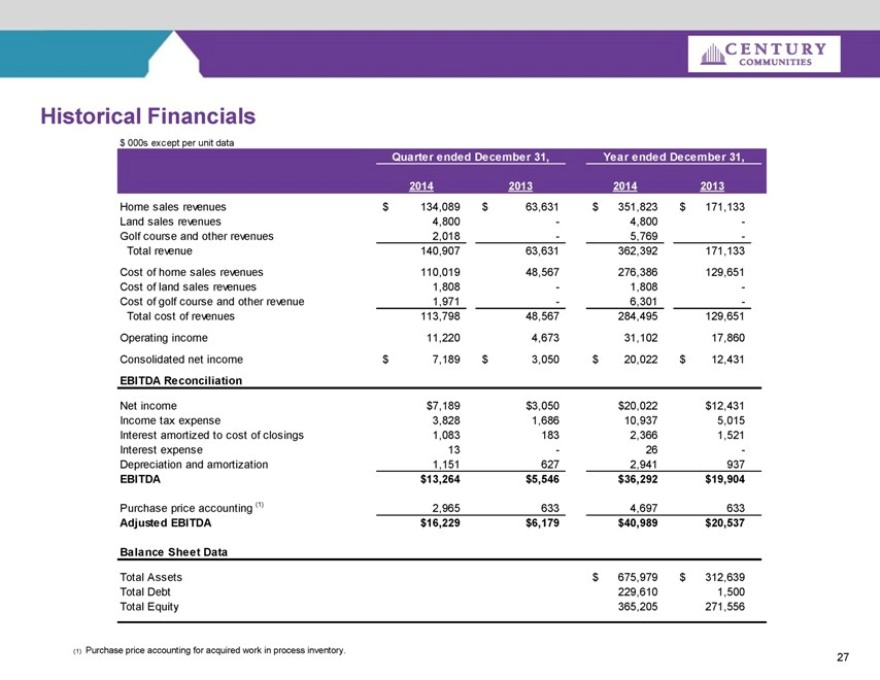
Historical Financials
$ 000s except per unit data
Quarter ended December 31,
Year ended December 31,
2014
2013
2014
2013
Home sales revenues
$134,089
$63,631
$351,823
$171,133
Land sales revenues
4,800
-
4,800
-
Golf course and other revenues
2,018
-
5,769
-
Total revenue
140,907
63,631
362,392
171,133
Cost of home sales revenues
110,019
48,567
276,386
129,651
Cost of land sales revenues
1,808
-
1,808
-
Cost of golf course and other revenue
1,971
-
6,301
-
Total cost of revenues
113,798
48,567
284,495
129,651
Operating income
11,220
4,673
31,102
17,860
Consolidated net income
$7,189
$3,050
$20,022
$12,431
EBITDA Reconciliation
Net income
$7,189
$3,050
$20,022
$12,431
Income tax expense
3,828
1,686
10,937
5,015
Interest amortized to cost of closings
1,083
183
2,366
1,521
Interest expense
13
-
26
-
Depreciation and amortization
1,151
627
2,941
937
EBITDA
$13,264
$5,546
$36,292
$19,904
Purchase price accounting (1)
2,965
633
4,697
633
Adjusted EBITDA
$16,229
$6,179
$40,989
$20,537
Balance Sheet Data
Total Assets
$675,979
$312,639
Total Debt
229,610
1,500
Total Equity
365,205
271,556
(1) Purchase price accounting for acquired work in process inventory.
27
CENTURY
COMMUNITIES
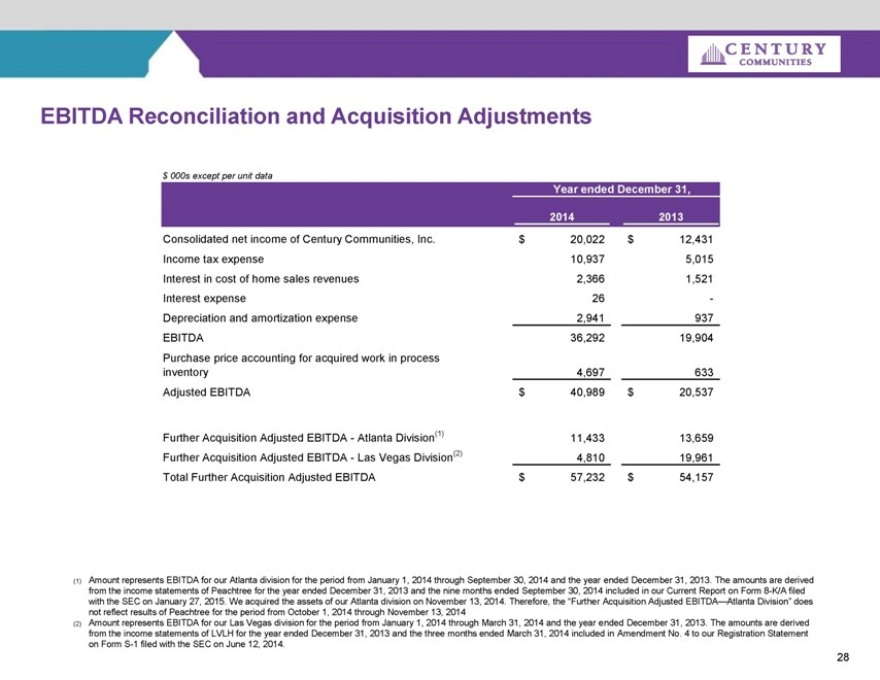
EBITDA Reconciliation and Acquisition Adjustments
$ 000s except per unit data
Year ended December 31,
2014
2013
Consolidated net income of Century Communities, Inc.
$20,022
$12,431
Income tax expense
10,937
5,015
Interest in cost of home sales revenues
2,366
1,521
Interest expense
26
-
Depreciation and amortization expense
2,941
937
EBITDA
36,292
19,904
Purchase price accounting for acquired work in process inventory
4,697
633
Adjusted EBITDA
$40,989
$20,537
Further Acquisition Adjusted EBITDA - Atlanta Division(1)
11,433
13,659
Further Acquisition Adjusted EBITDA - Las Vegas Division(2)
4,810
19,961
Total Further Acquisition Adjusted EBITDA
$57,232
$54,157
(1) Amount represents EBITDA for our Atlanta division for the period from January 1, 2014 through September 30, 2014 and the year ended December 31, 2013. The amounts are derived from the income statements of Peachtree for the year ended December 31, 2013 and the nine months ended September 30, 2014 included in our Current Report on Form 8-K/A filed with the SEC on January 27, 2015. We acquired the assets of our Atlanta division on November 13, 2014. Therefore, the “Further Acquisition Adjusted EBITDA—Atlanta Division” does not reflect results of Peachtree for the period from October 1, 2014 through November 13, 2014
(2) Amount represents EBITDA for our Las Vegas division for the period from January 1, 2014 through March 31, 2014 and the year ended December 31, 2013. The amounts are derived from the income statements of LVLH for the year ended December 31, 2013 and the three months ended March 31, 2014 included in Amendment No. 4 to our Registration Statement on Form S-1 filed with the SEC on June 12, 2014.
28
CENTURY
COMMUNITIES
CENTURY
COMMUNITIES
29