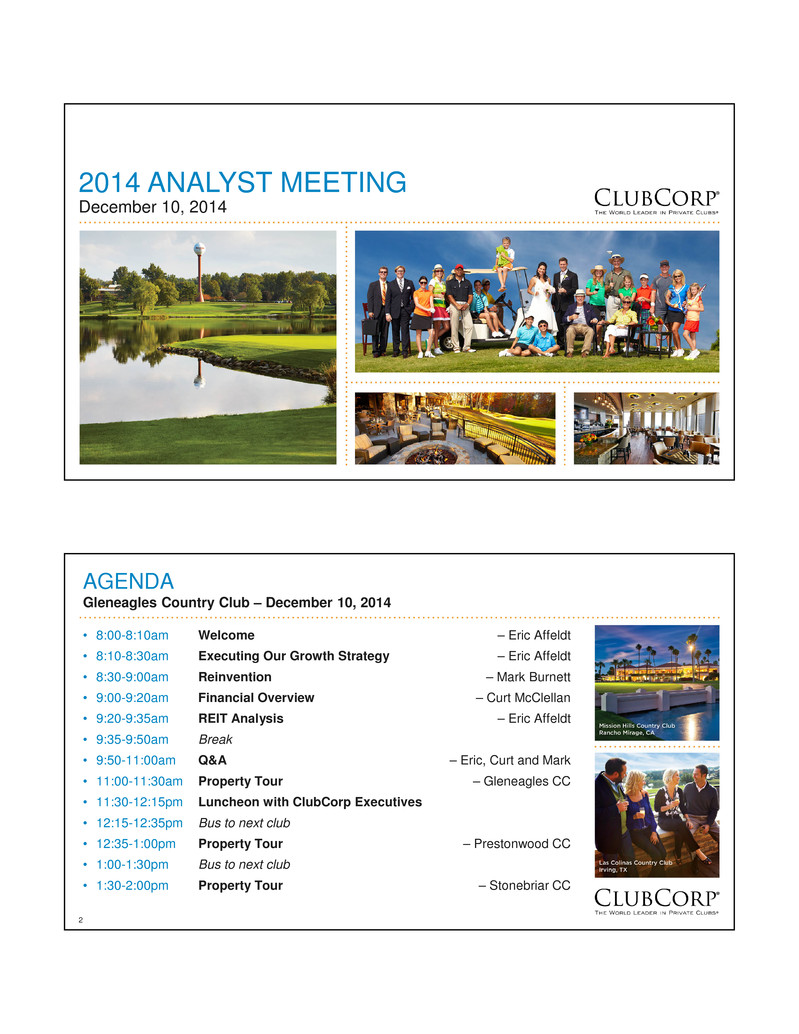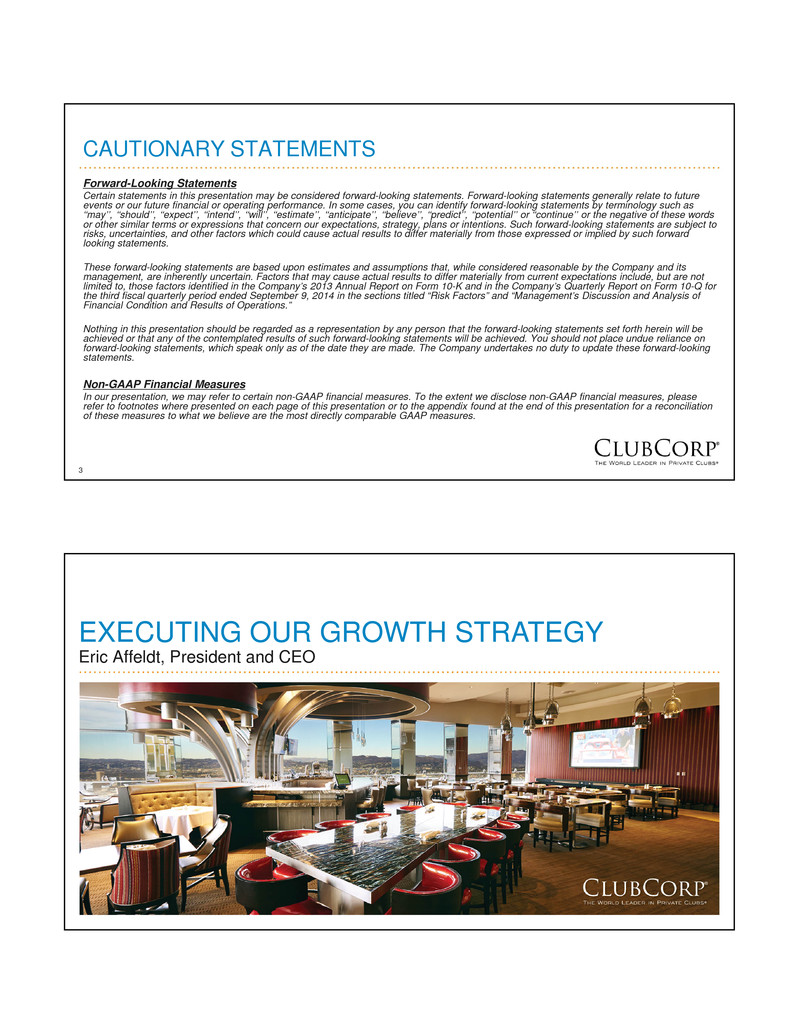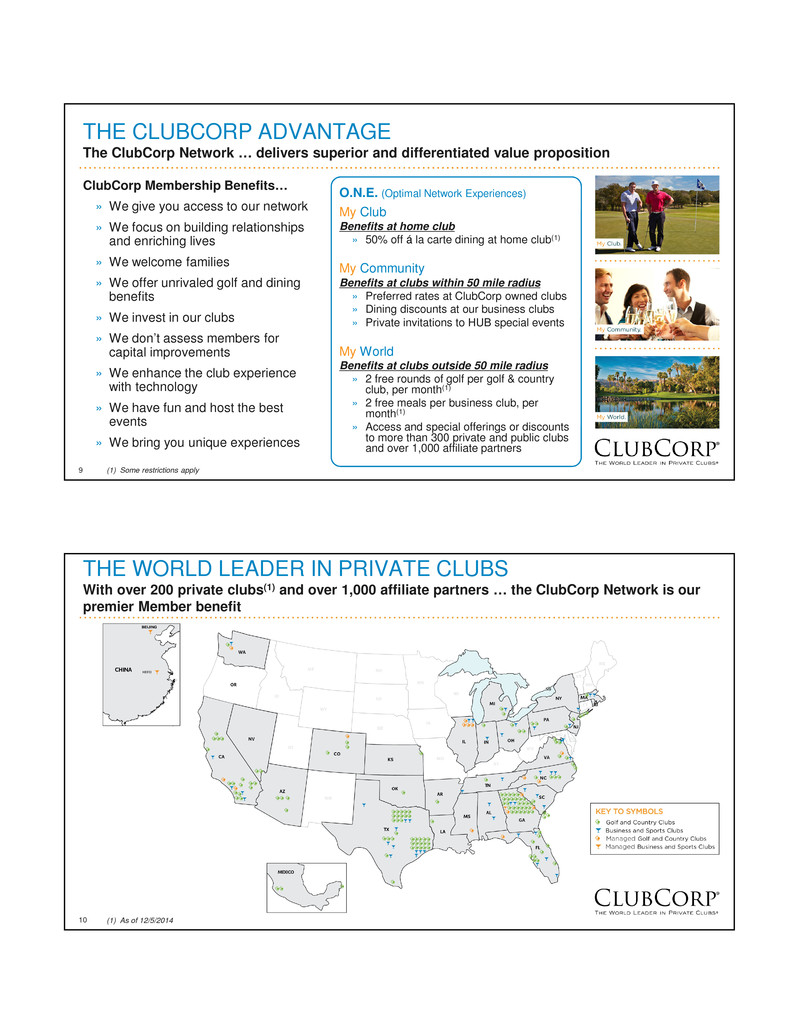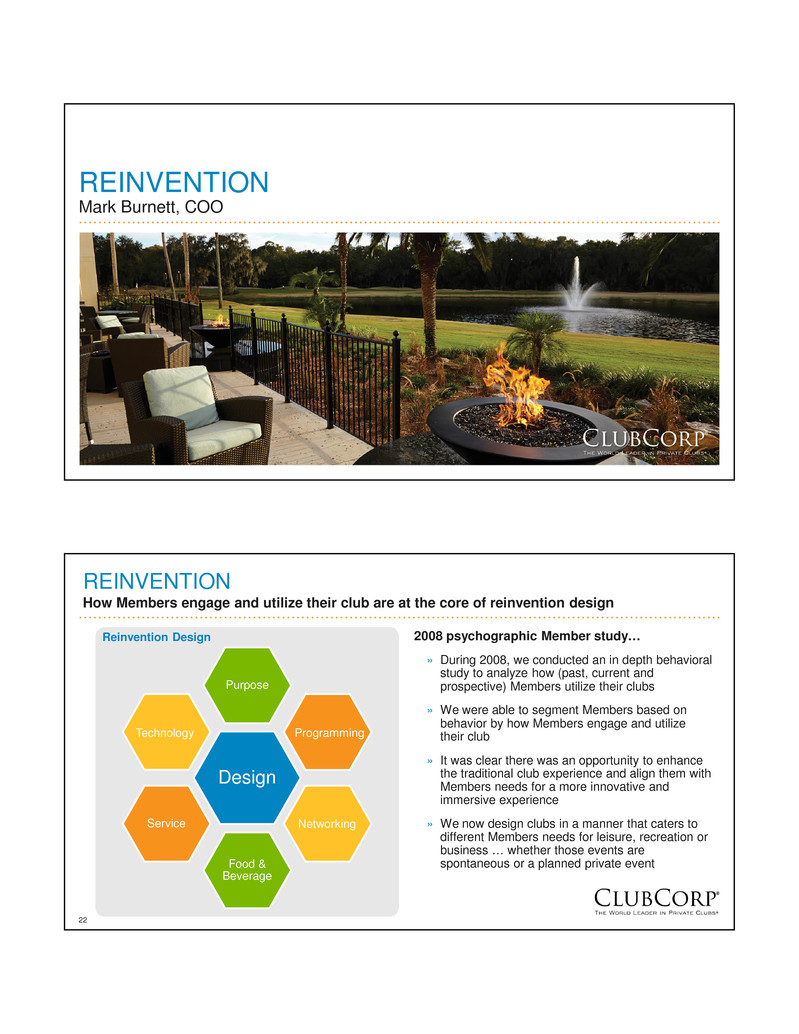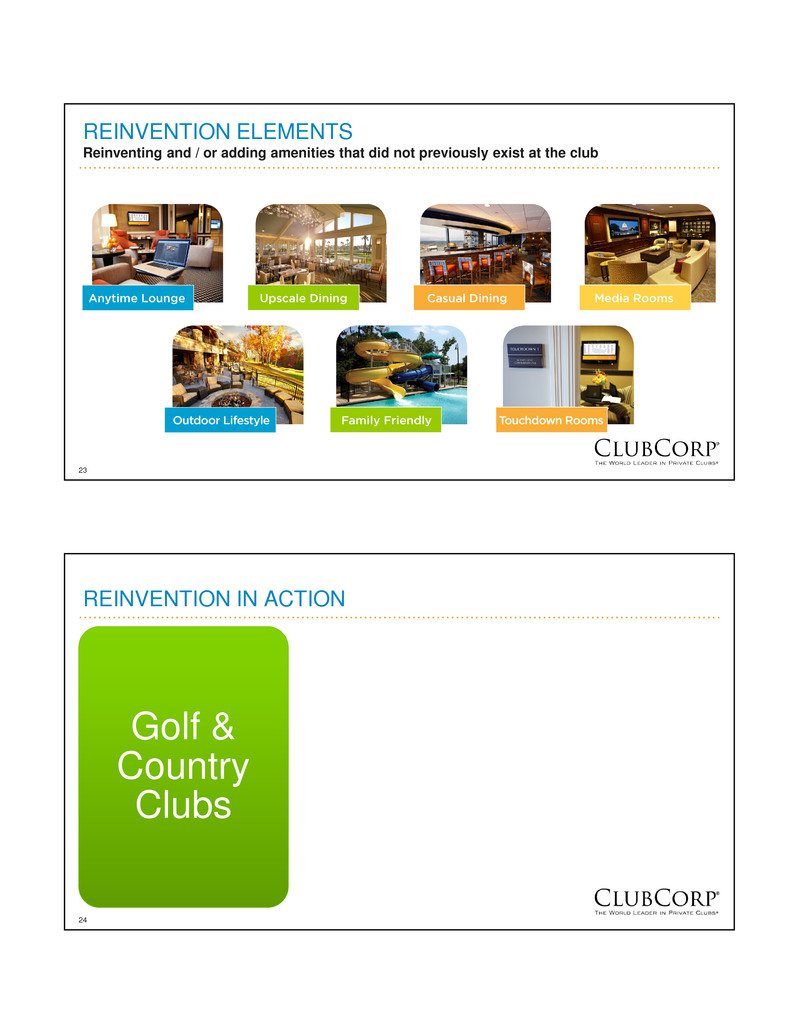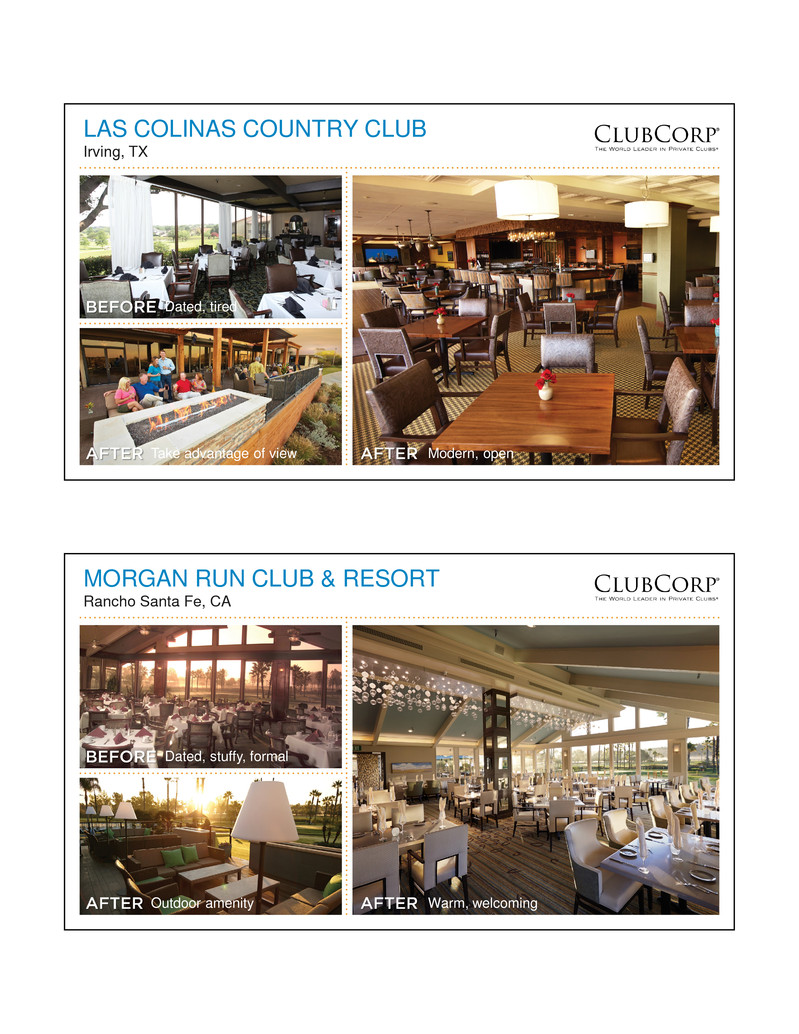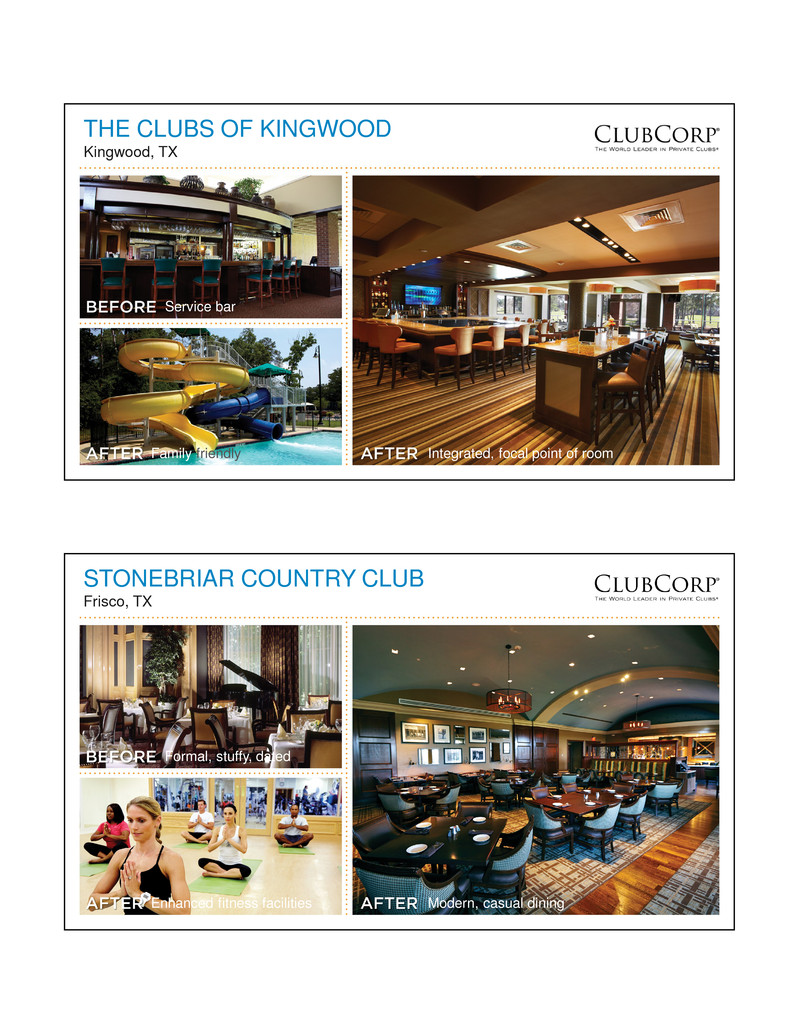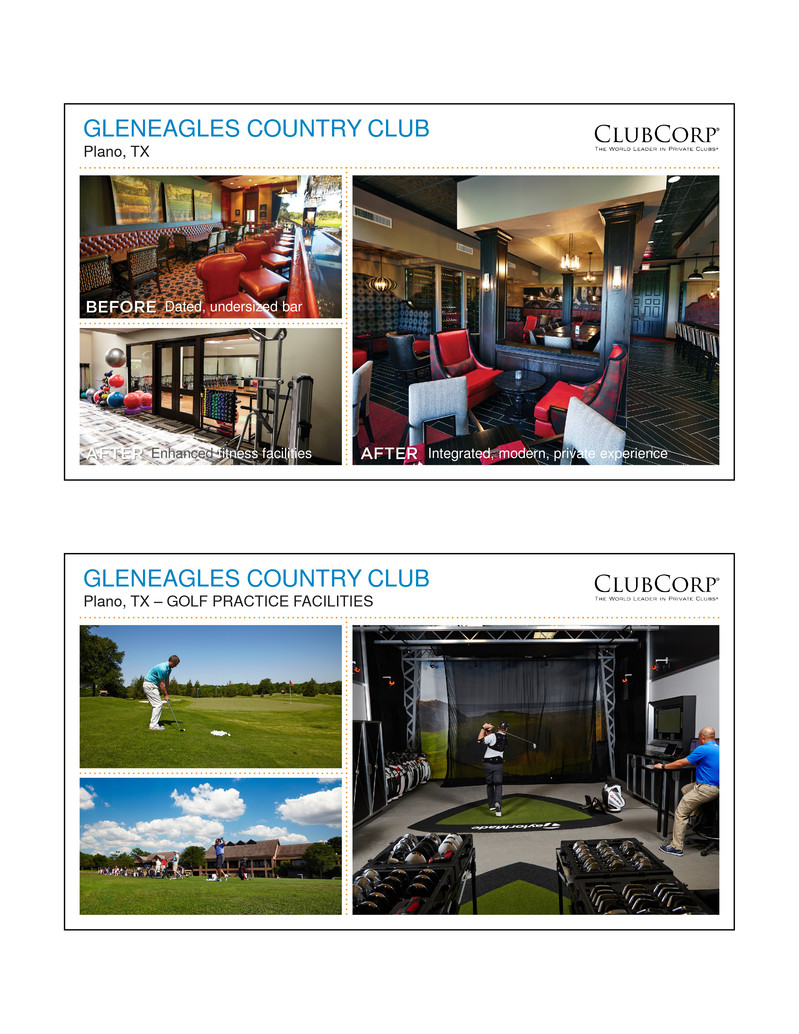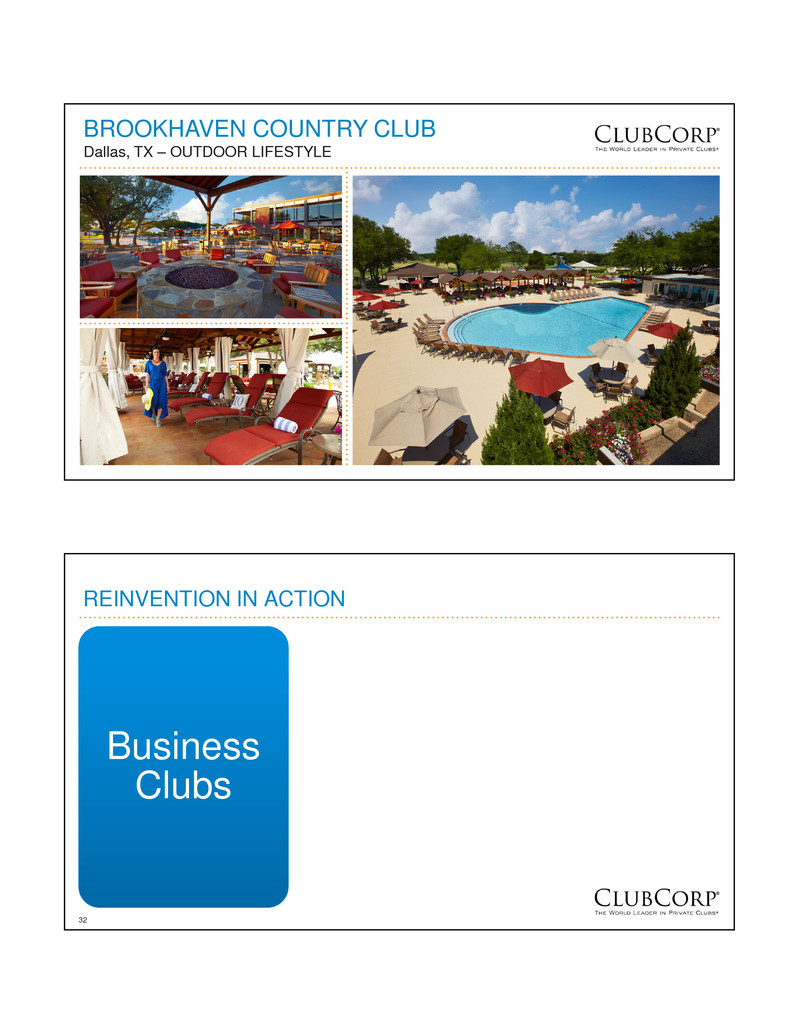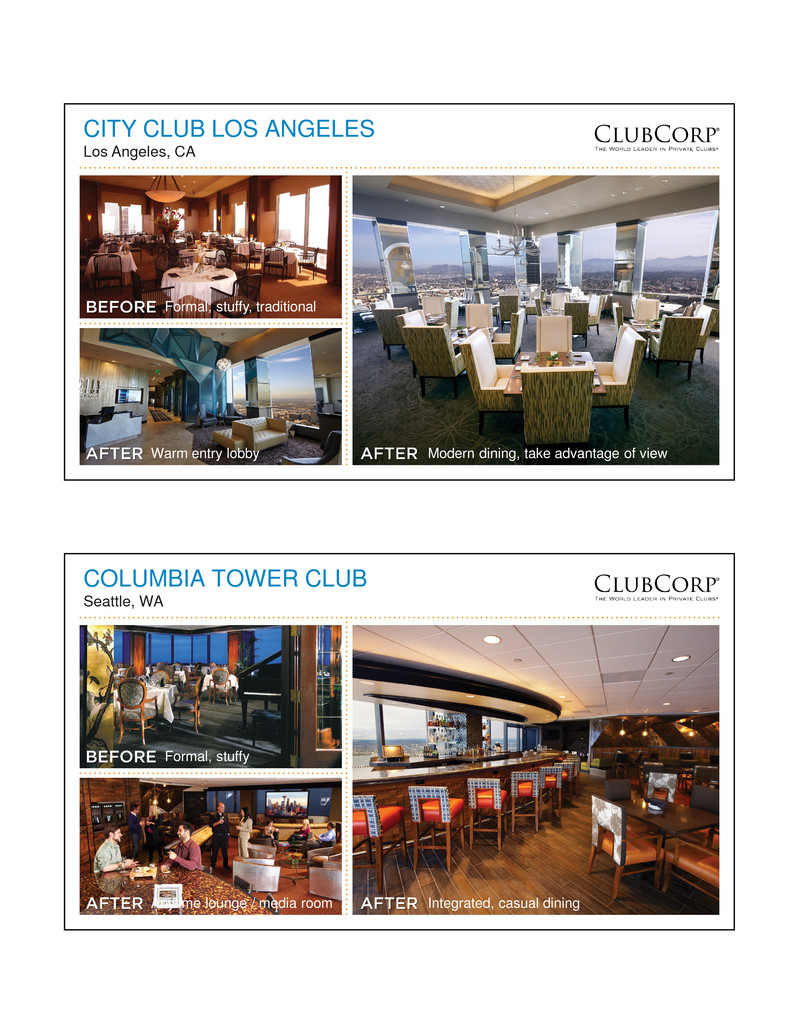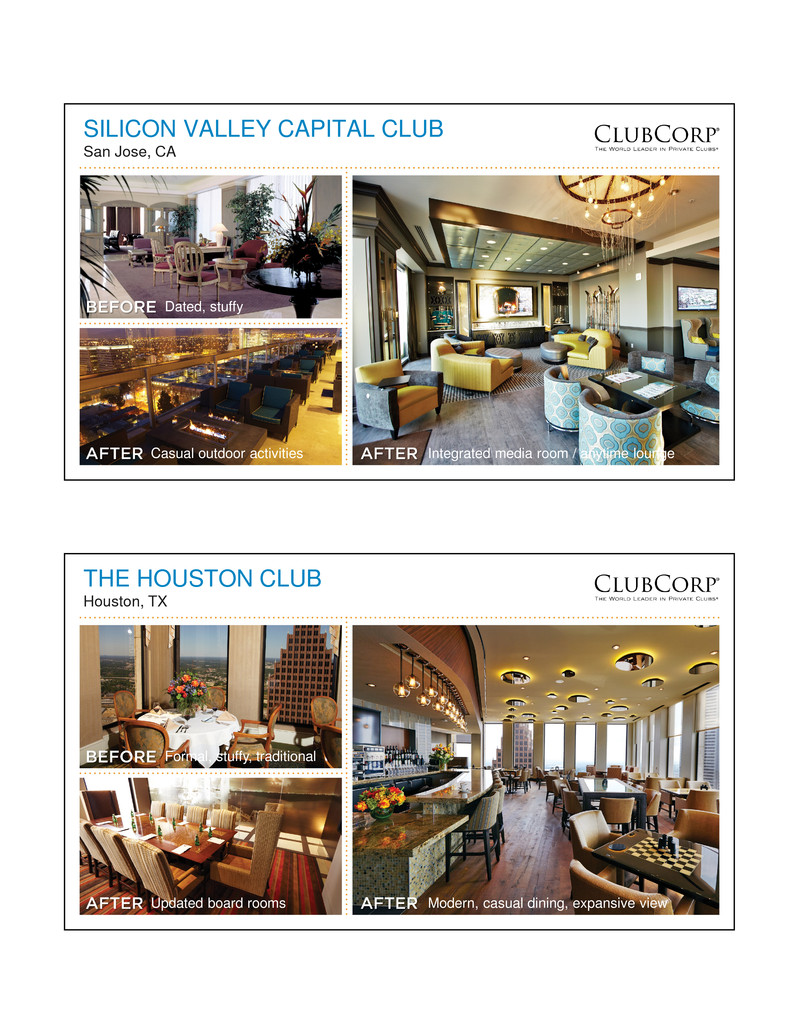
35 SILICON VALLEY CAPITAL CLUB San Jose, CA Dated, stuffy Integrated media room / anytime loungeCasual outdoor activities 36 THE HOUSTON CLUB Houston, TX Formal, stuffy, traditional Modern, casual dining, expansive viewUpdated board rooms
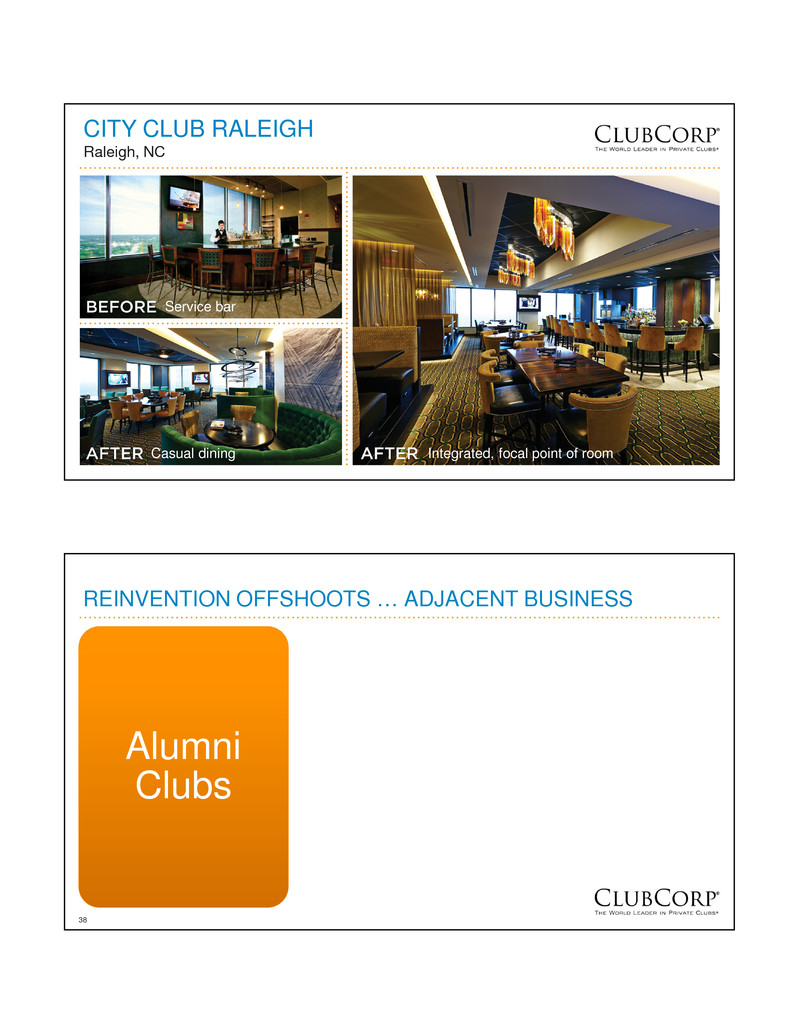
37 CITY CLUB RALEIGH Raleigh, NC Service bar Integrated, focal point of roomCasual dining 38 REINVENTION OFFSHOOTS … ADJACENT BUSINESS Alumni Clubs
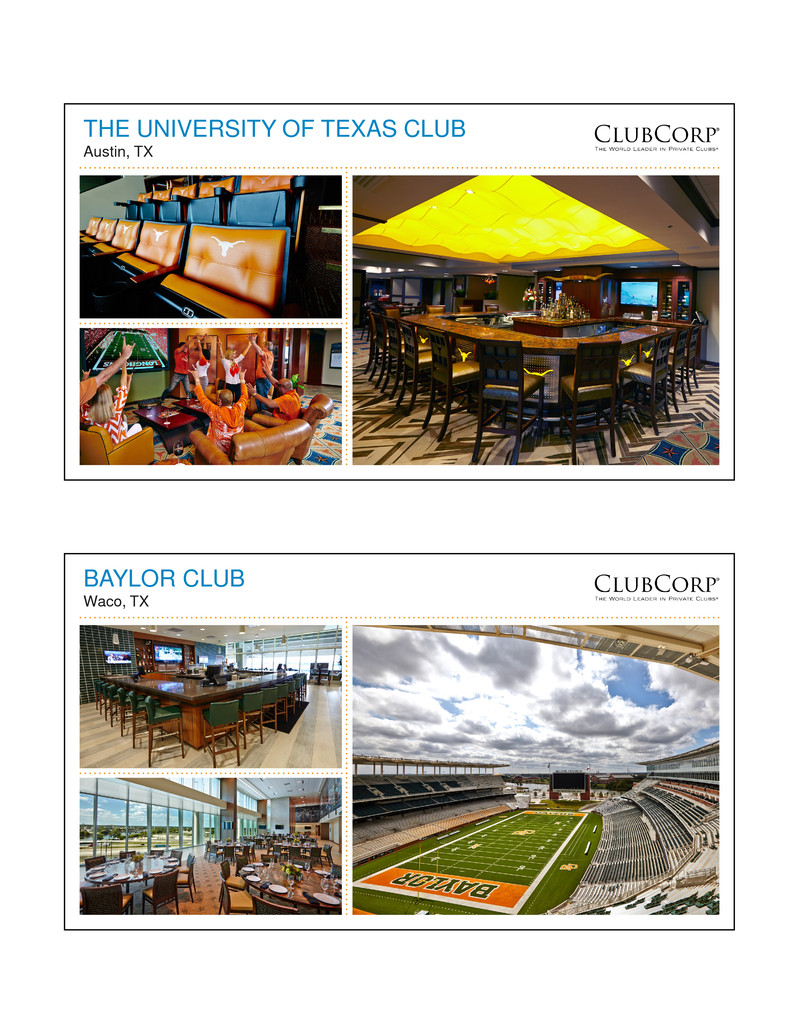
39 THE UNIVERSITY OF TEXAS CLUB Austin, TX 40 BAYLOR CLUB Waco, TX
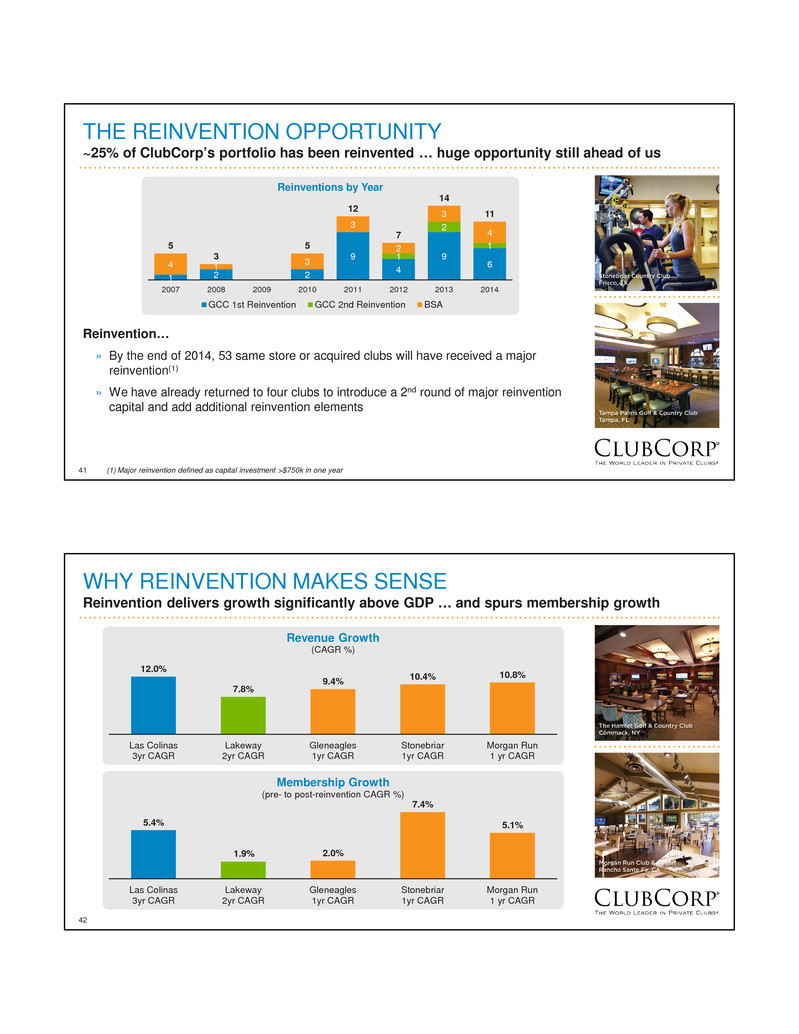
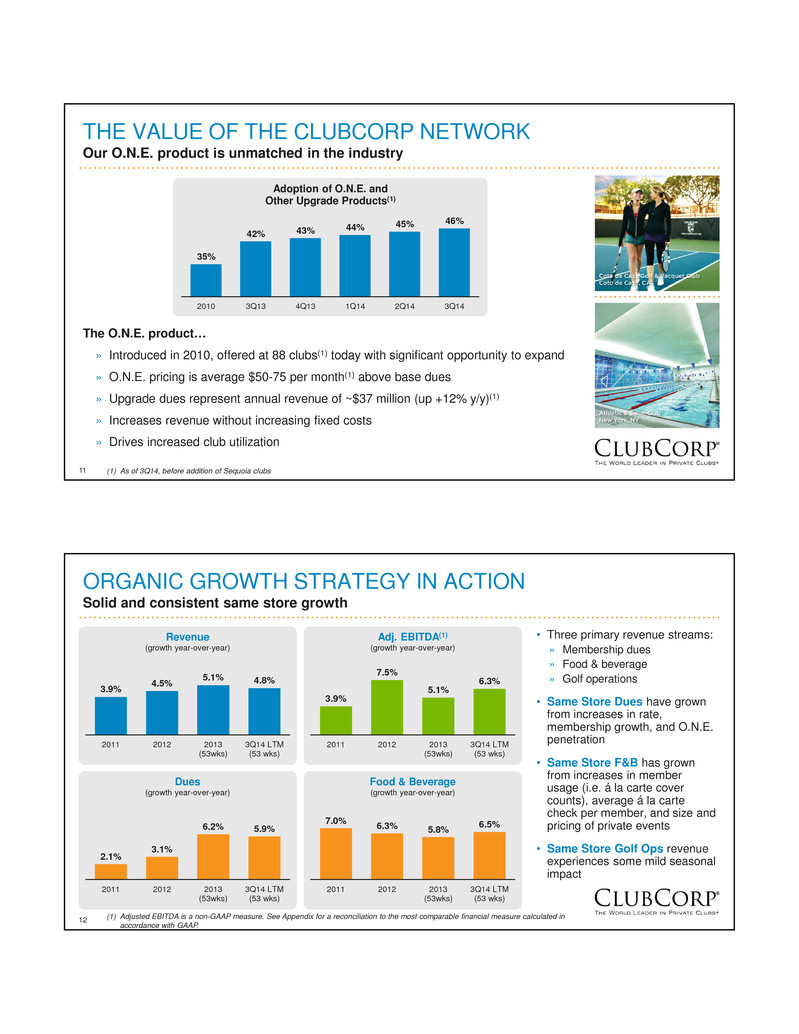
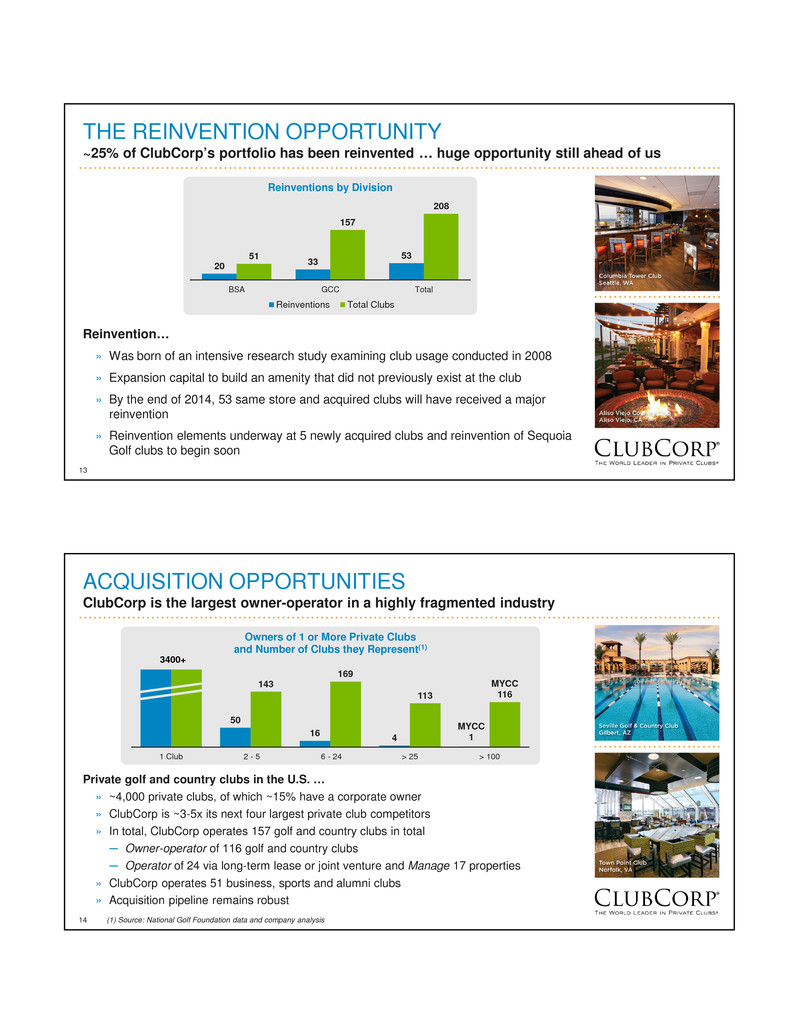
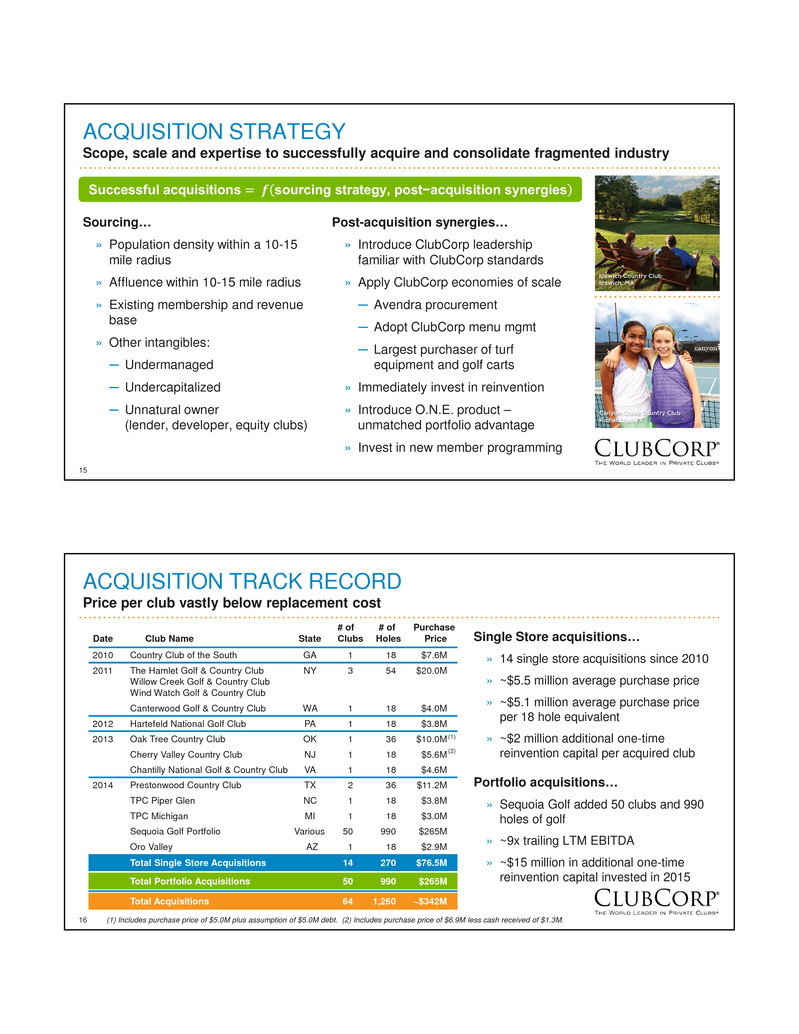
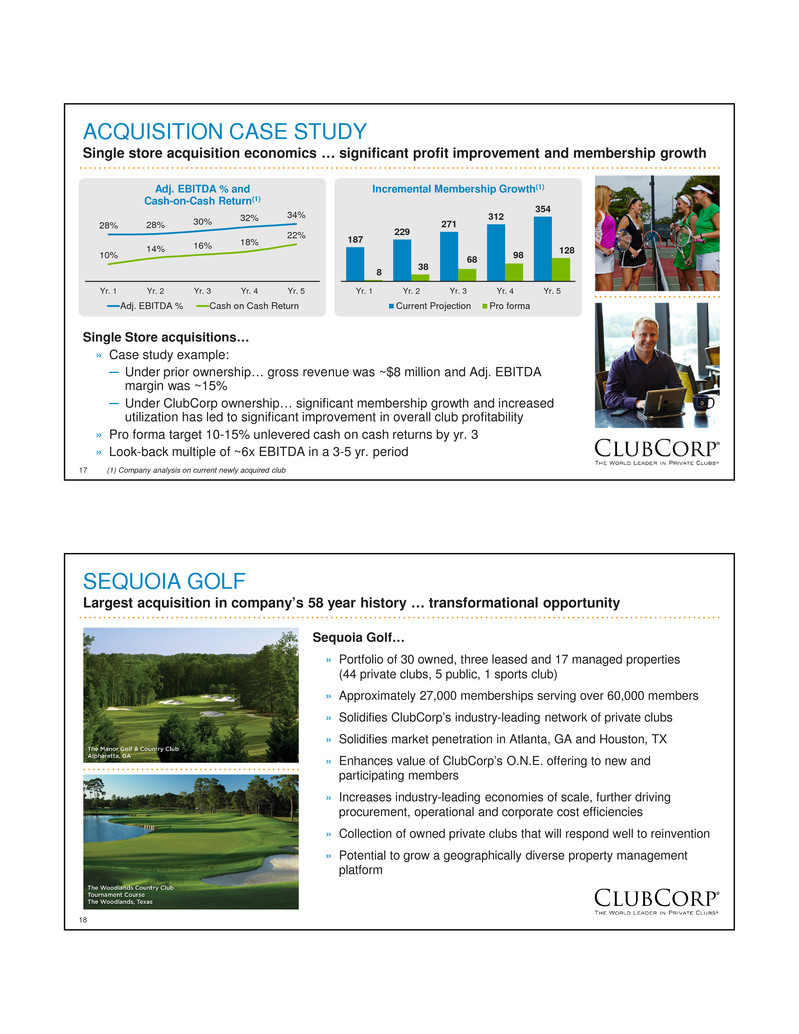
41 THE REINVENTION OPPORTUNITY ~25% of ClubCorp’s portfolio has been reinvented … huge opportunity still ahead of us Reinvention… » By the end of 2014, 53 same store or acquired clubs will have received a major reinvention(1) » We have already returned to four clubs to introduce a 2nd round of major reinvention capital and add additional reinvention elements 1 2 2 9 4 9 6 1 2 1 4 1 3 3 2 3 4 5 3 5 12 7 14 11 2007 2008 2009 2010 2011 2012 2013 2014 Reinventions by Year GCC 1st Reinvention GCC 2nd Reinvention BSA (1) Major reinvention defined as capital investment >$750k in one year 42 WHY REINVENTION MAKES SENSE Reinvention delivers growth significantly above GDP … and spurs membership growth 12.0% 7.8% 9.4% 10.4% 10.8% Las Colinas 3yr CAGR Lakeway 2yr CAGR Gleneagles 1yr CAGR Stonebriar 1yr CAGR Morgan Run 1 yr CAGR Revenue Growth (CAGR %) 5.4% 1.9% 2.0% 7.4% 5.1% Las Colinas 3yr CAGR Lakeway 2yr CAGR Gleneagles 1yr CAGR Stonebriar 1yr CAGR Morgan Run 1 yr CAGR Membership Growth (pre- to post-reinvention CAGR %)

43 WHY REINVENTION MAKES SENSE Attractive returns on expansion capital … that significantly exceeds our cost of capital Reinvention… » ~$60 million invested in major reinvention capital(2) since 2010 » In aggregate, these reinventions are contributing a run rate of $11+ million in incremental Adj. EBITDA this year(1) » Pro forma target 10-15% unlevered cash on cash returns by yr. 3 ─ Average historical cash on cash returns for GCC > 20% by yr. 3 and BSA >15% by yr. 3 4% 16% 22% 25% 26% Yr. 1 Yr. 2 Yr. 3 Yr. 4 Yr. 5 GCC Cash on Cash Returns(1) Projected -8% 9% 16% 18% 19% Yr. 1 Yr. 2 Yr. 3 Yr. 4 Yr. 5 BSA Cash on Cash Returns(1) Projected (1) Cash on cash determined as incremental Adj. EBITDA over base case projection for the same club assuming no reinvention investment divided by capital investment for project. (2) Major reinvention capital defined as projects where expansion capital exceeds $750k 44 THE VALUE OF REINVENTION Reinvention driving above GDP growth in our GCC business ... acquisitions cycle through Membership and ancillary spend growth is directly proportional to our ability and flexibility to reinvent clubs » Same store dues = g1858(membership, rate, O.N.E. penetration, reinvention) » Same store F&B = g1858(membership, a la carte covers, a la carte average check, private events, reinvention) » Same store golf ops = g1858(membership, member rounds, paid rounds and outings, reinvention) » Acquisitions = g1858(sourcing, cost synergies, revenue synergies, reinvention) $607 $661 $2$18 +6.6% $10 +7.3% $4 +2.6% $24 3Q'13 LTM Same Store Dues Same Store F&B Same Store Golf Ops Other Acquisitions 3Q'14 LTM GCC Revenue Bridge YTD ($ millions, growth year-over-year) $177 $191$10+5.9% $4 3Q'13 LTM Same Store Acquisitions 3Q'14 LTM GCC Adj. EBITDA(1) Bridge YTD ($ millions, growth year-over-year) (1) Adjusted EBITDA is a non-GAAP measure. See Appendix for the definition of Adjusted EBITDA and a reconciliation to the most comparable financial measure calculated in accordance with GAAP. (2) Acquisitions made in 2013 and 2014, and does not include Sequoia Golf (2)(2)
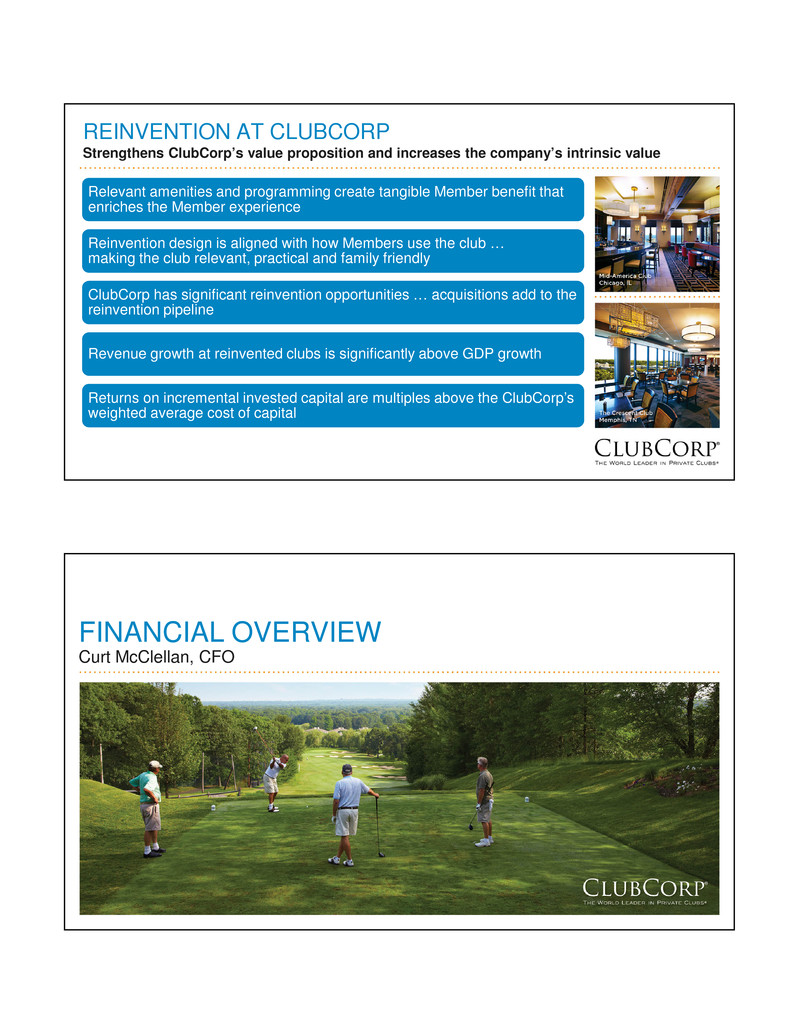
45 REINVENTION AT CLUBCORP Strengthens ClubCorp’s value proposition and increases the company’s intrinsic value Relevant amenities and programming create tangible Member benefit that enriches the Member experience Reinvention design is aligned with how Members use the club … making the club relevant, practical and family friendly ClubCorp has significant reinvention opportunities … acquisitions add to the reinvention pipeline Revenue growth at reinvented clubs is significantly above GDP growth Returns on incremental invested capital are multiples above the ClubCorp’s weighted average cost of capital 46 FINANCIAL OVERVIEW Curt McClellan, CFO

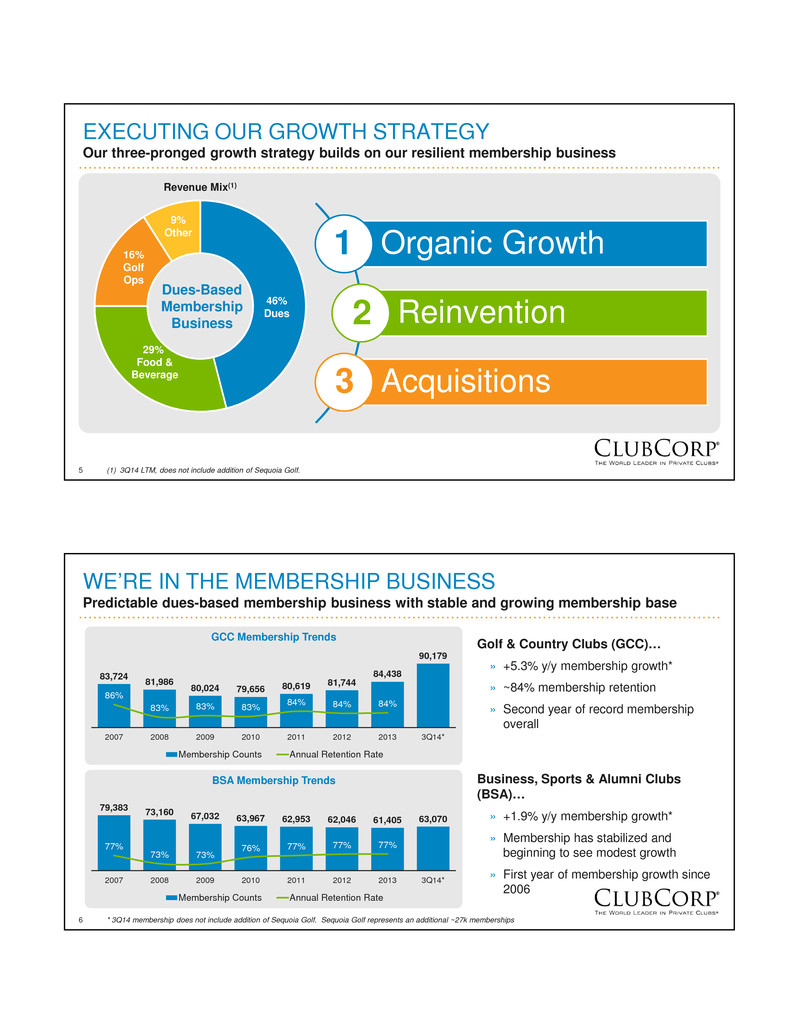
47 CLUBCORP TODAY Delivering results consistent with what we communicated at our IPO $688 $720 $755 $815 $851 2010 2011 2012 2013 (53wks) 3Q14 LTM (53 wks) Total Revenue ($ millions) $150 $157 $166 $177 $187 21.8% 21.8% 22.0% 21.7% 22.0% 2010 2011 2012 2013 (53wks) 3Q14 LTM (53 wks) Total Adj. EBITDA(1) ($ millions) Adj. EBITDA(1) Growth 5-7% $187M up +5.8% y/y Reinvention 9 completed (2) 7 in progress(2) Revenue Growth 3-5% $851M, up +4.4% y/y Long-term Objective Results 3Q14 LTM Acquisitions(3) 6 single store 1 large portfolio Total of 56 clubs (1) Adjusted EBITDA is a non-GAAP measure. See Appendix for reconciliation to the most comparable financial measure calculated in accordance with GAAP. (2) Reinventions completed or in progress during 2014. (3) Since IPO 48 GOLF & COUNTRY CLUBS (GCC) Largest and stickiest part of our business … solid growth across all key operating metrics $532 $556 $586 $629 $661 2010 2011 2012 2013 (53wks) 3Q14 LTM (53 wks) GCC Total(1) Revenue ($ millions) $151 $156 $169 $180 $191 28.4% 28.1% 28.8% 28.7% 28.9% 2010 2011 2012 2013 (53wks) 3Q14 LTM (53 wks) GCC Total(1) Adj. EBITDA(2) ($ millions) 3.3% 6.5% 7.6% 8.6% Revenue Same Store Adj. EBITDA Same Store Revenue Total Adj. EBITDA Total GCC Same Store & Total Growth (3Q14 YTD (36 wks) growth year-over-year) Key operating metrics… 3Q14 YTD (36 weeks) growth year-over-year • ClubCorp’s largest business: » ~79% club revenue » ~87% club adj. EBITDA • Membership: » Peak golf and total memberships » ~84% annualized retention rate • Same Store Dues revenue bup 4.6% » Upgrade dues bup 13.7% • Same Store F&B revenue bup 5.6% » A la carte revenue bup 6.5% » A la carte average check bup 11% » Private events revenue bup 4.1% • Same Store Golf ops revenue bup 1.3% » Member rounds bup 2.4% » Retail revenuebup 1.5% GCC Same Store Revenue Mix 47% Dues 23% F&B 22% Golf Ops 8% Other 3Q14 LTM $633M (1) Total includes same store plus new or acquired clubs. (2) Adjusted EBITDA is a non-GAAP measure. See Appendix for a reconciliation to the most comparable financial measure calculated in accordance with GAAP.
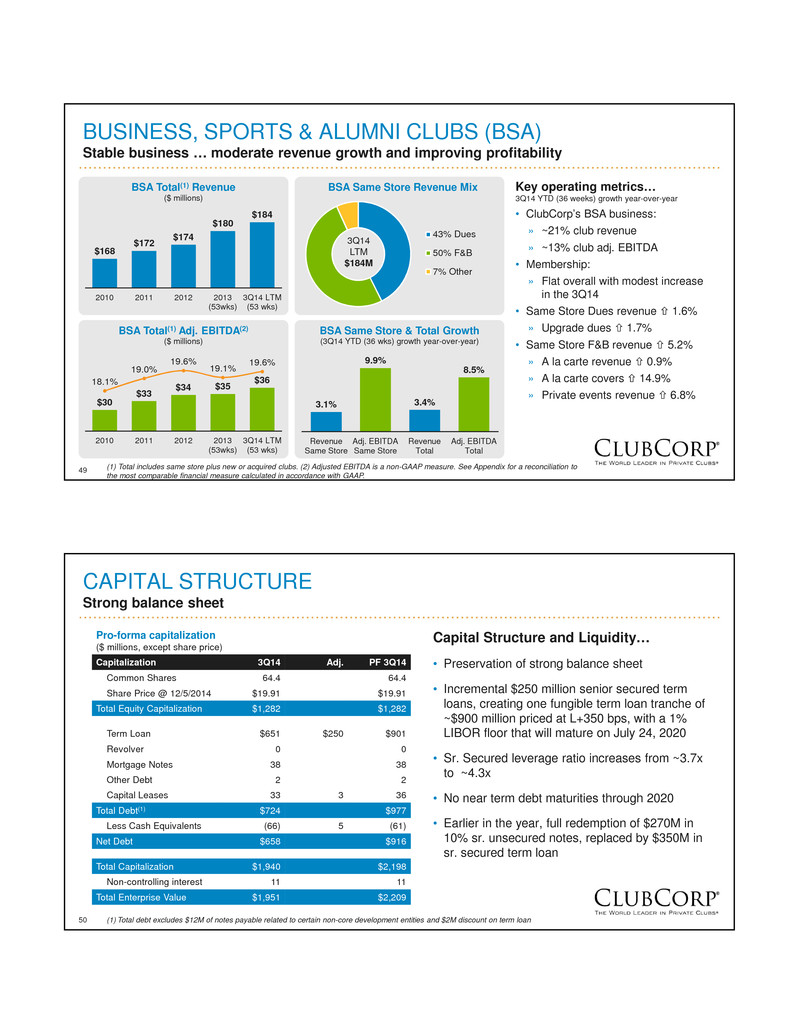
49 BUSINESS, SPORTS & ALUMNI CLUBS (BSA) Stable business … moderate revenue growth and improving profitability $168 $172 $174 $180 $184 2010 2011 2012 2013 (53wks) 3Q14 LTM (53 wks) BSA Total(1) Revenue ($ millions) $30 $33 $34 $35 $3618.1% 19.0% 19.6% 19.1% 19.6% 2010 2011 2012 2013 (53wks) 3Q14 LTM (53 wks) BSA Total(1) Adj. EBITDA(2) ($ millions) 3.1% 9.9% 3.4% 8.5% Revenue Same Store Adj. EBITDA Same Store Revenue Total Adj. EBITDA Total BSA Same Store & Total Growth (3Q14 YTD (36 wks) growth year-over-year) Key operating metrics… 3Q14 YTD (36 weeks) growth year-over-year • ClubCorp’s BSA business: » ~21% club revenue » ~13% club adj. EBITDA • Membership: » Flat overall with modest increase in the 3Q14 • Same Store Dues revenue bup 1.6% » Upgrade dues bup 1.7% • Same Store F&B revenue bup 5.2% » A la carte revenue bup 0.9% » A la carte covers bup 14.9% » Private events revenue bup 6.8% BSA Same Store Revenue Mix 43% Dues 50% F&B 7% Other 3Q14 LTM $184M (1) Total includes same store plus new or acquired clubs. (2) Adjusted EBITDA is a non-GAAP measure. See Appendix for a reconciliation to the most comparable financial measure calculated in accordance with GAAP. 50 CAPITAL STRUCTURE Strong balance sheet Pro-forma capitalization ($ millions, except share price) Capitalization 3Q14 Adj. PF 3Q14 Common Shares 64.4 64.4 Share Price @ 12/5/2014 $19.91 $19.91 Total Equity Capitalization $1,282 $1,282 Term Loan $651 $250 $901 Revolver 0 0 Mortgage Notes 38 38 Other Debt 2 2 Capital Leases 33 3 36 Total Debt(1) $724 $977 Less Cash Equivalents (66) 5 (61) Net Debt $658 $916 Total Capitalization $1,940 $2,198 Non-controlling interest 11 11 Total Enterprise Value $1,951 $2,209 Capital Structure and Liquidity… • Preservation of strong balance sheet • Incremental $250 million senior secured term loans, creating one fungible term loan tranche of ~$900 million priced at L+350 bps, with a 1% LIBOR floor that will mature on July 24, 2020 • Sr. Secured leverage ratio increases from ~3.7x to ~4.3x • No near term debt maturities through 2020 • Earlier in the year, full redemption of $270M in 10% sr. unsecured notes, replaced by $350M in sr. secured term loan (1) Total debt excludes $12M of notes payable related to certain non-core development entities and $2M discount on term loan
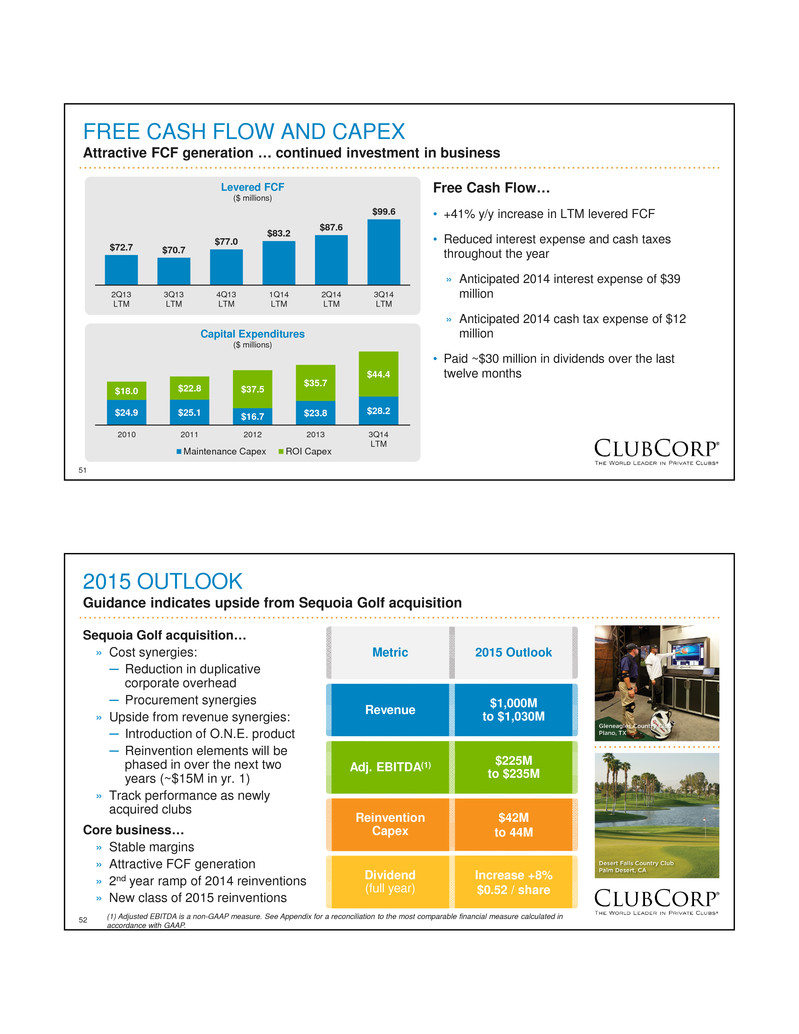
51 FREE CASH FLOW AND CAPEX Attractive FCF generation … continued investment in business $72.7 $70.7 $77.0 $83.2 $87.6 $99.6 2Q13 LTM 3Q13 LTM 4Q13 LTM 1Q14 LTM 2Q14 LTM 3Q14 LTM Levered FCF ($ millions) Free Cash Flow… • +41% y/y increase in LTM levered FCF • Reduced interest expense and cash taxes throughout the year » Anticipated 2014 interest expense of $39 million » Anticipated 2014 cash tax expense of $12 million • Paid ~$30 million in dividends over the last twelve months $24.9 $25.1 $16.7 $23.8 $28.2 $18.0 $22.8 $37.5 $35.7 $44.4 2010 2011 2012 2013 3Q14 LTM Capital Expenditures ($ millions) Maintenance Capex ROI Capex 52 2015 OUTLOOK Guidance indicates upside from Sequoia Golf acquisition Sequoia Golf acquisition… » Cost synergies: ─ Reduction in duplicative corporate overhead ─ Procurement synergies » Upside from revenue synergies: ─ Introduction of O.N.E. product ─ Reinvention elements will be phased in over the next two years (~$15M in yr. 1) » Track performance as newly acquired clubs Core business… » Stable margins » Attractive FCF generation » 2nd year ramp of 2014 reinventions » New class of 2015 reinventions Adj. EBITDA(1) $225M to $235M Reinvention Capex $42M to 44M Revenue $1,000M to $1,030M Metric 2015 Outlook Dividend (full year) Increase +8% $0.52 / share (1) Adjusted EBITDA is a non-GAAP measure. See Appendix for a reconciliation to the most comparable financial measure calculated in accordance with GAAP.
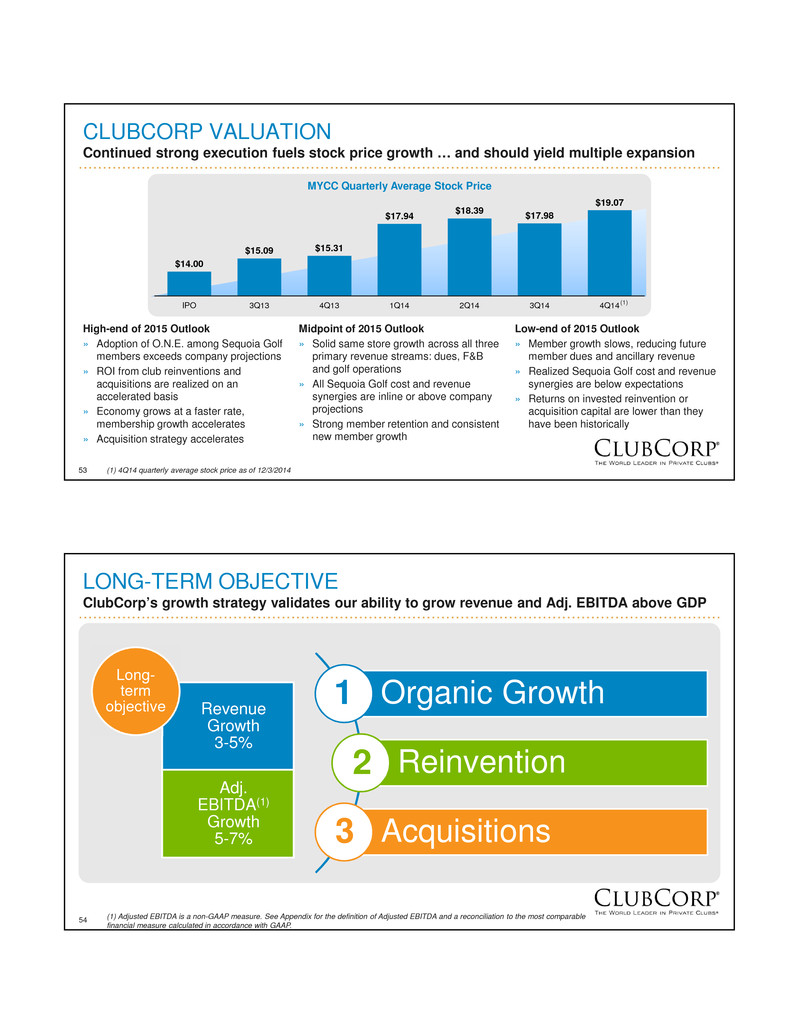
53 CLUBCORP VALUATION Continued strong execution fuels stock price growth … and should yield multiple expansion $14.00 $15.09 $15.31 $17.94 $18.39 $17.98 $19.07 IPO 3Q13 4Q13 1Q14 2Q14 3Q14 4Q14 MYCC Quarterly Average Stock Price Low-end of 2015 Outlook » Member growth slows, reducing future member dues and ancillary revenue » Realized Sequoia Golf cost and revenue synergies are below expectations » Returns on invested reinvention or acquisition capital are lower than they have been historically Midpoint of 2015 Outlook » Solid same store growth across all three primary revenue streams: dues, F&B and golf operations » All Sequoia Golf cost and revenue synergies are inline or above company projections » Strong member retention and consistent new member growth High-end of 2015 Outlook » Adoption of O.N.E. among Sequoia Golf members exceeds company projections » ROI from club reinventions and acquisitions are realized on an accelerated basis » Economy grows at a faster rate, membership growth accelerates » Acquisition strategy accelerates (1) 4Q14 quarterly average stock price as of 12/3/2014 (1) 54 LONG-TERM OBJECTIVE ClubCorp’s growth strategy validates our ability to grow revenue and Adj. EBITDA above GDP Organic Growth Reinvention Acquisitions 1 2 3 Revenue Growth 3-5% Adj. EBITDA(1) Growth 5-7% Long- term objective (1) Adjusted EBITDA is a non-GAAP measure. See Appendix for the definition of Adjusted EBITDA and a reconciliation to the most comparable financial measure calculated in accordance with GAAP.
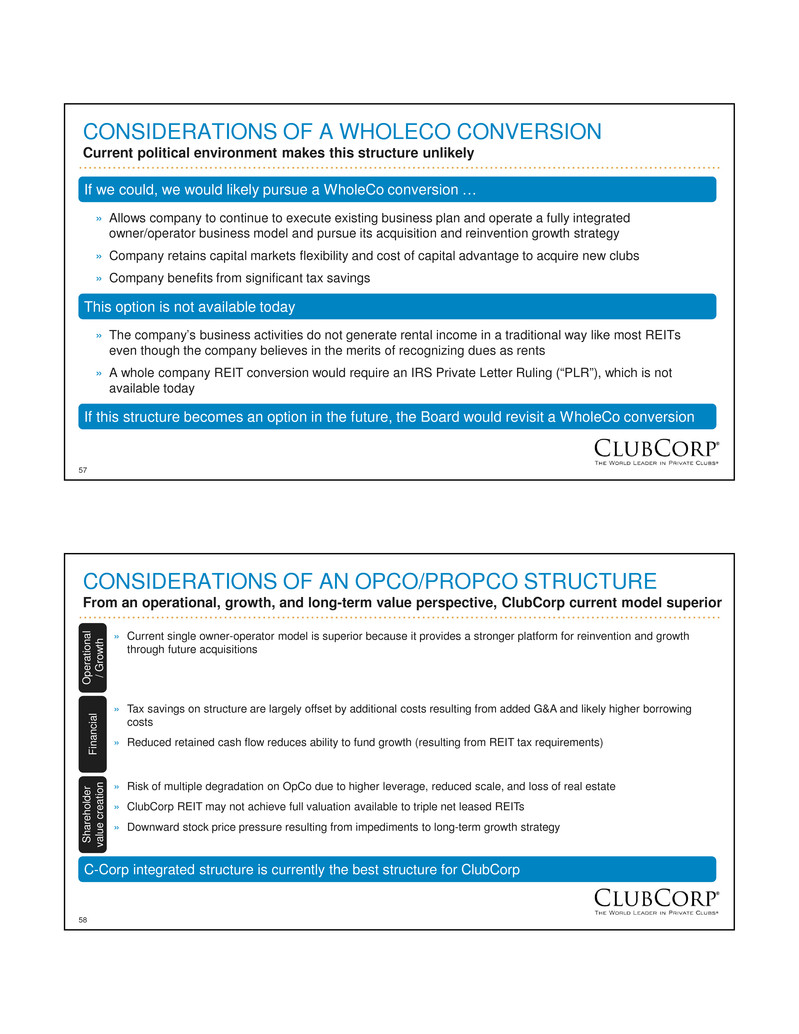
55 REIT ANALYSIS Eric Affeldt, President and CEO 56 REIT EVALUATION PROCESS Relentless focus on long-term creation of shareholder value Real estate holdings are a valuable asset ClubCorp is a unique and differentiated business relative to most other real estate intensive businesses Engaged top-tier advisors in finance, tax and law for comprehensive review of strategic options Comprehensive analysis of strategic options Structure that complements execution of ClubCorp’s growth strategy (reinvention and acquisitions) Evaluated strategic and financial implications of five REIT structures including WholeCo conversion and OpCo / PropCo G u id in g pr in ci pl es Si tu at io n Pr o ce ss
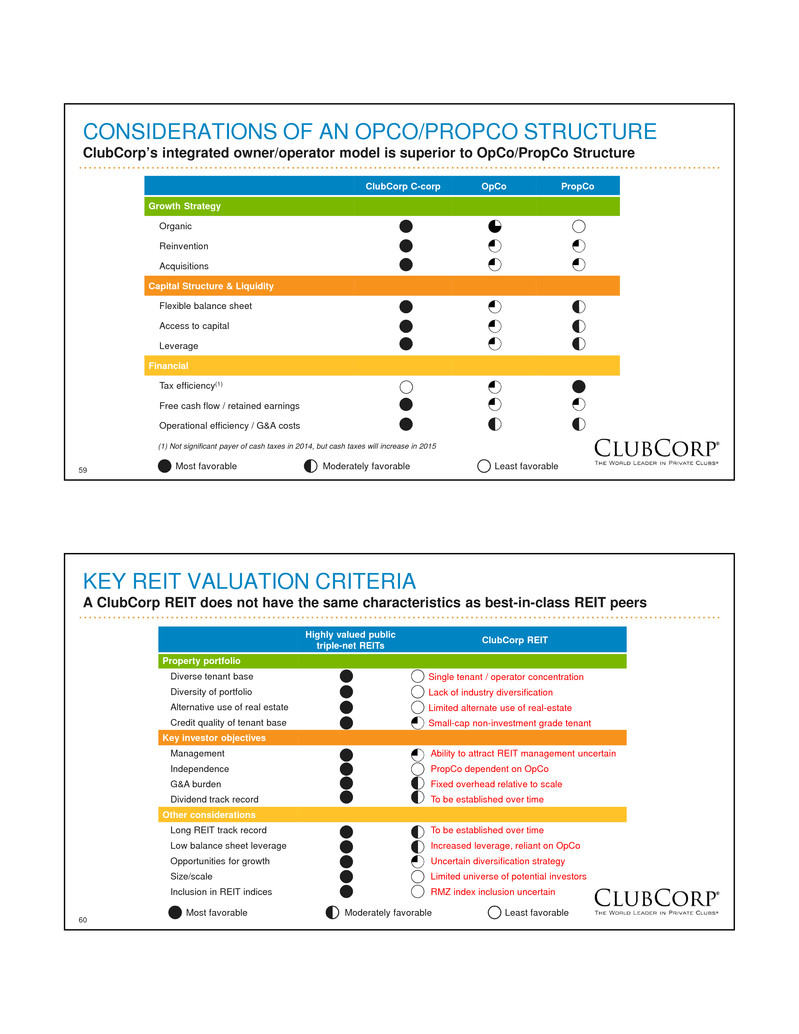
57 CONSIDERATIONS OF A WHOLECO CONVERSION Current political environment makes this structure unlikely » Allows company to continue to execute existing business plan and operate a fully integrated owner/operator business model and pursue its acquisition and reinvention growth strategy » Company retains capital markets flexibility and cost of capital advantage to acquire new clubs » Company benefits from significant tax savings If we could, we would likely pursue a WholeCo conversion … This option is not available today » The company’s business activities do not generate rental income in a traditional way like most REITs even though the company believes in the merits of recognizing dues as rents » A whole company REIT conversion would require an IRS Private Letter Ruling (“PLR”), which is not available today If this structure becomes an option in the future, the Board would revisit a WholeCo conversion 58 CONSIDERATIONS OF AN OPCO/PROPCO STRUCTURE From an operational, growth, and long-term value perspective, ClubCorp current model superior O pe ra tio n al / G ro w th Fi n an ci al » Current single owner-operator model is superior because it provides a stronger platform for reinvention and growth through future acquisitions » Tax savings on structure are largely offset by additional costs resulting from added G&A and likely higher borrowing costs » Reduced retained cash flow reduces ability to fund growth (resulting from REIT tax requirements) Sh ar eh o ld er va lu e cr ea tio n » Risk of multiple degradation on OpCo due to higher leverage, reduced scale, and loss of real estate » ClubCorp REIT may not achieve full valuation available to triple net leased REITs » Downward stock price pressure resulting from impediments to long-term growth strategy C-Corp integrated structure is currently the best structure for ClubCorp
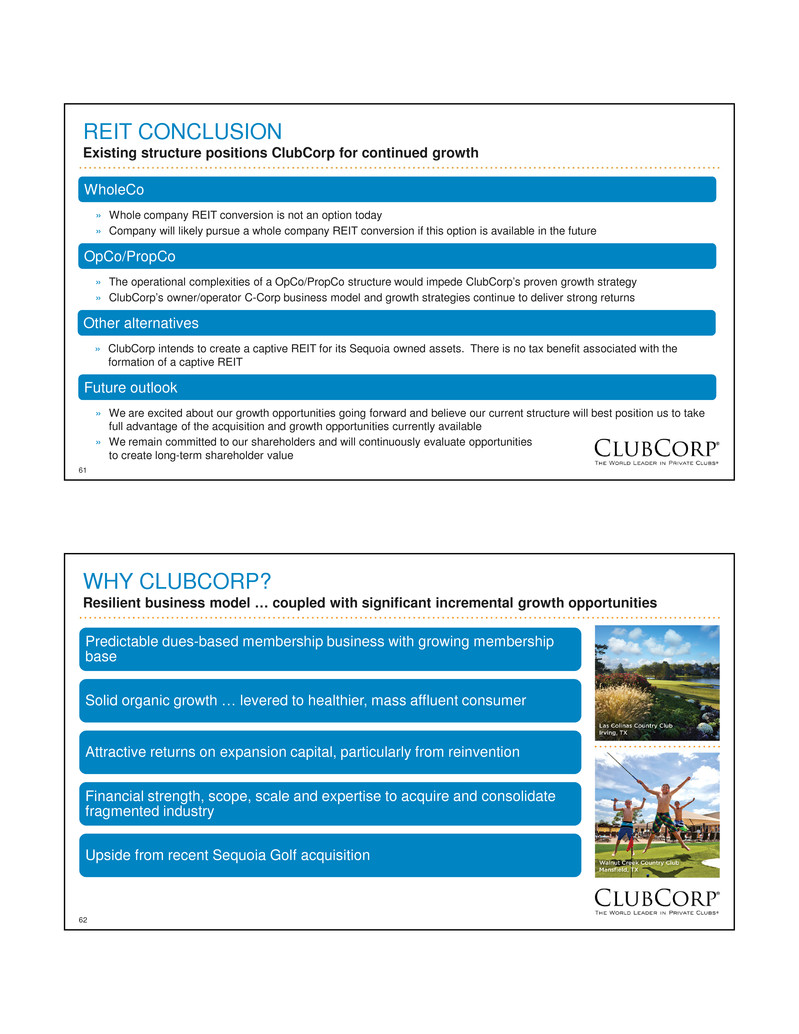
59 CONSIDERATIONS OF AN OPCO/PROPCO STRUCTURE ClubCorp’s integrated owner/operator model is superior to OpCo/PropCo Structure ClubCorp C-corp OpCo PropCo Growth Strategy Organic Reinvention Acquisitions Capital Structure & Liquidity Flexible balance sheet Access to capital Leverage Financial Tax efficiency(1) Free cash flow / retained earnings Operational efficiency / G&A costs (1) Not significant payer of cash taxes in 2014, but cash taxes will increase in 2015 Most favorable Least favorableModerately favorable 60 KEY REIT VALUATION CRITERIA A ClubCorp REIT does not have the same characteristics as best-in-class REIT peers Highly valued public triple-net REITs ClubCorp REIT Property portfolio Diverse tenant base Single tenant / operator concentration Diversity of portfolio Lack of industry diversification Alternative use of real estate Limited alternate use of real-estate Credit quality of tenant base Small-cap non-investment grade tenant Key investor objectives Management Ability to attract REIT management uncertain Independence PropCo dependent on OpCo G&A burden Fixed overhead relative to scale Dividend track record To be established over time Other considerations Long REIT track record To be established over time Low balance sheet leverage Increased leverage, reliant on OpCo Opportunities for growth Uncertain diversification strategy Size/scale Limited universe of potential investors Inclusion in REIT indices RMZ index inclusion uncertain Most favorable Least favorableModerately favorable
61 REIT CONCLUSION Existing structure positions ClubCorp for continued growth » Whole company REIT conversion is not an option today » Company will likely pursue a whole company REIT conversion if this option is available in the future WholeCo » The operational complexities of a OpCo/PropCo structure would impede ClubCorp’s proven growth strategy » ClubCorp’s owner/operator C-Corp business model and growth strategies continue to deliver strong returns OpCo/PropCo » We are excited about our growth opportunities going forward and believe our current structure will best position us to take full advantage of the acquisition and growth opportunities currently available » We remain committed to our shareholders and will continuously evaluate opportunities to create long-term shareholder value Future outlook » ClubCorp intends to create a captive REIT for its Sequoia owned assets. There is no tax benefit associated with the formation of a captive REIT Other alternatives 62 WHY CLUBCORP? Resilient business model … coupled with significant incremental growth opportunities Predictable dues-based membership business with growing membership base Solid organic growth … levered to healthier, mass affluent consumer Attractive returns on expansion capital, particularly from reinvention Financial strength, scope, scale and expertise to acquire and consolidate fragmented industry Upside from recent Sequoia Golf acquisition
63 64 APPENDIX
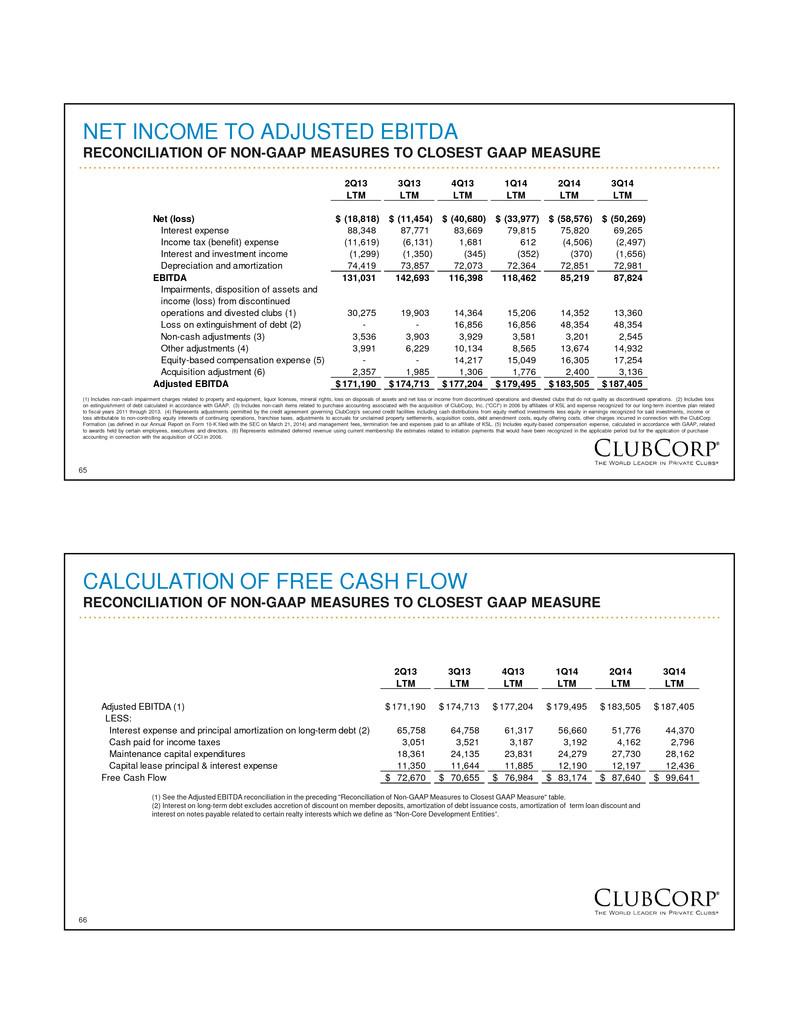
65 NET INCOME TO ADJUSTED EBITDA RECONCILIATION OF NON-GAAP MEASURES TO CLOSEST GAAP MEASURE (1) Includes non-cash impairment charges related to property and equipment, liquor licenses, mineral rights, loss on disposals of assets and net loss or income from discontinued operations and divested clubs that do not quality as discontinued operations. (2) Includes loss on extinguishment of debt calculated in accordance with GAAP. (3) Includes non-cash items related to purchase accounting associated with the acquisition of ClubCorp, Inc. ("CCI") in 2006 by affiliates of KSL and expense recognized for our long-term incentive plan related to fiscal years 2011 through 2013. (4) Represents adjustments permitted by the credit agreement governing ClubCorp's secured credit facilities including cash distributions from equity method investments less equity in earnings recognized for said investments, income or loss attributable to non-controlling equity interests of continuing operations, franchise taxes, adjustments to accruals for unclaimed property settlements, acquisition costs, debt amendment costs, equity offering costs, other charges incurred in connection with the ClubCorp Formation (as defined in our Annual Report on Form 10-K filed with the SEC on March 21, 2014) and management fees, termination fee and expenses paid to an affiliate of KSL. (5) Includes equity-based compensation expense, calculated in accordance with GAAP, related to awards held by certain employees, executives and directors. (6) Represents estimated deferred revenue using current membership life estimates related to initiation payments that would have been recognized in the applicable period but for the application of purchase accounting in connection with the acquisition of CCI in 2006. 2Q13 3Q13 4Q13 1Q14 2Q14 3Q14 LTM LTM LTM LTM LTM LTM Net (loss) (18,818)$ (11,454)$ (40,680)$ (33,977)$ (58,576)$ (50,269)$ Interest expense 88,348 87,771 83,669 79,815 75,820 69,265 Income tax (benefit) expense (11,619) (6,131) 1,681 612 (4,506) (2,497) Interest and investment income (1,299) (1,350) (345) (352) (370) (1,656) Depreciation and amortization 74,419 73,857 72,073 72,364 72,851 72,981 EBITDA 131,031 142,693 116,398 118,462 85,219 87,824 Impairments, disposition of assets and income (loss) from discontinued operations and divested clubs (1) 30,275 19,903 14,364 15,206 14,352 13,360 Loss on extinguishment of debt (2) - - 16,856 16,856 48,354 48,354 Non-cash adjustments (3) 3,536 3,903 3,929 3,581 3,201 2,545 Other adjustments (4) 3,991 6,229 10,134 8,565 13,674 14,932 Equity-based compensation expense (5) - - 14,217 15,049 16,305 17,254 Acquisition adjustment (6) 2,357 1,985 1,306 1,776 2,400 3,136 Adjusted EBITDA 171,190$ 174,713$ 177,204$ 179,495$ 183,505$ 187,405$ 66 CALCULATION OF FREE CASH FLOW RECONCILIATION OF NON-GAAP MEASURES TO CLOSEST GAAP MEASURE (1) See the Adjusted EBITDA reconciliation in the preceding "Reconciliation of Non-GAAP Measures to Closest GAAP Measure" table. (2) Interest on long-term debt excludes accretion of discount on member deposits, amortization of debt issuance costs, amortization of term loan discount and interest on notes payable related to certain realty interests which we define as “Non-Core Development Entities”. 2Q13 3Q13 4Q13 1Q14 2Q14 3Q14 LTM LTM LTM LTM LTM LTM Adjusted EBITDA (1) 171,190$ 174,713$ 177,204$ 179,495$ 183,505$ 187,405$ LESS: Interest expense and principal amortization on long-term debt (2) 65,758 64,758 61,317 56,660 51,776 44,370 Cash paid for income taxes 3,051 3,521 3,187 3,192 4,162 2,796 Maintenance capital expenditures 18,361 24,135 23,831 24,279 27,730 28,162 Capital lease principal & interest expense 11,350 11,644 11,885 12,190 12,197 12,436 Free Cash Flow 72,670$ 70,655$ 76,984$ 83,174$ 87,640$ 99,641$
67 THANK YOU! Go Enjoy a Club! 68
