
1 FISCAL 2014 Q4 PERFORMANCE March 12, 2015
2 CAUTIONARY STATEMENTS Forward-Looking Statements Certain statements in this presentation may be considered forward-looking statements. Forward-looking statements generally relate to future events or our future financial or operating performance. In some cases, you can identify forward-looking statements by terminology such as “may”, “should”, “expect”, “intend”, “will”, “estimate”, “anticipate”, “believe”, “predict”, “potential” or “continue”, or the negatives of these terms or variations of them or similar terminology. Such forward-looking statements are subject to risks, uncertainties, and other factors which could cause actual results to differ materially from those expressed or implied by such forward looking statements. These forward-looking statements are based upon estimates and assumptions that, while considered reasonable by the Company and its management, are inherently uncertain. Factors that may cause actual results to differ materially from current expectations, including, but not limited to, various factors beyond management's control adversely affecting discretionary spending, membership count and facility usage and other risks, uncertainties and factors set forth in the sections entitled "Risk Factors" and "Cautionary Statement Regarding Forward-Looking Statements" in the Company's Annual Report on Form 10-K for the fiscal year ended December 30, 2014. Nothing in this presentation should be regarded as a representation by any person that the forward-looking statements set forth herein will be achieved or that any of the contemplated results of such forward-looking statements will be achieved. You should not place undue reliance on forward-looking statements, which speak only as of the date they are made. The Company undertakes no duty to update these forward-looking statements. Non-GAAP Financial Measures In our presentation, we may refer to certain non-GAAP financial measures. To the extent we disclose non-GAAP financial measures, please refer to footnotes where presented on each page of this presentation or to the appendix found at the end of this presentation for a reconciliation of these measures to what we believe are the most directly comparable GAAP measures.

3 BUSINESS OVERVIEW Eric Affeldt, President and CEO
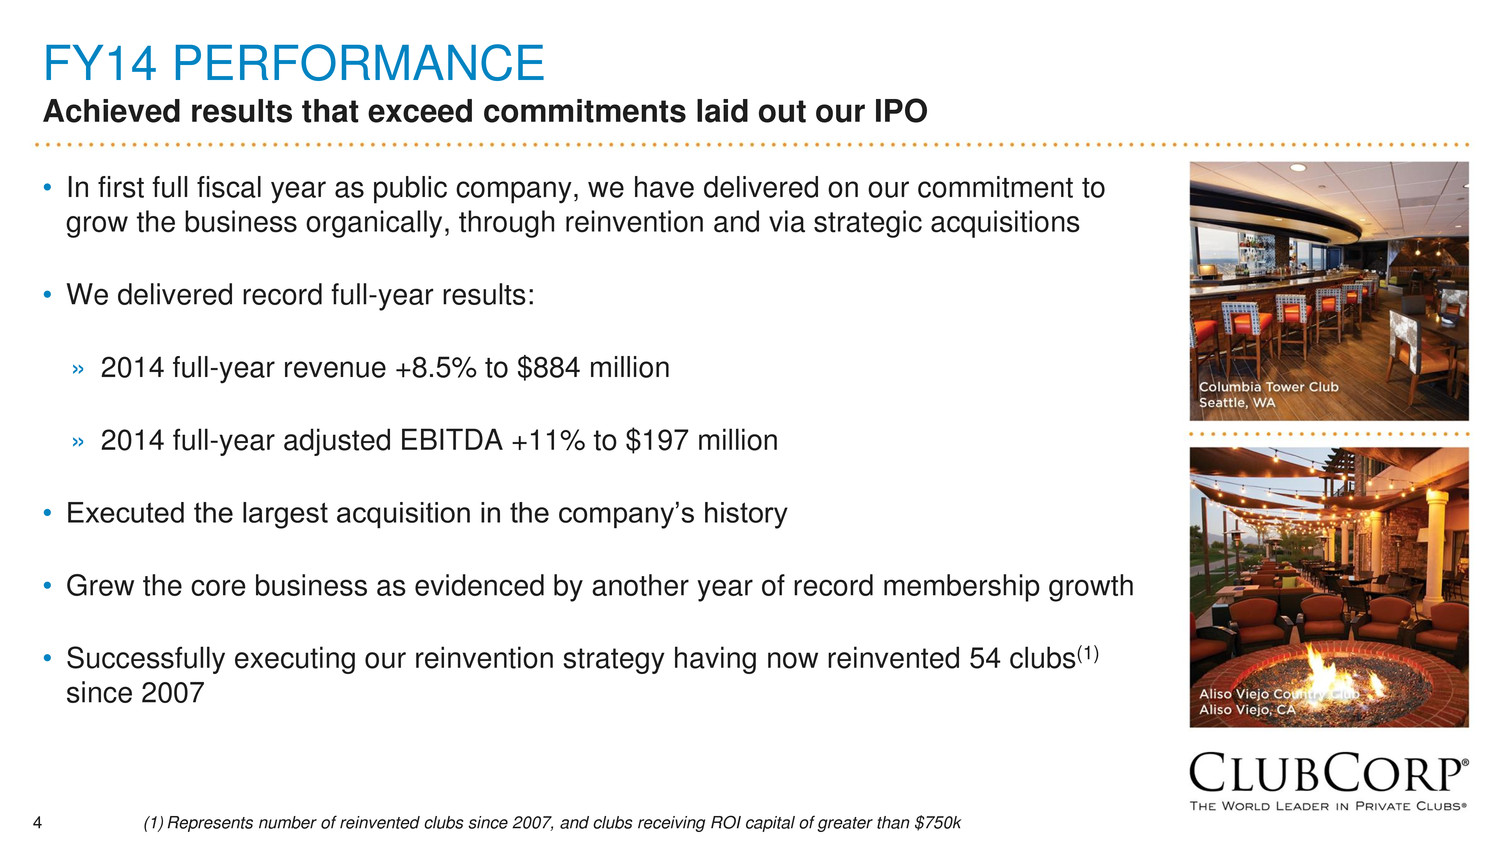
4 FY14 PERFORMANCE Achieved results that exceed commitments laid out our IPO • In first full fiscal year as public company, we have delivered on our commitment to grow the business organically, through reinvention and via strategic acquisitions • We delivered record full-year results: » 2014 full-year revenue +8.5% to $884 million » 2014 full-year adjusted EBITDA +11% to $197 million • Executed the largest acquisition in the company’s history • Grew the core business as evidenced by another year of record membership growth • Successfully executing our reinvention strategy having now reinvented 54 clubs(1) since 2007 (1) Represents number of reinvented clubs since 2007, and clubs receiving ROI capital of greater than $750k
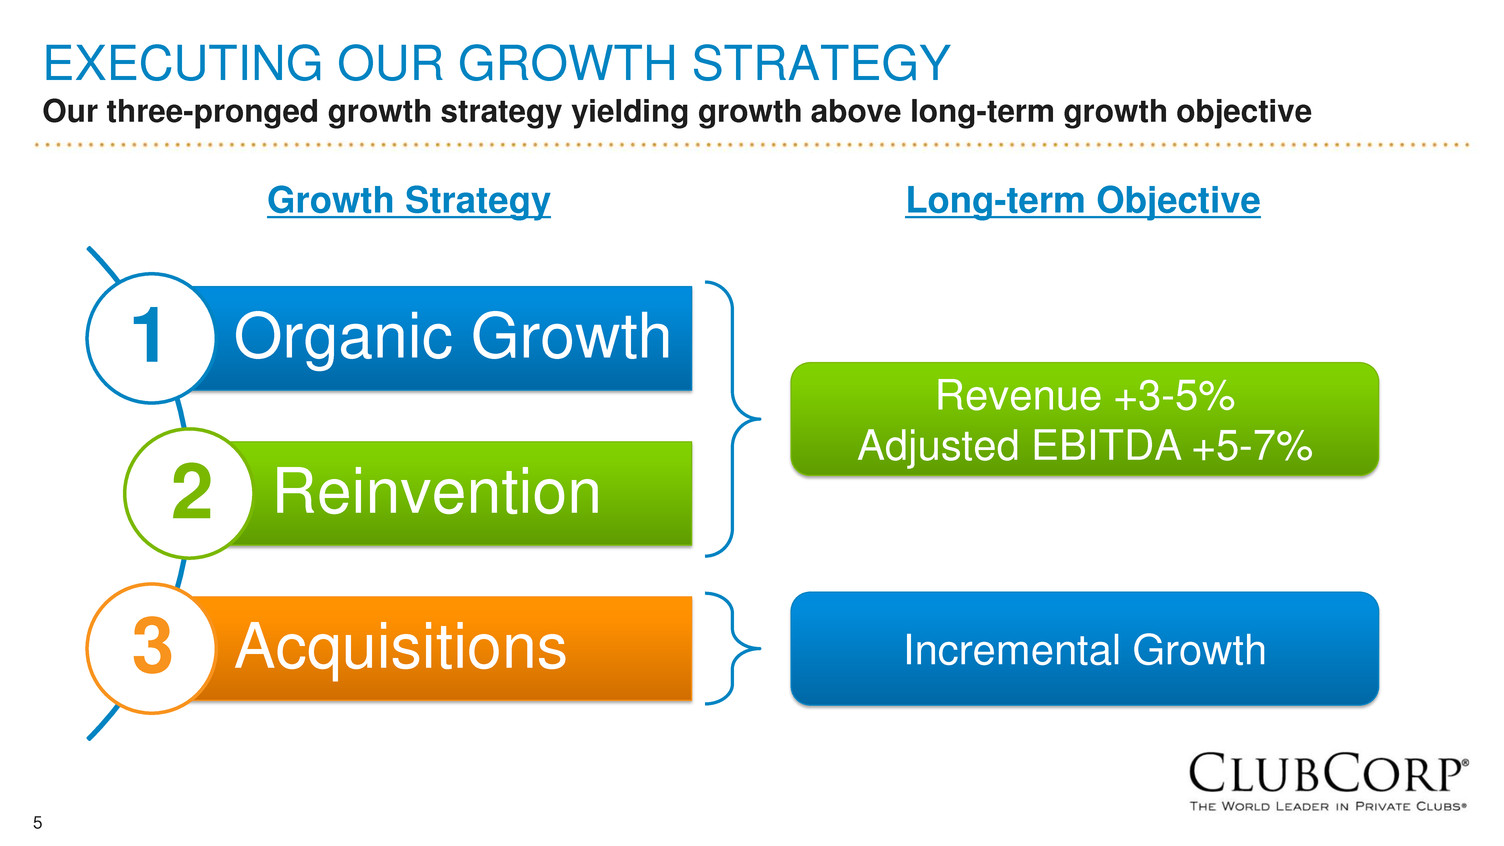
5 EXECUTING OUR GROWTH STRATEGY Our three-pronged growth strategy yielding growth above long-term growth objective Organic Growth Reinvention Acquisitions 1 2 3 Growth Strategy Long-term Objective Revenue +3-5% Adjusted EBITDA +5-7% Incremental Growth
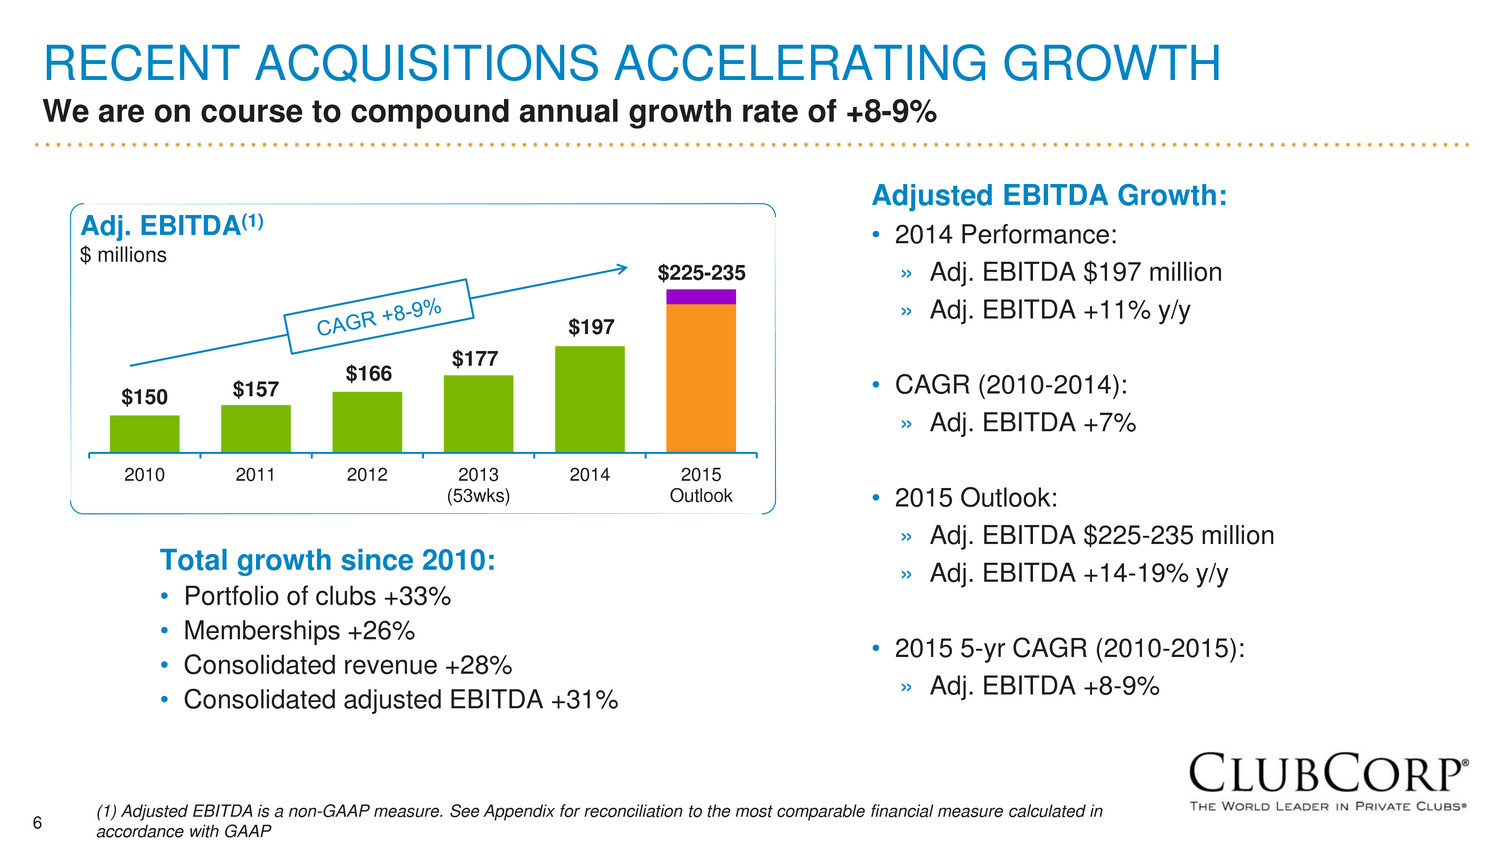
6 RECENT ACQUISITIONS ACCELERATING GROWTH We are on course to compound annual growth rate of +8-9% Adjusted EBITDA Growth: • 2014 Performance: » Adj. EBITDA $197 million » Adj. EBITDA +11% y/y • CAGR (2010-2014): » Adj. EBITDA +7% • 2015 Outlook: » Adj. EBITDA $225-235 million » Adj. EBITDA +14-19% y/y • 2015 5-yr CAGR (2010-2015): » Adj. EBITDA +8-9% $150 $157 $166 $177 $197 $225-235 2010 2011 2012 2013 (53wks) 2014 2015 Outlook Adj. EBITDA(1) $ millions Total growth since 2010: • Portfolio of clubs +33% • Memberships +26% • Consolidated revenue +28% • Consolidated adjusted EBITDA +31% (1) Adjusted EBITDA is a non-GAAP measure. See Appendix for reconciliation to the most comparable financial measure calculated in accordance with GAAP
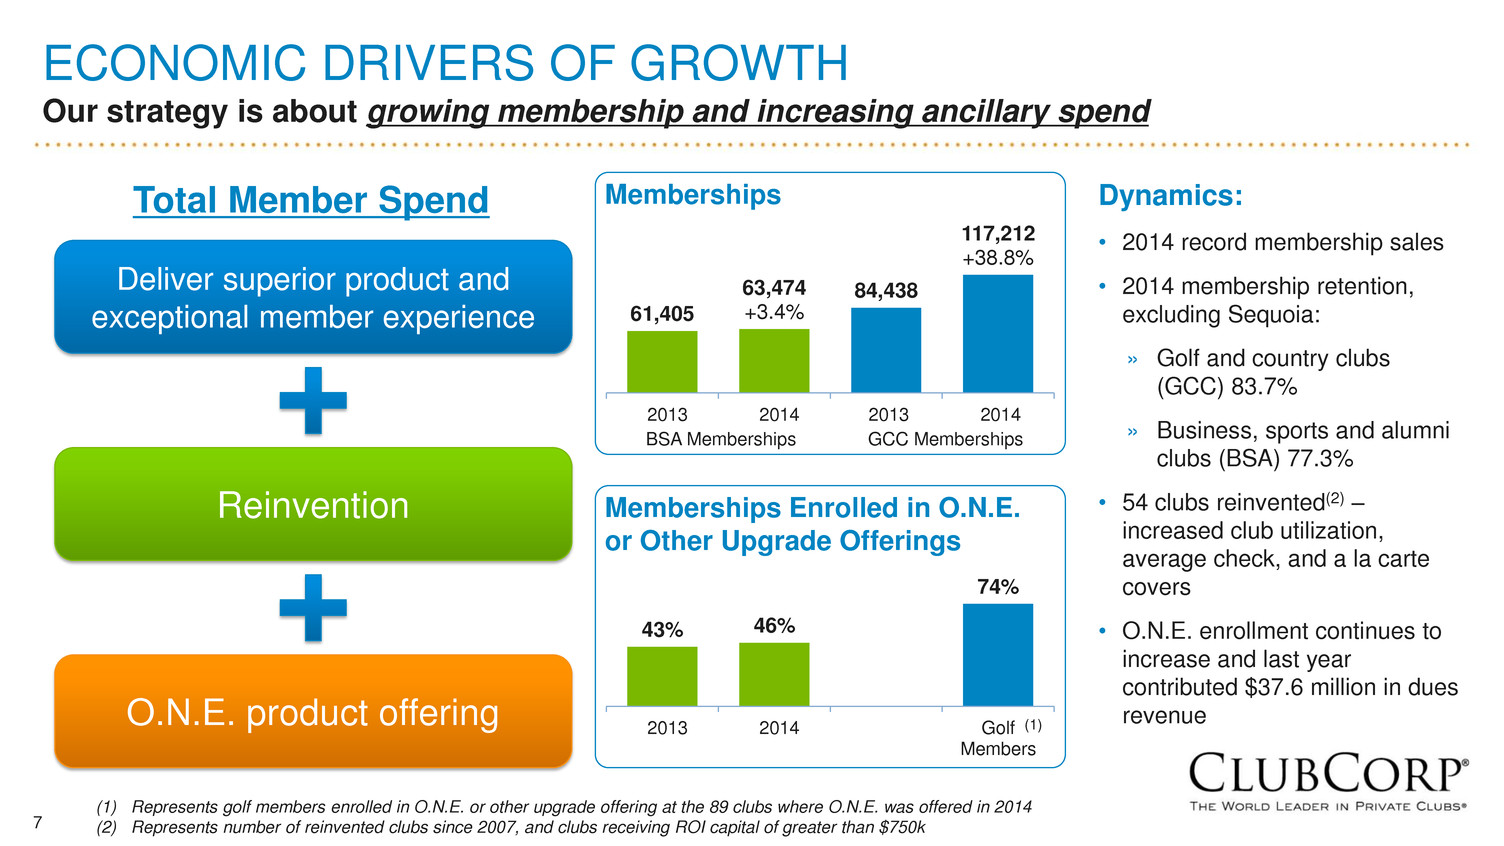
7 ECONOMIC DRIVERS OF GROWTH Our strategy is about growing membership and increasing ancillary spend Deliver superior product and exceptional member experience Reinvention O.N.E. product offering Total Member Spend Dynamics: • 2014 record membership sales • 2014 membership retention, excluding Sequoia: » Golf and country clubs (GCC) 83.7% » Business, sports and alumni clubs (BSA) 77.3% • 54 clubs reinvented(2) – increased club utilization, average check, and a la carte covers • O.N.E. enrollment continues to increase and last year contributed $37.6 million in dues revenue 61,405 63,474 +3.4% 84,438 117,212 +38.8% 2013 2014 2013 2014 BSA Memberships GCC Memberships 43% 46% 74% 2013 2014 Golf Members Memberships Memberships Enrolled in O.N.E. or Other Upgrade Offerings (1) Represents golf members enrolled in O.N.E. or other upgrade offering at the 89 clubs where O.N.E. was offered in 2014 (2) Represents number of reinvented clubs since 2007, and clubs receiving ROI capital of greater than $750k (1)
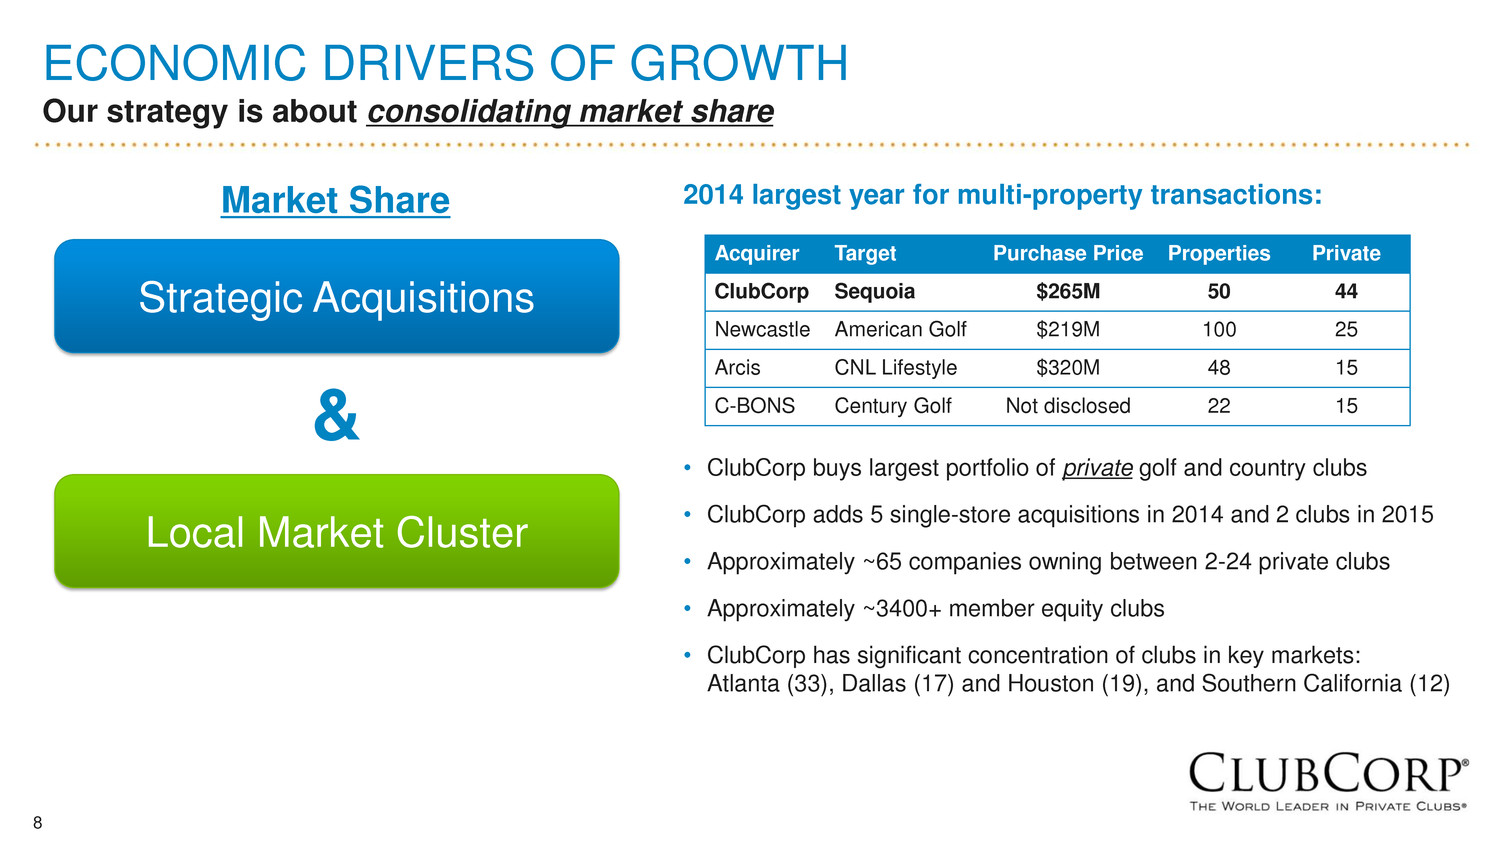
8 2014 largest year for multi-property transactions: • ClubCorp buys largest portfolio of private golf and country clubs • ClubCorp adds 5 single-store acquisitions in 2014 and 2 clubs in 2015 • Approximately ~65 companies owning between 2-24 private clubs • Approximately ~3400+ member equity clubs • ClubCorp has significant concentration of clubs in key markets: Atlanta (33), Dallas (17) and Houston (19), and Southern California (12) ECONOMIC DRIVERS OF GROWTH Our strategy is about consolidating market share Strategic Acquisitions Local Market Cluster Market Share & Acquirer Target Purchase Price Properties Private ClubCorp Sequoia $265M 50 44 Newcastle American Golf $219M 100 25 Arcis CNL Lifestyle $320M 48 15 C-BONS Century Golf Not disclosed 22 15
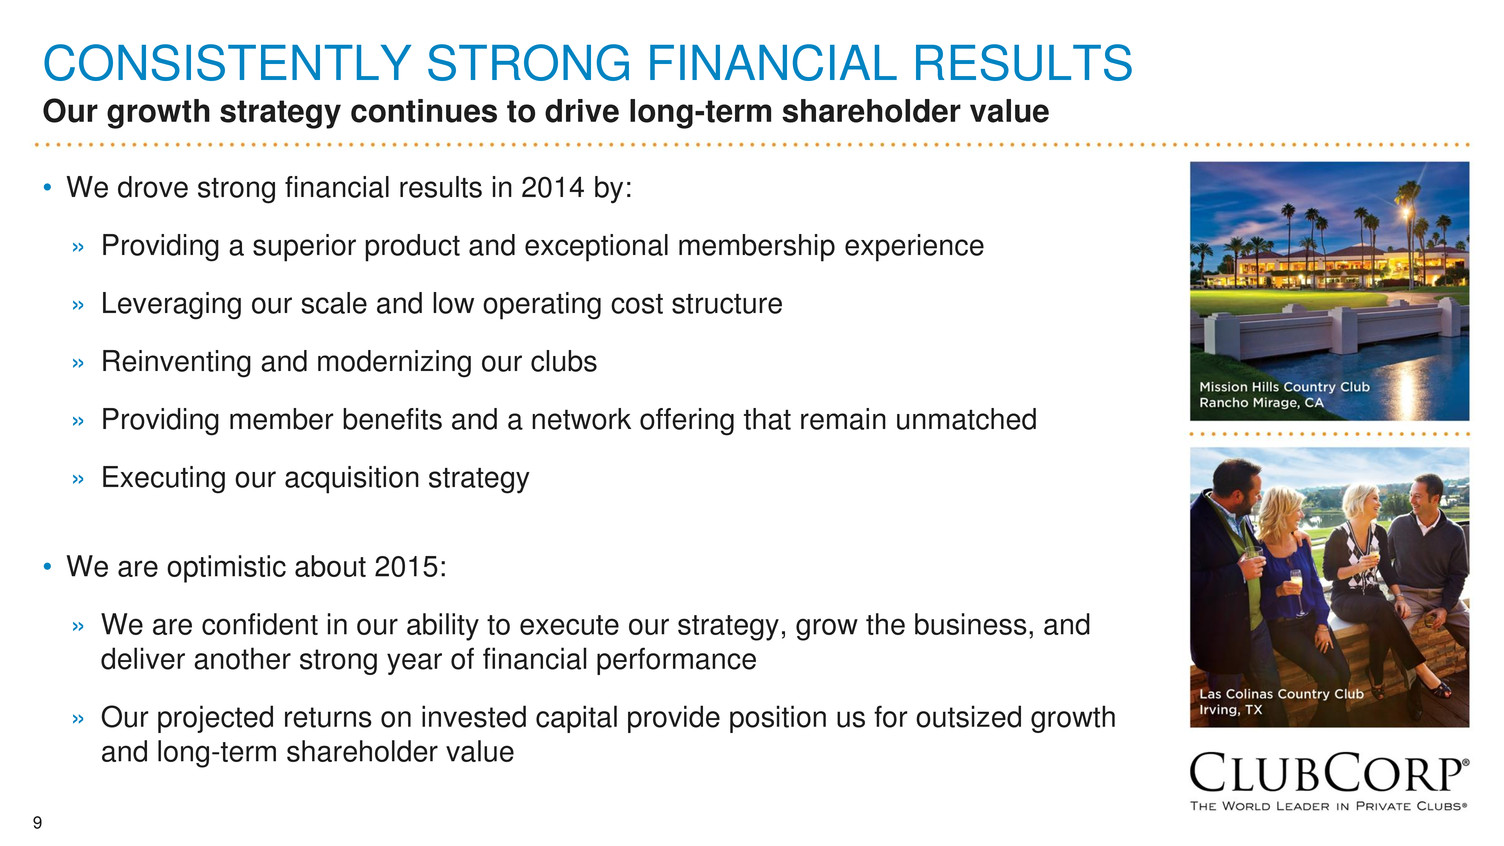
9 CONSISTENTLY STRONG FINANCIAL RESULTS Our growth strategy continues to drive long-term shareholder value • We drove strong financial results in 2014 by: » Providing a superior product and exceptional membership experience » Leveraging our scale and low operating cost structure » Reinventing and modernizing our clubs » Providing member benefits and a network offering that remain unmatched » Executing our acquisition strategy • We are optimistic about 2015: » We are confident in our ability to execute our strategy, grow the business, and deliver another strong year of financial performance » Our projected returns on invested capital provide position us for outsized growth and long-term shareholder value
10 FINANCIAL OVERVIEW Curt McClellan, CFO
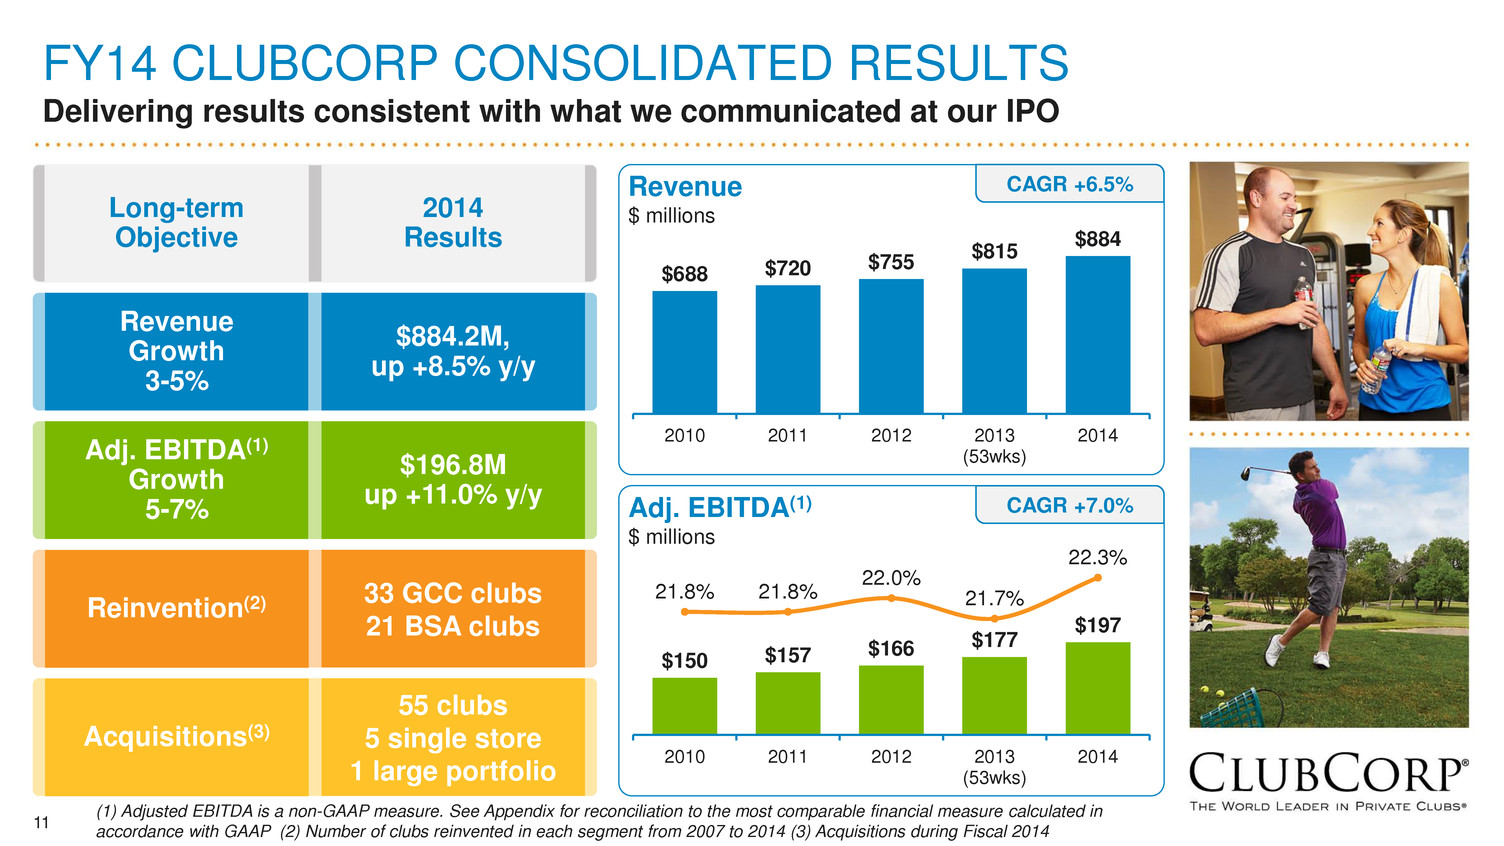
11 FY14 CLUBCORP CONSOLIDATED RESULTS Delivering results consistent with what we communicated at our IPO $688 $720 $755 $815 $884 2010 2011 2012 2013 (53wks) 2014 $150 $157 $166 $177 $197 21.8% 21.8% 22.0% 21.7% 22.3% 2010 2011 2012 2013 (53wks) 2014 Adj. EBITDA(1) Growth 5-7% $196.8M up +11.0% y/y Reinvention(2) 33 GCC clubs 21 BSA clubs Revenue Growth 3-5% $884.2M, up +8.5% y/y Long-term Objective 2014 Results Acquisitions(3) 55 clubs 5 single store 1 large portfolio (1) Adjusted EBITDA is a non-GAAP measure. See Appendix for reconciliation to the most comparable financial measure calculated in accordance with GAAP (2) Number of clubs reinvented in each segment from 2007 to 2014 (3) Acquisitions during Fiscal 2014 Revenue $ millions CAGR +6.5% Adj. EBITDA(1) $ millions CAGR +7.0%
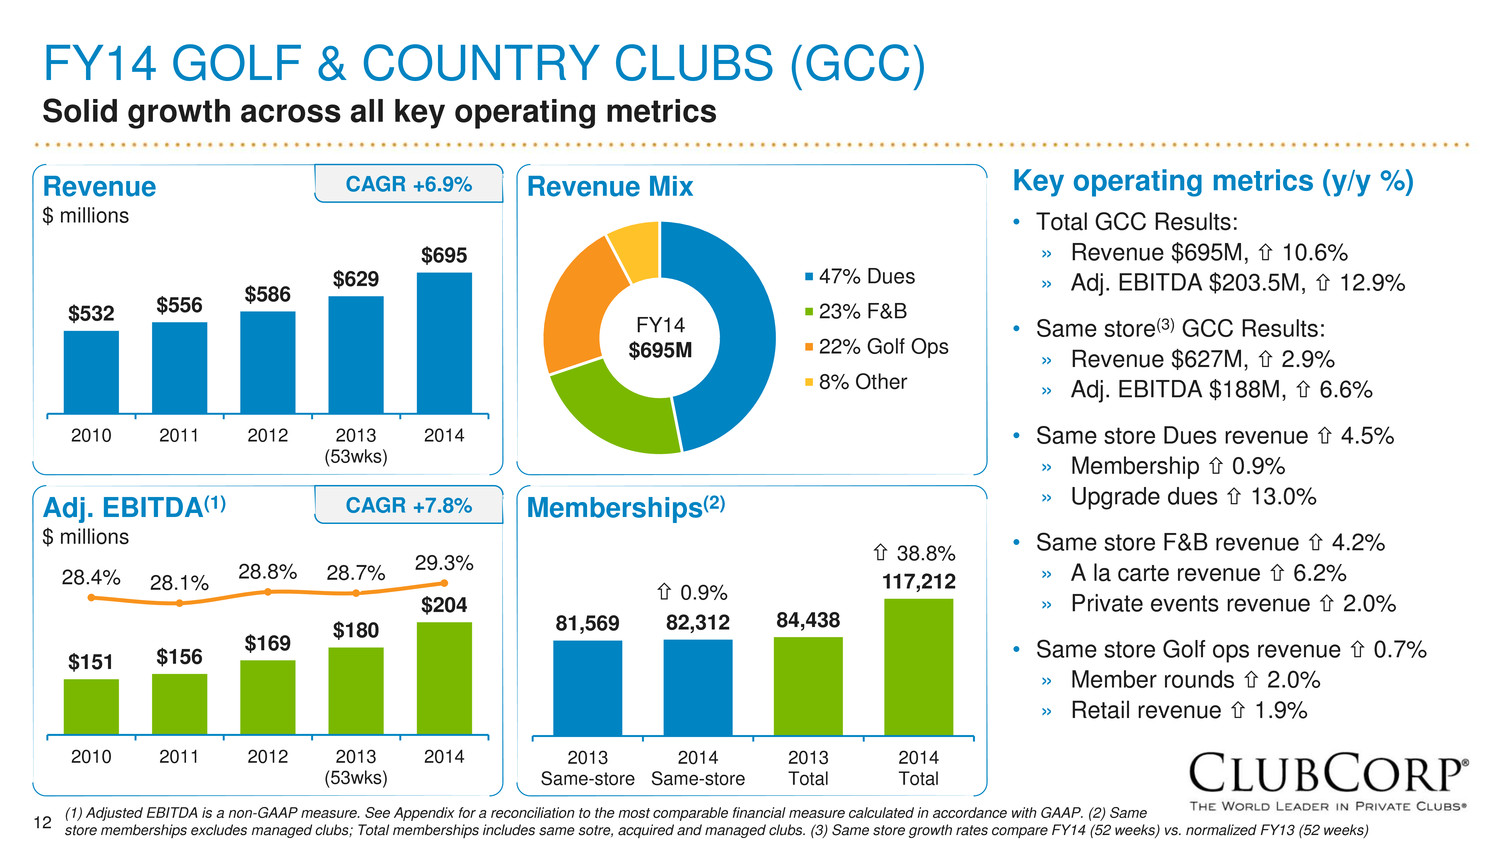
12 FY14 GOLF & COUNTRY CLUBS (GCC) Solid growth across all key operating metrics $532 $556 $586 $629 $695 2010 2011 2012 2013 (53wks) 2014 $151 $156 $169 $180 $204 28.4% 28.1% 28.8% 28.7% 29.3% 2010 2011 2012 2013 (53wks) 2014 81,569 82,312 84,438 117,212 2013 Same-store 2014 Same-store 2013 Total 2014 Total Key operating metrics (y/y %) • Total GCC Results: » Revenue $695M, 10.6% » Adj. EBITDA $203.5M, 12.9% • Same store(3) GCC Results: » Revenue $627M, 2.9% » Adj. EBITDA $188M, 6.6% • Same store Dues revenue 4.5% » Membership 0.9% » Upgrade dues 13.0% • Same store F&B revenue 4.2% » A la carte revenue 6.2% » Private events revenue 2.0% • Same store Golf ops revenue 0.7% » Member rounds 2.0% » Retail revenue 1.9% 47% Dues 23% F&B 22% Golf Ops 8% Other FY14 $695M Revenue $ millions Adj. EBITDA(1) $ millions CAGR +6.9% CAGR +7.8% Revenue Mix Memberships(2) 0.9% 38.8% (1) Adjusted EBITDA is a non-GAAP measure. See Appendix for a reconciliation to the most comparable financial measure calculated in accordance with GAAP. (2) Same store memberships excludes managed clubs; Total memberships includes same sotre, acquired and managed clubs. (3) Same store growth rates compare FY14 (52 weeks) vs. normalized FY13 (52 weeks)
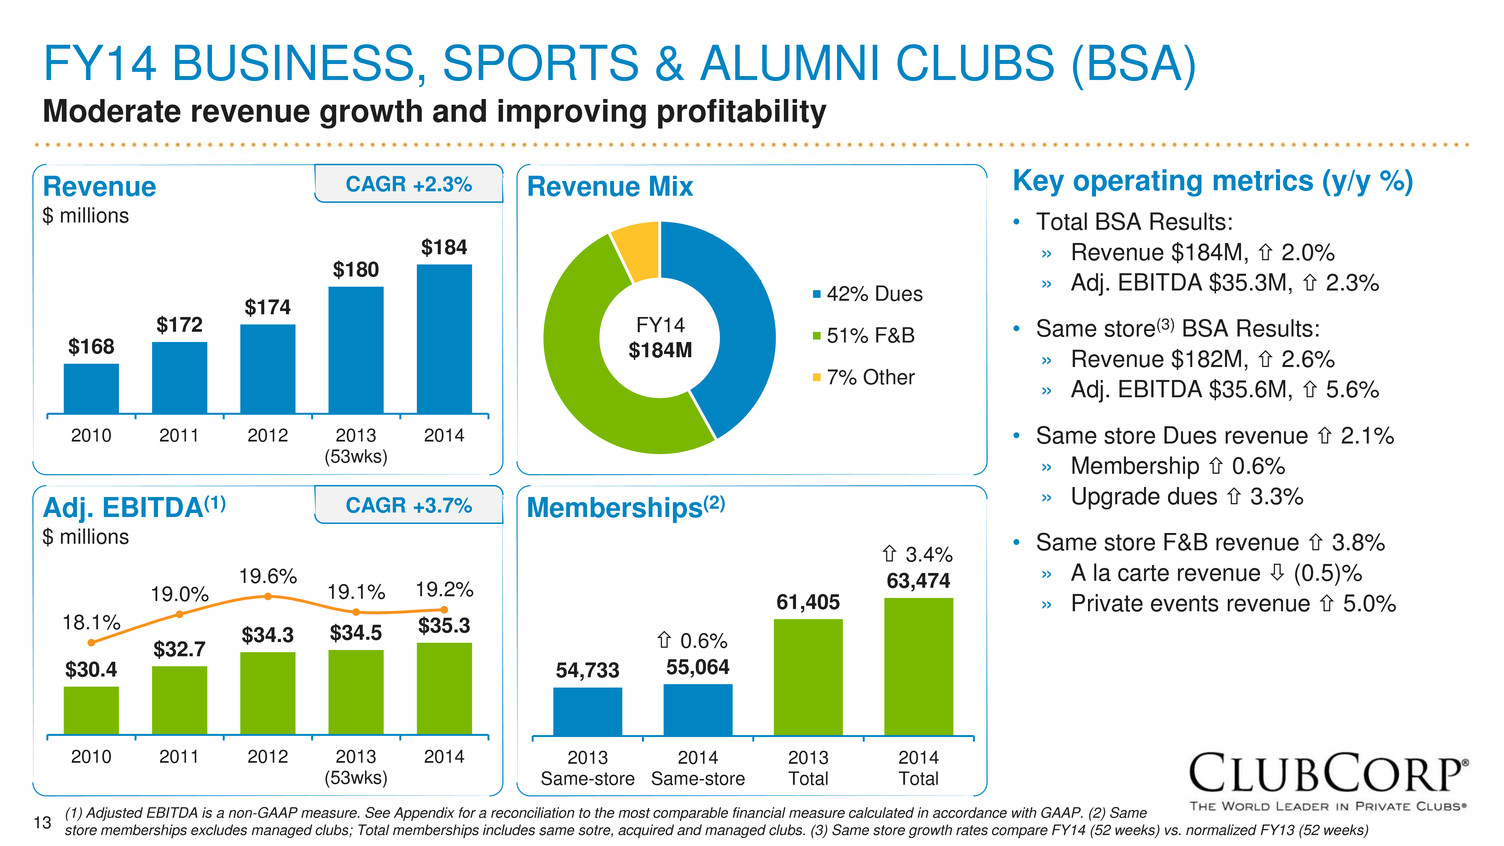
13 FY14 BUSINESS, SPORTS & ALUMNI CLUBS (BSA) Moderate revenue growth and improving profitability $168 $172 $174 $180 $184 2010 2011 2012 2013 (53wks) 2014 $30.4 $32.7 $34.3 $34.5 $35.3 18.1% 19.0% 19.6% 19.1% 19.2% 2010 2011 2012 2013 (53wks) 2014 42% Dues 51% F&B 7% Other FY14 $184M Revenue $ millions Adj. EBITDA(1) $ millions Revenue Mix Memberships(2) 54,733 55,064 61,405 63,474 2013 Same-store 2014 Same-store 2013 Total 2014 Total 0.6% 3.4% CAGR +2.3% CAGR +3.7% Key operating metrics (y/y %) • Total BSA Results: » Revenue $184M, 2.0% » Adj. EBITDA $35.3M, 2.3% • Same store(3) BSA Results: » Revenue $182M, 2.6% » Adj. EBITDA $35.6M, 5.6% • Same store Dues revenue 2.1% » Membership 0.6% » Upgrade dues 3.3% • Same store F&B revenue 3.8% » A la carte revenue (0.5)% » Private events revenue 5.0% (1) Adjusted EBITDA is a non-GAAP measure. See Appendix for a reconciliation to the most comparable financial measure calculated in accordance with GAAP. (2) Same store memberships excludes managed clubs; Total memberships includes same sotre, acquired and managed clubs. (3) Same store growth rates compare FY14 (52 weeks) vs. normalized FY13 (52 weeks)

14 4Q14 CONSOLIDATED RESULTS Revenue up +12.2%, adjusted EBITDA +15.6% Key operating metrics (y/y %) • Total Consolidated Results: » Revenue $302.5M, 12.2% » Adj. EBITDA(4) $69.5M, 15.6% • Same store(2) Combined Clubs: » Revenue $252.7M, 1.8% » Adj. EBITDA $72.5M, 5.4% • Same store(2) Dues revenue 4.1% • Same store(2) F&B revenue 1.5% • Same store(2) Golf ops down (0.8)% (1) Change compares fourth quarter ended December 30, 2014 (16 weeks) to fourth quarter ended December 31, 2013 (17 weeks). (2) Change compares fourth quarter ended December 30, 2014 (16 weeks) to normalized fourth quarter ended December 31, 2013 (first 16 weeks). (3) The change in Other Revenue was largely due to one fewer week in 2014 and lower revenue recognized for membership initiation payments that are being recognized into revenue over the lives of active memberships. (4) Adjusted EBITDA is a non-GAAP measure. See Appendix for a reconciliation to the most comparable financial measure calculated in accordance with GAAP. December 30, December 31, $ % $ % 2014 2013 Change(1) Change(1) Change(2) Change(2) Consolidated Results (16 weeks) (17 weeks) vs. 17 weeks vs. 17 weeks vs. 16 weeks vs. 16 weeks Combined Same Store Clubs Revenue Dues 115,707$ 117,778$ (2,071)$ (1.8%) 4,560$ 4.1% Food and Beverage 80,490 81,813 (1,323) (1.6%) 1,221 1.5% Golf Operations 39,717 41,761 (2,044) (4.9%) (301) (0.8%) Other(3) 16,749 18,512 (1,763) (9.5%) (1,133) (6.3%) Revenue 252,663$ 259,864$ (7,201)$ (2.8%) 4,347$ 1.8% Adjusted EBITDA 72,490$ 72,362$ 128$ 0.2% 3,685$ 5.4% Adjusted EBITDA Margin 28.7% 27.8% 90 bps 100 bps Combined New or Acquired Clubs Revenue 46,535$ 5,617$ 40,918$ Adjusted EBITDA 12,801$ 957$ 11,844$ Adjusted EBITDA Margin 27.5% 17.0% Total Cons lidated Results Revenue 302,539$ 269,566$ 32,973$ 12.2% Adjusted EBITDA 69,498$ 60,131$ 9,367$ 15.6% Adjusted EBITDA Margin 23.0% 22.3% 70 bps Fourth Quarter Ended "Normalized" Comparable 16 weeks
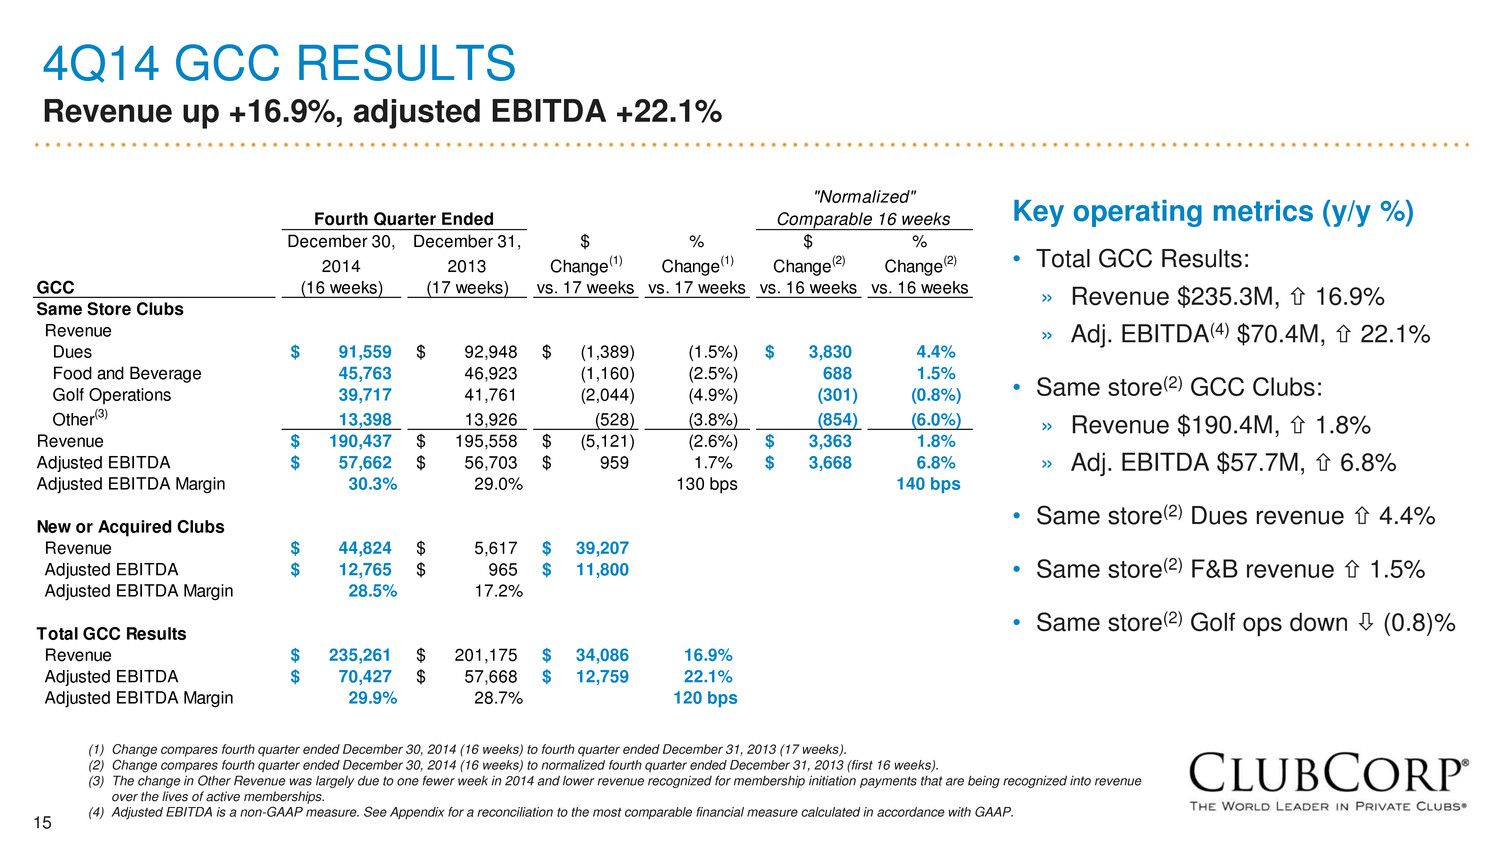
15 4Q14 GCC RESULTS Revenue up +16.9%, adjusted EBITDA +22.1% Key operating metrics (y/y %) • Total GCC Results: » Revenue $235.3M, 16.9% » Adj. EBITDA(4) $70.4M, 22.1% • Same store(2) GCC Clubs: » Revenue $190.4M, 1.8% » Adj. EBITDA $57.7M, 6.8% • Same store(2) Dues revenue 4.4% • Same store(2) F&B revenue 1.5% • Same store(2) Golf ops down (0.8)% (1) Change compares fourth quarter ended December 30, 2014 (16 weeks) to fourth quarter ended December 31, 2013 (17 weeks). (2) Change compares fourth quarter ended December 30, 2014 (16 weeks) to normalized fourth quarter ended December 31, 2013 (first 16 weeks). (3) The change in Other Revenue was largely due to one fewer week in 2014 and lower revenue recognized for membership initiation payments that are being recognized into revenue over the lives of active memberships. (4) Adjusted EBITDA is a non-GAAP measure. See Appendix for a reconciliation to the most comparable financial measure calculated in accordance with GAAP. December 30, December 31, $ % $ % 2014 2013 Change(1) Change(1) Change(2) Change(2) GCC (16 weeks) (17 weeks) vs. 17 weeks vs. 17 weeks vs. 16 weeks vs. 16 weeks Same Store Clubs Revenue Dues 91,559$ 92,948$ (1,389)$ (1.5%) 3,830$ 4.4% Food and Beverage 45,763 46,923 (1,160) (2.5%) 688 1.5% Golf Operations 39,717 41,761 (2,044) (4.9%) (301) (0.8%) Other(3) 13,398 13,926 (528) (3.8%) (854) (6.0%) Revenue 190,437$ 195,558$ (5,121)$ (2.6%) 3,363$ 1.8% Adjusted EBITDA 57,662$ 56,703$ 959$ 1.7% 3,668$ 6.8% Adjusted EBITDA Margin 30.3% 29.0% 130 bps 140 bps New or Acquired Clubs Revenue 44,824$ 5,617$ 39,207$ Adjusted EBITDA 12,765$ 965$ 11,800$ Adjusted EBITDA Margin 28.5% 17.2% Total GCC Results Revenue 235,261$ 201,175$ 34,086$ 16.9% Adjusted EBITDA 70,427$ 57,668$ 12,759$ 22.1% Adjusted EBITDA Margin 29.9% 28.7% 120 bps "Normalized" Comparable 16 weeksFourth Quarter Ended
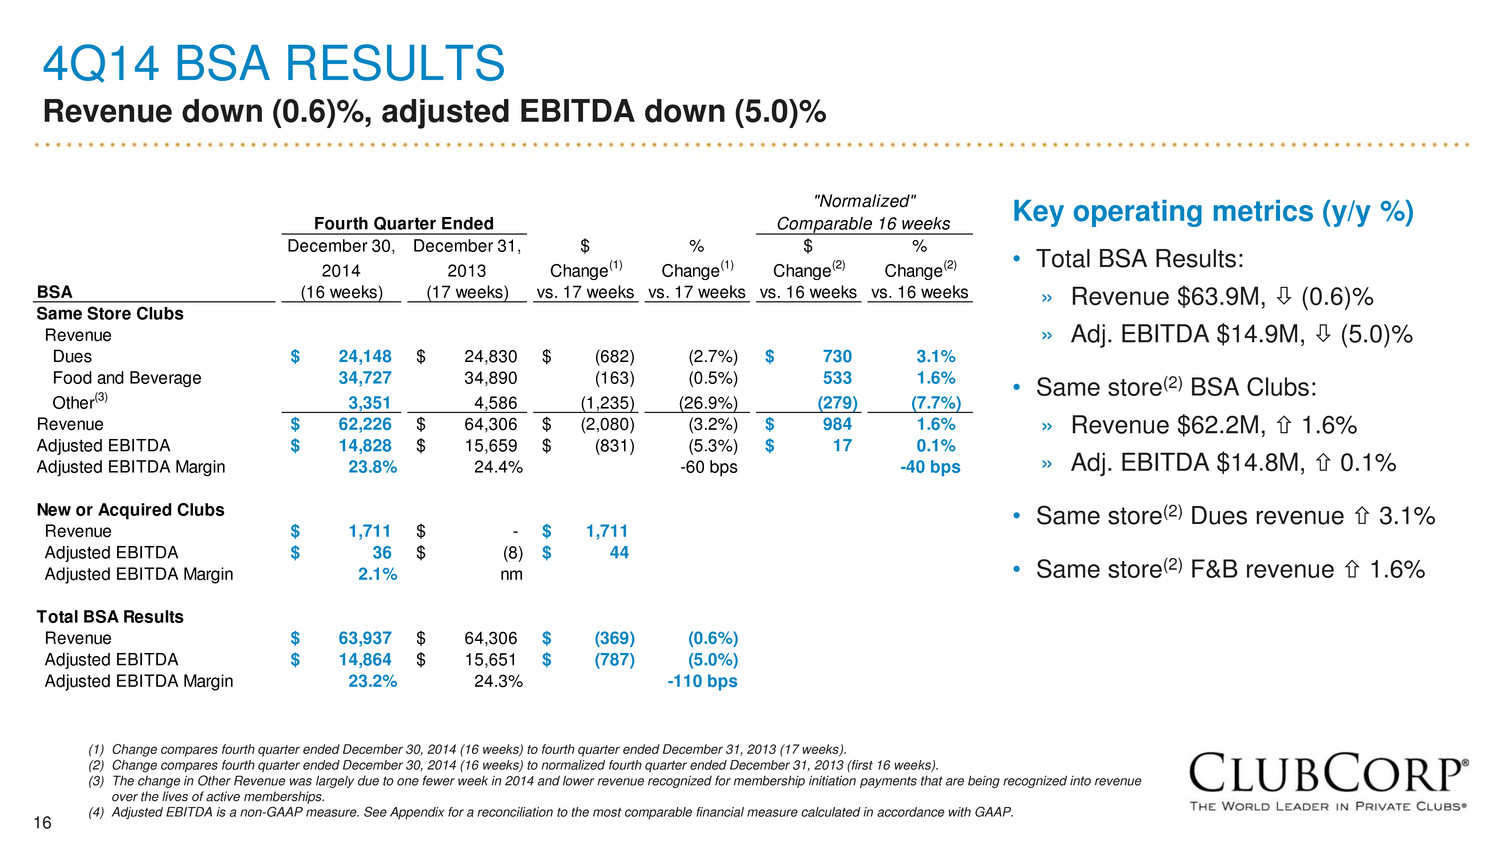
16 4Q14 BSA RESULTS Revenue down (0.6)%, adjusted EBITDA down (5.0)% Key operating metrics (y/y %) • Total BSA Results: » Revenue $63.9M, (0.6)% » Adj. EBITDA $14.9M, (5.0)% • Same store(2) BSA Clubs: » Revenue $62.2M, 1.6% » Adj. EBITDA $14.8M, 0.1% • Same store(2) Dues revenue 3.1% • Same store(2) F&B revenue 1.6% (1) Change compares fourth quarter ended December 30, 2014 (16 weeks) to fourth quarter ended December 31, 2013 (17 weeks). (2) Change compares fourth quarter ended December 30, 2014 (16 weeks) to normalized fourth quarter ended December 31, 2013 (first 16 weeks). (3) The change in Other Revenue was largely due to one fewer week in 2014 and lower revenue recognized for membership initiation payments that are being recognized into revenue over the lives of active memberships. (4) Adjusted EBITDA is a non-GAAP measure. See Appendix for a reconciliation to the most comparable financial measure calculated in accordance with GAAP. December 30, December 31, $ % $ % 2014 2013 Change(1) Change(1) Change(2) Change(2) BSA (16 weeks) (17 weeks) vs. 17 weeks vs. 17 weeks vs. 16 weeks vs. 16 weeks Same Store Clubs Revenue Dues 24,148$ 24,830$ (682)$ (2.7%) 730$ 3.1% Food and Beverage 34,727 34,890 (163) (0.5%) 533 1.6% Other(3) 3,351 4,586 (1,235) (26.9%) (279) (7.7%) Revenue 62,226$ 64,306$ (2,080)$ (3.2%) 984$ 1.6% Adjusted EBITDA 14,828$ 15,659$ (831)$ (5.3%) 17$ 0.1% Adjusted EBITDA Margin 23.8% 24.4% -60 bps -40 bps New or Acquired Clubs Revenue 1,711$ -$ 1,711$ Adjusted EBITDA 36$ (8)$ 44$ Adjusted EBITDA Margin 2.1% nm Total BSA Results Revenue 63,937$ 64,306$ (369)$ (0.6%) Adjusted EBITDA 14,864$ 15,651$ (787)$ (5.0%) Adjusted EBITDA Margin 23.2% 24.3% -110 bps "Normalized" Comparable 16 weeksFourth Quarter Ended

17 FY14 CAPEX Continued investment in business … 2014 Capital Expenditures • 2014 maintenance capex $29.1 million • 2014 expansion capital: » ROI capital $43.5 million » Acquisition capital $280.3 million 2015 Capital Expenditures • 2015 anticipate investing $45.7 million on maintenance capex • 2015 anticipate investing $42.1 million on reinvention of approximately 29 clubs, including 9 same-store GCC, 4 same-store BSA, 7 recent single-store acquisitions and 9 Sequoia clubs $24.9 $25.1 $16.7 $23.8 $29.1 $18.0 $22.8 $37.5 $35.7 $43.5 2010 2011 2012 2013 2014 Maintenance Capex ROI Capex Capital Expenditures $ millions
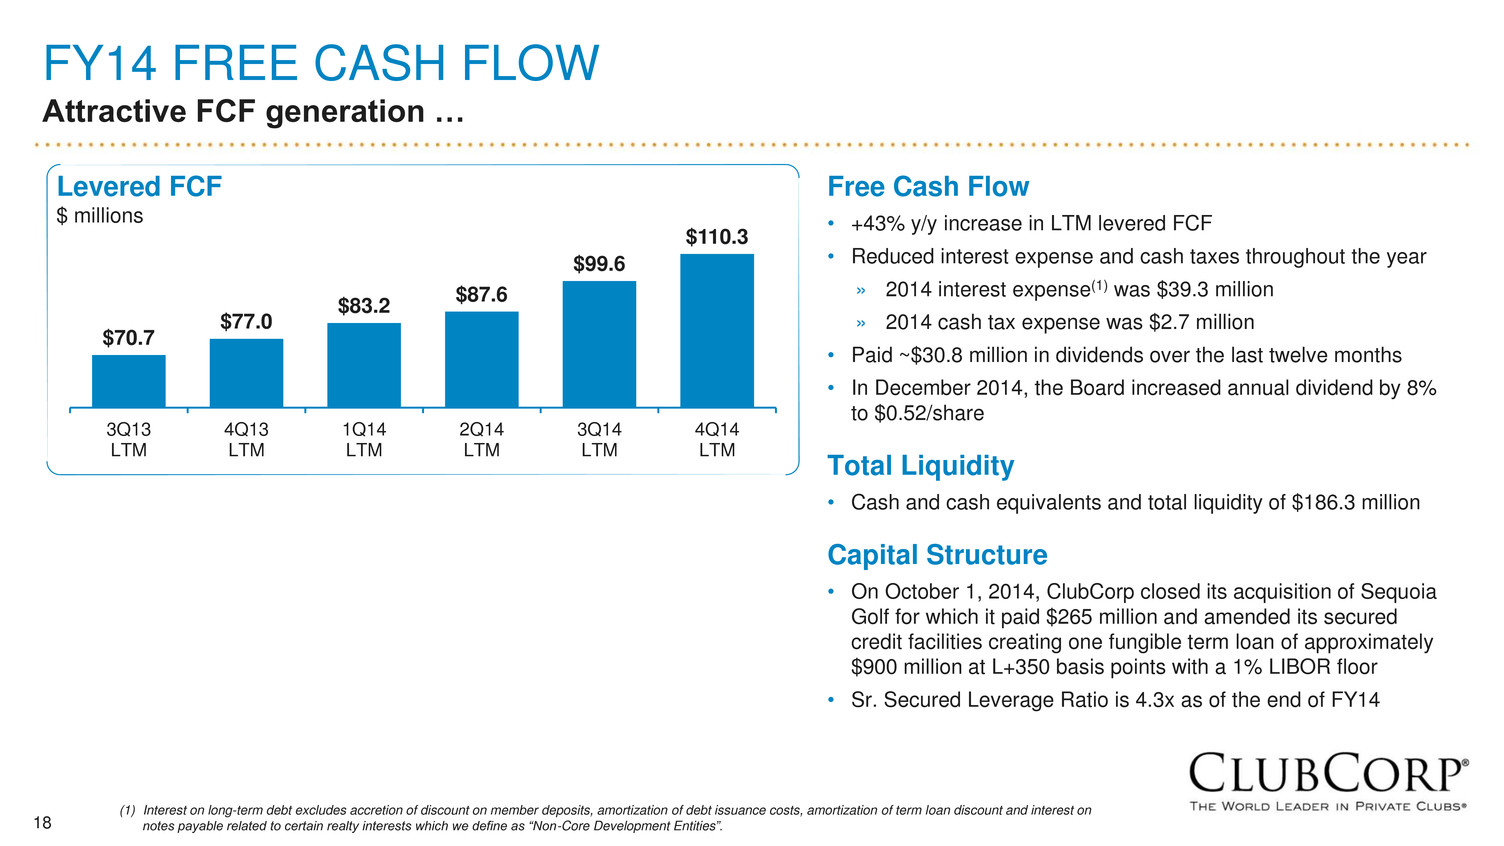
18 FY14 FREE CASH FLOW Attractive FCF generation … $70.7 $77.0 $83.2 $87.6 $99.6 $110.3 3Q13 LTM 4Q13 LTM 1Q14 LTM 2Q14 LTM 3Q14 LTM 4Q14 LTM Free Cash Flow • +43% y/y increase in LTM levered FCF • Reduced interest expense and cash taxes throughout the year » 2014 interest expense(1) was $39.3 million » 2014 cash tax expense was $2.7 million • Paid ~$30.8 million in dividends over the last twelve months • In December 2014, the Board increased annual dividend by 8% to $0.52/share Total Liquidity • Cash and cash equivalents and total liquidity of $186.3 million Capital Structure • On October 1, 2014, ClubCorp closed its acquisition of Sequoia Golf for which it paid $265 million and amended its secured credit facilities creating one fungible term loan of approximately $900 million at L+350 basis points with a 1% LIBOR floor • Sr. Secured Leverage Ratio is 4.3x as of the end of FY14 Levered FCF $ millions (1) Interest on long-term debt excludes accretion of discount on member deposits, amortization of debt issuance costs, amortization of term loan discount and interest on notes payable related to certain realty interests which we define as “Non-Core Development Entities”.
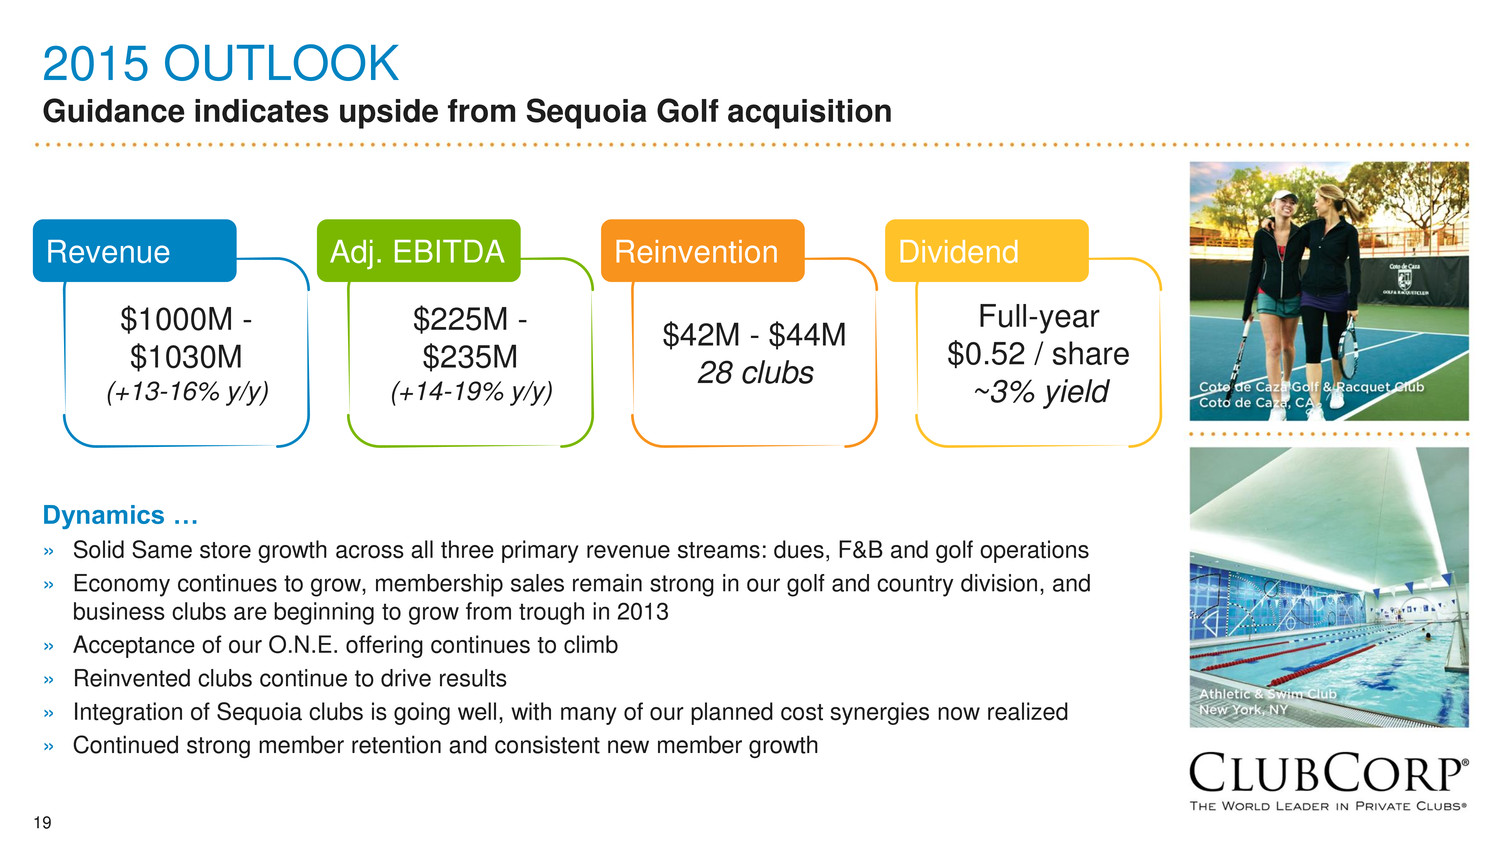
19 2015 OUTLOOK Guidance indicates upside from Sequoia Golf acquisition Dynamics … » Solid Same store growth across all three primary revenue streams: dues, F&B and golf operations » Economy continues to grow, membership sales remain strong in our golf and country division, and business clubs are beginning to grow from trough in 2013 » Acceptance of our O.N.E. offering continues to climb » Reinvented clubs continue to drive results » Integration of Sequoia clubs is going well, with many of our planned cost synergies now realized » Continued strong member retention and consistent new member growth $1000M - $1030M (+13-16% y/y) Revenue $225M - $235M (+14-19% y/y) Adj. EBITDA $42M - $44M 28 clubs Reinvention Full-year $0.52 / share ~3% yield Dividend

20 APPENDIX
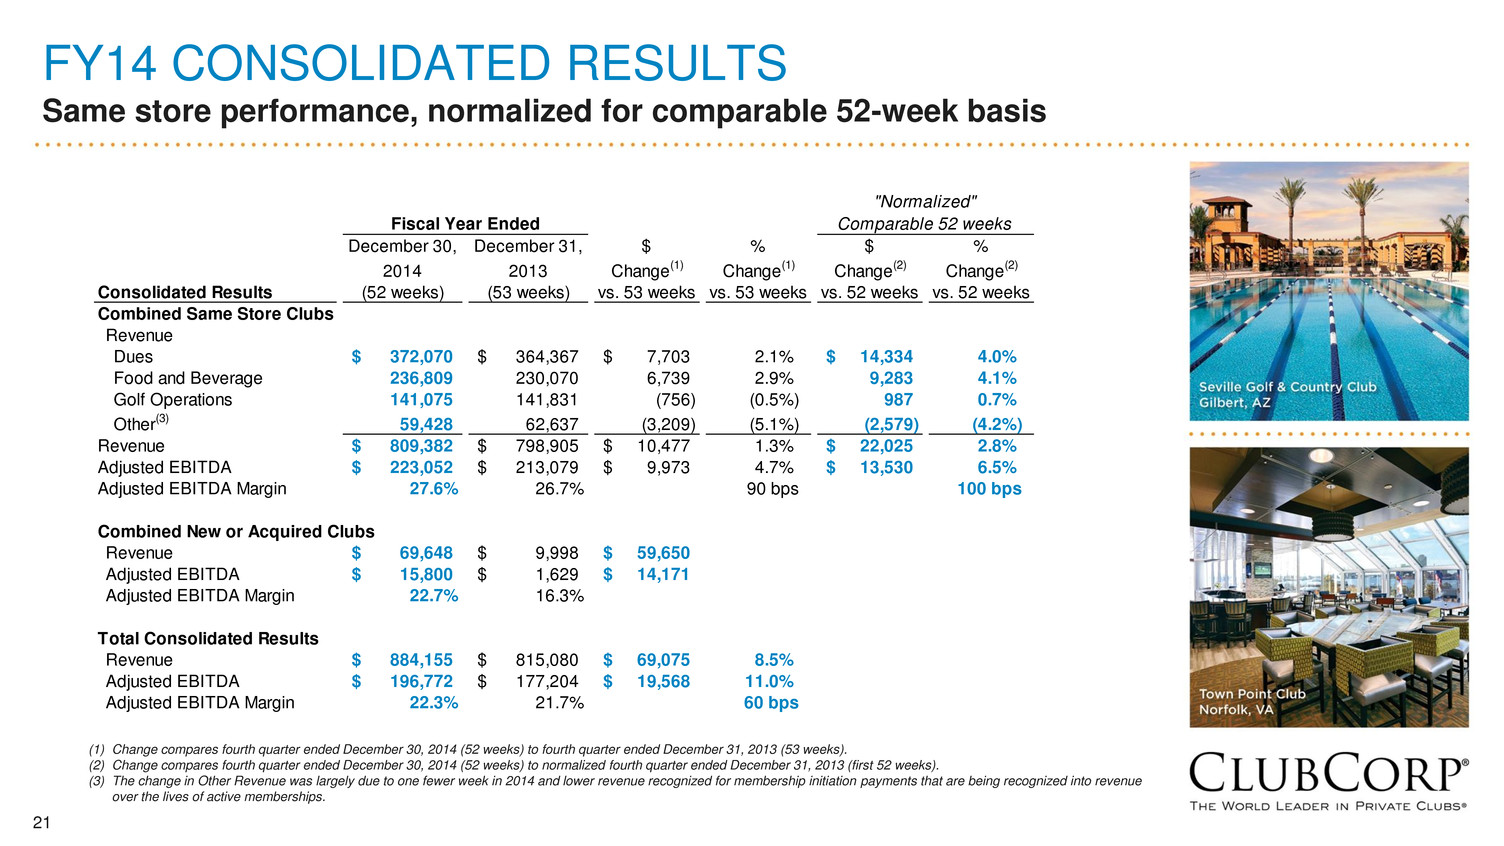
21 FY14 CONSOLIDATED RESULTS Same store performance, normalized for comparable 52-week basis (1) Change compares fourth quarter ended December 30, 2014 (52 weeks) to fourth quarter ended December 31, 2013 (53 weeks). (2) Change compares fourth quarter ended December 30, 2014 (52 weeks) to normalized fourth quarter ended December 31, 2013 (first 52 weeks). (3) The change in Other Revenue was largely due to one fewer week in 2014 and lower revenue recognized for membership initiation payments that are being recognized into revenue over the lives of active memberships. December 30, December 31, $ % $ % 2014 2013 Change(1) Change(1) Change(2) Change(2) Consolidated Results (52 weeks) (53 weeks) vs. 53 weeks vs. 53 weeks vs. 52 weeks vs. 52 weeks Combined Same Store Clubs Revenue Dues 372,070$ 364,367$ 7,703$ 2.1% 14,334$ 4.0% Food and Beverage 236,809 230,070 6,739 2.9% 9,283 4.1% Golf Operations 141,075 141,831 (756) (0.5%) 987 0.7% Other(3) 59,428 62,637 (3,209) (5.1%) (2,579) (4.2%) Revenue 809,382$ 798,905$ 10,477$ 1.3% 22,025$ 2.8% Adjusted EBITDA 223,052$ 213,079$ 9,973$ 4.7% 13,530$ 6.5% Adjusted EBITDA Margin 27.6% 26.7% 90 bps 100 bps Combined New or Acquired Clubs Revenue 69,648$ 9,998$ 59,650$ Adjusted EBITDA 15,800$ 1,629$ 14,171$ Adjusted EBITDA Margin 22.7% 16.3% Total Consolidated Results Revenue 884,155$ 815,080$ 69,075$ 8.5% Adjusted EBITDA 196,772$ 177,204$ 19,568$ 11.0% Adjusted EBITDA Margin 22.3% 21.7% 60 bps Fiscal Year Ended "Normalized" Comparable 52 weeks

22 FY14 GOLF & COUNTRY CLUBS (GCC) Same store performance, normalized for comparable 52-week basis (1) Change compares fourth quarter ended December 30, 2014 (52 weeks) to fourth quarter ended December 31, 2013 (53 weeks). (2) Change compares fourth quarter ended December 30, 2014 (52 weeks) to normalized fourth quarter ended December 31, 2013 (first 52 weeks). (3) The change in Other Revenue was largely due to one fewer week in 2014 and lower revenue recognized for membership initiation payments that are being recognized into revenue over the lives of active memberships. December 30, December 31, $ % $ % 2014 2013 Change(1) Change(1) Change(2) Change(2) GCC (52 weeks) (53 weeks) vs. 53 weeks vs. 53 weeks vs. 52 weeks vs. 52 weeks Same Store Clubs Revenue Dues 294,291$ 286,767$ 7,524$ 2.6% 12,743$ 4.5% Food and Beverage 143,904 139,899 4,005 2.9% 5,853 4.2% Golf Operations 141,075 141,831 (756) (0.5%) 987 0.7% Other(3) 48,214 49,978 (1,764) (3.5%) (2,090) (4.2%) Revenue 627,484$ 618,475$ 9,009$ 1.5% 17,493$ 2.9% Adjusted EBITDA 187,502$ 178,571$ 8,931$ 5.0% 11,640$ 6.6% Adjusted EBITDA Margin 29.9% 28.9% 100 bps 110 bps New or Acquired Clubs Revenue 67,543$ 9,998$ 57,545$ Adjusted EBITDA 16,040$ 1,637$ 14,403$ Adjusted EBITDA Margin 23.7% 16.4% Total GCC Results Revenue 695,028$ 628,474$ 66,554$ 10.6% Adjusted EBITDA 203,542$ 180,207$ 23,335$ 12.9% Adjusted EBITDA Margin 29.3% 28.7% 60 bps "Normalized" Comparable 52 weeksFiscal Year Ended
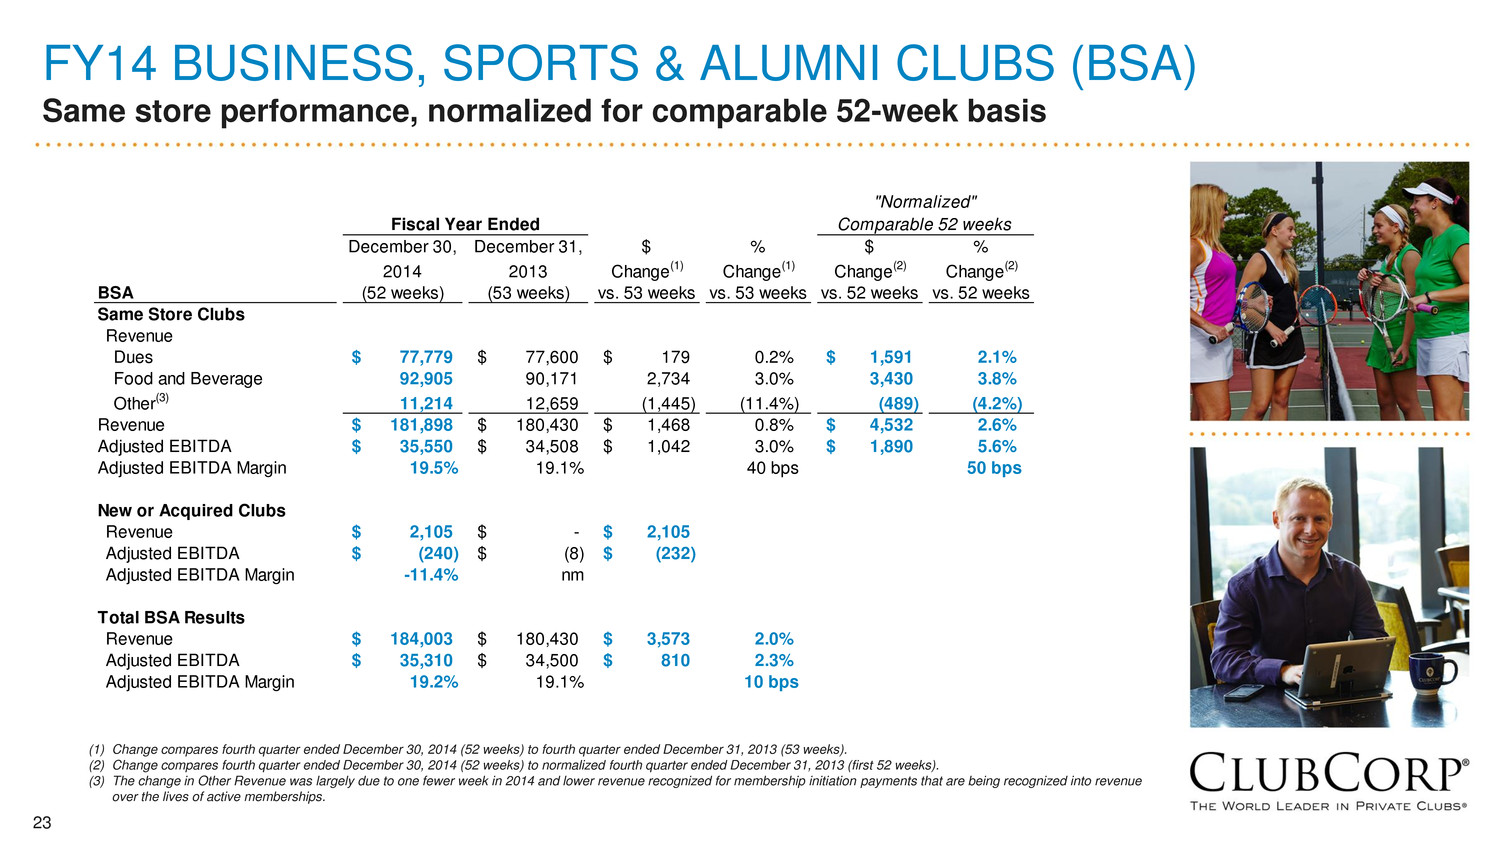
23 FY14 BUSINESS, SPORTS & ALUMNI CLUBS (BSA) Same store performance, normalized for comparable 52-week basis (1) Change compares fourth quarter ended December 30, 2014 (52 weeks) to fourth quarter ended December 31, 2013 (53 weeks). (2) Change compares fourth quarter ended December 30, 2014 (52 weeks) to normalized fourth quarter ended December 31, 2013 (first 52 weeks). (3) The change in Other Revenue was largely due to one fewer week in 2014 and lower revenue recognized for membership initiation payments that are being recognized into revenue over the lives of active memberships. December 30, December 31, $ % $ % 2014 2013 Change(1) Change(1) Change(2) Change(2) BSA (52 weeks) (53 weeks) vs. 53 weeks vs. 53 weeks vs. 52 weeks vs. 52 weeks Same Store Clubs Revenue Dues 77,779$ 77,600$ 179$ 0.2% 1,591$ 2.1% Food and Beverage 92,905 90,171 2,734 3.0% 3,430 3.8% Other(3) 11,214 12,659 (1,445) (11.4%) (489) (4.2%) Revenue 181,898$ 180,430$ 1,468$ 0.8% 4,532$ 2.6% Adjusted EBITDA 35,550$ 34,508$ 1,042$ 3.0% 1,890$ 5.6% Adjusted EBITDA Margin 19.5% 19.1% 40 bps 50 bps New or Acquired Clubs Revenue 2,105$ -$ 2,105$ Adjusted EBITDA (240)$ (8)$ (232)$ Adjusted EBITDA Margin -11.4% nm Total BSA Results Revenue 184,003$ 180,430$ 3,573$ 2.0% Adjusted EBITDA 35,310$ 34,500$ 810$ 2.3% Adjusted EBITDA Margin 19.2% 19.1% 10 bps "Normalized" Comparable 52 weeksFiscal Year Ended

24 NET INCOME TO ADJUSTED EBITDA RECONCILIATION OF NON-GAAP MEASURES TO CLOSEST GAAP MEASURE (1) Includes non-cash impairment charges related to property and equipment and intangible assets, loss on disposals of assets (including property and equipment disposed of in connection with renovations) and net loss or income from discontinued operations and divested clubs that do not quality as discontinued operations.(2) Includes loss on extinguishment of debt calculated in accordance with GAAP. (3) Includes non-cash items related to purchase accounting associated with the acquisition of ClubCorp, Inc. ("CCI") in 2006 by affiliates of KSL and expense recognized for our long-term incentive plan related to fiscal years 2011 through 2013. (4) Represents adjustments permitted by the credit agreement governing ClubCorp's secured credit facilities including cash distributions from equity method investments less equity in earnings recognized for said investments, income or loss attributable to non-controlling equity interests of continuing operations, franchise taxes, adjustments to accruals for unclaimed property settlements, acquisition costs, debt amendment costs, equity offering costs, other charges incurred in connection with the ClubCorp Formation (as defined in our Annual Report on Form 10-K filed with the SEC on March 21, 2014) and management fees, termination fee and expenses paid to an affiliate of KSL. (5) Includes equity- based compensation expense, calculated in accordance with GAAP, related to awards held by certain employees, executives and directors. (6) Represents estimated deferred revenue using current membership life estimates related to initiation payments that would have been recognized in the applicable period but for the application of purchase accounting in connection with the acquisition of CCI in 2006 and the acquisition of Sequoia Golf on September 30, 2014. 3Q13 4Q13 1Q14 2Q14 3Q14 4Q14 LTM LTM LTM LTM LTM LTM Net (loss) (11,454)$ (40,680)$ (33,977)$ (58,576)$ (50,269)$ 13,329$ Interest expense 87,771 83,669 79,815 75,820 69,265 65,209 Income tax (benefit) expense (6,131) 1,681 612 (4,506) (2,497) (41,469) Interest and investment income (1,350) (345) (352) (370) (1,656) (2,585) Depreciation and amortization 73,857 72,073 72,364 72,851 72,981 80,792 EBITDA 142,693 116,398 118,462 85,219 87,824 115,276 Impairments, disposition of assets and income (loss) from discontinued operations and divested clubs (1) 19,903 14,364 15,206 14,352 13,360 12,729 Loss on extinguishment of debt (2) - 16,856 16,856 48,354 48,354 31,498 on-cash adjustments (3) 3,903 3,929 3,581 3,201 2,545 2,007 Other adjustments (4) 6,229 10,134 8,565 13,674 14,932 25,315 Equity-based compensation expense (5) - 14,217 15,049 16,305 17,254 4,303 Acquisition adjustment (6) 1,985 1,306 1,776 2,400 3,136 5,644 Adjusted EBITDA 174,713$ 177,204$ 179,495$ 183,505$ 187,405$ 196,772$

25 CALCULATION OF FREE CASH FLOW RECONCILIATION OF NON-GAAP MEASURES TO CLOSEST GAAP MEASURE (1) See the Adjusted EBITDA reconciliation in the preceding "Reconciliation of Non-GAAP Measures to Closest GAAP Measure" table. (2) Interest on long-term debt excludes accretion of discount on member deposits, amortization of debt issuance costs, amortization of term loan discount and interest on notes payable related to certain realty interests which we define as “Non-Core Development Entities”. 3Q13 4Q13 1Q14 2Q14 3Q14 4Q14 LTM LTM LTM LTM LTM LTM Adjusted EBITDA (1) 174,713$ 177,204$ 179,495$ 183,505$ 187,405$ 196,772$ LE : Interest expense and principal amortization on long-term debt (2) 64,758 61,317 56,660 51,776 44,370 40,912 Cash paid for income taxes 3,521 3,187 3,192 4,162 2,796 2,723 Maintenance capital expenditures 24,135 23,831 24,279 27,730 28,162 29,067 Capital lease principal & interest expense 11,644 11,885 12,190 12,197 12,436 13,799 Free Cash Flow 70,655$ 76,984$ 83,174$ 87,640$ 99,641$ 110,271$
26


