1 FISCAL 2015 Q2 PERFORMANCE July 23, 2015
2 CAUTIONARY STATEMENTS Forward-Looking Statements Certain statements in this presentation may be considered forward-looking statements. Forward-looking statements generally relate to future events or our future financial or operating performance. In some cases, you can identify forward-looking statements by terminology such as “may”, “should”, “expect”, “intend”, “will”, “estimate”, “anticipate”, “believe”, “predict”, “potential” or “continue”, or the negatives of these terms or variations of them or similar terminology. Such forward-looking statements are subject to risks, uncertainties, and other factors which could cause actual results to differ materially from those expressed or implied by such forward looking statements. These forward-looking statements are based upon estimates and assumptions that, while considered reasonable by the Company and its management, are inherently uncertain. Factors that may cause actual results to differ materially from current expectations, including, but not limited to, various factors beyond management's control adversely affecting discretionary spending, membership count and facility usage and other risks, uncertainties and factors set forth in the sections entitled “Risk Factors” and “Cautionary Statement Regarding Forward-Looking Statements” in the Company's Annual Report on Form 10-K for the fiscal year ended December 30, 2014 and in its Quarterly Report on Form 10-Q for the period ended July 16, 2015. Nothing in this presentation should be regarded as a representation by any person that the forward-looking statements set forth herein will be achieved or that any of the contemplated results of such forward-looking statements will be achieved. You should not place undue reliance on forward-looking statements, which speak only as of the date they are made. The Company undertakes no duty to update these forward-looking statements. Non-GAAP Financial Measures In our presentation, we may refer to certain non-GAAP financial measures. To the extent we disclose non-GAAP financial measures, please refer to footnotes where presented on each page of this presentation or to the appendix found at the end of this presentation for a reconciliation of these measures to what we believe are the most directly comparable GAAP measures. The Company has not reconciled Adjusted EBITDA guidance in this presentation to the most directly comparable GAAP measure because this cannot be done without unreasonable effort.
3 BUSINESS OVERVIEW Eric Affeldt, President and CEO
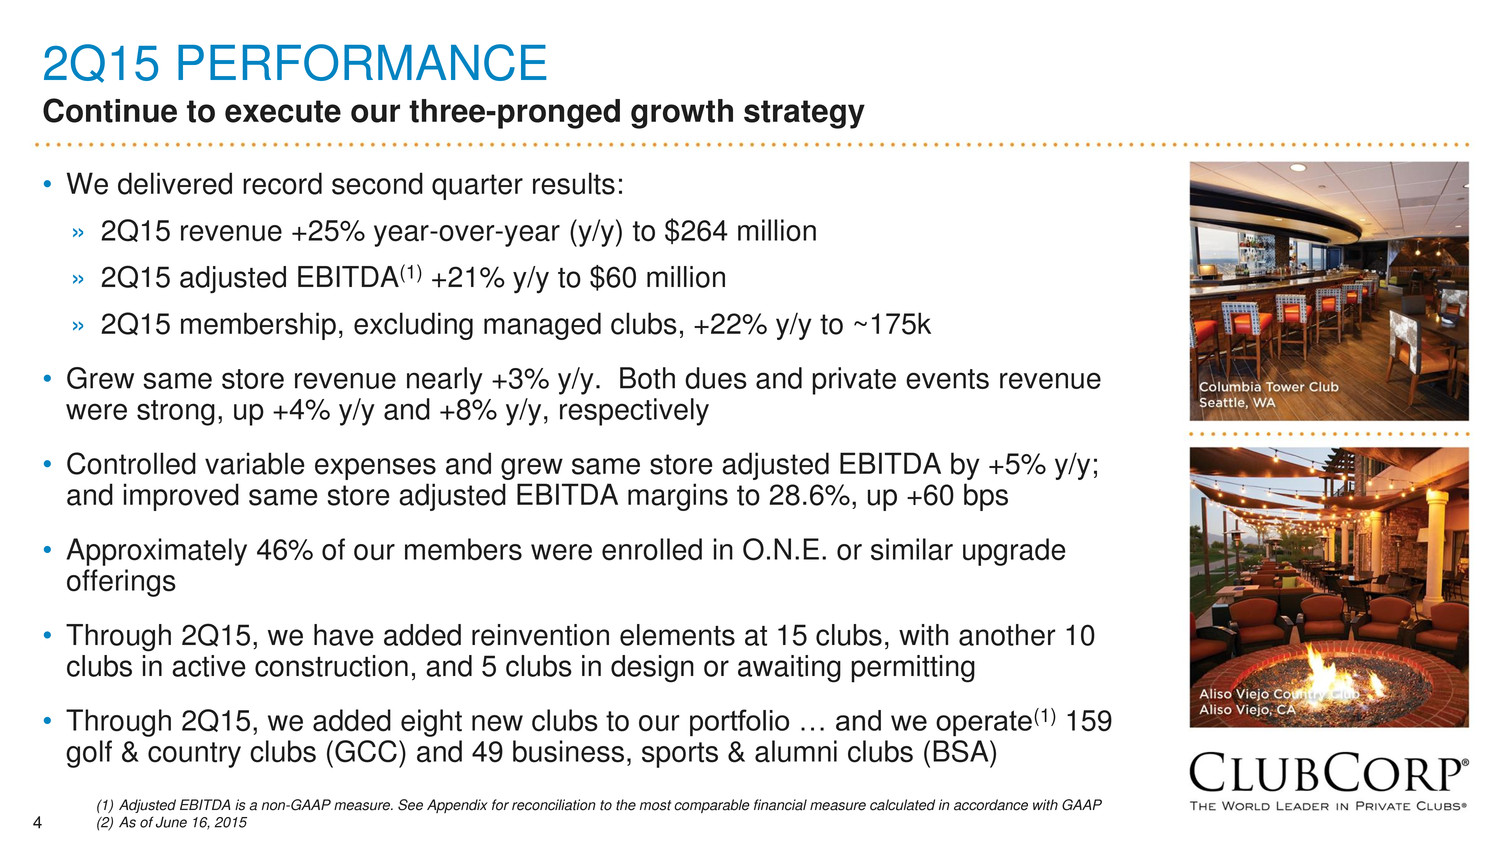
4 2Q15 PERFORMANCE Continue to execute our three-pronged growth strategy • We delivered record second quarter results: » 2Q15 revenue +25% year-over-year (y/y) to $264 million » 2Q15 adjusted EBITDA(1) +21% y/y to $60 million » 2Q15 membership, excluding managed clubs, +22% y/y to ~175k • Grew same store revenue nearly +3% y/y. Both dues and private events revenue were strong, up +4% y/y and +8% y/y, respectively • Controlled variable expenses and grew same store adjusted EBITDA by +5% y/y; and improved same store adjusted EBITDA margins to 28.6%, up +60 bps • Approximately 46% of our members were enrolled in O.N.E. or similar upgrade offerings • Through 2Q15, we have added reinvention elements at 15 clubs, with another 10 clubs in active construction, and 5 clubs in design or awaiting permitting • Through 2Q15, we added eight new clubs to our portfolio … and we operate(1) 159 golf & country clubs (GCC) and 49 business, sports & alumni clubs (BSA) (1) Adjusted EBITDA is a non-GAAP measure. See Appendix for reconciliation to the most comparable financial measure calculated in accordance with GAAP (2) As of June 16, 2015
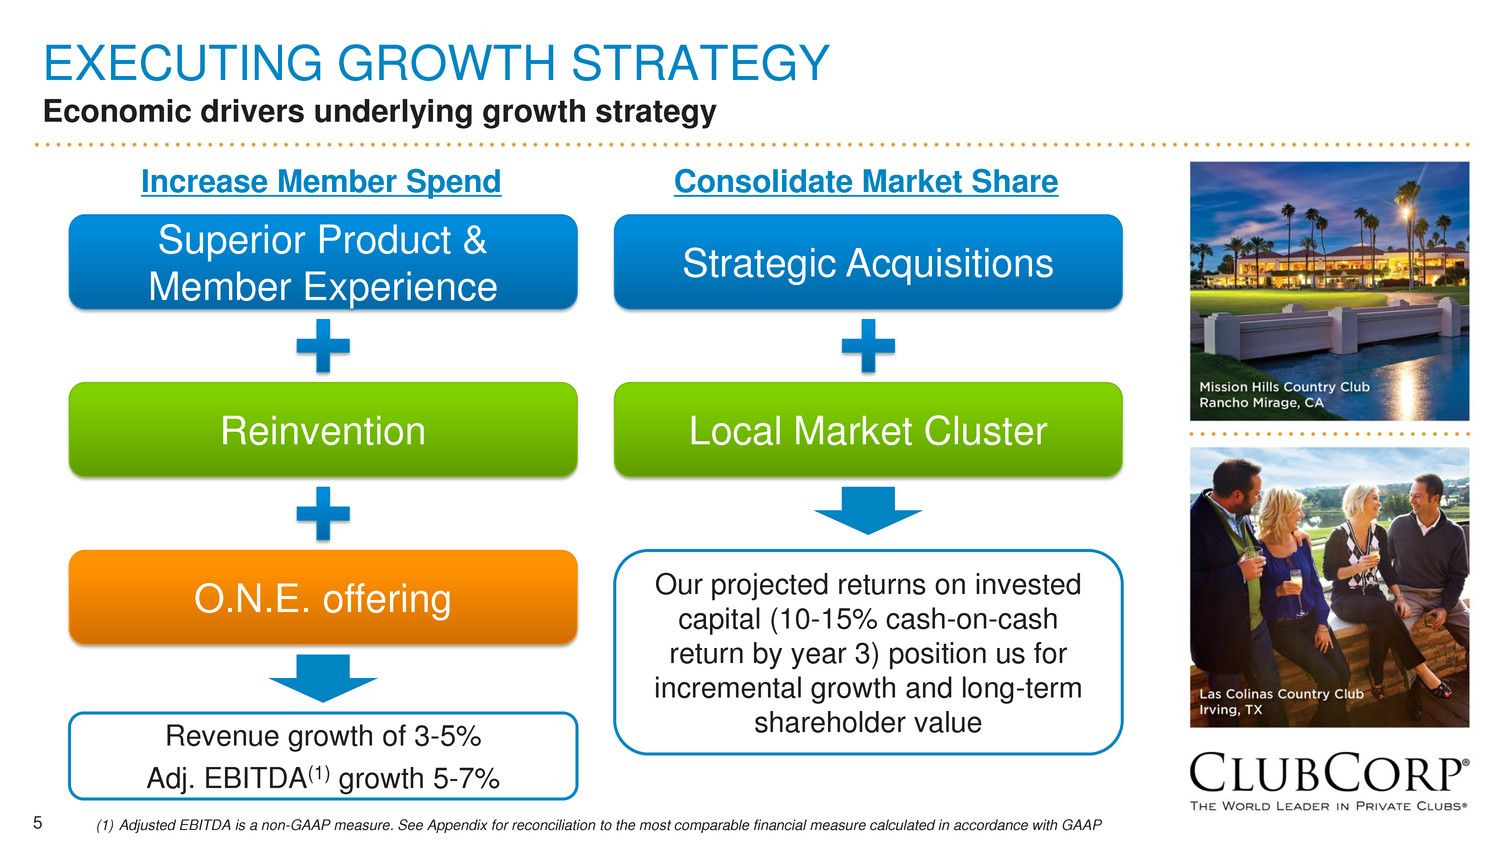
5 EXECUTING GROWTH STRATEGY Economic drivers underlying growth strategy Our projected returns on invested capital (10-15% cash-on-cash return by year 3) position us for incremental growth and long-term shareholder value Superior Product & Member Experience Reinvention O.N.E. offering Increase Member Spend Strategic Acquisitions Local Market Cluster Consolidate Market Share Revenue growth of 3-5% Adj. EBITDA(1) growth 5-7% (1) Adjusted EBITDA is a non-GAAP measure. See Appendix for reconciliation to the most comparable financial measure calculated in accordance with GAAP
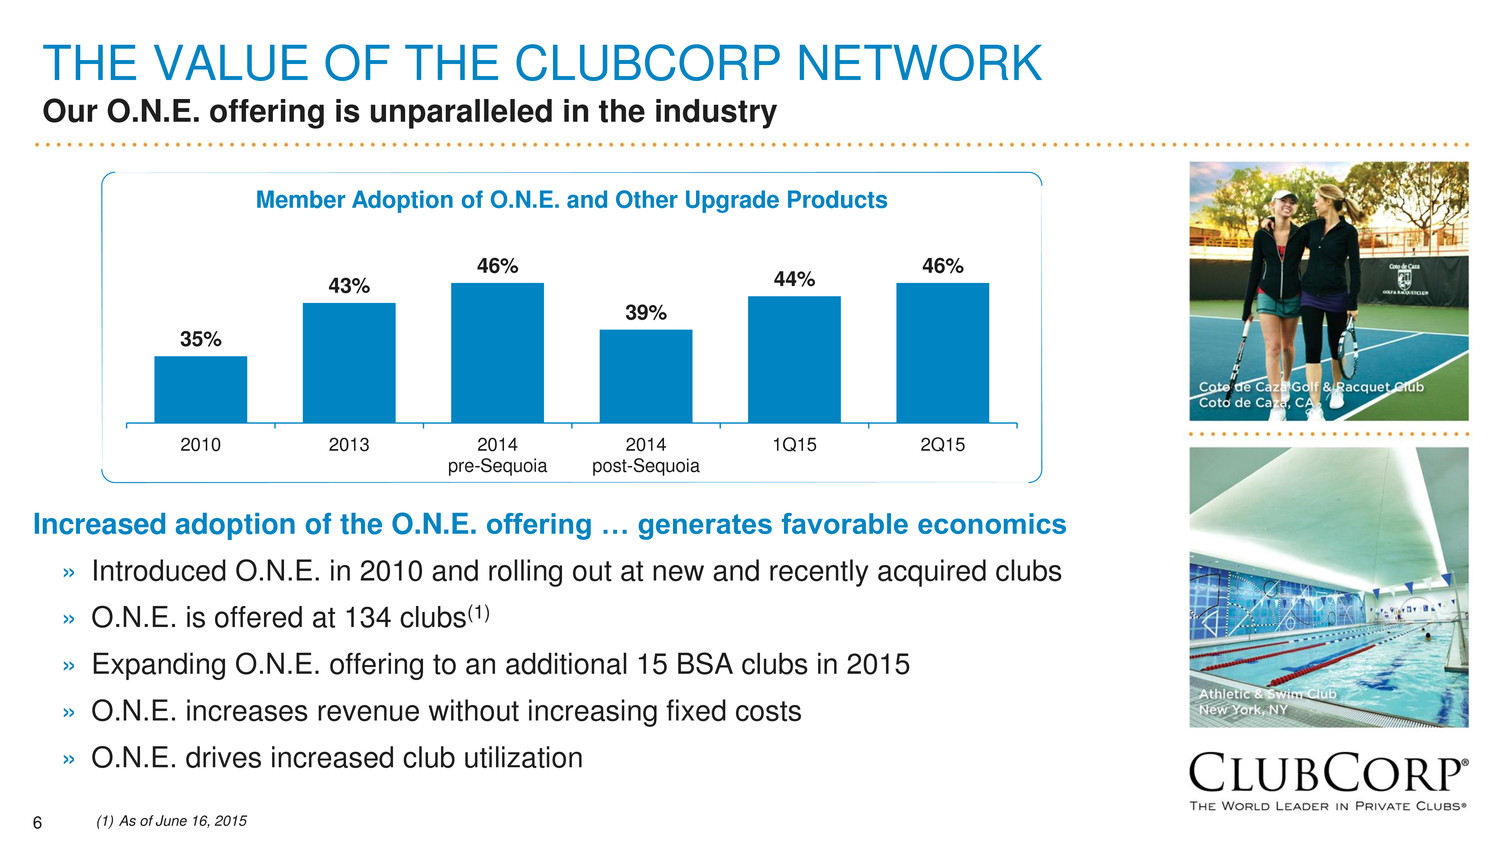
6 THE VALUE OF THE CLUBCORP NETWORK Our O.N.E. offering is unparalleled in the industry Increased adoption of the O.N.E. offering … generates favorable economics » Introduced O.N.E. in 2010 and rolling out at new and recently acquired clubs » O.N.E. is offered at 134 clubs(1) » Expanding O.N.E. offering to an additional 15 BSA clubs in 2015 » O.N.E. increases revenue without increasing fixed costs » O.N.E. drives increased club utilization 35% 43% 46% 39% 44% 46% 2010 2013 2014 pre-Sequoia 2014 post-Sequoia 1Q15 2Q15 (1) As of June 16, 2015 Member Adoption of O.N.E. and Other Upgrade Products

7 2015 REINVENTIONS Lionsgate Country Club • Reinvention of member dining spaces to include a new bar, wine wall display and communal table • Added “Anytime Lounge” and media wall • Expanded exterior patio with fire pits and soft seating
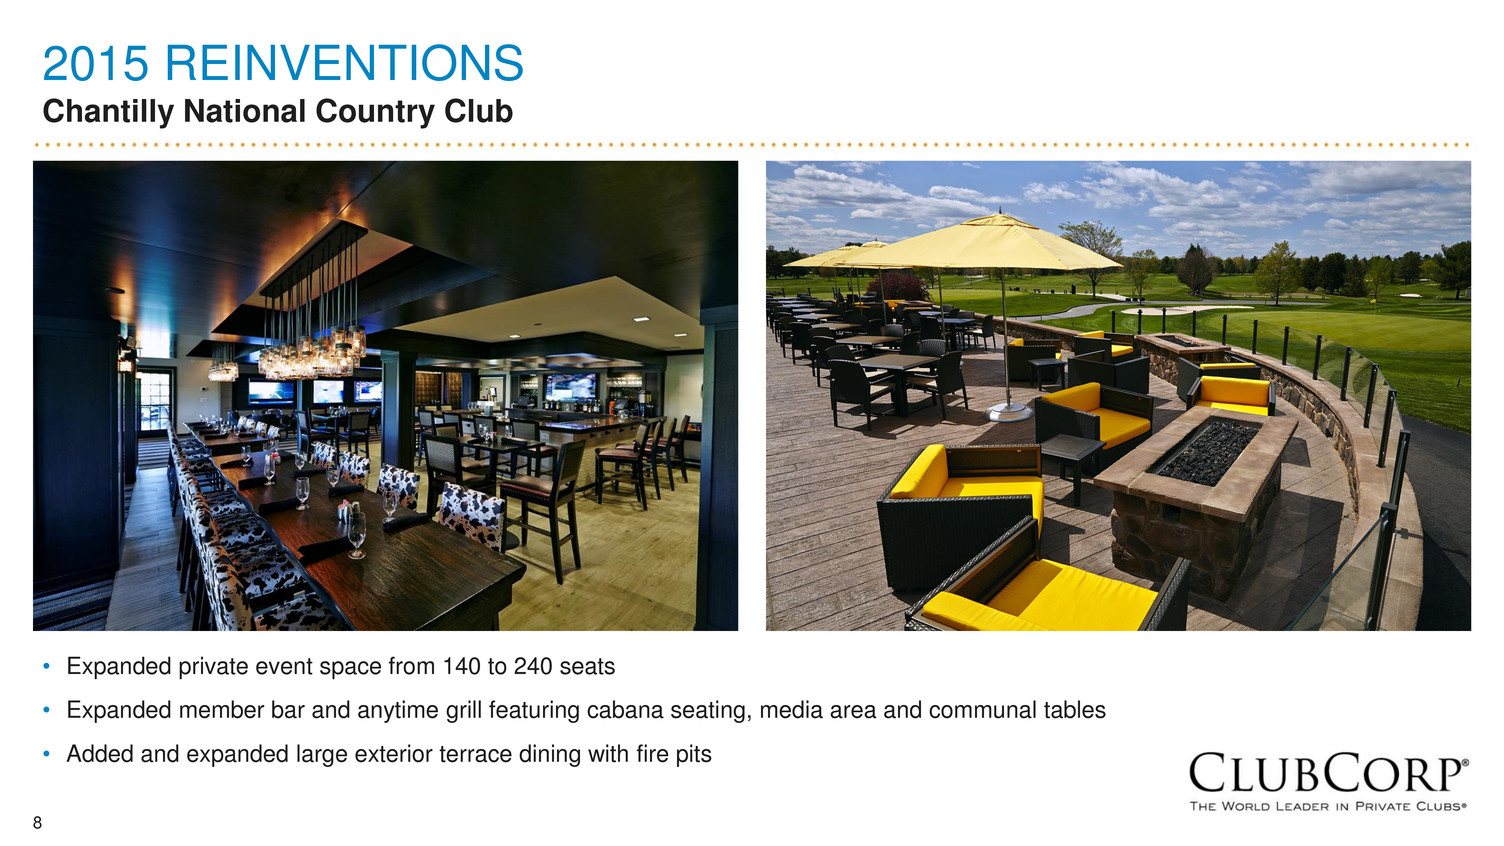
8 2015 REINVENTIONS Chantilly National Country Club • Expanded private event space from 140 to 240 seats • Expanded member bar and anytime grill featuring cabana seating, media area and communal tables • Added and expanded large exterior terrace dining with fire pits
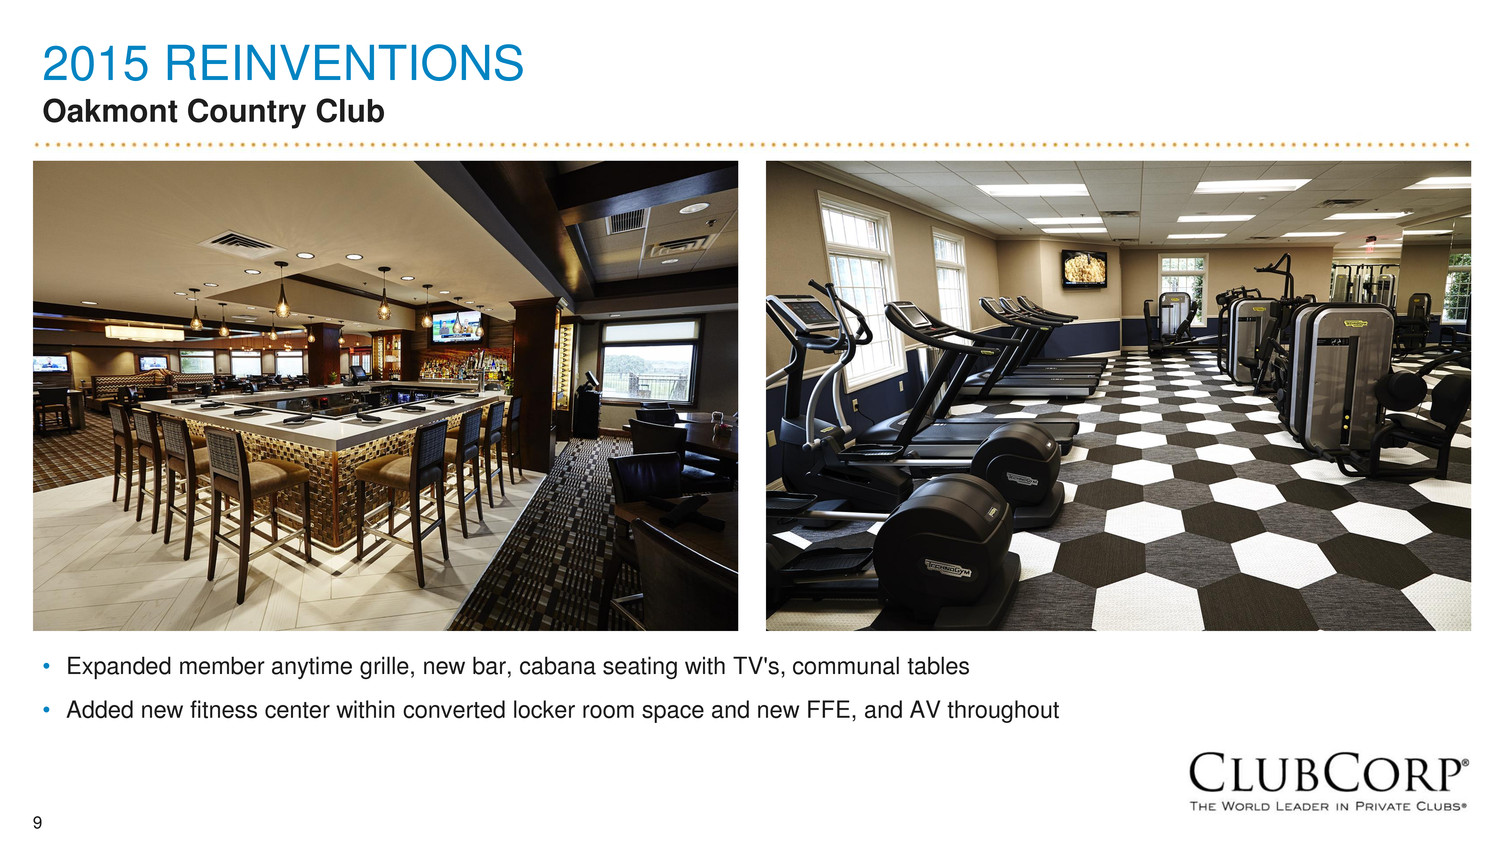
9 2015 REINVENTIONS Oakmont Country Club • Expanded member anytime grille, new bar, cabana seating with TV's, communal tables • Added new fitness center within converted locker room space and new FFE, and AV throughout
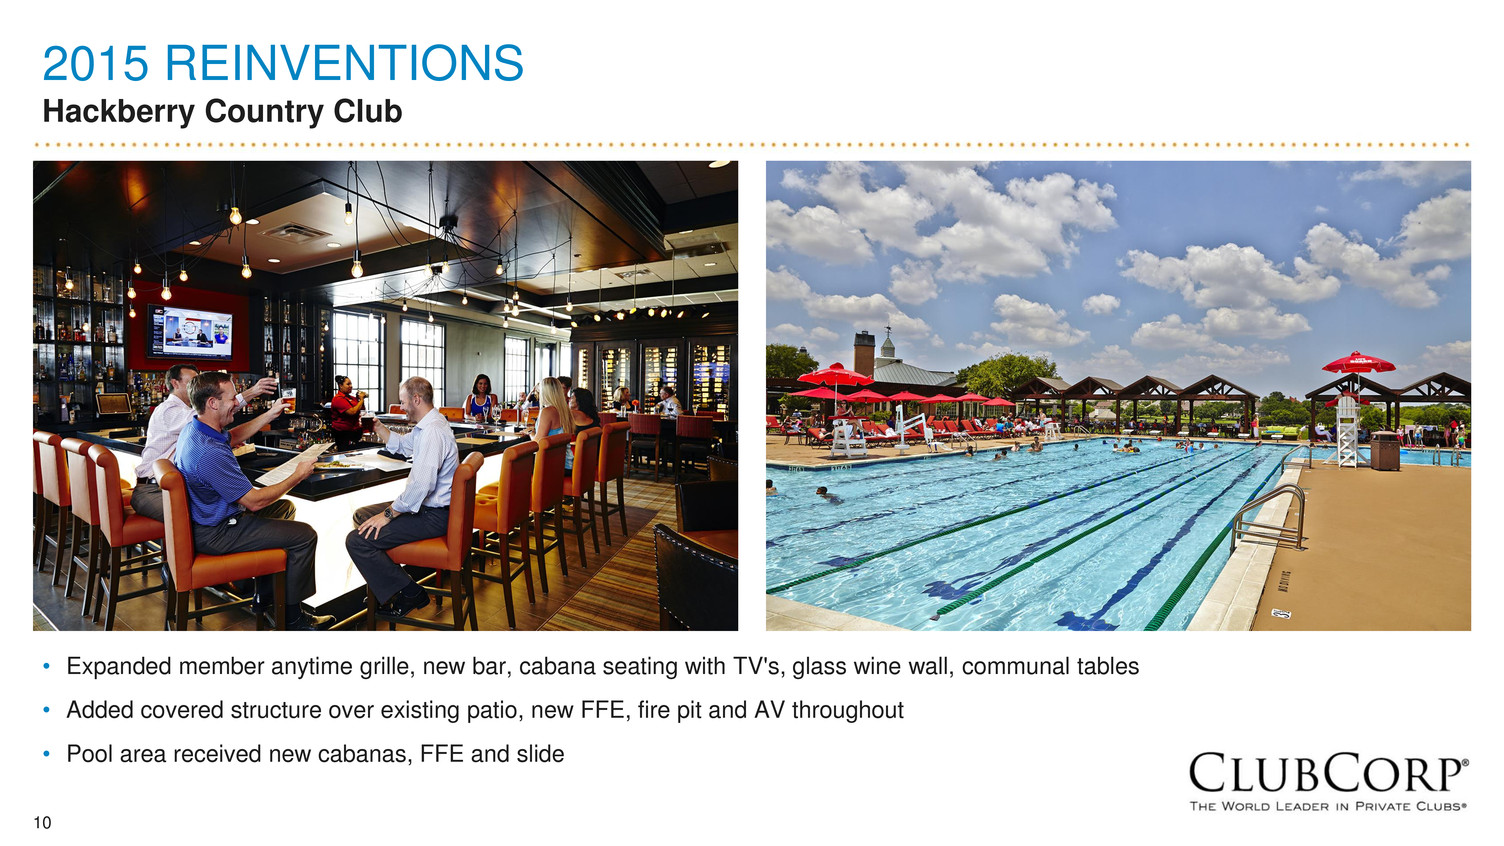
10 2015 REINVENTIONS Hackberry Country Club • Expanded member anytime grille, new bar, cabana seating with TV's, glass wine wall, communal tables • Added covered structure over existing patio, new FFE, fire pit and AV throughout • Pool area received new cabanas, FFE and slide
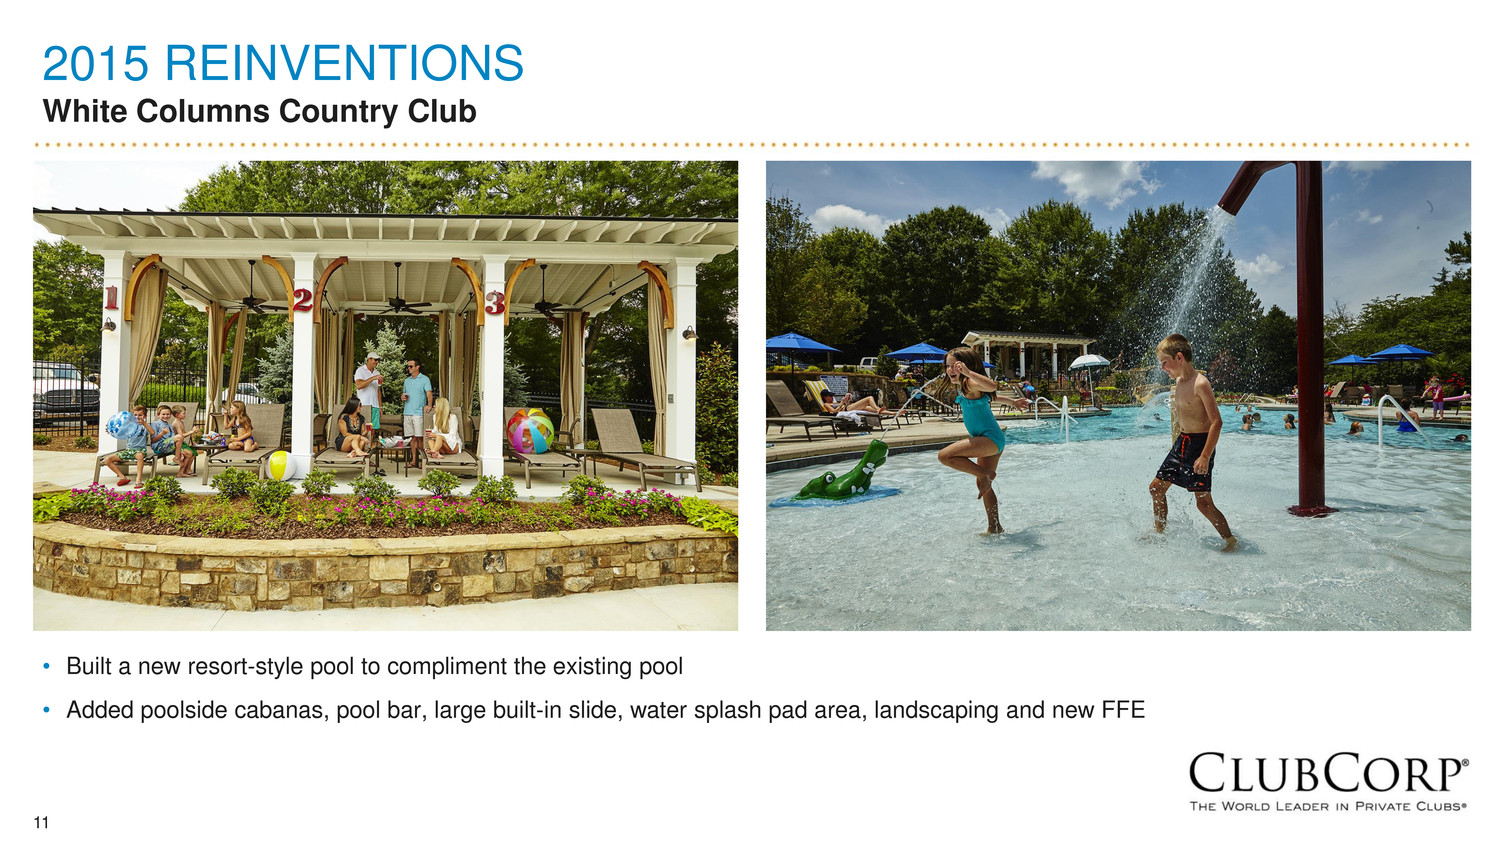
11 2015 REINVENTIONS White Columns Country Club • Built a new resort-style pool to compliment the existing pool • Added poolside cabanas, pool bar, large built-in slide, water splash pad area, landscaping and new FFE
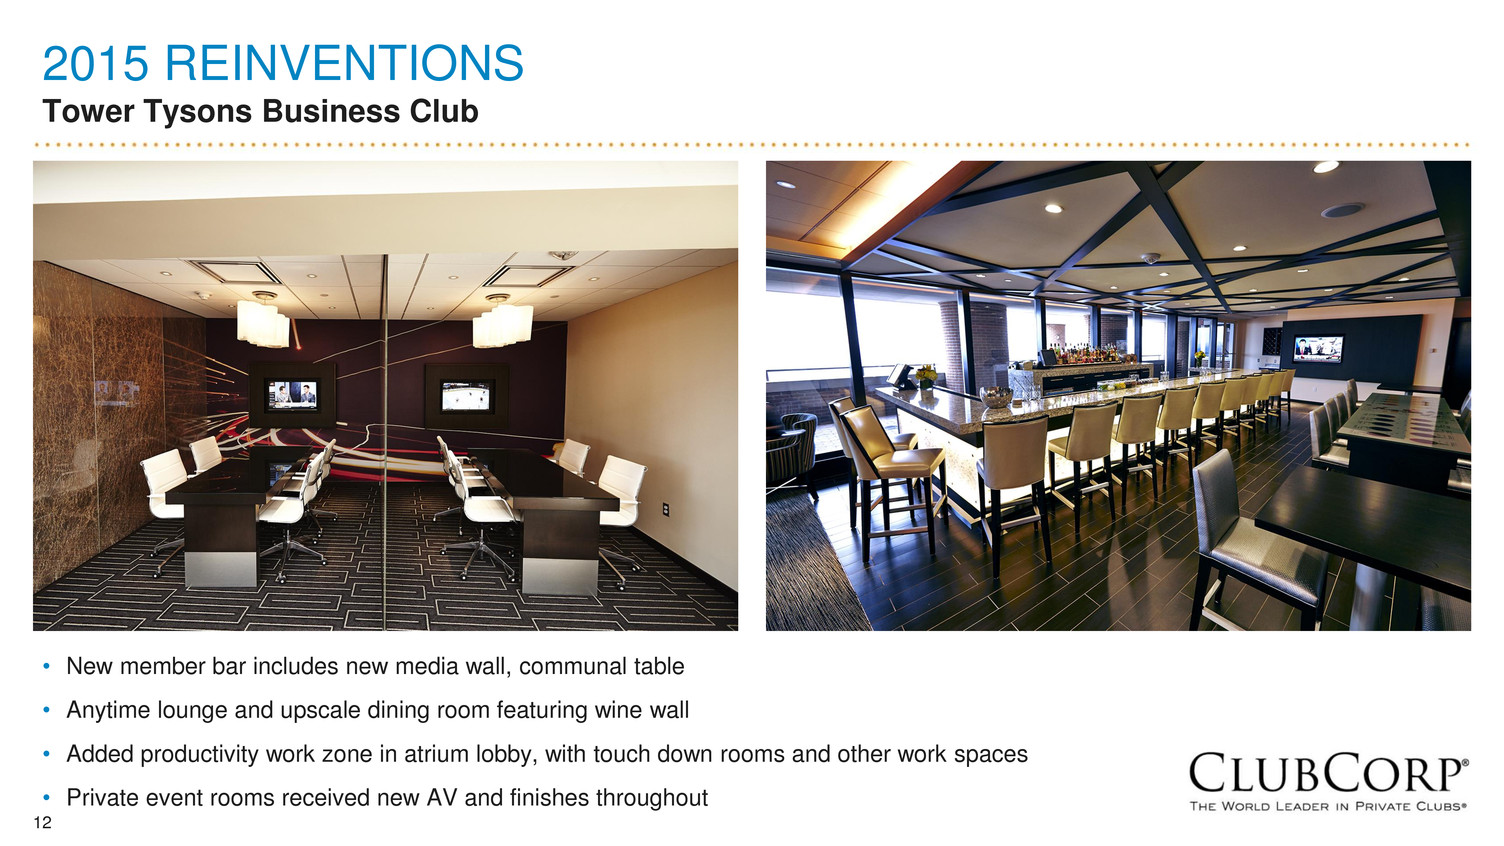
12 2015 REINVENTIONS Tower Tysons Business Club • New member bar includes new media wall, communal table • Anytime lounge and upscale dining room featuring wine wall • Added productivity work zone in atrium lobby, with touch down rooms and other work spaces • Private event rooms received new AV and finishes throughout
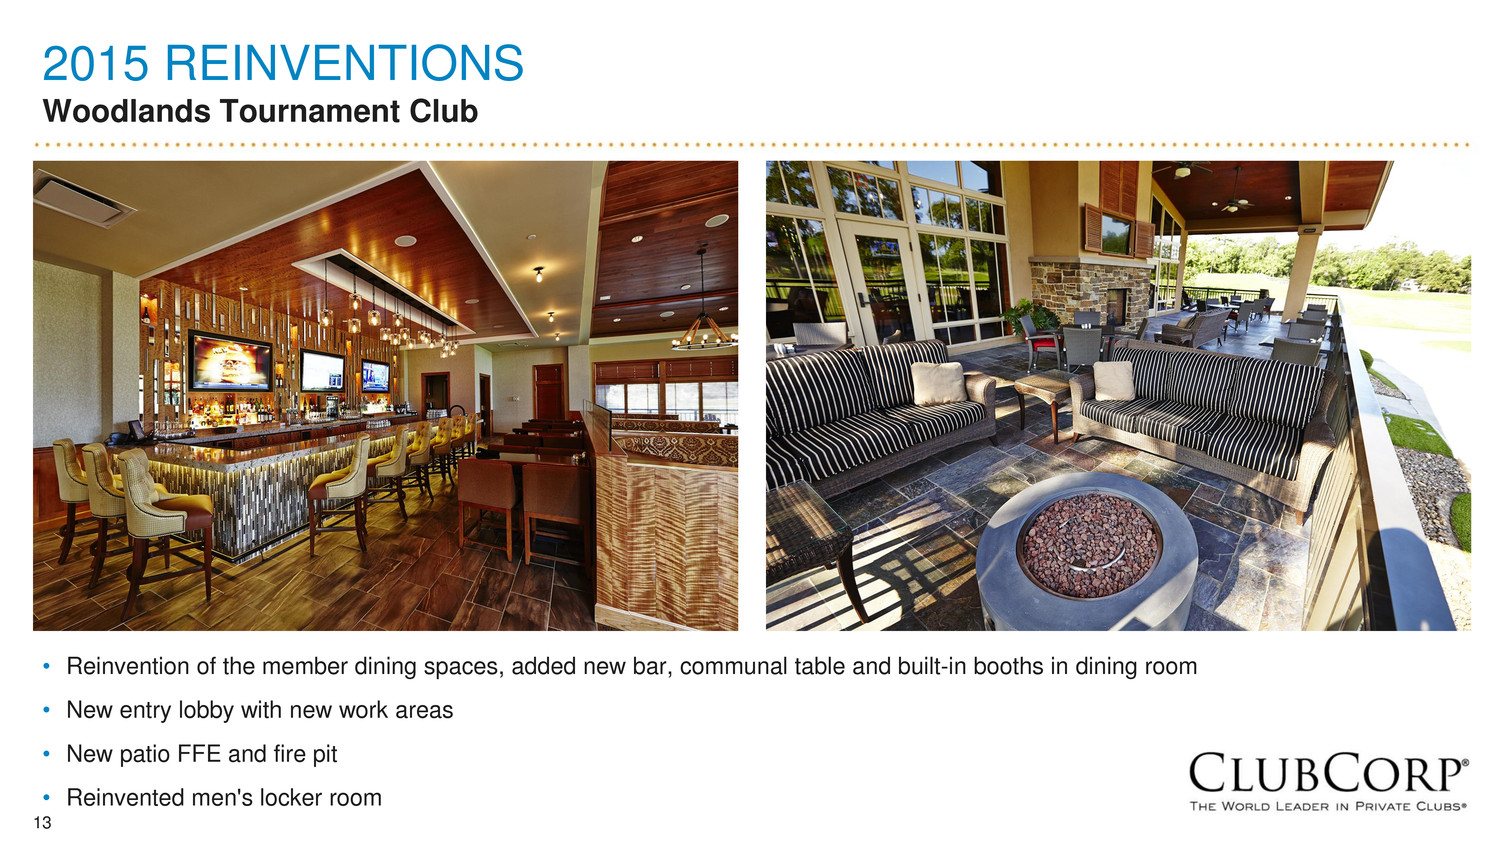
13 2015 REINVENTIONS Woodlands Tournament Club • Reinvention of the member dining spaces, added new bar, communal table and built-in booths in dining room • New entry lobby with new work areas • New patio FFE and fire pit • Reinvented men's locker room
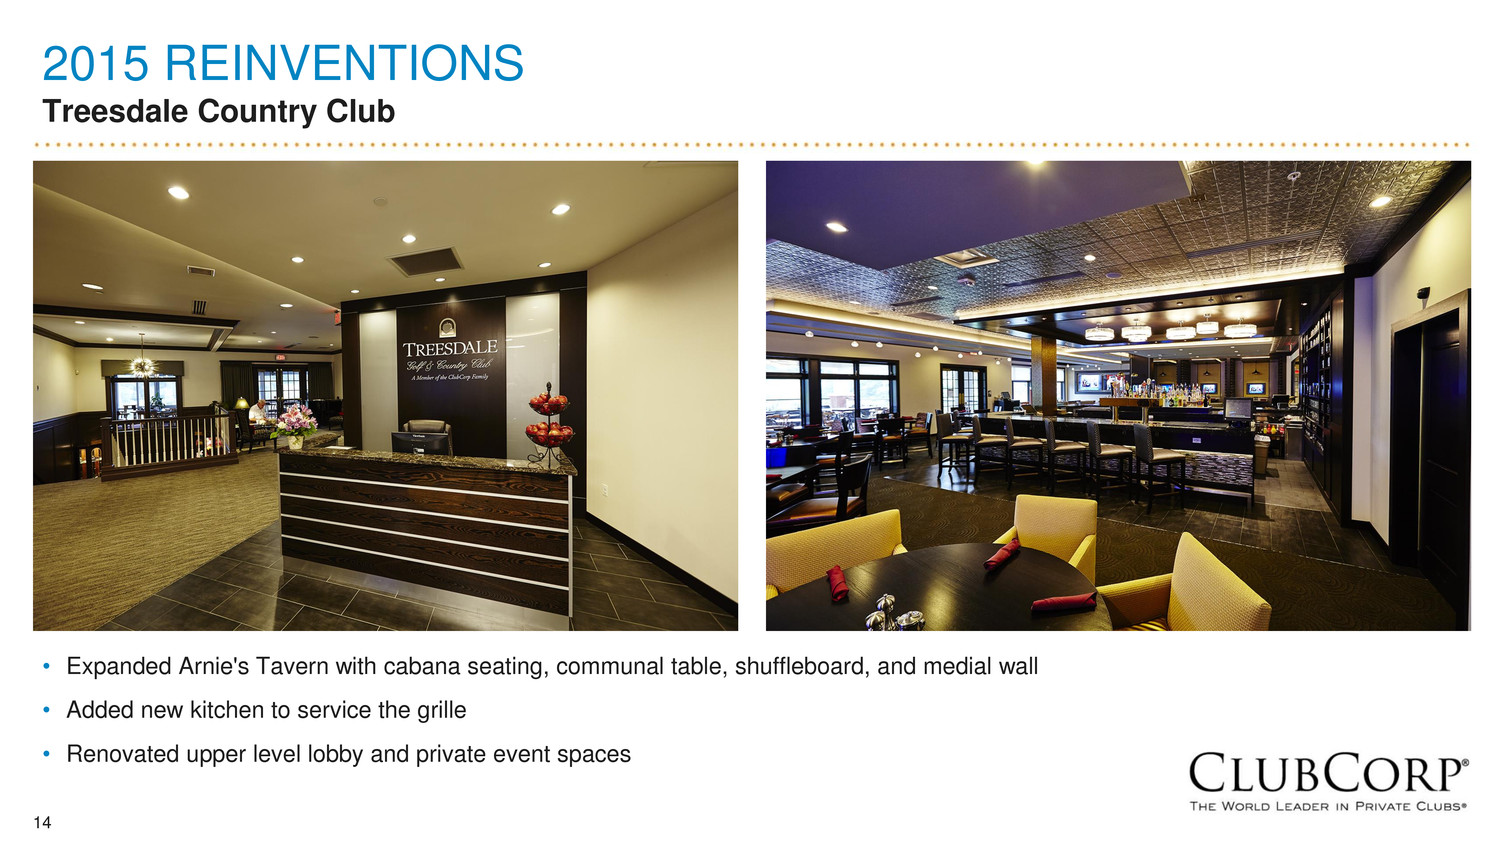
14 2015 REINVENTIONS Treesdale Country Club • Expanded Arnie's Tavern with cabana seating, communal table, shuffleboard, and medial wall • Added new kitchen to service the grille • Renovated upper level lobby and private event spaces
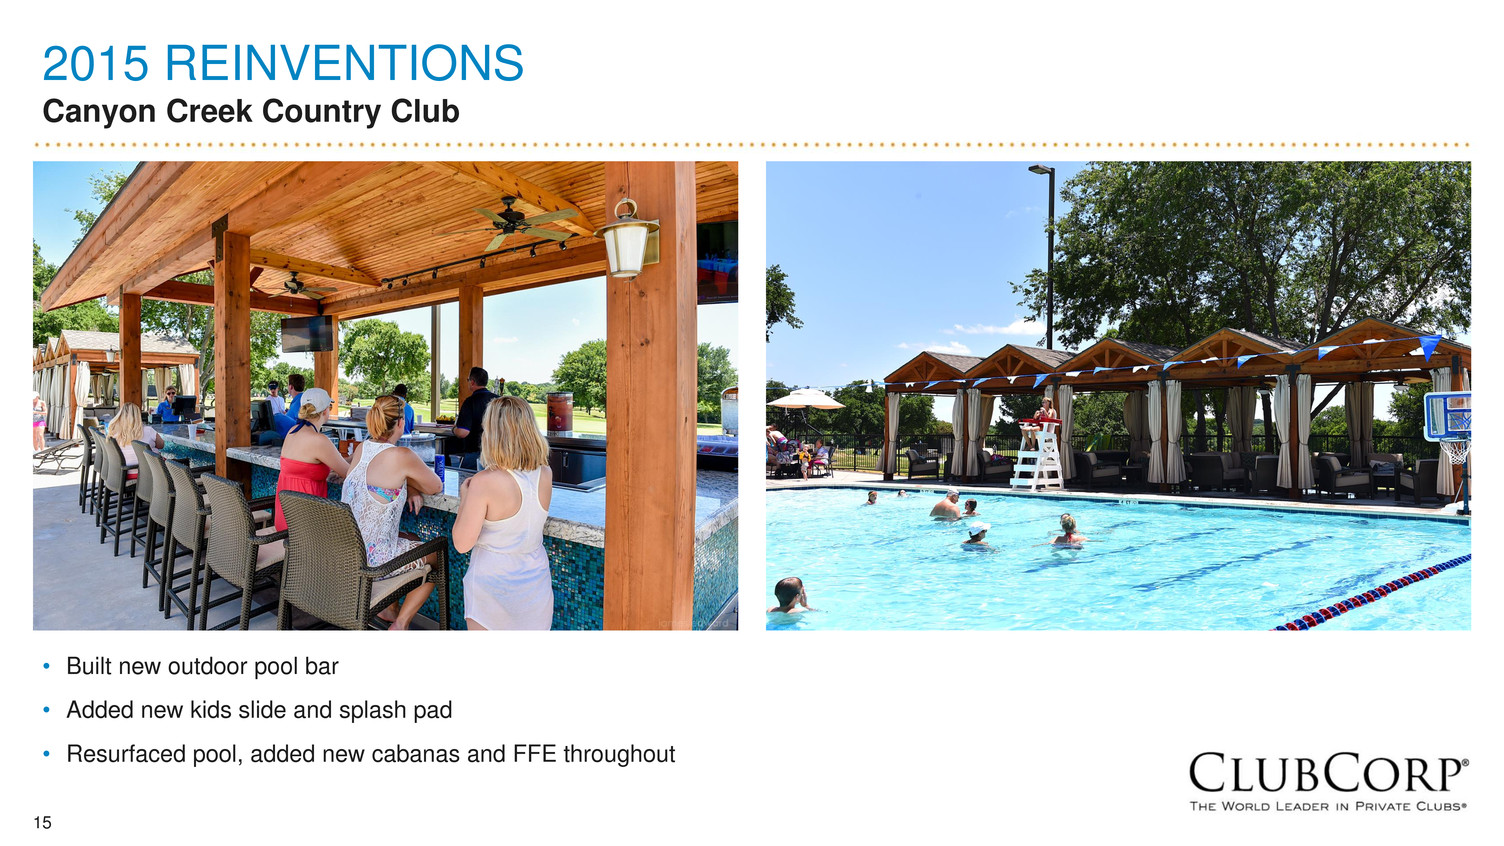
15 2015 REINVENTIONS Canyon Creek Country Club • Built new outdoor pool bar • Added new kids slide and splash pad • Resurfaced pool, added new cabanas and FFE throughout
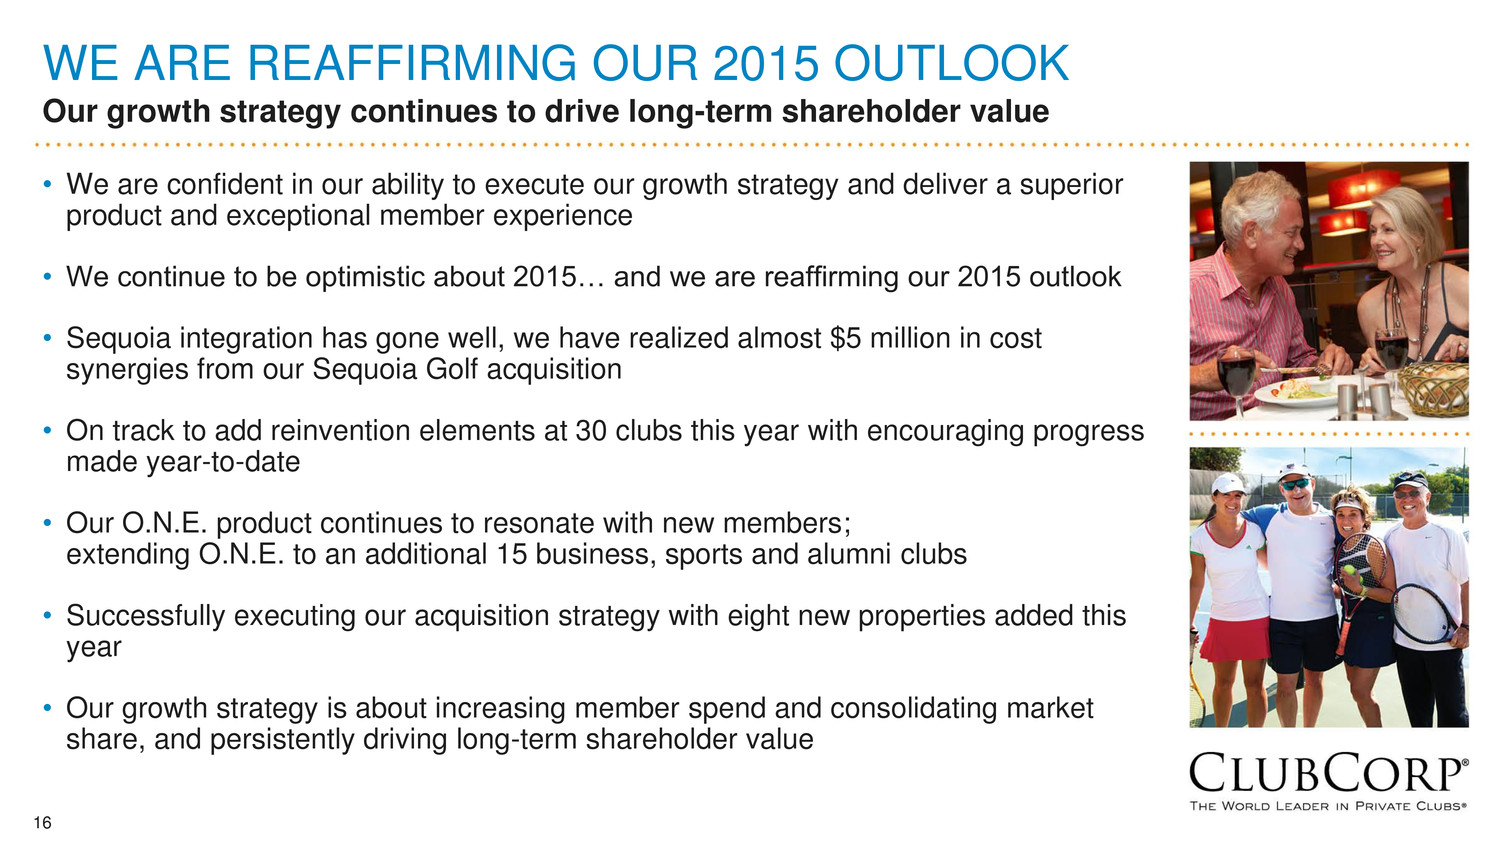
16 WE ARE REAFFIRMING OUR 2015 OUTLOOK Our growth strategy continues to drive long-term shareholder value • We are confident in our ability to execute our growth strategy and deliver a superior product and exceptional member experience • We continue to be optimistic about 2015… and we are reaffirming our 2015 outlook • Sequoia integration has gone well, we have realized almost $5 million in cost synergies from our Sequoia Golf acquisition • On track to add reinvention elements at 30 clubs this year with encouraging progress made year-to-date • Our O.N.E. product continues to resonate with new members; extending O.N.E. to an additional 15 business, sports and alumni clubs • Successfully executing our acquisition strategy with eight new properties added this year • Our growth strategy is about increasing member spend and consolidating market share, and persistently driving long-term shareholder value
17 FINANCIAL OVERVIEW Curt McClellan, CFO
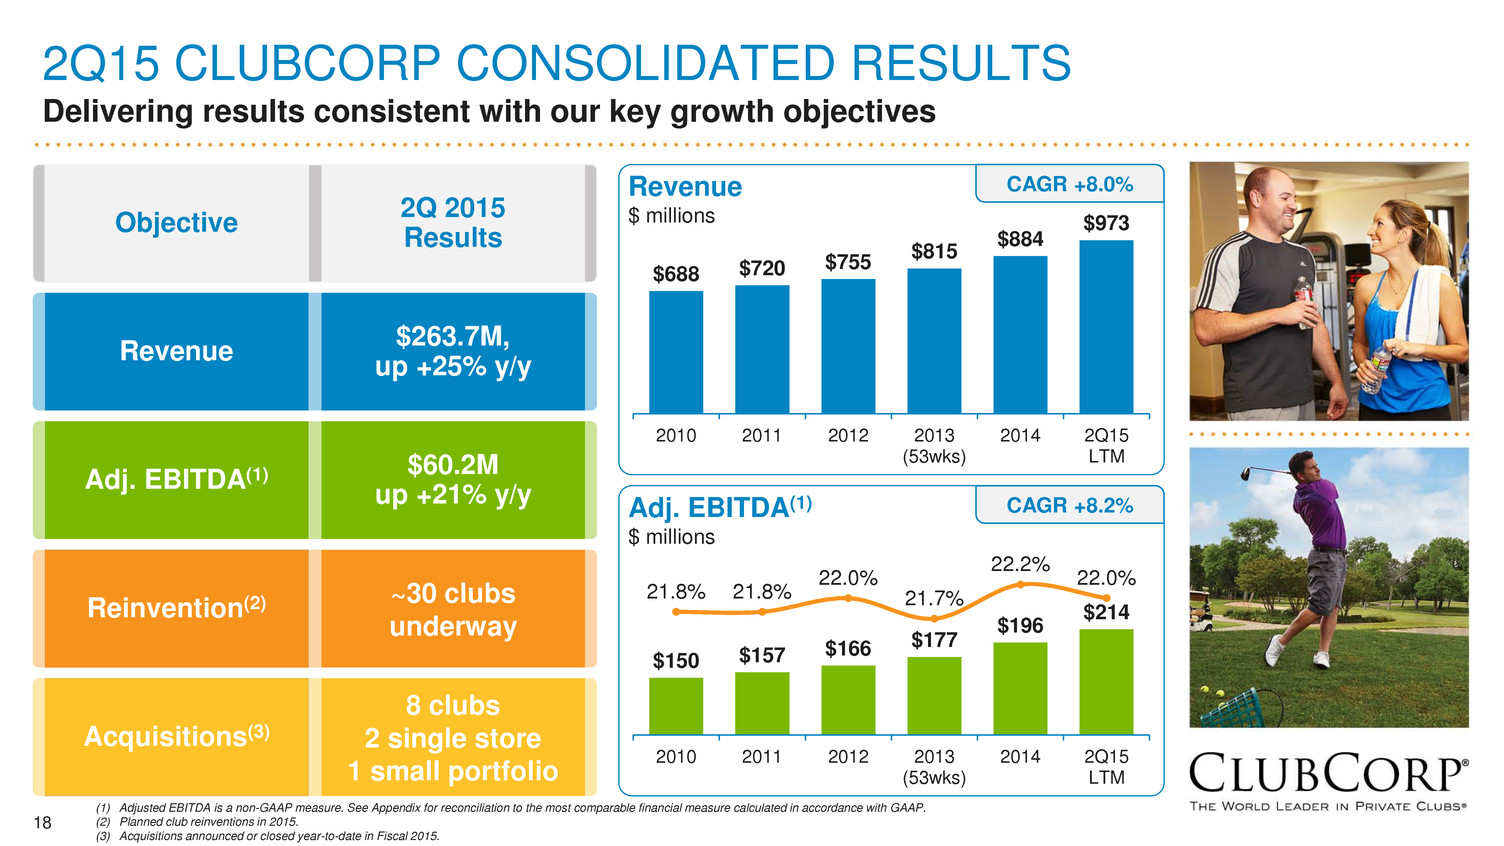
18 2Q15 CLUBCORP CONSOLIDATED RESULTS Delivering results consistent with our key growth objectives $688 $720 $755 $815 $884 $973 2010 2011 2012 2013 (53wks) 2014 2Q15 LTM $150 $157 $166 $177 $196 $214 21.8% 21.8% 22.0% 21.7% 22.2% 22.0% 2010 2011 2012 2013 (53wks) 2014 2Q15 LTM Adj. EBITDA(1) $60.2M up +21% y/y Reinvention(2) ~30 clubs underway Revenue $263.7M, up +25% y/y Objective 2Q 2015 Results Acquisitions(3) 8 clubs 2 single store 1 small portfolio (1) Adjusted EBITDA is a non-GAAP measure. See Appendix for reconciliation to the most comparable financial measure calculated in accordance with GAAP. (2) Planned club reinventions in 2015. (3) Acquisitions announced or closed year-to-date in Fiscal 2015. Revenue $ millions CAGR +8.0% Adj. EBITDA(1) $ millions CAGR +8.2%
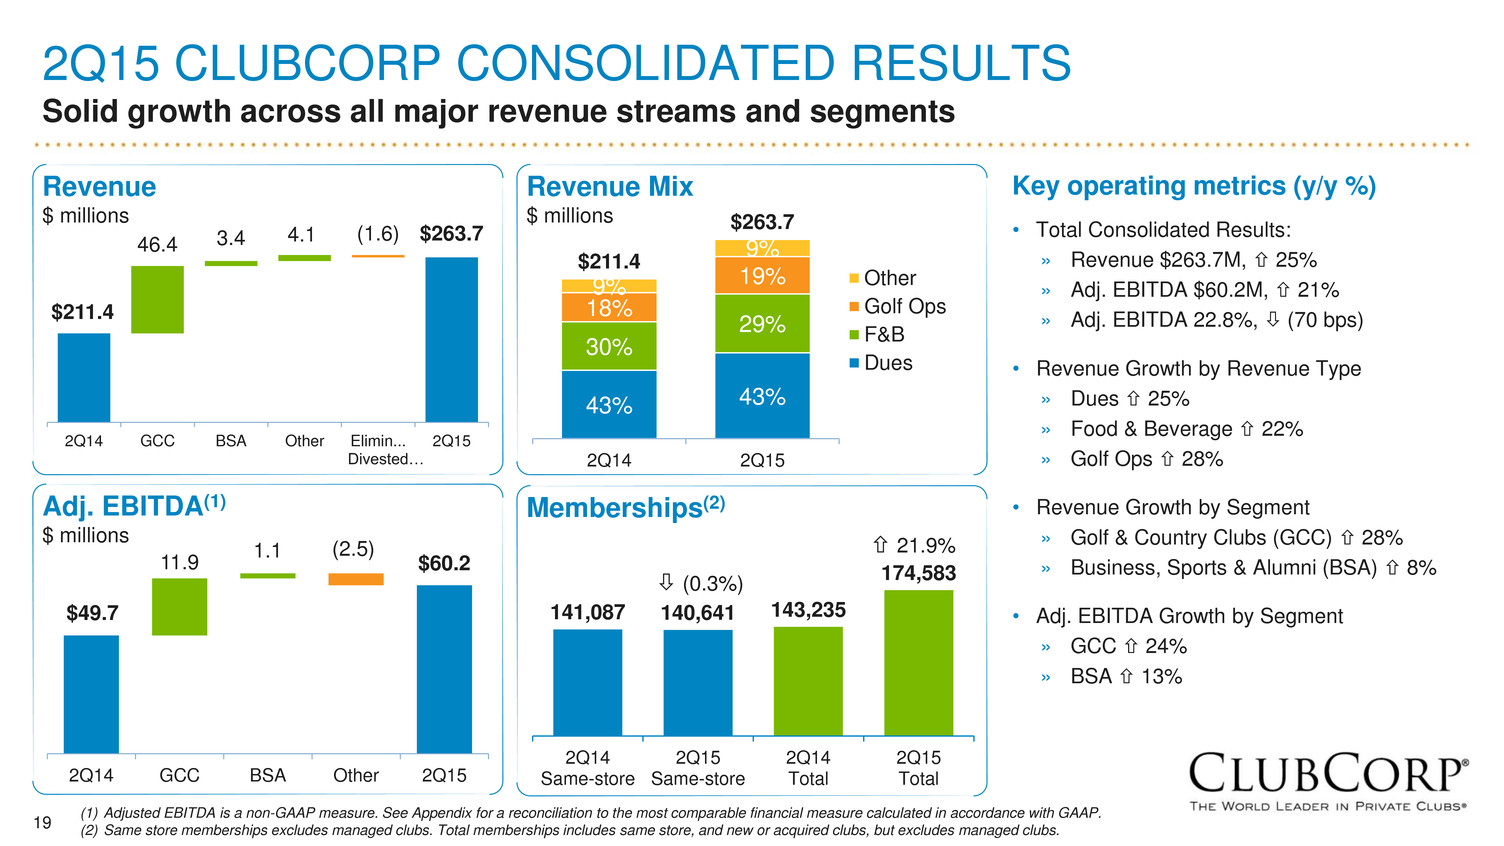
19 2Q15 CLUBCORP CONSOLIDATED RESULTS Solid growth across all major revenue streams and segments Key operating metrics (y/y %) • Total Consolidated Results: » Revenue $263.7M, 25% » Adj. EBITDA $60.2M, 21% » Adj. EBITDA 22.8%, (70 bps) • Revenue Growth by Revenue Type » Dues 25% » Food & Beverage 22% » Golf Ops 28% • Revenue Growth by Segment » Golf & Country Clubs (GCC) 28% » Business, Sports & Alumni (BSA) 8% • Adj. EBITDA Growth by Segment » GCC 24% » BSA 13% $211.4 $263.7 46.4 3.4 4.1 (1.6) 2Q14 GCC BSA Other Elimin... Divested… 2Q15 Revenue $ millions $49.7 $60.2 11.9 1.1 (2.5) 2Q14 GCC BSA Other 2Q15 Adj. EBITDA(1) $ millions 141,087 140,641 143,235 174,583 2Q14 Same-store 2Q15 Same-store 2Q14 Total 2Q15 Total Memberships(2) (0.3%) 21.9% 43% 43% 30% 29% 18% 19%9% 9% $211.4 $263.7 2Q14 2Q15 Other Golf Ops F&B Dues Revenue Mix $ millions (1) Adjusted EBITDA is a non-GAAP measure. See Appendix for a reconciliation to the most comparable financial measure calculated in accordance with GAAP. (2) Same store memberships excludes managed clubs. Total memberships includes same store, and new or acquired clubs, but excludes managed clubs.
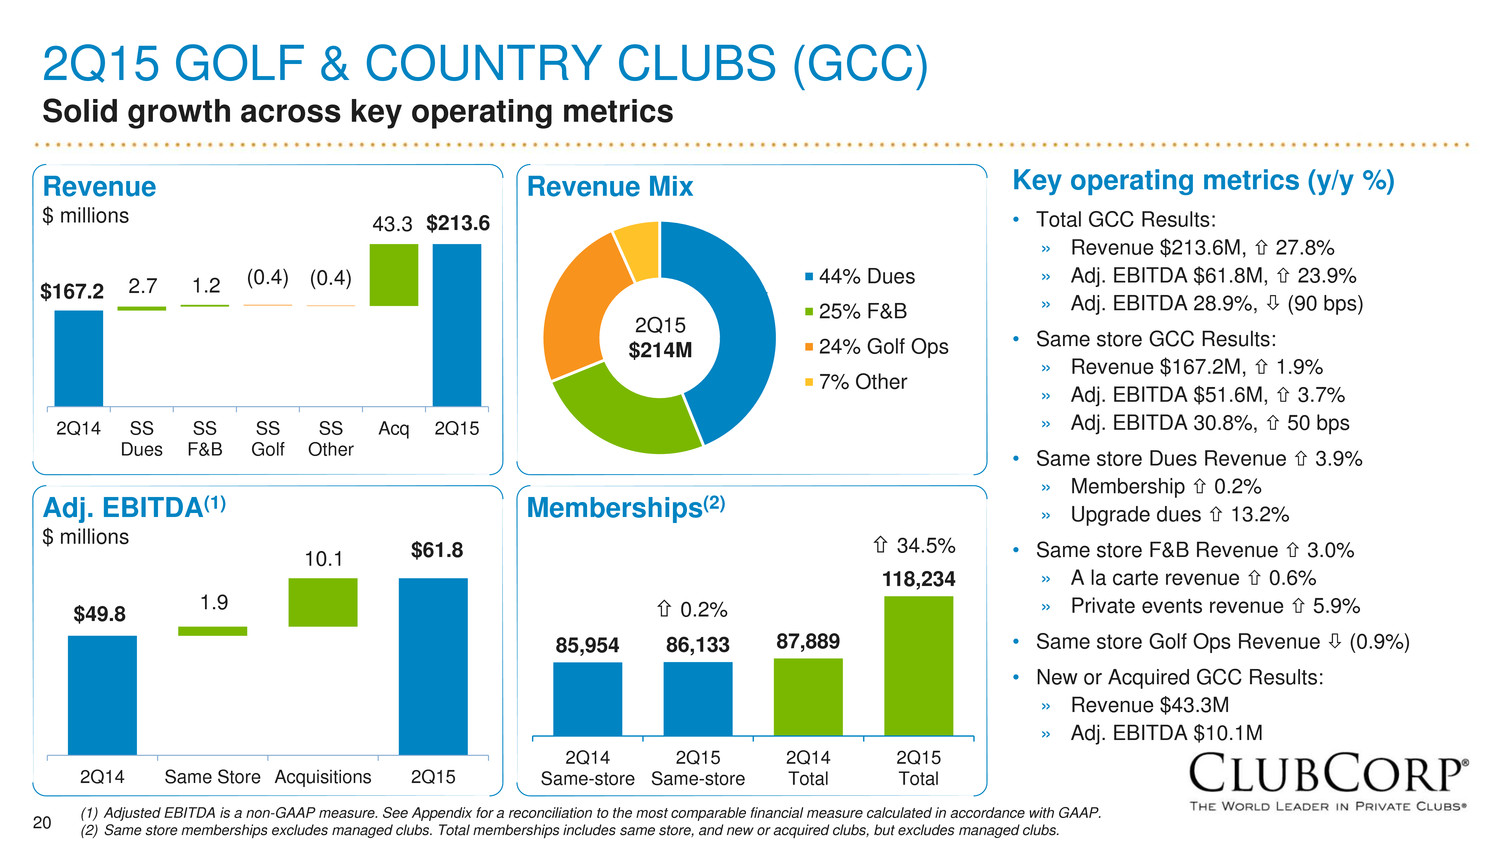
20 2Q15 GOLF & COUNTRY CLUBS (GCC) Solid growth across key operating metrics 85,954 86,133 87,889 118,234 2Q14 Same-store 2Q15 Same-store 2Q14 Total 2Q15 Total Key operating metrics (y/y %) • Total GCC Results: » Revenue $213.6M, 27.8% » Adj. EBITDA $61.8M, 23.9% » Adj. EBITDA 28.9%, (90 bps) • Same store GCC Results: » Revenue $167.2M, 1.9% » Adj. EBITDA $51.6M, 3.7% » Adj. EBITDA 30.8%, 50 bps • Same store Dues Revenue 3.9% » Membership 0.2% » Upgrade dues 13.2% • Same store F&B Revenue 3.0% » A la carte revenue 0.6% » Private events revenue 5.9% • Same store Golf Ops Revenue (0.9%) • New or Acquired GCC Results: » Revenue $43.3M » Adj. EBITDA $10.1M 44% Dues 25% F&B 24% Golf Ops 7% Other 2Q15 $214M Revenue Mix Memberships(2) 0.2% 34.5% (1) Adjusted EBITDA is a non-GAAP measure. See Appendix for a reconciliation to the most comparable financial measure calculated in accordance with GAAP. (2) Same store memberships excludes managed clubs. Total memberships includes same store, and new or acquired clubs, but excludes managed clubs. $167.2 $213.6 2.7 1.2 43.3 (0.4) (0.4) 2Q14 SS Dues SS F&B SS Golf SS Other Acq 2Q15 Revenue $ millions $49.8 $61.8 1.9 10.1 2Q14 Same Store Acquisitions 2Q15 Adj. EBITDA(1) $ millions
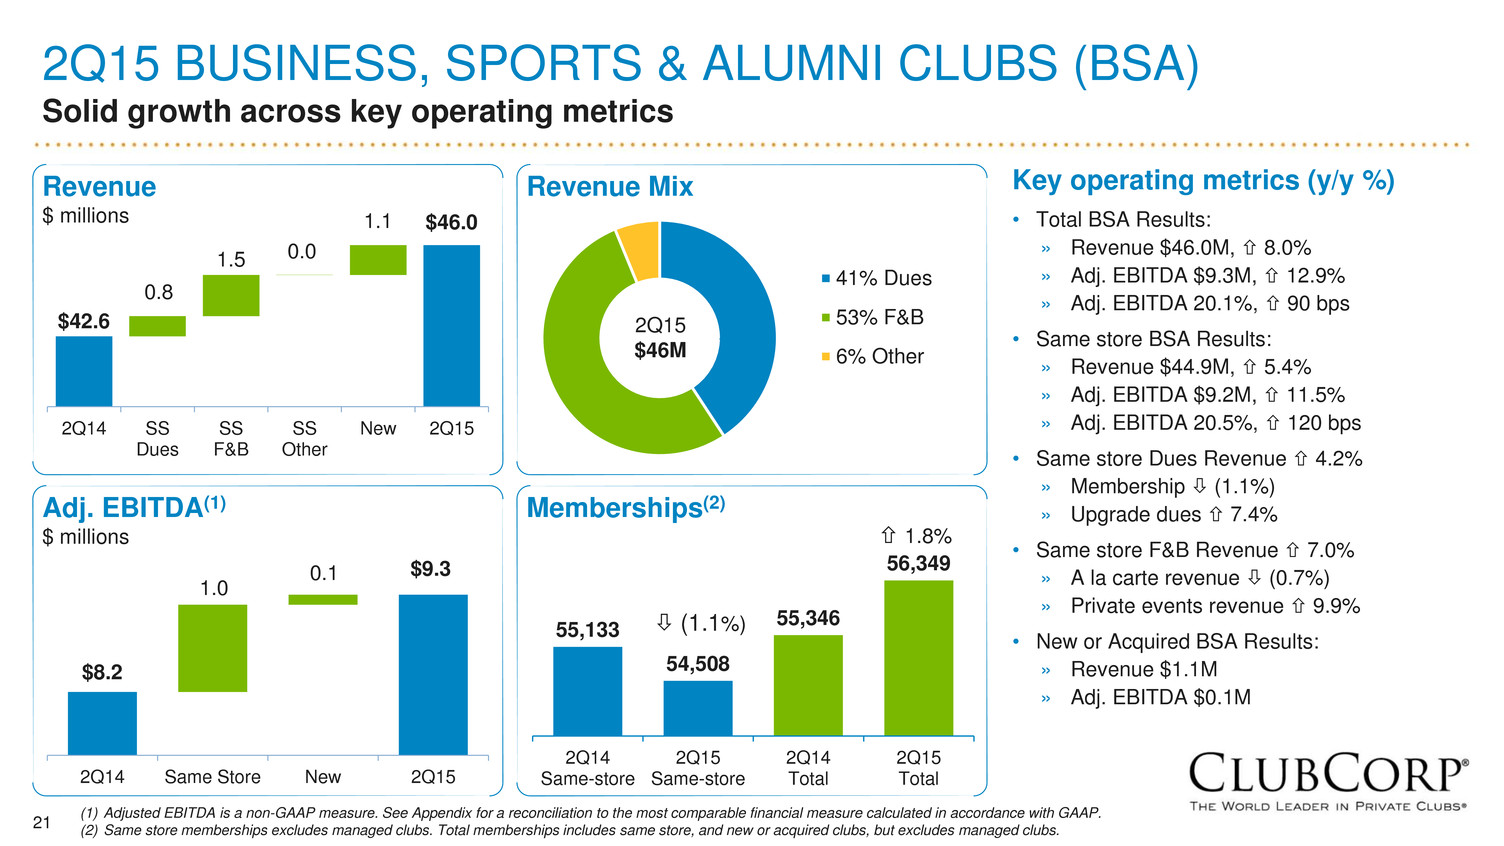
21 2Q15 BUSINESS, SPORTS & ALUMNI CLUBS (BSA) Solid growth across key operating metrics 55,133 54,508 55,346 56,349 2Q14 Same-store 2Q15 Same-store 2Q14 Total 2Q15 Total Key operating metrics (y/y %) • Total BSA Results: » Revenue $46.0M, 8.0% » Adj. EBITDA $9.3M, 12.9% » Adj. EBITDA 20.1%, 90 bps • Same store BSA Results: » Revenue $44.9M, 5.4% » Adj. EBITDA $9.2M, 11.5% » Adj. EBITDA 20.5%, 120 bps • Same store Dues Revenue 4.2% » Membership (1.1%) » Upgrade dues 7.4% • Same store F&B Revenue 7.0% » A la carte revenue (0.7%) » Private events revenue 9.9% • New or Acquired BSA Results: » Revenue $1.1M » Adj. EBITDA $0.1M 41% Dues 53% F&B 6% Other 2Q15 $46M Revenue Mix Memberships(2) (1.1%) 1.8% (1) Adjusted EBITDA is a non-GAAP measure. See Appendix for a reconciliation to the most comparable financial measure calculated in accordance with GAAP. (2) Same store memberships excludes managed clubs. Total memberships includes same store, and new or acquired clubs, but excludes managed clubs. $42.6 $46.0 0.8 1.5 0.0 1.1 2Q14 SS Dues SS F&B SS Other New 2Q15 Revenue $ millions $8.2 $9.3 1.0 0.1 2Q14 Same Store New 2Q15 Adj. EBITDA(1) $ millions
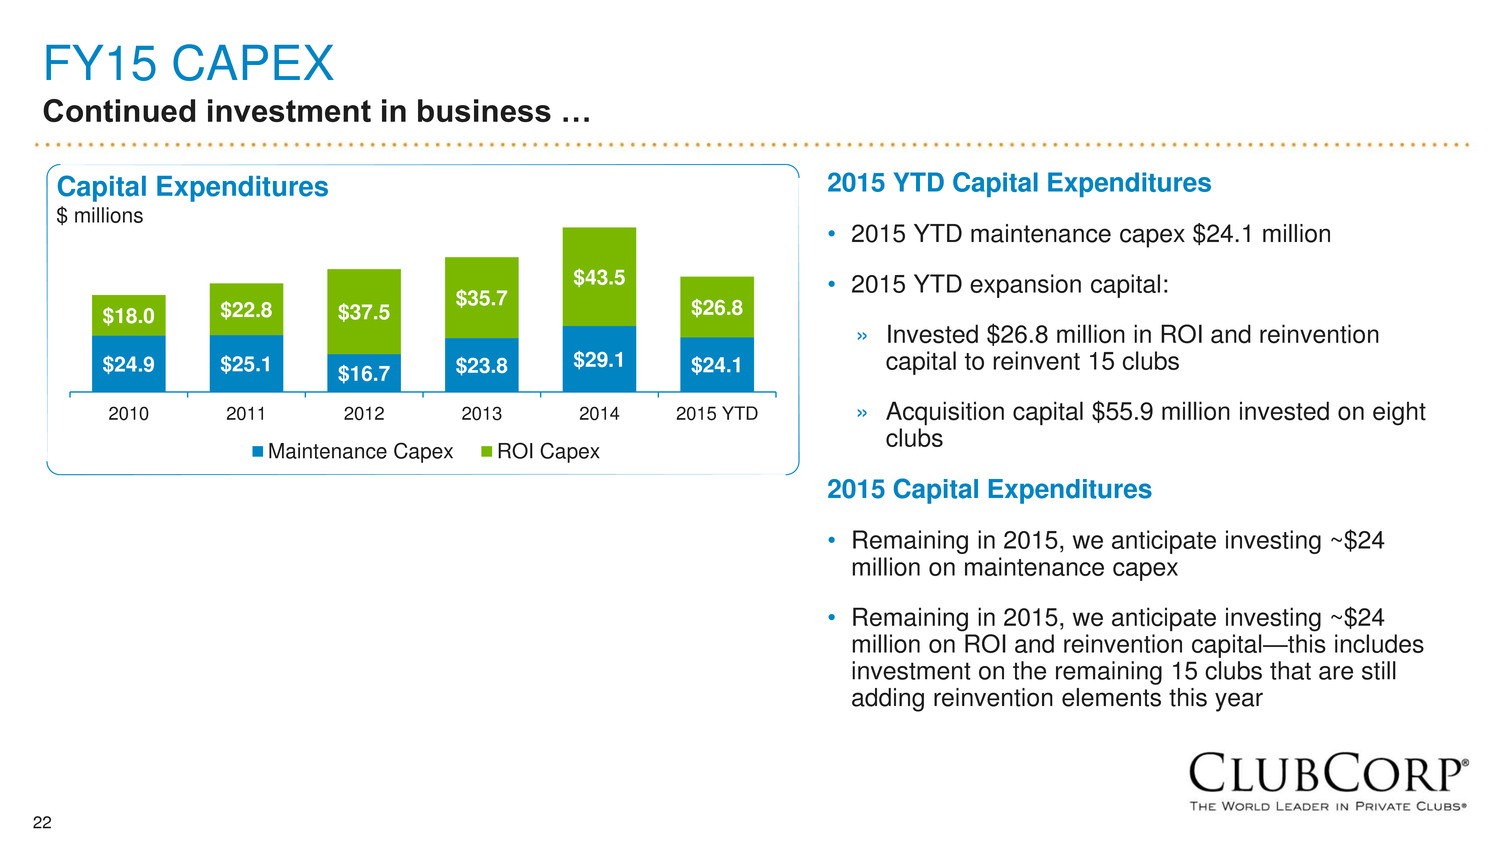
22 FY15 CAPEX Continued investment in business … 2015 YTD Capital Expenditures • 2015 YTD maintenance capex $24.1 million • 2015 YTD expansion capital: » Invested $26.8 million in ROI and reinvention capital to reinvent 15 clubs » Acquisition capital $55.9 million invested on eight clubs 2015 Capital Expenditures • Remaining in 2015, we anticipate investing ~$24 million on maintenance capex • Remaining in 2015, we anticipate investing ~$24 million on ROI and reinvention capital—this includes investment on the remaining 15 clubs that are still adding reinvention elements this year $24.9 $25.1 $16.7 $23.8 $29.1 $24.1 $18.0 $22.8 $37.5 $35.7 $43.5 $26.8 2010 2011 2012 2013 2014 2015 YTD Maintenance Capex ROI Capex Capital Expenditures $ millions
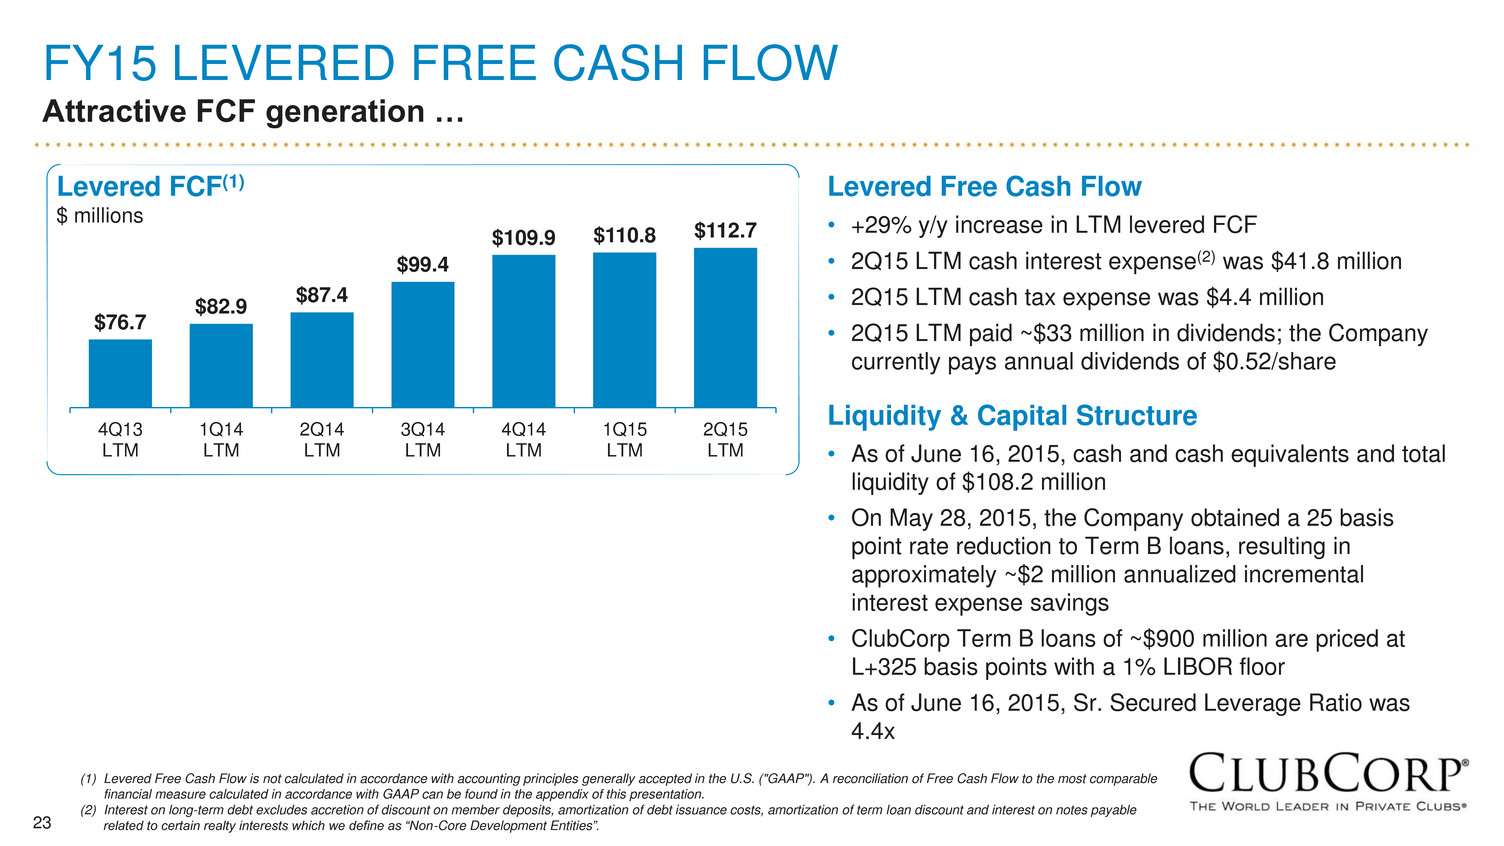
23 FY15 LEVERED FREE CASH FLOW Attractive FCF generation … $76.7 $82.9 $87.4 $99.4 $109.9 $110.8 $112.7 4Q13 LTM 1Q14 LTM 2Q14 LTM 3Q14 LTM 4Q14 LTM 1Q15 LTM 2Q15 LTM Levered Free Cash Flow • +29% y/y increase in LTM levered FCF • 2Q15 LTM cash interest expense(2) was $41.8 million • 2Q15 LTM cash tax expense was $4.4 million • 2Q15 LTM paid ~$33 million in dividends; the Company currently pays annual dividends of $0.52/share Liquidity & Capital Structure • As of June 16, 2015, cash and cash equivalents and total liquidity of $108.2 million • On May 28, 2015, the Company obtained a 25 basis point rate reduction to Term B loans, resulting in approximately ~$2 million annualized incremental interest expense savings • ClubCorp Term B loans of ~$900 million are priced at L+325 basis points with a 1% LIBOR floor • As of June 16, 2015, Sr. Secured Leverage Ratio was 4.4x Levered FCF(1) $ millions (1) Levered Free Cash Flow is not calculated in accordance with accounting principles generally accepted in the U.S. ("GAAP"). A reconciliation of Free Cash Flow to the most comparable financial measure calculated in accordance with GAAP can be found in the appendix of this presentation. (2) Interest on long-term debt excludes accretion of discount on member deposits, amortization of debt issuance costs, amortization of term loan discount and interest on notes payable related to certain realty interests which we define as “Non-Core Development Entities”.
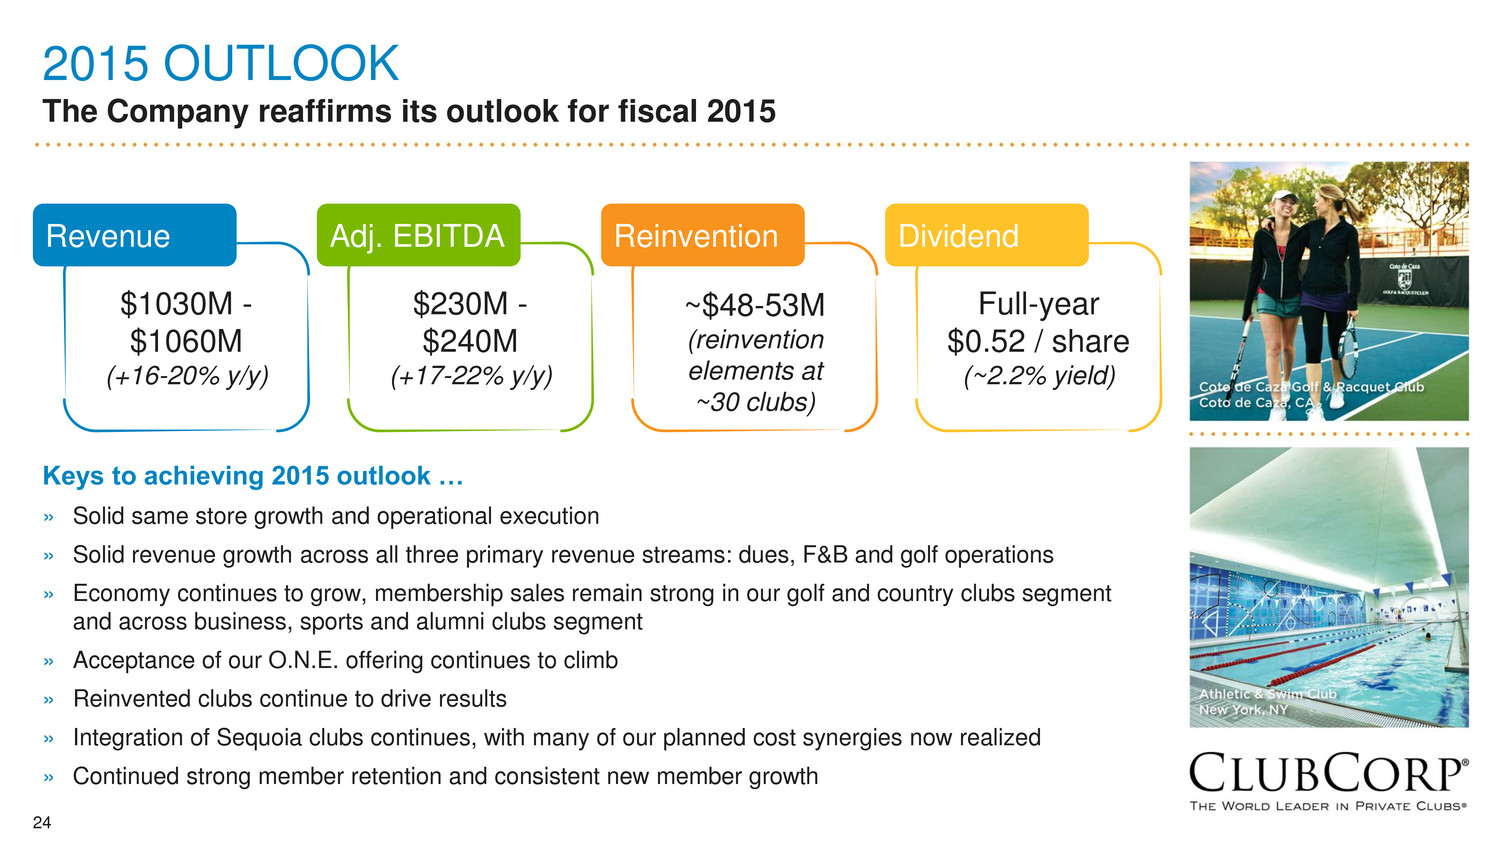
24 2015 OUTLOOK The Company reaffirms its outlook for fiscal 2015 Keys to achieving 2015 outlook … » Solid same store growth and operational execution » Solid revenue growth across all three primary revenue streams: dues, F&B and golf operations » Economy continues to grow, membership sales remain strong in our golf and country clubs segment and across business, sports and alumni clubs segment » Acceptance of our O.N.E. offering continues to climb » Reinvented clubs continue to drive results » Integration of Sequoia clubs continues, with many of our planned cost synergies now realized » Continued strong member retention and consistent new member growth $1030M - $1060M (+16-20% y/y) Revenue $230M - $240M (+17-22% y/y) Adj. EBITDA ~$48-53M (reinvention elements at ~30 clubs) Reinvention Full-year $0.52 / share (~2.2% yield) Dividend

25 APPENDIX
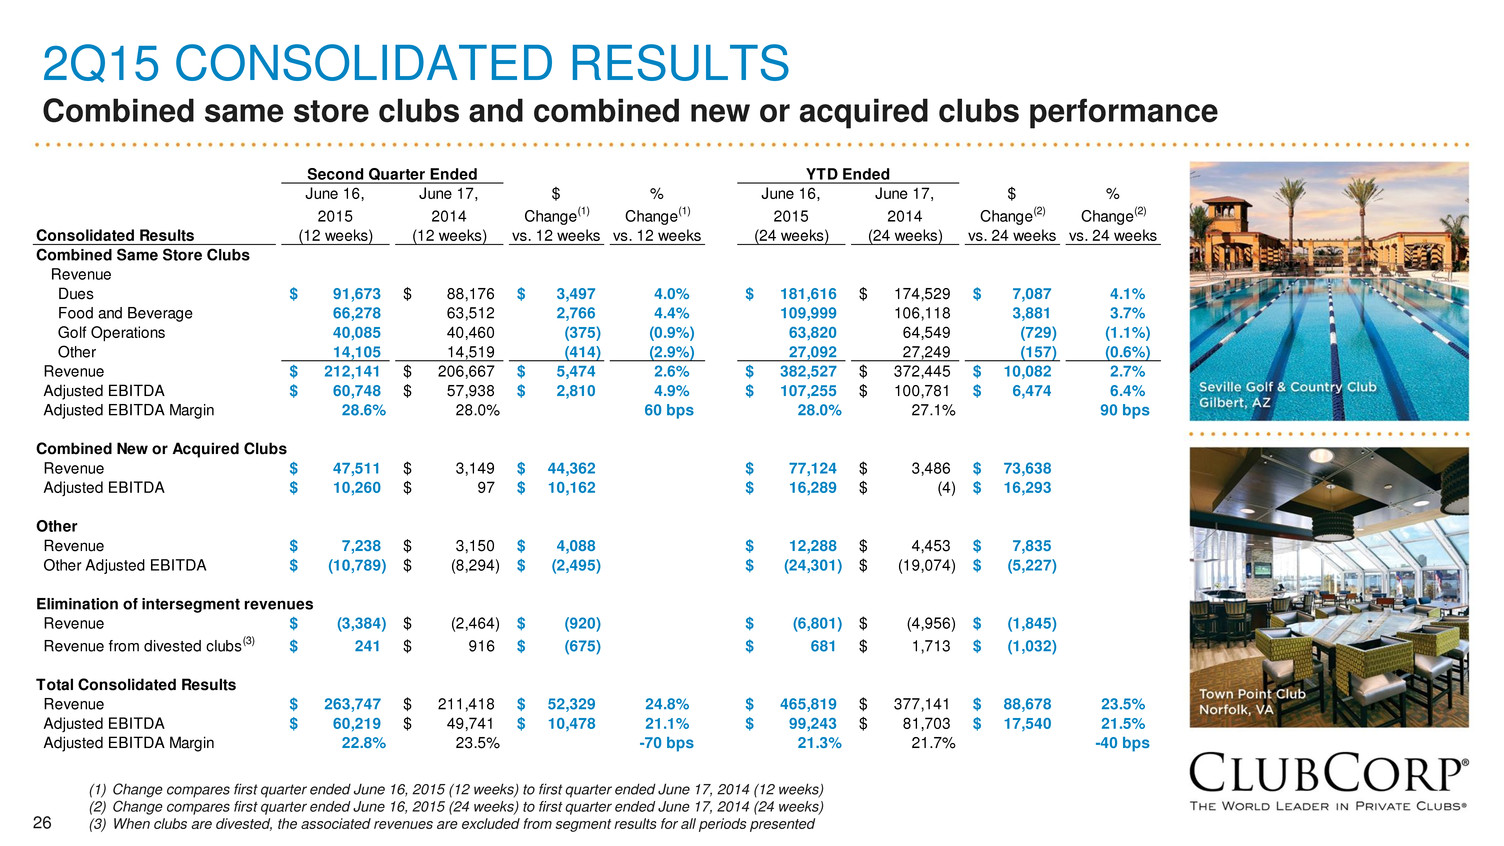
26 2Q15 CONSOLIDATED RESULTS Combined same store clubs and combined new or acquired clubs performance (1) Change compares first quarter ended June 16, 2015 (12 weeks) to first quarter ended June 17, 2014 (12 weeks) (2) Change compares first quarter ended June 16, 2015 (24 weeks) to first quarter ended June 17, 2014 (24 weeks) (3) When clubs are divested, the associated revenues are excluded from segment results for all periods presented June 16, June 17, $ % June 16, June 17, $ % 2015 2014 Change(1) Change(1) 2015 2014 Change(2) Change(2) Consolidated Results (12 weeks) (12 weeks) vs. 12 weeks vs. 12 weeks (24 weeks) (24 weeks) vs. 24 weeks vs. 24 weeks Combined Same Store Clubs Revenue Dues 91,673$ 88,176$ 3,497$ 4.0% 181,616$ 174,529$ 7,087$ 4.1% Food and Beverage 66,278 63,512 2,766 4.4% 109,999 106,118 3,881 3.7% Golf Operations 40,085 40,460 (375) (0.9%) 63,820 64,549 (729) (1.1%) Other 14,105 14,519 (414) (2.9%) 27,092 27,249 (157) (0.6%) Revenue 212,141$ 206,667$ 5,474$ 2.6% 382,527$ 372,445$ 10,082$ 2.7% Adjusted EBITDA 60,748$ 57,938$ 2,810$ 4.9% 107,255$ 100,781$ 6,474$ 6.4% Adjusted EBITDA Margin 28.6% 28.0% 60 bps 28.0% 27.1% 90 bps Combined New or Acquired Clubs Revenue 47,511$ 3,149$ 44,362$ 77,124$ 3,486$ 73,638$ Adjusted EBITDA 10,260$ 97$ 10,162$ 16,289$ (4)$ 16,293$ Other Revenue 7,238$ 3,150$ 4,088$ 12,288$ 4,453$ 7,835$ Other Adjusted EBITDA (10,789)$ (8,294)$ (2,495)$ (24,301)$ (19,074)$ (5,227)$ Elimination of intersegment revenues Revenue (3,384)$ (2,464)$ (920)$ (6,801)$ (4,956)$ (1,845)$ Revenue from divested clubs(3) 241$ 916$ (675)$ 681$ 1,713$ (1,032)$ Total Consolidated Results Revenue 263,747$ 211,418$ 52,329$ 24.8% 465,819$ 377,141$ 88,678$ 23.5% Adjusted EBITDA 60,219$ 49,741$ 10,478$ 21.1% 99,243$ 81,703$ 17,540$ 21.5% Adjusted EBITDA Margin 22.8% 23.5% -70 bps 21.3% 21.7% -40 bps Second Quarter Ended YTD Ended
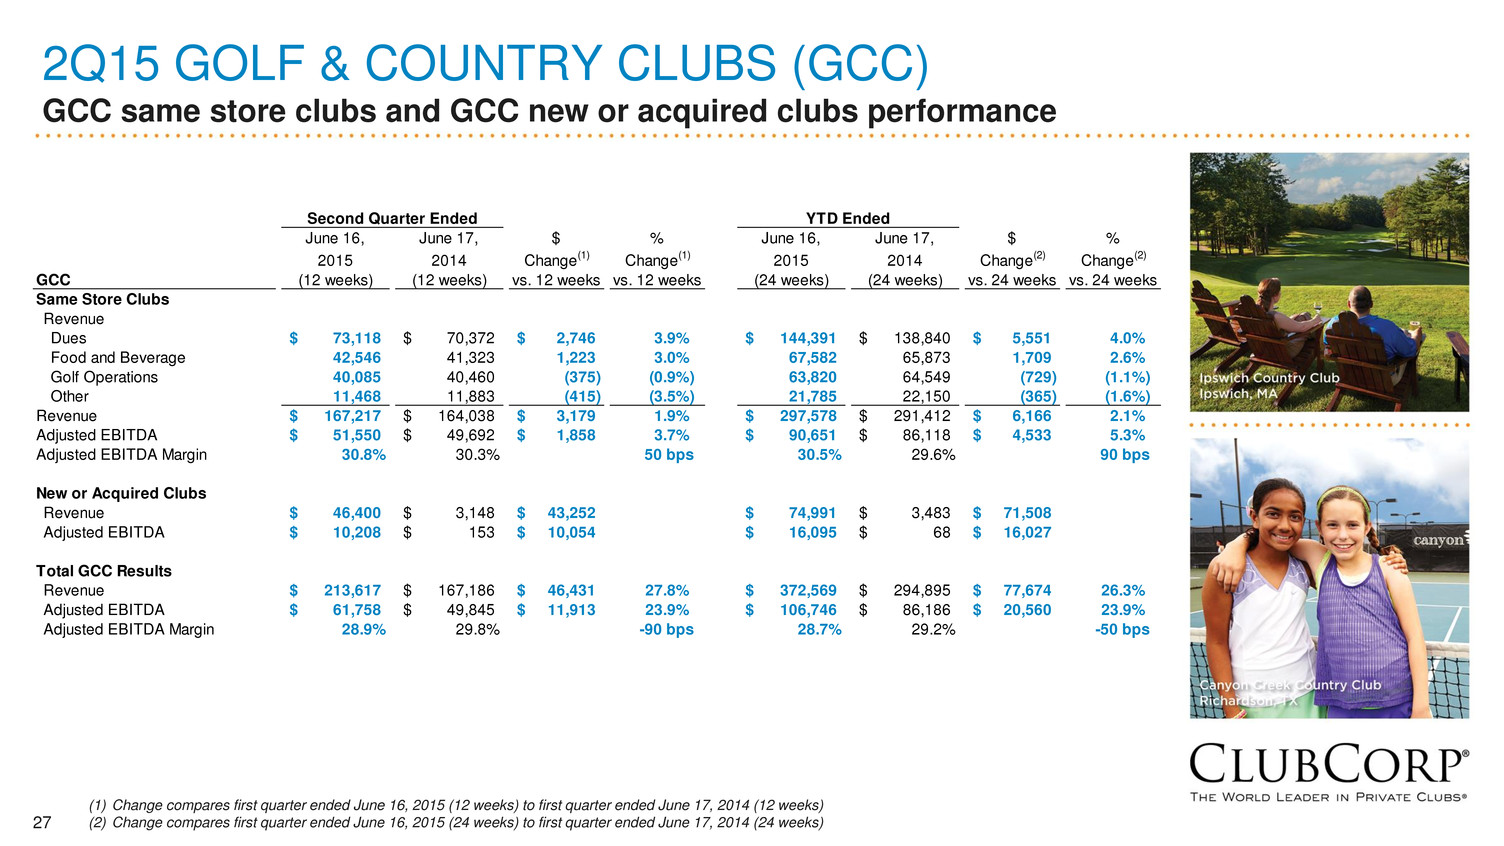
27 2Q15 GOLF & COUNTRY CLUBS (GCC) GCC same store clubs and GCC new or acquired clubs performance (1) Change compares first quarter ended June 16, 2015 (12 weeks) to first quarter ended June 17, 2014 (12 weeks) (2) Change compares first quarter ended June 16, 2015 (24 weeks) to first quarter ended June 17, 2014 (24 weeks) June 16, June 17, $ % June 16, June 17, $ % 2015 2014 Change(1) Change(1) 2015 2014 Change(2) Change(2) GCC (12 weeks) (12 weeks) vs. 12 weeks vs. 12 weeks (24 weeks) (24 weeks) vs. 24 weeks vs. 24 weeks Same Store Clubs Revenue Dues 73,118$ 70,372$ 2,746$ 3.9% 144,391$ 138,840$ 5,551$ 4.0% Food and Beverage 42,546 41,323 1,223 3.0% 67,582 65,873 1,709 2.6% Golf Operations 40,085 40,460 (375) (0.9%) 63,820 64,549 (729) (1.1%) Other 11,468 11,883 (415) (3.5%) 21,785 22,150 (365) (1.6%) Revenue 167,217$ 164,038$ 3,179$ 1.9% 297,578$ 291,412$ 6,166$ 2.1% Adjusted EBITDA 51,550$ 49,692$ 1,858$ 3.7% 90,651$ 86,118$ 4,533$ 5.3% Adjusted EBITDA Margin 30.8% 30.3% 50 bps 30.5% 29.6% 90 bps New or Acquired Clubs Revenue 46,400$ 3,148$ 43,252$ 74,991$ 3,483$ 71,508$ Adjusted EBITDA 10,208$ 153$ 10,054$ 16,095$ 68$ 16,027$ Total GCC Results Revenue 213,617$ 167,186$ 46,431$ 27.8% 372,569$ 294,895$ 77,674$ 26.3% Adjusted EBITDA 61,758$ 49,845$ 11,913$ 23.9% 106,746$ 86,186$ 20,560$ 23.9% Adjusted EBITDA Margin 28.9% 29.8% -90 bps 28.7% 29.2% -50 bps Second Quarter Ended YTD Ended
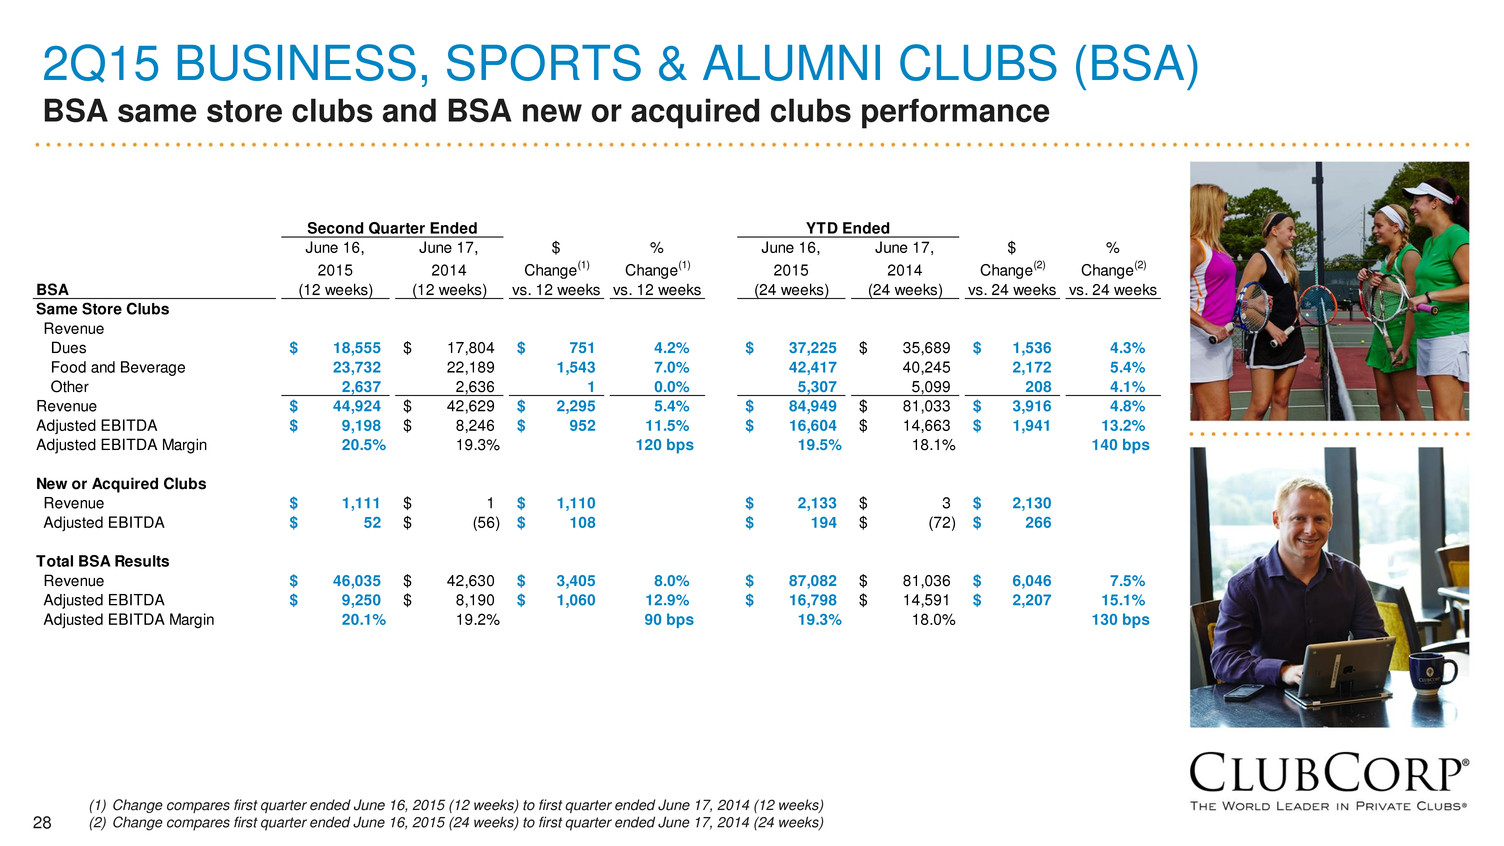
28 2Q15 BUSINESS, SPORTS & ALUMNI CLUBS (BSA) BSA same store clubs and BSA new or acquired clubs performance (1) Change compares first quarter ended June 16, 2015 (12 weeks) to first quarter ended June 17, 2014 (12 weeks) (2) Change compares first quarter ended June 16, 2015 (24 weeks) to first quarter ended June 17, 2014 (24 weeks) June 16, June 17, $ % June 16, June 17, $ % 2015 2014 Change(1) Change(1) 2015 2014 Change(2) Change(2) BSA (12 weeks) (12 weeks) vs. 12 weeks vs. 12 weeks (24 weeks) (24 weeks) vs. 24 weeks vs. 24 weeks Same Store Clubs Revenue Dues 18,555$ 17,804$ 751$ 4.2% 37,225$ 35,689$ 1,536$ 4.3% Food and Beverage 23,732 22,189 1,543 7.0% 42,417 40,245 2,172 5.4% Other 2,637 2,636 1 0.0% 5,307 5,099 208 4.1% Revenue 44,924$ 42,629$ 2,295$ 5.4% 84,949$ 81,033$ 3,916$ 4.8% Adjusted EBITDA 9,198$ 8,246$ 952$ 11.5% 16,604$ 14,663$ 1,941$ 13.2% Adjusted EBITDA Margin 20.5% 19.3% 120 bps 19.5% 18.1% 140 bps New or Acquired Clubs Revenue 1,111$ 1$ 1,110$ 2,133$ 3$ 2,130$ Adjusted EBITDA 52$ (56)$ 108$ 194$ (72)$ 266$ Total BSA Results Revenue 46,035$ 42,630$ 3,405$ 8.0% 87,082$ 81,036$ 6,046$ 7.5% Adjusted EBITDA 9,250$ 8,190$ 1,060$ 12.9% 16,798$ 14,591$ 2,207$ 15.1% Adjusted EBITDA Margin 20.1% 19.2% 90 bps 19.3% 18.0% 130 bps Second Quarter Ended YTD Ended

29 NET INCOME TO ADJUSTED EBITDA RECONCILIATION OF NON-GAAP MEASURES TO CLOSEST GAAP MEASURE (1) Includes non-cash impairment charges related to property and equipment and intangible assets, loss on disposals of assets (including property and equipment disposed of in connection with renovations) and net loss or income from discontinued operations and divested clubs that do not quality as discontinued operations.(2) Includes (gain) loss on extinguishment of debt calculated in accordance with GAAP. (3) Includes non- cash items related to purchase accounting associated with the acquisition of ClubCorp, Inc. ("CCI") in 2006 by affiliates of KSL and expense recognized for our long-term incentive plan related to fiscal years 2011 through 2013. (4) Represents adjustments permitted by the credit agreement governing ClubCorp's secured credit facilities including cash distributions from equity method investments less equity in earnings recognized for said investments, income or loss attributable to non-controlling equity interests of continuing operations, franchise taxes, adjustments to accruals for unclaimed property settlements, acquisition costs, debt amendment costs, equity offering costs, other charges incurred in connection with the ClubCorp Formation (as defined in our Annual Report on Form 10-K filed with the SEC on March 12, 2015) and management fees, termination fee and expenses paid to an affiliate of KSL. (5) Includes equity-based compensation expense, calculated in accordance with GAAP, related to awards held by certain employees, executives and directors. (6) Represents estimated deferred revenue using current membership life estimates related to initiation payments that would have been recognized in the applicable period but for the application of purchase accounting in connection with the acquisition of CCI in 2006 and the acquisition of Sequoia Golf on September 30, 2014. 1Q15 2Q15 FY10 FY11 FY12 FY13 FY14 LTM LTM Net (loss) 252,663$ (35,622)$ (26,992)$ (40,680)$ 13,329$ 12,841$ 30,095$ Interest expense 61,236 84,746 89,369 83,669 65,209 65,614 66,328 Income tax (benefit) expense 57,107 (16,421) (7,528) 1,681 (41,469) (45,521) (34,844) Interest and investment income (714) (138) (1,212) (345) (2,585) (2,587) (4,095) Depreciation and amortization 91,700 93,035 78,286 72,073 80,792 87,159 94,601 EBITDA 461,992 125,600 131,923 116,398 115,276 117,506 152,085 Impairments and disposition of assets (1) 3,556 10,772 15,687 14,502 12,843 14,050 18,137 Income (loss) from discontinued operations and divested clubs (2) 8,431 (29) 10,485 (420) (518) (259) 70 Loss on extinguishment of debt (3) (334,423) - - 16,856 31,498 31,498 - Non-cash adjustments (4) (1,881) (37) 1,865 3,929 2,007 2,008 2,008 Other adjustments (5) 2,920 15,574 3,237 10,134 25,315 27,629 30,047 Equity-based compensation expense (6) - - - 14,217 4,303 4,573 4,430 Acquisition adjustment (7) 9,274 5,006 2,560 1,306 5,644 6,425 7,131 Adjusted EBITDA 149,869$ 156,886$ 165,757$ 176,922$ 196,368$ 203,430$ 213,908$ Adjusted EBITDA by Segment: Golf and Country Clubs 151,016 155,864 168,312 180,076 203,251 211,898 223,811 Business, Sports and Alumni Clubs 30,253 32,523 34,105 34,350 35,160 36,307 37,367 Other (31,400) (31,501) (36,660) (37,504) (42,043) (44,775) (47,270) Adjusted EBITDA 149,869$ 156,886$ 165,757$ 176,922$ 196,368$ 203,430$ 213,908$
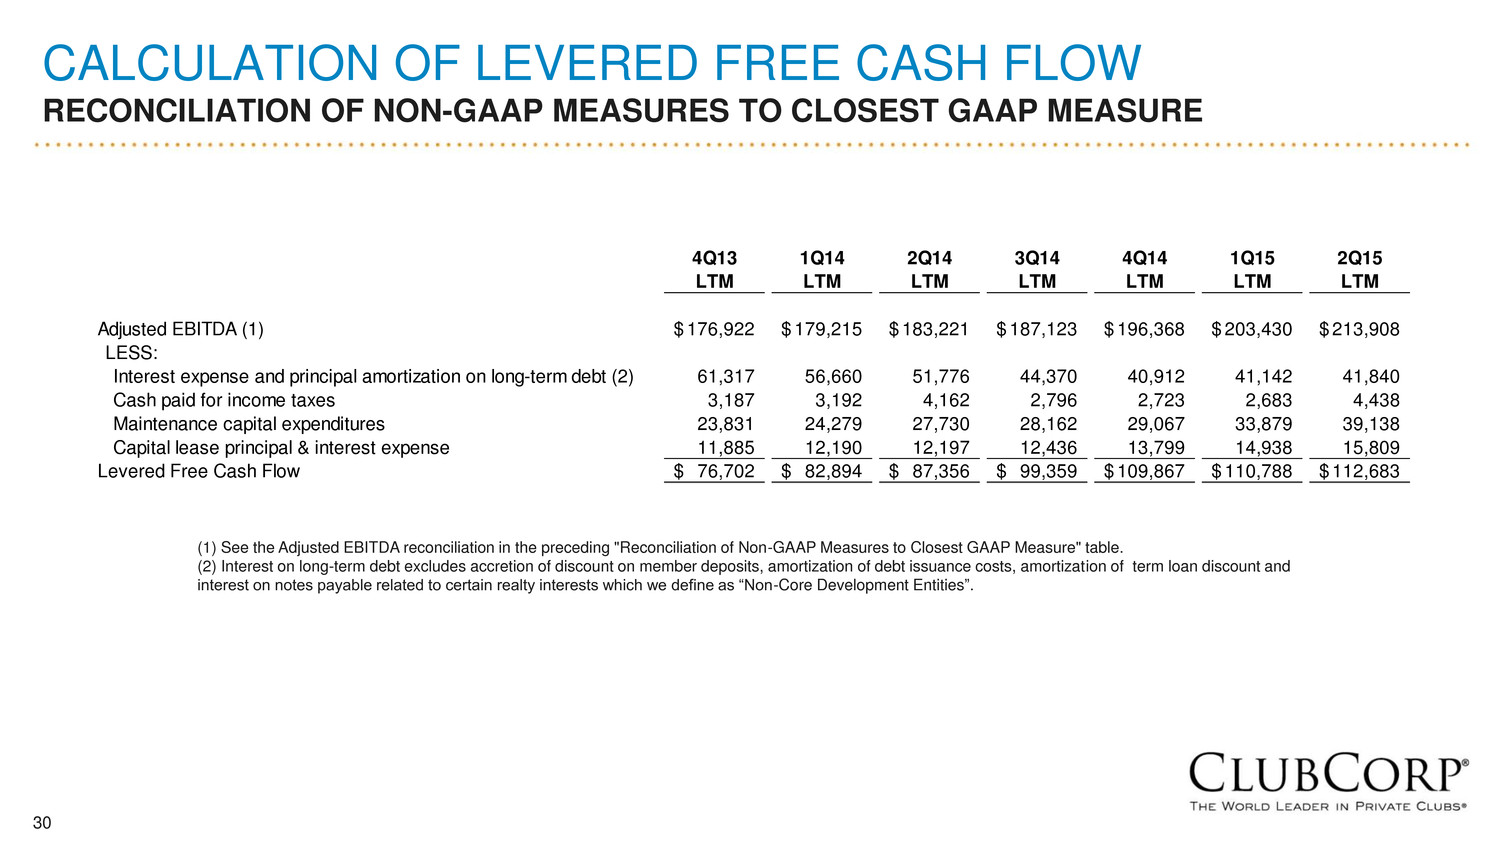
30 CALCULATION OF LEVERED FREE CASH FLOW RECONCILIATION OF NON-GAAP MEASURES TO CLOSEST GAAP MEASURE (1) See the Adjusted EBITDA reconciliation in the preceding "Reconciliation of Non-GAAP Measures to Closest GAAP Measure" table. (2) Interest on long-term debt excludes accretion of discount on member deposits, amortization of debt issuance costs, amortization of term loan discount and interest on notes payable related to certain realty interests which we define as “Non-Core Development Entities”. 4Q13 1Q14 2Q14 3Q14 4Q14 1Q15 2Q15 LTM LTM LTM LTM LTM LTM LTM Adjusted EBITDA (1) 176,922$ 179,215$ 183,221$ 187,123$ 196,368$ 203,430$ 213,908$ LE S: Interest expense and principal amortization on long-term debt (2) 61,317 56,660 51,776 44,370 40,912 41,142 41,840 Cash paid for income taxes 3,187 3,192 4,162 2,796 2,723 2,683 4,438 Maintenance capital expenditures 23,831 24,279 27,730 28,162 29,067 33,879 39,138 Capital lease principal & interest expense 11,885 12,190 12,197 12,436 13,799 14,938 15,809 Levered Free Cash Flow 76,702$ 82,894$ 87,356$ 99,359$ 109,867$ 110,788$ 112,683$
31


