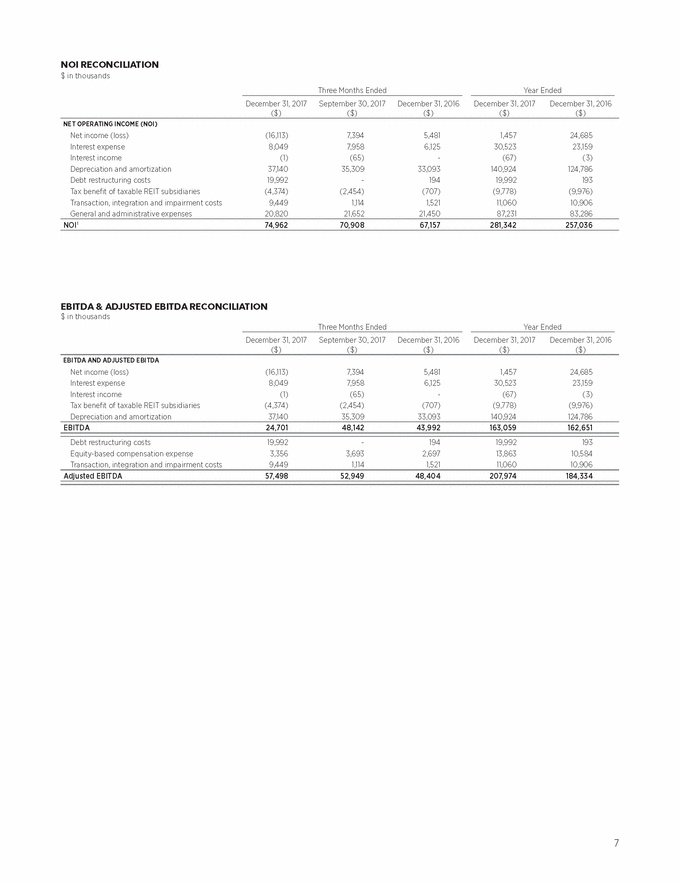
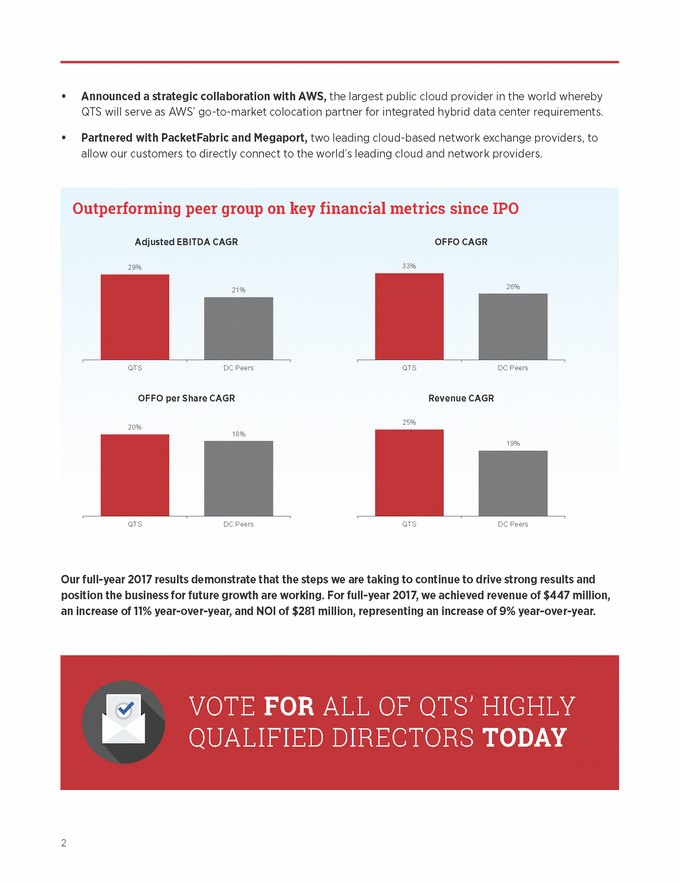
NOI RECONCILIATION $ in thousands Three Months Ended Year Ended December 31, 2017 ($) September 30, 2017 ($) December 31, 2016 ($) December 31, 2017 ($) December 31, 2016 ($) NET OPERATING INCOME (NOI) Net income (loss) Interest expense Interest income Depreciation and amortization Debt restructuring costs Tax benefit of taxable REIT subsidiaries Transaction, integration and impairment costs General and administrative expenses (16,113) 8,049 (1) 37,140 19,992 (4,374) 9,449 20,820 7,394 7,958 (65) 35,309 - (2,454) 1,114 21,652 5,481 6,125 - 33,093 194 (707) 1,521 21,450 1,457 30,523 (67) 140,924 19,992 (9,778) 11,060 87,231 24,685 23,159 (3) 124,786 193 (9,976) 10,906 83,286 NOI1 74,962 70,908 67,157 281,342 257,036 EBITDA & ADJUSTED EBITDA RECONCILIATION $ in thousands Three Months Ended Year Ended December 31, 2017 ($) September 30, 2017 ($) December 31, 2016 ($) December 31, 2017 ($) December 31, 2016 ($) EBITDA AND ADJUSTED EBITDA Net income (loss) Interest expense Interest income Tax benefit of taxable REIT subsidiaries Depreciation and amortization (16,113) 8,049 (1) (4,374) 37,140 7,394 7,958 (65) (2,454) 35,309 5,481 6,125 - (707) 33,093 1,457 30,523 (67) (9,778) 140,924 24,685 23,159 (3) (9,976) 124,786 EBITDA 24,701 48,142 43,992 163,059 162,651 Debt restructuring costs Equity-based compensation expense Transaction, integration and impairment costs 19,992 3,356 9,449 - 3,693 1,114 194 2,697 1,521 19,992 13,863 11,060 193 10,584 10,906 Adjusted EBITDA 57,498 52,949 48,404 207,974 184,334 7
