Exhibit 99.2

Table of Contents
| Overview | | |
| Company Profile | | 3 |
| | | |
| Financial Statements | | |
| Combined Consolidated Balance Sheets | | 4 |
| Combined Consolidated Statements of Operations and Comprehensive Income (Loss) | | 5 |
| Summary of Financial Data | | 6 |
| Reconciliations of Return on Invested Capital (ROIC) | | 8 |
| Implied Enterprise Value | | 9 |
| | | |
| Operating Portfolio | | |
| Data Center Properties | | 10 |
| Redevelopment Costs Summary | | 11 |
| Redevelopment Summary | | 12 |
| NOI by Facility and Capital Expenditure Summary | | 13 |
| Leasing Statistics – Signed Leases | | 15 |
| Leasing Statistics – Renewed Leases and Rental Churn | | 17 |
| Leasing Statistics – Commenced Leases | | 18 |
| Lease Expirations | | 19 |
| Largest Customers | | 20 |
| Industry Segmentation | | 21 |
| Product Diversification | | 22 |
| | | |
| Capital Structure | | |
| Debt Summary and Debt Maturities | | 23 |
| Interest Summary | | 25 |
| | | |
| Appendix | | 26 |
1 QTS Q3 Earnings 2015 | Contact: IR@qtsdatacenters.com |
Forward Looking Statements
Some of the statements contained in this document constitute forward-looking statements within the meaning of the federal securities laws. Forward-looking statements relate to expectations, beliefs, projections, future plans and strategies, anticipated events or trends and similar expressions concerning matters that are not historical facts. In particular, statements pertaining to the Company’s capital resources, portfolio performance and results of operations contain forward-looking statements. Likewise, all of the statements regarding anticipated growth in funds from operations and anticipated market conditions are forward-looking statements. In some cases, you can identify forward-looking statements by the use of forward-looking terminology such as “may,” “will,” “should,” “expects,” “intends,” “plans,” “anticipates,” “believes,” “estimates,” “predicts,” or “potential” or the negative of these words and phrases or similar words or phrases which are predictions of or indicate future events or trends and which do not relate solely to historical matters. You can also identify forward-looking statements by discussions of strategy, plans or intentions.
The forward-looking statements contained in this document reflect the Company’s current views about future events and are subject to numerous known and unknown risks, uncertainties, assumptions and changes in circumstances that may cause actual results to differ significantly from those expressed in any forward-looking statement. The Company does not guarantee that the transactions and events described will happen as described (or that they will happen at all). The following factors, among others, could cause actual results and future events to differ materially from those set forth or contemplated in the forward-looking statements: adverse economic or real estate developments in the Company’s markets or the technology industry; global, national and local economic conditions; risks related to our international operations; difficulties in identifying properties to acquire and completing acquisitions; the Company’s failure to successfully develop, redevelop and operate acquired properties, including data centers acquired in our acquisition of Carpathia Hosting, Inc.; significant increases in construction and development costs; the increasingly competitive environment in which the Company operates; defaults on, or termination or non-renewal of, leases by customers; increased interest rates and operating costs, including increased energy costs; financing risks, including the Company’s failure to obtain necessary outside financing; decreased rental rates or increased vacancy rates; dependence on third parties to provide Internet, telecommunications and network connectivity to the Company’s data centers; the Company’s failure to qualify and maintain its qualification as a real estate investment trust; environmental uncertainties and risks related to natural disasters; financial market fluctuations; and changes in real estate and zoning laws and increases in real property tax rates.
While forward-looking statements reflect the Company’s good faith beliefs, they are not guarantees of future performance. The Company disclaims any obligation to publicly update or revise any forward-looking statement to reflect changes in underlying assumptions or factors, of new information, data or methods, future events or other changes. For a further discussion of these and other factors that could cause the Company’s future results to differ materially from any forward-looking statements, see the section entitled “Risk Factors” in the Company’s Annual Report on Form 10-K for the year ended December 31, 2014 and other periodic reports the Company files with the Securities and Exchange Commission.
2 QTS Q3 Earnings 2015 | Contact: IR@qtsdatacenters.com |
Company Profile
3 QTS Q3 Earnings 2015 | Contact: IR@qtsdatacenters.com |
Combined Consolidated Balance Sheets
(in thousands)
| | | September 30, | | | December 31, | |
| | | 2015 | | | 2014 | |
| | | (unaudited) | | | | |
| ASSETS | | | | | | | | |
| Real Estate Assets | | | | | | | | |
| Land | | $ | 52,430 | | | $ | 48,577 | |
| Buildings and improvements | | | 1,108,758 | | | | 914,286 | |
| Less: Accumulated depreciation | | | (222,373 | ) | | | (180,167 | ) |
| | | | 938,815 | | | | 782,696 | |
| | | | | | | | | |
| Construction in progress | | | 353,782 | | | | 214,719 | |
| Real Estate Assets, net | | | 1,292,597 | | | | 997,415 | |
| Cash and cash equivalents | | | 10,730 | | | | 10,788 | |
| Rents and other receivables, net | | | 31,024 | | | | 15,579 | |
| Acquired intangibles, net | | | 119,402 | | | | 18,000 | |
| Deferred costs, net (1) | | | 38,522 | | | | 37,058 | |
| Prepaid expenses | | | 9,074 | | | | 3,079 | |
| Goodwill | | | 174,697 | | | | - | |
| Other assets, net (2) | | | 29,445 | | | | 24,640 | |
| TOTAL ASSETS | | $ | 1,705,491 | | | $ | 1,106,559 | |
| | | | | | | | | |
| LIABILITIES | | | | | | | | |
| Mortgage notes payable | | $ | 70,000 | | | $ | 86,600 | |
| Unsecured credit facility | | | 400,000 | | | | 239,838 | |
| Senior notes, net of discount | | | 297,914 | | | | 297,729 | |
| Capital lease and lease financing obligations | | | 53,023 | | | | 13,062 | |
| Accounts payable and accrued liabilities | | | 80,893 | | | | 64,607 | |
| Dividends and distributions payable | | | 15,349 | | | | 10,705 | |
| Advance rents, security deposits and other liabilities | | | 19,079 | | | | 3,302 | |
| Deferred income taxes | | | 15,634 | | | | - | |
| Deferred income | | | 25,046 | | | | 10,531 | |
| TOTAL LIABILITIES | | | 976,938 | | | | 726,374 | |
| | | | | | | | | |
| EQUITY | | | | | | | | |
| | | | | | | | | |
| Common stock, $0.01 par value, 450,133,000 shares authorized, 41,101,507 and 29,408,138 shares issued and outstanding as of September 30, 2015 and December 31, 2014, respectively | | | 412 | | | | 294 | |
| Additional paid-in capital | | | 668,246 | | | | 324,917 | |
| Accumulated dividends in excess of earnings | | | (44,142 | ) | | | (22,503 | ) |
| Total stockholders’ equity | | | 624,516 | | | | 302,708 | |
| Noncontrolling interests | | | 104,037 | | | | 77,477 | |
| TOTAL EQUITY | | | 728,553 | | | | 380,185 | |
| TOTAL LIABILITIES AND EQUITY | | $ | 1,705,491 | | | $ | 1,106,559 | |
| (1) | As of September 30, 2015 and December 31, 2014, deferred costs, net, included $14.5 million and $16.5 million of deferred financing costs net of amortization, respectively, $21.1 million and $17.4 million of deferred leasing costs net of amortization, respectively, and $2.9 million and $3.2 million, net of amortization, related to a leasing arrangement at the Company’s Princeton facility, respectively. |
| (2) | As of September 30, 2015 and December 31, 2014, other assets, net, primarily included $26.5 million and $21.4 million of corporate fixed assets, respectively, primarily relating to construction of corporate offices, leasehold improvements and product related assets. |
4 QTS Q3 Earnings 2015 | Contact: IR@qtsdatacenters.com |
Combined Consolidated Statements of Operations and
Comprehensive Income
(unaudited and in thousands)
The following financial data for the three month period ended June 30, 2015 and the nine month period ended September 30, 2015 includes the operating results of Carpathia Hosting, Inc. (“Carpathia”) starting June 16, 2015 (the date the Company acquired Carpathia) through the end of the respective period.
| | | Three Months Ended | | | Nine Months Ended | |
| | | September 30, | | | June 30, | | | September 30, | | | September 30, | |
| Revenues: | | 2015 | | | 2015 | | | 2014 | | | 2015 | | | 2014 | |
| Rental | | $ | 62,744 | | | $ | 52,193 | | | $ | 45,448 | | | $ | 164,270 | | | $ | 127,993 | |
| Recoveries from customers | | | 6,158 | | | | 5,582 | | | | 6,131 | | | | 17,404 | | | | 13,674 | |
| Cloud and managed services | | | 18,573 | | | | 8,220 | | | | 5,242 | | | | 32,588 | | | | 14,443 | |
| Other (1) | | | 1,415 | | | | 2,122 | | | | 1,124 | | | | 4,131 | | | | 2,116 | |
| Total revenues | | | 88,890 | | | | 68,117 | | | | 57,945 | | | | 218,393 | | | | 158,226 | |
| Operating expenses: | | | | | | | | | | | | | | | | | | | | |
| Property operating costs | | | 30,925 | | | | 22,031 | | | | 20,369 | | | | 72,292 | | | | 53,121 | |
| Real estate taxes and insurance | | | 1,462 | | | | 1,474 | | | | 1,377 | | | | 4,421 | | | | 3,713 | |
| Depreciation and amortization | | | 24,486 | | | | 18,062 | | | | 15,210 | | | | 58,791 | | | | 42,274 | |
| General and administrative (2) | | | 19,440 | | | | 14,615 | | | | 11,045 | | | | 47,893 | | | | 33,296 | |
| Restructuring (3) | | | - | | | | - | | | | 226 | | | | - | | | | 1,272 | |
| Transaction and integration costs (4) | | | 1,482 | | | | 4,669 | | | | (195 | ) | | | 6,256 | | | | 958 | |
| Total operating expenses | | | 77,795 | | | | 60,851 | | | | 48,032 | | | | 189,653 | | | | 134,634 | |
| | | | | | | | | | | | | | | | | | | | | |
| Operating income | | | 11,095 | | | | 7,266 | | | | 9,913 | | | | 28,740 | | | | 23,592 | |
| | | | | | | | | | | | | | | | | | | | | |
| Other income and expense: | | | | | | | | | | | | | | | | | | | | |
| Interest income | | | 1 | | | | 1 | | | | - | | | | 2 | | | | 8 | |
| Interest expense | | | (5,418 | ) | | | (4,799 | ) | | | (5,410 | ) | | | (15,559 | ) | | | (9,683 | ) |
| Other expense, net (5) | | | - | | | | (83 | ) | | | (470 | ) | | | (83 | ) | | | (580 | ) |
| Income before taxes | | | 5,678 | | | | 2,385 | | | | 4,033 | | | | 13,100 | | | | 13,337 | |
| Tax benefit (expense) of taxable REIT subsidiaries (6) | | | 2,560 | | | | 3,135 | | | | (27 | ) | | | 5,695 | | | | (82 | ) |
| Net income | | | 8,238 | | | | 5,520 | | | | 4,006 | | | | 18,795 | | | | 13,255 | |
| Net income attributable to noncontrolling interests (7) | | | (1,229 | ) | | | (888 | ) | | | (849 | ) | | | (3,072 | ) | | | (2,810 | ) |
| Net income attributable to QTS Realty Trust, Inc. | | | 7,009 | | | | 4,632 | | | | 3,157 | | | | 15,723 | | | | 10,445 | |
| (1) | Other revenue - Includes straight line rent, sales of scrap metals and other unused materials and various other income items. Straight line rent was $1.5 million, $1.4 million and $1.0 million for the three month periods ended September 30, 2015, June 30, 2015 and September 30, 2014, respectively. Straight line rent was $3.3 million and $1.3 million for the nine month periods ended September 30, 2015 and 2014, respectively. |
| (2) | General and administrative expenses - Includes personnel costs, sales and marketing costs, professional fees, travel costs, product investment costs and other corporate general and administrative expenses. General and administrative expenses were 21.9%, 21.5%, and 19.1% of total revenues for the three month periods ended September 30, 2015, June 30, 2015 and September 30, 2014, respectively. General and administrative expenses were 21.9% and 21.0% of total revenues for the nine month periods ended September 30, 2015 and 2014, respectively. |
| (3) | Restructuring costs – For the three and nine months ended September 30, 2014, the Company incurred $0.2 million and $1.3 million in restructuring costs related to severance costs associated with various remote employees. |
| (4) | Transaction and integration costs - For the three month periods ended September 30, 2015, June 30, 2015 and September 30, 2014, the Company recognized $0.1 million, $4.3 million and $(0.2) million, respectively, in transaction costs related to the examination of actual and potential acquisitions. Transaction costs were $4.5 million and $1.0 million for the nine month periods ended September 30, 2015 and 2014, respectively. The Company also recognized $1.4 million and $1.8 million in integration costs for the three month and nine month periods ended September 30, 2015, which include various costs to integrate QTS and Carpathia, including consulting fees, costs to consolidate office space and costs which are currently duplicated, but will be eliminated when QTS and Carpathia are fully integrated. |
| (5) | Other expense, net - Generally includes write offs of unamortized deferred financing costs associated with the early extinguishment of certain debt instruments. |
| (6) | Tax benefit (expense) of taxable REIT subsidiaries – For the three months ended June 30, 2015, the Company recorded an approximate $3.1 million non-cash tax benefit related to the reversal of valuation allowances of deferred tax assets which was a result of the purchase of Carpathia. For the three months ended September 30, 2015, the Company recorded an additional $2.6 million non-cash tax benefit, aggregating to $5.7 million in non-cash deferred income tax benefit for the nine months ended September 30, 2015. |
| (7) | Noncontrolling interest - As of September 30, 2015, the noncontrolling ownership interest of QualityTech, LP was 14.3%, which is related to approximately 6.8 million Operating Partnership units outstanding at September 30, 2015 which are convertible into common shares on a one-for-one basis. |
5 QTS Q3 Earnings 2015 | Contact: IR@qtsdatacenters.com |
Summary of Financial Data
(in thousands, except operating portfolio statistics data)
| | | Three Months Ended | | | Nine Months Ended | |
| | | September 30, | | | June 30, | | | September 30, | | | September 30, | |
| Summary of Results | | 2015 | | | 2015 | | | 2014 | | | 2015 | | | 2014 | |
| Total revenue | | $ | 88,890 | | | $ | 68,117 | | | $ | 57,945 | | | $ | 218,393 | | | $ | 158,226 | |
| Net income | | | 8,238 | | | | 5,520 | | | | 4,006 | | | | 18,795 | | | | 13,255 | |
| | | | | | | | | | | | | | | | | | | | | |
| Other Data | | | | | | | | | | | | | | | | | | | | |
| FFO | | $ | 29,260 | | | $ | 21,845 | | | $ | 17,602 | | | $ | 70,444 | | | $ | 50,918 | |
| Operating FFO | | | 29,536 | | | | 23,422 | | | | 18,103 | | | | 72,402 | | | | 53,728 | |
| Operating FFO per share | | | 0.61 | | | | 0.53 | | | | 0.49 | | | | 1.64 | | | | 1.45 | |
| Adjusted Operating FFO | | | 29,670 | | | | 22,238 | | | | 12,880 | | | | 71,983 | | | | 49,326 | |
| Recognized MRR in the period | | | 78,296 | | | | 57,953 | | | | 48,963 | | | | 188,633 | | | | 137,333 | |
| MRR (at period end) | | | 26,214 | | | | 25,473 | | | | 16,521 | | | | 26,214 | | | | 16,521 | |
| EBITDA | | | 35,581 | | | | 25,245 | | | | 24,653 | | | | 87,448 | | | | 65,286 | |
| Adjusted EBITDA | | | 39,131 | | | | 31,828 | | | | 26,079 | | | | 98,993 | | | | 70,997 | |
| NOI | | | 56,503 | | | | 44,612 | | | | 36,199 | | | | 141,680 | | | | 101,392 | |
| NOI as a % of revenue | | | 63.6 | % | | | 65.5 | % | | | 62.5 | % | | | 64.9 | % | | | 64.1 | % |
| Adjusted EBITDA as a % of revenue | | | 44.0 | % | | | 46.7 | % | | | 45.0 | % | | | 45.3 | % | | | 44.9 | % |
| General and administrative expenses as a % of revenue | | | 21.9 | % | | | 21.5 | % | | | 19.1 | % | | | 21.9 | % | | | 21.0 | % |
| Annualized ROIC | | | 15.7 | % | | | 15.8 | % | | | 15.0 | % | | | 15.7 | % | | | 15.3 | % |
| | | September 30, | | | December 31, | |
| Balance Sheet Data | | 2015 | | | 2014 | |
| Real estate at cost | | $ | 1,514,970 | | | $ | 1,177,582 | |
| Net investment in real estate | | | 1,292,597 | | | | 997,415 | |
| Total assets | | | 1,705,491 | | | | 1,106,559 | |
| Total debt | | | 820,937 | | | | 637,229 | |
| Debt to last quarter annualized Adjusted EBITDA | | | 5.2 | x | | | 5.5 | x |
| Debt to undepreciated real estate assets | | | 54.2 | % | | | 54.1 | % |
| Debt to Implied Enterprise Value | | | 27.8 | % | | | 33.4 | % |
6 QTS Q3 Earnings 2015 | Contact: IR@qtsdatacenters.com |
| | | September 30, | | | December 31, | |
| Operating Portfolio Statistics | | 2015 | | | 2014 | |
| Built out square footage: | | | | | | | | |
| Raised floor | | | 1,076,142 | | | | 927,075 | |
| Leasable raised floor (1) | | | 844,410 | | | | 698,232 | |
| Leased raised floor | | | 735,574 | | | | 593,610 | |
| | | | | | | | | |
| Total Raw Shell: | | | | | | | | |
| Total | | | 4,842,857 | | | | 4,688,164 | |
| Basis-of-design raised floor space (1) | | | 2,187,267 | | | | 2,090,959 | |
| | | | | | | | | |
| Data center properties | | | 25 | | | | 12 | |
| Basis of design raised floor % developed | | | 49.2 | % | | | 44.3 | % |
| Data center % occupied | | | 87.1 | % | | | 85.0 | % |
| (1) | See definition in Appendix. |
7 QTS Q3 Earnings 2015 | Contact: IR@qtsdatacenters.com |
Reconciliations of Return on Invested Capital (ROIC)
(unaudited and in thousands)
| Return on Invested Capital (ROIC) | | Three Months Ended | | | Nine Months Ended | |
| | | September 30, | | | June 30, | | | September 30, | | | September 30, | |
| | | 2015 | | | 2015 | | | 2014 | | | 2015 | | | 2014 | |
| NOI (1) | | $ | 56,503 | | | $ | 49,112 | | | $ | 36,199 | | | $ | 146,180 | | | $ | 101,392 | |
| Annualized NOI | | | 226,012 | | | | 196,448 | | | | 144,796 | | | | 194,907 | | | | 135,189 | |
| Average undepreciated real estate assets and other net fixed assets placed in service | | | 1,441,297 | | | | 1,243,782 | | | | 966,924 | | | | 1,242,476 | | | | 882,894 | |
| Annualized ROIC | | | 15.7 | % | | | 15.8 | % | | | 15.0 | % | | | 15.7 | % | | | 15.3 | % |
| (1) | Includes facility level G&A allocation charges of 4% of revenue for QTS entities and 10% of revenue for Carpathia entities which aggregated to $4.9 million, $2.7 million and $2.3 million for the three month periods ended September 30, 2015, June 30, 2015, and September 30, 2014, respectively, and $10.1 million and $6.3 million for the nine month periods ended September 30, 2015 and 2014, respectively. |
| Calculation of Average Undepreciated Real Estate Assets and other Net Fixed Assets Placed in Service | | As of | | | As of | |
| Undepreciated Real Estate Assets and other | | September 30, | | | June 30, | | | September 30, | | | September 30, | | | September 30, | |
| Net Fixed Assets Placed in Service | | 2015 | | | 2015 | | | 2014 | | | 2015 | | | 2014 | |
| Real Estate Assets, net | | $ | 1,292,597 | | | $ | 1,241,151 | | | $ | 948,850 | | | $ | 1,292,597 | | | $ | 948,850 | |
| Less: Construction in progress | | | (353,782 | ) | | | (320,885 | ) | | | (174,470 | ) | | | (353,782 | ) | | | (174,470 | ) |
| Plus: Accumulated depreciation | | | 222,373 | | | | 205,284 | | | | 168,210 | | | | 222,373 | | | | 168,210 | |
| Plus: Goodwill | | | 174,697 | | | | 173,237 | | | | - | | | | 174,697 | | | | - | |
| Plus: Other fixed assets, net | | | 11,007 | | | | 11,400 | | | | 23,268 | | | | 11,007 | | | | 23,268 | |
| Plus: Acquired intangibles, net | | | 88,642 | * | | | 90,173 | * | | | 18,745 | | | | 88,642 | * | | | 18,745 | |
| Plus: Leasing Commissions, net | | | 23,966 | | | | 22,735 | | | | 19,221 | | | | 23,966 | | | | 19,221 | |
| Total as of period end | | $ | 1,459,500 | | | $ | 1,423,095 | | | $ | 1,003,824 | | | $ | 1,459,500 | | | $ | 1,003,824 | |
| | | | | | | | | | | | | | | | | | | | | |
| Average undepreciated real estate assets and other net fixed assets as of reporting period (2) | | $ | 1,441,297 | | | $ | 1,243,782 | | | $ | 966,924 | | | $ | 1,242,476 | | | $ | 882,894 | |
| (2) | Calculated by using average quarterly balance of each account. |
| * | Net of acquired intangible liabilities and deferred tax liabilities. |
8 QTS Q3 Earnings 2015 | Contact: IR@qtsdatacenters.com |
Implied Enterprise Value
| Implied Enterprise Value as of September 30, 2015: | | | | |
| Total Shares Outstanding: | | | | |
| Class A Common Stock | | | 40,968,507 | |
| Class B Common Stock | | | 133,000 | |
| Total Shares Outstanding | | | 41,101,507 | |
| Units of Limited Partnership (1) | | | 7,378,184 | |
| Options to purchase Class A Common Stock (2) | | | 317,813 | |
| Fully Diluted Total Shares and Units of Limited Partnership outstanding as of September 30, 2015 (3) | | | 48,797,504 | |
| Share price as of September 30, 2015 | | $ | 43.69 | |
| Market equity capitalization (in thousands) | | $ | 2,131,963 | |
| Debt (in thousands) | | | 820,937 | |
| Implied Enterprise Value (in thousands) | | $ | 2,952,900 | |
| (1) | Includes 531,184 of operating partnership units representing the “in the money” value of Class O LTIP units on an “as if” converted basis. |
| (2) | Represents options to purchase 317,813 shares of Class A Common Stock of QTS Realty Trust Inc. representing the “in the money” value of options on an “as if” converted basis. |
| (3) | Weighted average fully diluted shares and units for the three and nine month periods ended September 30, 2015 were 48,733,417 and 44,181,583, respectively. |
9 QTS Q3 Earnings 2015 | Contact: IR@qtsdatacenters.com |
Data Center Properties
(in thousands, except NRSF data)
The following table presents an overview of the portfolio of data center properties that the Company owns or leases, referred to herein as our data center properties, based on information as of September 30, 2015:
| | | | | | | | Operating Net Rentable Square Feet (Operating
NRSF)(3) | | | | | | | | | | | | | | | | |
| Property | | Year
Acquired
(1) | | Gross
Square
Feet(2) | | | Raised
Floor(4) | | | Office &
Other(5) | | | Supporting
Infrastructure
(6) | | | Total | | | %
Occupied
and
Billing(7) | | | Annualized
Rent(8) | | | Available
Utility
Power
(MW)(9) | | | Basis of
Design
NRSF | | | %
Raised
Floor | |
| Richmond, VA | | 2010 | | | 1,318,353 | | | | 121,623 | | | | 51,093 | | | | 131,324 | | | | 304,040 | | | | 86.2 | % | | $ | 26,249,863 | | | | 110 | | | | 556,623 | | | | 21.9 | % |
| | | | | | | | | | | | | | | | | | | | | | | | | | | | | | | | | | | | | | | | | | | |
| Atlanta, GA (Metro) | | 2006 | | | 968,695 | | | | 417,986 | | | | 36,953 | | | | 315,676 | | | | 770,615 | | | | 93.1 | % | | $ | 79,308,328 | | | | 72 | | | | 527,186 | | | | 79.3 | % |
| | | | | | | | | | | | | | | | | | | | | | | | | | | | | | | | | | | | | | | | | | | |
| Dallas-Fort Worth, TX | | 2013 | | | 698,000 | | | | 54,014 | | | | 2,321 | | | | 35,825 | | | | 92,160 | | | | 90.2 | % | | $ | 8,441,882 | | | | 140 | | | | 292,000 | | | | 18.5 | % |
| | | | | | | | | | | | | | | | | | | | | | | | | | | | | | | | | | | | | | | | | | | |
| Princeton, NJ | | 2014 | | | 553,930 | | | | 58,157 | | | | 2,229 | | | | 111,405 | | | | 171,791 | | | | 100.0 | % | | $ | 9,665,340 | | | | 22 | | | | 158,157 | | | | 36.8 | % |
| | | | | | | | | | | | | | | | | | | | | | | | | | | | | | | | | | | | | | | | | | | |
| Suwanee, GA | | 2005 | | | 369,822 | | | | 185,422 | | | | 8,697 | | | | 108,266 | | | | 302,385 | | | | 81.8 | % | | $ | 52,778,916 | | | | 36 | | | | 208,008 | | | | 89.1 | % |
| | | | | | | | | | | | | | | | | | | | | | | | | | | | | | | | | | | | | | | | | | | |
| Chicago, IL | | 2014 | | | 317,000 | | | | - | | | | - | | | | - | | | | - | | | | - | % | | $ | - | | | | 8 | | | | 133,000 | | | | - | % |
| | | | | | | | | | | | | | | | | | | | | | | | | | | | | | | | | | | | | | | | | | | |
| Santa Clara, CA** | | 2007 | | | 135,322 | | | | 55,494 | | | | 944 | | | | 45,687 | | | | 102,125 | | | | 97.2 | % | | $ | 24,986,083 | | | | 11 | | | | 80,347 | | | | 69.1 | % |
| | | | | | | | | | | | | | | | | | | | | | | | | | | | | | | | | | | | | | | | | | | |
| Jersey City, NJ* | | 2006 | | | 122,448 | | | | 31,503 | | | | 14,208 | | | | 41,901 | | | | 87,612 | | | | 97.9 | % | | $ | 12,228,150 | | | | 7 | | | | 52,744 | | | | 59.7 | % |
| | | | | | | | | | | | | | | | | | | | | | | | | | | | | | | | | | | | | | | | | | | |
| Sacramento, CA | | 2012 | | | 92,644 | | | | 54,595 | | | | 2,794 | | | | 23,916 | | | | 81,305 | | | | 46.0 | % | | $ | 11,523,173 | | | | 8 | | | | 57,906 | | | | 94.3 | % |
| | | | | | | | | | | | | | | | | | | | | | | | | | | | | | | | | | | | | | | | | | | |
| Miami, FL | | 2008 | | | 30,029 | | | | 19,887 | | | | - | | | | 6,592 | | | | 26,479 | | | | 68.2 | % | | $ | 5,111,352 | | | | 4 | | | | 19,887 | | | | 100.0 | % |
| | | | | | | | | | | | | | | | | | | | | | | | | | | | | | | | | | | | | | | | | | | |
| Carpathia facilitiies *** | | 2015 | | | 154,693 | | | | 72,332 | | | | 5,242 | | | | 14,169 | | | | 91,743 | | | | 74.0 | % | | $ | 83,389,172 | | | | 20 | | | | 96,280 | | | | 75.1 | % |
| | | | | | | | | | | | | | | | | | | | | | | | | | | | | | | | | | | | | | | | | | | |
| Other | | Misc | | | 81,921 | | | | 5,129 | | | | 37,854 | | | | 38,723 | | | | 81,706 | | | | 20.4 | % | | $ | 891,338 | | | | 1 | | | | 5,129 | | | | 100.0 | % |
| | | | | | | | | | | | | | | | | | | | | | | | | | | | | | | | | | | | | | | | | | | |
| Total | | | | | 4,842,857 | | | | 1,076,142 | | | | 162,335 | | | | 873,484 | | | | 2,111,961 | | | | 87.1 | % | | $ | 314,573,597 | | | | 439 | | | | 2,187,267 | | | | 49.2 | % |
| (1) | Represents the year a property was acquired or, in the case of a property under lease, the year the Company’s initial lease commenced for the property. |
| (2) | With respect to the Company’s owned properties, gross square feet represents the entire building area. With respect to leased properties, gross square feet represents that portion of the gross square feet subject to our lease. This includes 218,926 square feet of QTS office and support space, which is not included in operating NRSF. |
| (3) | Represents the total square feet of a building that is currently leased or available for lease plus developed supporting infrastructure, based on engineering drawings and estimates, but does not include space held for redevelopment or space used for the Company’s own office space. |
| (4) | Represents management’s estimate of the portion of NRSF of the facility with available power and cooling capacity that is currently leased or readily available to be leased to customers as data center space based on engineering drawings. |
| (5) | Represents the operating NRSF of the facility other than data center space (typically office and storage space) that is currently leased or available to be leased. |
| (6) | Represents required data center support space, including mechanical, telecommunications and utility rooms, as well as building common areas. |
| (7) | Calculated as data center raised floor that is subject to a signed lease for which billing has commenced (735,574 square feet as of September 30, 2015), divided by leasable raised floor based on the current configuration of the properties (844,410 square feet as of September 30, 2015), expressed as a percentage. |
| (8) | The Company defines annualized rent as MRR multiplied by 12. The Company calculates MRR as monthly contractual revenue under executed contracts as of a particular date, which includes revenue from the Company’s C1, C2 and C3 rental activities and cloud and managed services, but excludes customer recoveries, deferred set up fees and other one-time and variable revenues. MRR does not include the impact from booked-not-billed contracts as of a particular date, unless otherwise specifically noted. |
| (9) | Represents installed utility power and transformation capacity that is available for use by the facility as of September 30, 2015. |
| * | Represents facilities that we lease. |
| ** | Subject to long-term ground lease. |
| *** | Includes 13 facilities. All facilities are leased, including those subject to capital leases. |
10 QTS Q3 Earnings 2015 | Contact: IR@qtsdatacenters.com |
Redevelopment Costs Summary
(in millions, except NRSF data)
During the third quarter of 2015, the Company brought online approximately 3.5 megawatts of gross power and approximately 22,000 NRSF of raised floor and customer specific capital at our Atlanta-Metro, Dallas-Fort Worth and Carpathia vault data centers at an aggregate cost of approximately $36 million. The under construction table below summarizes the Company’s outlook for development projects which it expects to complete by December 31, 2015 (in millions).
| | | Under Construction Costs (1) |
| Property | | Actual (2) | | | Estimated Cost to
Completion (3) | | | Total | | | Expected
Completion date |
| Richmond | | $ | 36 | | | $ | 18 | | | $ | 54 | | | Q4 2015 |
| Atlanta-Metro | | | 10 | | | | 8 | | | | 18 | | | Q4 2015 |
| Totals | | $ | 46 | | | $ | 26 | | | $ | 72 | | | |
| (1) | In addition to projects currently under construction, the Company’s near-term redevelopment projects are expected to be delivered in a modular manner, and the Company currently expects to invest additional capital to complete these near term projects. The ultimate timing and completion of, and the commitment of capital to, the Company’s future redevelopment projects are within the Company’s discretion and will depend upon a variety of factors, including the actual contracts executed, availability of financing and the Company’s estimation of the future market for data center space in each particular market. |
| (2) | Actual costs under construction through September 30, 2015. In addition to the $46 million of construction costs incurred through September 30, 2015 for redevelopment expected to be completed by December 31, 2015, as of September 30, 2015 the Company had incurred $308 million of additional costs (including acquisition costs and other capitalized costs) for other redevelopment projects that are expected to be completed after December 31, 2015. |
| (3) | Represents management’s estimate of the additional costs required to complete the current NRSF under development. There may be an increase in costs if customers’ requirements exceed the Company’s current basis of design. |
11 QTS Q3 Earnings 2015 | Contact: IR@qtsdatacenters.com |
Redevelopment Summary
(in millions, except NRSF data)
The following redevelopment table presents an overview of the Company’s redevelopment pipeline, based on information as of September 30, 2015. This table shows the Company’s ability to increase its raised floor of 1,076,142 square feet by approximately 2.0 times to 2.2 million square feet as of September 30, 2015.
| Raised Floor NRSF | | | |
| Overview as of September 30, 2015 | | | |
| Property | | Current NRSF
in Service | | | Under
Construction (1) | | | Future
Available (2) | | | Basis of Design
NRSF | | | Approximate
Adjacent Acreage of
Land (3) | |
| Richmond | | | 121,623 | | | | 30,000 | | | | 405,000 | | | | 556,623 | | | | 111.1 | |
| Atlanta-Metro | | | 417,986 | | | | 15,000 | | | | 94,200 | | | | 527,186 | | | | 6.0 | |
| Dallas-Fort Worth | | | 54,014 | | | | - | | | | 237,986 | | | | 292,000 | | | | 15.0 | |
| Princeton | | | 58,157 | | | | - | | | | 100,000 | | | | 158,157 | | | | 65.0 | |
| Atlanta-Suwanee | | | 185,422 | | | | - | | | | 22,586 | | | | 208,008 | | | | 15.4 | |
| Santa Clara | | | 55,494 | | | | - | | | | 24,853 | | | | 80,347 | | | | - | |
| Sacramento | | | 54,595 | | | | - | | | | 3,311 | | | | 57,906 | | | | - | |
| Jersey City | | | 31,503 | | | | - | | | | 21,241 | | | | 52,744 | | | | - | |
| Chicago | | | - | | | | - | | | | 133,000 | | | | 133,000 | | | | 23.0 | |
| Miami | | | 19,887 | | | | - | | | | - | | | | 19,887 | | | | - | |
| Carpathia facilities | | | 72,332 | | | | - | | | | 23,948 | | | | 96,280 | | | | - | |
| Other | | | 5,129 | | | | - | | | | - | | | | 5,129 | | | | - | |
| Totals as of September 30, 2015 | | | 1,076,142 | | | | 45,000 | | | | 1,066,125 | | | | 2,187,267 | | | | 235.5 | |
| (1) | Reflects NRSF at a facility for which the initiation of substantial activities has begun to prepare the property for its intended use on or before December 31, 2015. |
| (2) | Reflects NRSF at a facility for which the initiation of substantial activities has begun to prepare the property for its intended use after December 31, 2015. |
| (3) | The total cost basis of adjacent land, which is land available for the future development, is approximately $20 million. This is included in land on the Combined Consolidated Balance Sheets. The Basis of Design NRSF does not include any build-out on the adjacent land. |
12 QTS Q3 Earnings 2015 | Contact: IR@qtsdatacenters.com |
NOI by Facility and Capital Expenditure Summary
(unaudited and in thousands)
The Company calculates net operating income, or NOI, as net income (loss), excluding: interest expense, interest income, depreciation and amortization, write-off of unamortized deferred financing costs, tax expense of taxable REIT subsidiaries, gain on extinguishment of debt, transaction and integration costs, gain on legal settlement, gain on sale of real estate, restructuring charge and general and administrative expenses. The Company believes that NOI is another metric that is often utilized to evaluate returns on operating real estate from period to period and also, in part, to assess the value of the operating real estate. The breakdown of NOI by facility is shown below:
| | | Three Months Ended | | | Nine Months Ended | |
| | | September 30, | | | June 30, | | | September 30, | | | September 30, | |
| | | 2015 | | | 2015 | | | 2014 | | | 2015 | | | 2014 | |
| Breakdown of NOI by facility: | | | | | | | | | | | | | | | | | | | | |
| Atlanta-Metro data center | | $ | 17,964 | | | $ | 16,875 | | | $ | 14,752 | | | $ | 51,605 | | | $ | 44,348 | |
| Atlanta-Suwanee data center | | | 10,376 | | | | 10,094 | | | | 9,046 | | | | 30,600 | | | | 25,798 | |
| Santa Clara data center | | | 3,615 | | | | 3,574 | | | | 3,301 | | | | 10,566 | | | | 9,349 | |
| Richmond data center | | | 5,340 | | | | 4,933 | | | | 3,772 | | | | 14,528 | | | | 10,158 | |
| Sacramento data center | | | 1,870 | | | | 1,900 | | | | 1,938 | | | | 5,641 | | | | 6,601 | |
| Princeton data center | | | 2,331 | | | | 2,310 | | | | 2,066 | | | | 6,990 | | | | 2,089 | |
| Dallas-Fort Worth data center | | | 1,532 | | | | 1,462 | | | | 420 | | | | 3,743 | | | | 420 | |
| Carpathia data centers | | | 12,460 | | | | 2,250 | | | | - | | | | 14,710 | | | | - | |
| Other facilities | | | 1,015 | | | | 1,214 | | | | 904 | | | | 3,297 | | | | 2,629 | |
| NOI (1) | | $ | 56,503 | | | $ | 44,612 | | | $ | 36,199 | | | $ | 141,680 | | | $ | 101,392 | |
| (1) | Includes facility level G&A allocation charges of 4% of revenue for QTS entities and 10% of revenue for Carpathia entities which aggregated to $4.9 million, $2.7 million and $2.3 million, for the three month periods ended September 30, 2015, June 30, 2015, and September 30, 2014, respectively, and $10.1 million and $6.3 million for the nine month periods ended September 30, 2015 and 2014, respectively. |
13 QTS Q3 Earnings 2015 | Contact: IR@qtsdatacenters.com |
Capital expenditures incurred are summarized as follows:
| | | Capital Expenditures (1) | |
| | | Three Months Ended September 30, | | | Nine Months Ended September 30, | |
| | | 2015 | | | 2014 | | | 2015 | | | 2014 | |
| Redevelopment | | $ | 61,345 | | | $ | 32,136 | | | $ | 225,828 | | | $ | 124,655 | |
| Acquisitions (2) | | | - | | | | 17,764 | | | | 332,697 | | | | 91,064 | |
| Maintenance capital expenditures | | | 1,408 | | | | 1,877 | | | | 2,034 | | | | 1,972 | |
| Other capitalized costs | | | 6,255 | | | | 4,134 | | | | 18,100 | | | | 13,383 | |
| Total capital expenditures | | $ | 69,008 | | | $ | 55,911 | | | $ | 578,659 | | | $ | 231,074 | |
| (1) | Does not include capitalized leasing commissions included in deferred costs or other management-related fixed assets included in other assets. |
| (2) | The nine months ended September 30, 2015 reflects the total consideration transferred for the Carpathia acquisition on June 16, 2015 (excluding the assumption of $21.7 million in deferred tax liabilities assumed). The 2014 periods reflect the total consideration transferred for the acquisition of the Princeton facility on June 30, 2014 and the acquisition of the Chicago facility on July 8, 2014, in their respective periods. |
14 QTS Q3 Earnings 2015 | Contact: IR@qtsdatacenters.com |
Leasing Statistics – Signed Leases
The mix of leasing activity has a significant impact on quarterly rates, both within major product segments and for overall blended leasing rates. The Company’s rate performance will vary quarter to quarter based on the mix of deals leased – C1 Custom Data Center, C2 Colocation (Cabinet, Cage and Suite), and C3 Cloud and Managed Services categories all vary on a rate per square foot basis. The amounts below include renewals when there was a change in square footage rented, but not renewals where square footage remained consistent before and after renewal (See renewal table on page 17 for such renewals).
During the third quarter of 2015, the Company signed 448 new and modified leases aggregating to $12.7 million of annualized rent which includes new leased revenue plus revenue from modified renewals. Removing annualized modified renewal MRR and deducting period downgrades results in $5.6 million in incremental annualized rent for the quarter. The large increase in C1 rent per square foot was attributable to several C1 customers purchasing additional power, but no additional space. While the Company did not sign any significant C1 leases during the third quarter of 2015, it did continue to see solid leasing activity in its C2/C3 categories, with increased pricing on a per square foot basis attributable to customers utilizing additional services with those leases. This C2/C3 leasing activity continues to support the Company’s belief in its investment in its 3C platform.
Annualized Rent of New and Modified Leases represents total MRR associated with all new and modified leases for the respective periods for the purposes of computing annualized rent rates per square foot during the period. Incremental Annualized Rent, Net of Downgrades reflects net incremental MRR signed during the period for purposes of tracking incremental revenue contribution.
| | | Period | | Number of
Leases | | Total Leased
sq ft | | | Annualized
Rent per
Leased sq ft | | | Annualized
Rent of New
and Modified
Leases | | | Incremental
Annualized
Rent, Net of
Downgrades | |
| | | | | | | | | | | | | | | | | |
| New/modified leases signed - Total | | Q3 2015 | | 448 | | | 7,513 | | | $ | 1,686 | | | $ | 12,669,407 | | | $ | 5,582,511 | |
| | | P4QA* | | 353 | | | 50,533 | | | | 434 | | | | 21,912,014 | | | | 13,487,611 | |
| | | Q2 2015 | | 365 | | | 13,867 | | | | 1,207 | | | | 16,734,571 | | | | 10,585,921 | |
| | | Q1 2015 | | 340 | | | 47,052 | | | | 590 | | | | 27,778,291 | | | | 13,618,400 | |
| | | Q4 2014 | | 347 | | | 10,596 | | | | 1,011 | | | | 10,717,456 | | | | 4,116,717 | |
| | | Q3 2014 | | 361 | | | 130,617 | | | | 248 | | | | 32,417,738 | | | | 25,629,407 | |
| | | | | | | | | | | | | | | | | | | | | |
| New/modified leases signed - C1 | | Q3 2015 | | 20 | | | 128 | | | $ | 3,983 | | | $ | 509,776 | | | | | |
| | | P4QA* | | 19 | | | 38,251 | | | | 224 | | | | 8,554,275 | | | | | |
| | | Q2 2015 | | 22 | | | 644 | | | | 831 | | | | 535,306 | | | | | |
| | | Q1 2015 | | 18 | | | 30,386 | | | | 340 | | | | 10,333,301 | | | | | |
| | | Q4 2014 | | 21 | | | 315 | | | | 580 | | | | 182,772 | | | | | |
| | | Q3 2014 | | 15 | | | 121,658 | | | | 190 | | | | 23,165,719 | | | | | |
| | | | | | | | | | | | | | | | | | | | | |
| New/modified leases signed - C2/C3 | | Q3 2015 | | 428 | | | 7,385 | | | $ | 1,647 | | | $ | 12,159,631 | | | | | |
| | | P4QA* | | 334 | | | 12,282 | | | | 1,088 | | | | 13,357,739 | | | | | |
| | | Q2 2015 | | 343 | | | 13,223 | | | | 1,225 | | | | 16,199,265 | | | | | |
| | | Q1 2015 | | 322 | | | 16,666 | | | | 1,047 | | | | 17,444,990 | | | | | |
| | | Q4 2014 | | 326 | | | 10,281 | | | | 1,025 | | | | 10,534,684 | | | | | |
| | | Q3 2014 | | 346 | | | 8,959 | | | | 1,033 | | | | 9,252,019 | | | | | |
| * | Average of prior 4 quarters |
NOTE: Figures above do not include cost recoveries. In general, C1 customers reimburse the Company for certain operating costs whereas C2/C3 customers are on a gross lease basis. As a result, pricing and resulting per square foot rates for C2/C3 customers includes the recovery of such operating costs.
15 QTS Q3 Earnings 2015 | Contact: IR@qtsdatacenters.com |
The following table outlines the booked-not-billed (“BNB”) balance as of September 30, 2015 and how that will affect revenue in 2015 and subsequent years:
| Booked-not-billed ("BNB") | | 2015 | | | 2016 | | | Thereafter | | | Total | |
| MRR | | $ | 1,876,807 | | | $ | 1,777,842 | | | $ | 1,455,723 | | | $ | 5,110,372 | |
| Incremental revenue | | | 4,146,438 | | | | 15,373,238 | | | | 17,468,675 | | | | | |
| Annualized revenue | | | 22,521,683 | | | | 21,334,110 | | | | 17,468,675 | | | | 61,324,468 | |
The Company estimates the remaining cost to provide the space, power, connectivity and other services to the customer contracts which had not billed as of September 30, 2015 to be approximately $40 million. This estimate generally includes C1 customers with newly contracted space of more than 3,300 square feet. The space, power, connectivity and other services provided to customers that contract for smaller amounts of space is generally provided by existing space which was previously developed.
16 QTS Q3 Earnings 2015 | Contact: IR@qtsdatacenters.com |
Leasing Statistics – Renewed Leases and
Rental Churn
The mix of leasing activity has a significant impact on quarterly rates, both within major product segments and for overall blended renewal rates. The Company’s rate performance will vary quarter to quarter based on the mix of deals leased – C1 Custom Data Center, C2 Colocation, and C3 Cloud and Managed Services categories all vary on a rate per square foot basis.
Consistent with the Company’s 3C strategy and business model, the renewal rates below reflect total MRR per square foot including all subscribed services. For comparability, the Company includes only those customers that have maintained consistent space footprints in the computations below. All customers with space changes are incorporated into new/modified leasing statistics and rates.
The overall blended rate for renewals signed in the third quarter of 2015 was 0.9% higher than the rates for those customers immediately prior to renewal. In C1, QTS had a significant increase of 18%, which was due to a customer increasing power requirements within their existing space. In C2/C3, there was a minor decrease in pricing which was primarily driven by a few customers reducing their service levels without changing their space requirements. Thus, in aggregate, the renewal rate change in the third quarter of 2015 is in line with the Company’s expectation of low to mid-single digit increases.
Rental Churn (which the Company defines as MRR lost to complete termination of customer services in a given period compared to total MRR at the beginning of the period) was 0.8% for the third quarter of 2015 and 2.0% for the nine months ended September 30, 2015. The Company expects churn for the full year 2015 to be 3-5%.
| | | Period | | Number of
renewed leases | | Total Leased sq
ft | | | Annualized
rent per leased
sq ft | | | Annualized
Rent | | | Rent Change(1) | |
| | | | | | | | | | | | | | | | | |
| Renewed Leases - Total | | Q3 2015 | | 89 | | | 12,338 | | | $ | 742 | | | $ | 9,157,450 | | | | 0.9 | % |
| | | P4QA* | | 66 | | | 7,472 | | | | 804 | | | | 6,010,456 | | | | 0.6 | % |
| | | Q2 2015 | | 76 | | | 9,540 | | | | 785 | | | | 7,492,287 | | | | 5.1 | % |
| | | Q1 2015 | | 65 | | | 6,291 | | | | 863 | | | | 5,427,185 | | | | 1.2 | % |
| | | Q4 2014 | | 64 | | | 6,317 | | | | 940 | | | | 5,941,125 | | | | 3.4 | % |
| | | Q3 2014 | | 59 | | | 7,740 | | | | 669 | | | | 5,181,226 | | | | -2.9 | % |
| | | | | | | | | | | | | | | | | | | | | |
| | | | | | | | | | | | | | | | | | | | | |
| Renewed Leases - C1 | | Q3 2015 | | 3 | | | 3,200 | | | $ | 297 | | | $ | 951,180 | | | | 17.9 | % |
| | | P4QA* | | - | | | - | | | | - | | | | - | | | | 0.0 | % |
| | | Q2 2015 | | - | | | - | | | | - | | | | - | | | | 0.0 | % |
| | | Q1 2015 | | - | | | - | | | | - | | | | - | | | | 0.0 | % |
| | | Q4 2014 | | - | | | - | | | | - | | | | - | | | | 0.0 | % |
| | | Q3 2014 | | - | | | - | | | | - | | | | - | | | | 0.0 | % |
| | | | | | | | | | | | | | | | | | | | | |
| | | | | | | | | | | | | | | | | | | | | |
| Renewed Leases - C2/C3 | | Q3 2015 | | 86 | | | 9,138 | | | $ | 898 | | | $ | 8,206,270 | | | | -0.7 | % |
| | | P4QA* | | 66 | | | 7,472 | | | | 804 | | | | 6,010,456 | | | | 0.6 | % |
| | | Q2 2015 | | 76 | | | 9,540 | | | | 785 | | | | 7,492,287 | | | | 5.1 | % |
| | | Q1 2015 | | 65 | | | 6,291 | | | | 863 | | | | 5,427,185 | | | | 1.2 | % |
| | | Q4 2014 | | 64 | | | 6,317 | | | | 940 | | | | 5,941,125 | | | | 3.4 | % |
| | | Q3 2014 | | 59 | | | 7,740 | | | | 669 | | | | 5,181,226 | | | | -2.9 | % |
| * | Average of prior 4 quarters |
| (1) | Calculated as the percentage change of the rent per square foot immediately before renewal when compared to the rent per square foot immediately after renewal. |
17 QTS Q3 Earnings 2015 | Contact: IR@qtsdatacenters.com |
Leasing Statistics – Commenced Leases
The mix of leasing activity across C1, C2 and C3 has significant impact on quarterly rates, both within major product segments and for overall blended commencement rates. The Company’s rate performance will vary quarter to quarter based on the mix of deals leased. C1 Custom Data Center, C2 Colocation, and C3 Cloud and Managed Services categories all vary on a rate per square foot basis.
During the third quarter of 2015, the Company commenced customer leases (which includes both new customers and existing customers that modified their lease terms) representing approximately $37.9 million of annualized rent at $490 per square foot. This compares to customer leases representing an aggregate trailing four quarter average of approximately $20.6 million of annualized rent at $523 per square foot. $13.8 million in annualized rent of commenced leases was contributed by Carpathia in the third quarter.
The annualized rent per leased square foot for C1 was due to the impact of a large C1 customer which continued to ramp in the third quarter of 2015. The C2/C3 average commencement rate for the third quarter of 2015 was $882 per square foot with rates impacted by larger C2 customers and a lower level of service related to those customers.
| | | Period | | Number of leases | | Total Leased sq ft | | | Annualized rent
per leased sq ft | | | Annualized Rent | |
| | | | | | | | | | | | | | |
| Leases commenced - Total | | Q3 2015 | | 651 | | | 77,273 | | | $ | 490 | | | $ | 37,887,304 | |
| | | P4QA* | | 402 | | | 39,299 | | | | 523 | | | | 20,567,432 | |
| | | Q2 2015 | | 459 | | | 51,248 | | | | 525 | | | | 26,884,427 | |
| | | Q1 2015 | | 369 | | | 21,813 | | | | 817 | | | | 17,829,577 | |
| | | Q4 2014 | | 401 | | | 48,080 | | | | 391 | | | | 18,815,804 | |
| | | Q3 2014 | | 379 | | | 36,054 | | | | 520 | | | | 18,739,920 | |
| | | | | | | | | | | | | | | | | |
| Leases commenced - C1 | | Q3 2015 | | 33 | | | 43,199 | | | $ | 181 | | | $ | 7,822,312 | |
| | | P4QA* | | 31 | | | 24,262 | | | | 183 | | | | 4,430,303 | |
| | | Q2 2015 | | 37 | | | 29,622 | | | | 168 | | | | 4,961,821 | |
| | | Q1 2015 | | 21 | | | 8,289 | | | | 215 | | | | 1,780,368 | |
| | | Q4 2014 | | 30 | | | 34,657 | | | | 176 | | | | 6,112,759 | |
| | | Q3 2014 | | 35 | | | 24,480 | | | | 199 | | | | 4,866,264 | |
| | | | | | | | | | | | | | | | | |
| Leases commenced - C2/C3 | | Q3 2015 | | 618 | | | 34,074 | | | $ | 882 | | | $ | 30,064,992 | |
| | | P4QA* | | 371 | | | 15,037 | | | | 1,090 | | | | 16,397,147 | |
| | | Q2 2015 | | 422 | | | 21,626 | | | | 1,014 | | | | 21,922,606 | |
| | | Q1 2015 | | 348 | | | 13,524 | | | | 1,264 | | | | 17,089,279 | |
| | | Q4 2014 | | 371 | | | 13,423 | | | | 946 | | | | 12,703,045 | |
| | | Q3 2014 | | 344 | | | 11,574 | | | | 1,199 | | | | 13,873,656 | |
| * | Average of prior 4 quarters |
18 QTS Q3 Earnings 2015 | Contact: IR@qtsdatacenters.com |
Lease Expirations
C1 leases are typically 5-10 years with the majority of C1 lease expirations occurring in 2017 and beyond. C2/C3 leases are typically 3 years in duration, thus the majority of C2/C3 lease expirations are in 2016 and 2017. The following table sets forth a summary schedule of the lease expirations as of September 30, 2015 at the properties in the Company’s portfolio. Unless otherwise stated in the footnotes, the information set forth in the table assumes that customers exercise no renewal options and all early termination rights are exercised:
Year of Lease
Expiration | | Number of
Leases
Expiring(1) | | | Total Raised
Floor of
Expiring
Leases | | | % of
Portfolio
Leased
Raised Floor | | | Annualized
Rent(2) | | | % of
Portfolio
Annualized
Rent | | | C1 as % of
Portfolio
Annualized
Rent | | | C2 as % of
Portfolio
Annualized
Rent | | | C3 as % of
Portfolio
Annualized
Rent | |
| Month-to-Month(3) | | | 352 | | | | 5,513 | | | | 1 | % | | $ | 10,092,846 | | | | 3 | % | | | 0 | % | | | 2 | % | | | 1 | % |
| 2015 | | | 359 | | | | 17,295 | | | | 2 | % | | | 20,332,611 | | | | 6 | % | | | 0 | % | | | 3 | % | | | 3 | % |
| 2016 | | | 1,493 | | | | 90,110 | | | | 12 | % | | | 83,682,558 | | | | 27 | % | | | 3 | % | | | 14 | % | | | 10 | % |
| 2017 | | | 962 | | | | 111,925 | | | | 15 | % | | | 66,925,448 | | | | 21 | % | | | 5 | % | | | 11 | % | | | 5 | % |
| 2018 | | | 605 | | | | 278,603 | | | | 38 | % | | | 78,617,276 | | | | 25 | % | | | 12 | % | | | 10 | % | | | 3 | % |
| 2019 | | | 111 | | | | 18,839 | | | | 3 | % | | | 8,953,430 | | | | 3 | % | | | 1 | % | | | 2 | % | | | 0 | % |
| After 2019 | | | 141 | | | | 213,288 | | | | 29 | % | | | 45,969,429 | | | | 15 | % | | | 11 | % | | | 3 | % | | | 1 | % |
| | | | | | | | | | | | | | | | | | | | | | | | | | | | | | | | | |
| Portfolio Total | | | 4,023 | | | | 735,574 | | | | 100 | % | | $ | 314,573,597 | | | | 100 | % | | | 32 | % | | | 44 | % | | | 23 | % |
| (1) | Represents each agreement with a customer signed as of September 30, 2015 for which billing has commenced; a lease agreement could include multiple spaces and a customer could have multiple leases. |
| (2) | Annualized rent is presented for leases commenced as of September 30, 2015. The Company defines annualized rent as MRR multiplied by 12. The Company calculates MRR as monthly contractual revenue under signed leases as of a particular date, which includes revenue from our C1, C2 and C3 rental and cloud and managed services activities, but excludes customer recoveries, deferred set-up fees, variable related revenues, non-cash revenues and other one-time revenues. MRR does not include the impact from booked-not-billed leases as of a particular date, unless otherwise specifically noted. This amount reflects the annualized cash rental payments. It does not reflect the accounting associated with any free rent, rent abatements or future scheduled rent increases and also excludes operating expense and power reimbursements. |
| (3) | Consists of customers whose leases expired prior to September 30, 2015 and have continued on a month-to-month basis. |
19 QTS Q3 Earnings 2015 | Contact: IR@qtsdatacenters.com |
Largest Customers
As of September 30, 2015, the Company’s portfolio was leased to over 1,000 customers comprised of companies of all sizes representing an array of industries, each with unique and varied business models and needs. The following table sets forth information regarding the ten largest customers in the portfolio based on annualized rent as of September 30, 2015 (does not include rents or maturities associated with booked-not-billed customers or ramps for existing customers which have not yet commenced billing):
| Principal Customer Industry | | Product | | Number of
Locations | | Annualized Rent (1) | | | % of Portfolio
Annualized Rent | | | Weighted Average
Remaining Lease
Term (Months) (2) | |
| Internet | | C1 | | 2 | | $ | 25,714,404 | | | | 8.2 | % | | | 49 | |
| Technology | | C2, C3 | | 6 | | | 12,797,111 | | | | 4.1 | % | | | 16 | |
| Government | | C2, C3 | | 2 | | | 10,552,988 | | | | 3.4 | % | | | 28 | |
| Information Technology | | C1, C3 | | 3 | | | 9,934,445 | | | | 3.2 | % | | | 103 | |
| Internet | | C1 | | 1 | | | 9,644,400 | | | | 3.1 | % | | | 37 | |
| Information Technology | | C1 | | 2 | | | 8,945,964 | | | | 2.8 | % | | | 102 | |
| Technology | | C2, C3 | | 3 | | | 6,472,121 | | | | 2.1 | % | | | 10 | |
| Financial Services | | C2, C3 | | 1 | | | 4,885,524 | | | | 1.6 | % | | | 27 | |
| Financial Services | | C1 | | 1 | | | 4,381,920 | | | | 1.4 | % | | | 16 | |
| Information Technology | | C2, C3 | | 2 | | | 4,151,722 | | | | 1.3 | % | | | 22 | |
| Total / Weighted Average | | | | | | $ | 97,480,598 | | | | 31.0 | % | | | 45 | |
| (1) | Annualized rent is presented for leases commenced as of September 30, 2015. We define annualized rent as MRR multiplied by 12. We calculate MRR as monthly contractual revenue under signed leases as of a particular date, which includes revenue from our C1, C2 and C3 rental and cloud and managed services activities, but excludes customer recoveries, deferred set-up fees, variable related revenues, non-cash revenues and other one-time revenues. MRR does not include the impact from booked-not-billed leases as of a particular date. This amount reflects the annualized cash rental payments. It does not reflect any free rent, rent abatements or future scheduled rent increases and also excludes operating expense and power reimbursements. |
| (2) | Weighted average based on customer’s percentage of total annualized rent expiring and is as of September 30, 2015. |
20 QTS Q3 Earnings 2015 | Contact: IR@qtsdatacenters.com |
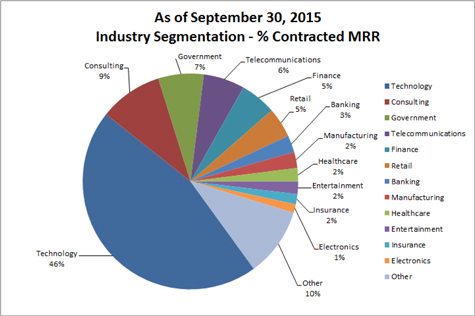
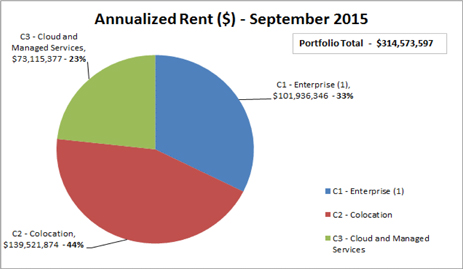
Industry Segmentation
The following table sets forth information relating to the industry segmentation as of September 30, 2015:
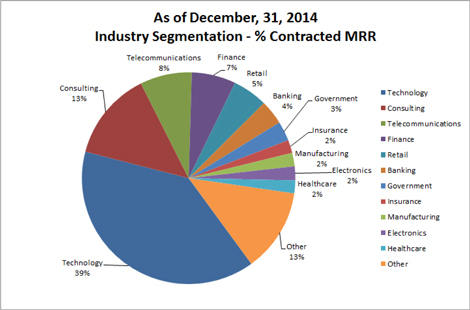
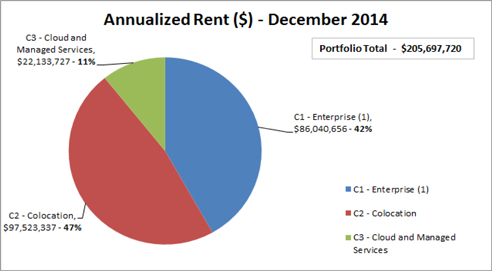
The following table sets forth information relating to the industry segmentation as of December 31, 2014:
21 QTS Q3 Earnings 2015 | Contact: IR@qtsdatacenters.com |
Product Diversification
The following table sets forth information relating to the distribution of leases at the properties, by type of product offering, as of September 30, 2015:
| (1) | As of September 30, 2015, C1 customers renting at least 6,600 square feet represented $53.8 million of annualized C1 MRR, C1 customers renting 3,300 square feet to 6,599 square feet represented $19.2 million of annualized C1 MRR, and C1 customers renting below 3,300 square feet represented $21.3 million of annualized C1 MRR. As of September 30, 2015, C1 customers’ median used square footage was 4,000 square feet. |
The following table sets forth information relating to the distribution of leases at the properties, by type of product offering, as of December 31, 2014:
| (1) | As of December 31, 2014, C1 customers renting at least 6,600 square feet represented $52.0 million of annualized C1 MRR, C1 customers renting between 3,300 and 6,599 square feet represented $17.9 million of annualized C1 MRR, and C1 customers renting below 3,300 square feet represented $16.1 million of annualized C1 MRR. As of December 31, 2014, C1 customers’ median used square footage was 3,856 square feet. |
22 QTS Q3 Earnings 2015 | Contact: IR@qtsdatacenters.com |
Debt Summary and Debt Maturities
(in thousands)
| | | September 30, | | | December 31, | |
| | | 2015 | | | 2014 | |
| Unsecured Credit Facility | | $ | 400,000 | | | $ | 239,838 | |
| Senior Notes, net of discount | | | 297,914 | | | | 297,729 | |
| Richmond Credit Facility | | | 70,000 | | | | 70,000 | |
| Atlanta-Metro Equipment Loan | | | - | | | | 16,600 | |
| Capital Lease and Lease Financing Obligations | | | 53,023 | | | | 13,062 | |
| Total | | $ | 820,937 | | | $ | 637,229 | |
As of September 30, 2015:
| Debt instruments | | 2015 | | | 2016 | | | 2017 | | | 2018 | | | 2019 | | | Thereafter | | | Total | |
| Unsecured Credit Facility (1) | | $ | - | | | $ | - | | | $ | - | | | $ | 300,000 | | | $ | 100,000 | | | $ | - | | | $ | 400,000 | |
| Senior Notes (2) | | | - | | | | - | | | | - | | | | - | | | | - | | | | 300,000 | | | | 300,000 | |
| Richmond Credit Facility | | | - | | | | - | | | | - | | | | - | | | | 70,000 | | | | - | | | | 70,000 | |
| Capital Lease and Lease Financing Obligations | | | 3,262 | | | | 12,558 | | | | 12,388 | | | | 8,804 | | | | 2,461 | | | | 13,550 | | | | 53,023 | |
| Total | | $ | 3,262 | | | $ | 12,558 | | | $ | 12,388 | | | $ | 308,804 | | | $ | 172,461 | | | $ | 313,550 | | | $ | 823,023 | |
| (1) | Pursuant to a credit agreement amendment that the Company entered into on December 17, 2014, the revolving portion of the Unsecured Credit Facility has a stated maturity of December 17, 2018 with an option to extend for one additional year. |
| (2) | Excludes discount reflected at September 30, 2015. |
23 QTS Q3 Earnings 2015 | Contact: IR@qtsdatacenters.com |
In October 2015, the Company amended its unsecured credit facility, increasing the total capacity by $250 million and extending the term. At the same time, the Company terminated its $120 million secured credit facility relating to the Richmond asset. The amended unsecured credit facility has a total capacity of $900 million and includes a $150 million term loan which matures in approximately 5 years, another $150 million term loan which matures in 5.5 years and a $600 million revolving credit facility which matures in approximately 4 years, with a one year extension option. It also provides for lower borrowing rates of approximately 15 basis points. The unsecured credit facility also includes a $200 million accordion feature. Taking into account the amended unsecured credit facility, the Company’s pro forma total liquidity as of September 30, 2015 was approximately $441 million including cash and cash equivalents and availability under the amended unsecured credit facility. If the amendment had closed prior to September 30, 2015, the Company’s debt maturity schedule would appear as follows:
| Debt instruments | | 2015 | | | 2016 | | | 2017 | | | 2018 | | | 2019 | | | Thereafter | | | Total | |
| Unsecured Credit Facility (1) | | $ | - | | | $ | - | | | $ | - | | | $ | - | | | $ | 170,000 | | | $ | 300,000 | | | $ | 470,000 | |
| Senior Notes (2) | | | - | | | | - | | | | - | | | | - | | | | - | | | | 300,000 | | | | 300,000 | |
| Capital Lease and Lease Financing Obligations | | | 3,262 | | | | 12,558 | | | | 12,388 | | | | 8,804 | | | | 2,461 | | | | 13,550 | | | | 53,023 | |
| Total | | $ | 3,262 | | | $ | 12,558 | | | $ | 12,388 | | | $ | 8,804 | | | $ | 172,461 | | | $ | 613,550 | | | $ | 823,023 | |
| (1) | Pursuant to a credit agreement amendment that the Company entered into in October 2015, the revolving portion of the Unsecured Credit Facility has a stated maturity of December 17, 2019 with an option to extend for one additional year. |
| (2) | Excludes discount reflected at September 30, 2015. |
24 QTS Q3 Earnings 2015 | Contact: IR@qtsdatacenters.com |
Interest Summary
(unaudited and in thousands)
| | | Three Months Ended | | | Nine Months Ended | |
| | | September 30, | | | June 30, | | | September 30, | | | September 30, | | | September 30, | |
| | | 2015 | | | 2015 | | | 2014 | | | 2015 | | | 2014 | |
| Interest expense and fees | | $ | 7,279 | | | $ | 6,367 | | | $ | 5,892 | | | $ | 20,117 | | | $ | 12,050 | |
| Swap interest | | | - | | | | - | | | | 158 | | | | - | | | | 482 | |
| Amortization of deferred financing costs and bond discount | | | 849 | | | | 854 | | | | 691 | | | | 2,552 | | | | 1,894 | |
| Capitalized interest (1) | | | (2,710 | ) | | | (2,422 | ) | | | (1,331 | ) | | | (7,110 | ) | | | (4,743 | ) |
| Total interest expense | | $ | 5,418 | | | $ | 4,799 | | | $ | 5,410 | | | $ | 15,559 | | | $ | 9,683 | |
| (1) | The weighted average interest rate for the three months ended September 30, 2015, June 30, 2015, and September 30, 2014 was 4.04%, 4.60%, and 4.62%, respectively. As of September 30, 2015 and December 31, 2014 our weighted average coupon interest rate was 3.48% and 3.95%, respectively. |
25 QTS Q3 Earnings 2015 | Contact: IR@qtsdatacenters.com |
Appendix
Non-GAAP Financial Measures
This document includes certain non-GAAP financial measures that management believes are helpful in understanding the Company’s business, as further described below.
The Company considers the following non-GAAP financial measures to be useful to investors as key supplemental measures of the Company’s performance: (1) FFO; (2) Operating FFO; (3) Adjusted Operating FFO; (4) MRR; (5) NOI; (6) EBITDA; and (7) Adjusted EBITDA. These non-GAAP financial measures should be considered along with, but not as alternatives to, net income or loss and cash flows from operating activities as a measure of the Company’s operating performance and liquidity. FFO, Operating FFO, Adjusted Operating FFO, MRR, NOI, EBITDA and Adjusted EBITDA, as calculated by us, may not be comparable to FFO, Operating FFO, Adjusted Operating FFO, MRR, NOI, EBITDA and Adjusted EBITDA as reported by other companies that do not use the same definition or implementation guidelines or interpret the standards differently from us.
Definitions
C1 – Custom Data Center. Power costs are passed on to customers (metered power); generally 3,000 square feet or more of raised floor; lease term of 5 to 10 years; customers are large corporations, government agencies, and global Internet businesses.
C2 – Colocation. Power overages charged separately; specified kW included in lease; up to 3,000 square feet of raised floor; lease term of up to 3 years; customers are large corporations, small and medium businesses and government agencies.
C3 – Cloud and Managed Services. Power bundled with service; small amounts of space; customers rent managed virtual servers; lease term up to 3 years; customers are large corporations, small and medium businesses and government agencies.
Booked-not-billed (“BNB”). The Company defines booked-not-billed as customer leases that have been signed, but for which lease payments have not yet commenced.
Leasable raised floor. The Company defines leasable raised floor as the amount of raised floor square footage that the Company has leased plus the available capacity of raised floor square footage that is in a leasable format as of a particular date and according to a particular product configuration. The amount of leasable raised floor may change even without completion of new redevelopment projects due to changes in the Company’s configuration of C1, C2 and C3 product space.
Basis-of-design floor space. The Company defines basis-of-design floor space as the total data center raised floor potential of its existing data center facilities.
Operating NRSF. Represents the total square feet of a building that is currently leased or available for lease plus developed supporting infrastructure, based on engineering drawings and estimates, but does not include space held for redevelopment or space used for the Company’s own office space.
The Company. Refers to QTS Realty Trust, Inc., a Maryland corporation, together with its consolidated subsidiaries, including QualityTech, LP.
26 QTS Q3 Earnings 2015 | Contact: IR@qtsdatacenters.com |
FFO, Operating FFO and Adjusted Operating FFO
The Company considers funds from operations (“FFO”), to be a supplemental measure of its performance which should be considered along with, but not as an alternative to, net income (loss) and cash provided by operating activities as a measure of operating performance and liquidity. The Company calculates FFO in accordance with the standards established by the National Association of Real Estate Investment Trusts (“NAREIT”). FFO represents net income (loss) (computed in accordance with GAAP), adjusted to exclude gains (or losses) from sales of property, real estate related depreciation and amortization and similar adjustments for unconsolidated partnerships and joint ventures. The Company’s management uses FFO as a supplemental performance measure because, in excluding real estate related depreciation and amortization and gains and losses from property dispositions, it provides a performance measure that, when compared year over year, captures trends in occupancy rates, rental rates and operating costs.
Due to the volatility and nature of certain significant charges and gains recorded in the Company’s operating results that management believes are not reflective of its core operating performance and liquidity, management computes an adjusted measure of FFO, which the Company refers to as Operating FFO. The Company generally calculates Operating FFO as FFO excluding certain non-routine and often non-cash charges and gains and losses that management believes are not indicative of the results of the Company’s operating real estate portfolio. The Company believes that Operating FFO provides investors with another financial measure that may facilitate comparisons of operating performance and liquidity between periods and, to the extent they calculate Operating FFO on a comparable basis, between REITs.
Adjusted Operating Funds From Operations (“Adjusted Operating FFO”) is a non-GAAP measure that is used as a supplemental operating measure specifically for comparing year over year ability to fund dividend distributions from operating activities. Adjusted Operating FFO is used by the Company as a basis to address cash flow and its ability to fund its dividend payments. The Company calculates Adjusted Operating FFO by adding or subtracting from Operating FFO items such as: maintenance capital investment, paid leasing commissions, amortization of deferred financing costs, non-real estate depreciation, straight line rent adjustments, non-cash deferred taxes and non-cash compensation.
The Company offers these measures because it recognizes that FFO, Operating FFO and Adjusted Operating FFO will be used by investors as a basis to compare its operating performance and liquidity with that of other REITs. However, because FFO, Operating FFO and Adjusted Operating FFO exclude real estate depreciation and amortization and capture neither the changes in the value of the Company’s properties that result from use or market conditions, nor the level of capital expenditures and capitalized leasing commissions necessary to maintain the operating performance of its properties, all of which have real economic effect and could materially impact its financial condition, cash flows and results of operations, the utility of FFO, Operating FFO and Adjusted Operating FFO as measures of its operating performance and liquidity is limited. The Company’s calculation of FFO may not be comparable to measures calculated by other companies that do not use the NAREIT definition of FFO or do not calculate FFO in accordance with NAREIT guidance. In addition, the Company’s calculations of FFO, Operating FFO and Adjusted Operating FFO are not necessarily comparable to FFO, Operating FFO and Adjusted Operating FFO as calculated by other REITs that do not use the same definition or implementation guidelines or interpret the standards differently from us. FFO, Operating FFO and Adjusted Operating FFO are non-GAAP measures and should not be considered a measure of the Company’s results of operations or liquidity or as a substitute for, or an alternative to, net income (loss), cash provided by operating activities or any other performance measure determined in accordance with GAAP, nor is it indicative of funds available to fund its cash needs, including its ability to make distributions to its stockholders.
27 QTS Q3 Earnings 2015 | Contact: IR@qtsdatacenters.com |
| | | Three Months Ended | | | Nine Months Ended | |
| | | September 30, | | | June 30, | | | September 30, | | | September 30, | |
| | | 2015 | | | 2015 | | | 2014 | | | 2015 | | | 2014 | |
| FFO | | | | | | | | | | | | | | | | | | | | |
| Net income | | $ | 8,238 | | | $ | 5,520 | | | $ | 4,006 | | | $ | 18,795 | | | $ | 13,255 | |
| Real estate depreciation and amortization | | | 21,022 | | | | 16,325 | | | | 13,596 | | | | 51,649 | | | | 37,663 | |
| FFO | | | 29,260 | | | | 21,845 | | | | 17,602 | | | | 70,444 | | | | 50,918 | |
| | | | | | | | | | | | | | | | | | | | | |
| Write off of unamortized deferred finance costs | | | - | | | | 83 | | | | 470 | | | | 83 | | | | 580 | |
| Restructuring costs | | | - | | | | - | | | | 226 | | | | - | | | | 1,272 | |
| Integration costs | | | 1,360 | | | | 422 | | | | - | | | | 1,783 | | | | - | |
| Transaction costs | | | 122 | | | | 4,247 | | | | (195 | ) | | | 4,473 | | | | 958 | |
| Non-cash deferred tax benefit associated with transaction and integration costs | | | (1,206 | ) | | | - | | | | - | | | | (1,206 | ) | | | - | |
| Non-cash reversal of deferred tax asset valuation allowance | | | - | | | | (3,175 | ) | | | - | | | | (3,175 | ) | | | - | |
| Operating FFO * | | | 29,536 | | | | 23,422 | | | | 18,103 | | | | 72,402 | | | | 53,728 | |
| | | | | | | | | | | | | | | | | | | | | |
| Maintenance Capex | | | (1,408 | ) | | | (609 | ) | | | (1,877 | ) | | | (2,034 | ) | | | (1,972 | ) |
| Leasing commissions paid | | | (3,005 | ) | | | (3,782 | ) | | | (5,516 | ) | | | (9,871 | ) | | | (10,604 | ) |
| Amortization of deferred financing costs and bond discount | | | 849 | | | | 854 | | | | 522 | | | | 2,552 | | | | 1,725 | |
| Non real estate depreciation and amortization | | | 3,463 | | | | 1,682 | | | | 1,612 | | | | 7,086 | | | | 4,610 | |
| Straight line rent revenue | | | (1,463 | ) | | | (1,371 | ) | | | (961 | ) | | | (3,270 | ) | | | (1,283 | ) |
| Straight line rent expense | | | 984 | | | | 211 | | | | 72 | | | | 1,266 | | | | 221 | |
| Non-cash deferred tax benefit from operating results | | | (1,354 | ) | | | - | | | | - | | | | (1,354 | ) | | | - | |
| Equity-based compensation expense | | | 2,068 | | | | 1,831 | | | | 925 | | | | 5,206 | | | | 2,901 | |
| Adjusted Operating FFO * | | $ | 29,670 | | | $ | 22,238 | | | $ | 12,880 | | | $ | 71,983 | | | $ | 49,326 | |
| * | The Company’s calculations of Operating FFO and Adjusted Operating FFO may not be comparable to Operating FFO and Adjusted Operating FFO as calculated by other REITs that do not use the same definition. |
Monthly Recurring Revenue (MRR)
The Company calculates MRR as monthly contractual revenue under signed leases as of a particular date, which includes revenue from its C1, C2 and C3 rental and cloud and managed services activities, but excludes customer recoveries, deferred set-up fees, variable related revenues, non-cash revenues and other one-time revenues. MRR does not include the impact from booked-not-billed leases as of a particular date, unless otherwise specifically noted.
Separately, the Company calculates recognized MRR as the recurring revenue recognized during a given period, which includes revenue from its C1, C2 and C3 rental and cloud and managed services activities, but excludes customer recoveries, deferred set-up fees, variable related revenues, non-cash revenues and other one-time revenues.
Management uses MRR and recognized MRR as supplemental performance measures because they provide useful measures of increases in contractual revenue from the Company’s customer leases. MRR and recognized MRR should not be viewed by investors as alternatives to actual monthly revenue, as determined in accordance with GAAP. Other companies may not calculate MRR or recognized MRR in the same manner. Accordingly, the Company’s MRR and recognized MRR may not be comparable to other companies’ MRR and recognized MRR. MRR and recognized MRR should be considered only as supplements to total revenues as a measure of its performance. MRR and recognized MRR should not be used as measures of the Company’s results of operations or liquidity, nor is it indicative of funds available to meet its cash needs, including its ability to make distributions to its stockholders.
28 QTS Q3 Earnings 2015 | Contact: IR@qtsdatacenters.com |
| | | Three Months Ended | | | Nine Months Ended | |
| | | September 30, | | | June 30, | | | September 30, | | | September 30, | |
| | | 2015 | | | 2015 | | | 2014 | | | 2015 | | | 2014 | |
| Recognized MRR in the period | | | | | | | | | | | | | | | | | | | | |
| Total period revenues (GAAP basis) | | $ | 88,890 | | | $ | 68,117 | | | $ | 57,945 | | | $ | 218,393 | | | $ | 158,226 | |
| Less: Total period recoveries | | | (6,158 | ) | | | (5,582 | ) | | | (6,131 | ) | | | (17,404 | ) | | | (13,674 | ) |
| Total period deferred setup fees | | | (1,477 | ) | | | (1,412 | ) | | | (1,125 | ) | | | (4,135 | ) | | | (3,508 | ) |
| Total period straight line rent and other | | | (2,959 | ) | | | (3,170 | ) | | | (1,726 | ) | | | (8,221 | ) | | | (3,711 | ) |
| Recognized MRR in the period | | | 78,296 | | | | 57,953 | | | | 48,963 | | | | 188,633 | | | | 137,333 | |
| | | | | | | | | | | | | | | | | | | | | |
| MRR at period end | | | | | | | | | | | | | | | | | | | | |
| Total period revenues (GAAP basis) | | $ | 88,890 | | | $ | 68,117 | | | $ | 57,945 | | | $ | 218,393 | | | $ | 158,226 | |
| Less: Total revenues excluding last month | | | (59,455 | ) | | | (41,871 | ) | | | (38,439 | ) | | | (188,958 | ) | | | (138,720 | ) |
| Total revenues for last month of period | | | 29,435 | | | | 26,246 | | | | 19,506 | | | | 29,435 | | | | 19,506 | |
| Less: Last month recoveries | | | (1,661 | ) | | | (2,185 | ) | | | (1,771 | ) | | | (1,661 | ) | | | (1,771 | ) |
| Last month deferred setup fees | | | (269 | ) | | | (513 | ) | | | (391 | ) | | | (269 | ) | | | (391 | ) |
| Last month straight line rent and other | | | (1,291 | ) | | | 1,925 | | | | (823 | ) | | | (1,291 | ) | | | (823 | ) |
| MRR at period end | | $ | 26,214 | | | $ | 25,473 | | | $ | 16,521 | | | $ | 26,214 | | | $ | 16,521 | |
Earnings Before Interest, Taxes, Depreciation and Amortization (EBITDA) and Adjusted EBITDA
The Company calculates EBITDA as net income (loss) adjusted to exclude interest expense and interest income, provision for income taxes (including income taxes applicable to sale of assets) and depreciation and amortization. Management believes that EBITDA is useful to investors in evaluating and facilitating comparisons of the Company’s operating performance between periods and between REITs by removing the impact of its capital structure (primarily interest expense) and asset base charges (primarily depreciation and amortization) from its operating results.
In addition to EBITDA, the Company calculates an adjusted measure of EBITDA, which it refers to as Adjusted EBITDA, as EBITDA excluding unamortized deferred financing costs, gains on extinguishment of debt, transaction costs, equity-based compensation expense, restructuring charge, gain (loss) on legal settlement and gain on sale of real estate. The Company believes that Adjusted EBITDA provides investors with another financial measure that can facilitate comparisons of operating performance between periods and between REITs.
Management uses EBITDA and Adjusted EBITDA as supplemental performance measures as they provide useful measures of assessing the Company’s operating results. Other companies may not calculate EBITDA or Adjusted EBITDA in the same manner. Accordingly, the Company’s EBITDA and Adjusted EBITDA may not be comparable to others. EBITDA and Adjusted EBITDA should be considered only as supplements to net income (loss) as measures of the Company’s performance and should not be used as substitutes for net income (loss), as measures of its results of operations or liquidity or as an indications of funds available to meet its cash needs, including its ability to make distributions to its stockholders.
29 QTS Q3 Earnings 2015 | Contact: IR@qtsdatacenters.com |
| | | Three Months Ended | | | Nine Months Ended | |
| | | September 30, | | | June 30, | | | September 30, | | | September 30, | |
| | | 2015 | | | 2015 | | | 2014 | | | 2015 | | | 2014 | |
| EBITDA and Adjusted EBITDA | | | | | | | | | | | | | | | | | | | | |
| Net income | | $ | 8,238 | | | $ | 5,520 | | | $ | 4,006 | | | $ | 18,795 | | | $ | 13,255 | |
| Interest expense | | | 5,418 | | | | 4,799 | | | | 5,410 | | | | 15,559 | | | | 9,683 | |
| Interest income | | | (1 | ) | | | (1 | ) | | | - | | | | (2 | ) | | | (8 | ) |
| Tax (benefit) expense of taxable REIT subsidiaries | | | (2,560 | ) | | | (3,135 | ) | | | 27 | | | | (5,695 | ) | | | 82 | |
| Depreciation and amortization | | | 24,486 | | | | 18,062 | | | | 15,210 | | | | 58,791 | | | | 42,274 | |
| EBITDA | | | 35,581 | | | | 25,245 | | | | 24,653 | | | | 87,448 | | | | 65,286 | |
| | | | | | | | | | | | | | | | | | | | | |
| Write off of unamortized deferred finance costs | | | - | | | | 83 | | | | 470 | | | | 83 | | | | 580 | |
| Equity-based compensation expense | | | 2,068 | | | | 1,831 | | | | 925 | | | | 5,206 | | | | 2,901 | |
| Restructuring costs | | | - | | | | - | | | | 226 | | | | - | | | | 1,272 | |
| Integration costs | | | 1,360 | | | | 422 | | | | - | | | | 1,783 | | | | - | |
| Transaction costs | | | 122 | | | | 4,247 | | | | (195 | ) | | | 4,473 | | | | 958 | |
| Adjusted EBITDA | | $ | 39,131 | | | $ | 31,828 | | | $ | 26,079 | | | $ | 98,993 | | | $ | 70,997 | |
30 QTS Q3 Earnings 2015 | Contact: IR@qtsdatacenters.com |
Net Operating Income (NOI)
The Company calculates net operating income (“NOI”) as net income (loss), excluding: interest expense, interest income, tax expense of taxable REIT subsidiaries, depreciation and amortization, write off of unamortized deferred financing costs, gain on extinguishment of debt, transaction and integration costs, gain on legal settlement, gain on sale of real estate, restructuring charge and general and administrative expenses. The Company believes that NOI is another metric that is often utilized to evaluate returns on operating real estate from period to period and also, in part, to assess the value of the operating real estate. A reconciliation of net income (loss) to NOI is presented below:
| | | Three Months Ended | | | Nine Months Ended | |
| | | September 30, | | | June 30, | | | September 30, | | | September 30, | |
| | | 2015 | | | 2015 | | | 2014 | | | 2015 | | | 2014 | |
| Net Operating Income (NOI) | | | | | | | | | | | | | | | | | | | | |
| Net income | | $ | 8,238 | | | $ | 5,520 | | | $ | 4,006 | | | $ | 18,795 | | | $ | 13,255 | |
| Interest expense | | | 5,418 | | | | 4,799 | | | | 5,410 | | | | 15,559 | | | | 9,683 | |
| Interest income | | | (1 | ) | | | (1 | ) | | | - | | | | (2 | ) | | | (8 | ) |
| Depreciation and amortization | | | 24,486 | | | | 18,062 | | | | 15,210 | | | | 58,791 | | | | 42,274 | |
| Write off of unamortized deferred finance costs | | | - | | | | 83 | | | | 470 | | | | 83 | | | | 580 | |
| Tax (benefit) expense of taxable REIT subsidiaries | | | (2,560 | ) | | | (3,135 | ) | | | 27 | | | | (5,695 | ) | | | 82 | |
| Restructuring costs | | | - | | | | - | | | | 226 | | | | - | | | | 1,272 | |
| Integration costs | | | 1,360 | | | | 422 | | | | - | | | | 1,783 | | | | - | |
| Transaction costs | | | 122 | | | | 4,247 | | | | (195 | ) | | | 4,473 | | | | 958 | |
| General and administrative expenses | | | 19,440 | | | | 14,615 | | | | 11,045 | | | | 47,893 | | | | 33,296 | |
| NOI (1) | | $ | 56,503 | | | $ | 44,612 | | | $ | 36,199 | | | $ | 141,680 | | | $ | 101,392 | |
| Breakdown of NOI by facility: | | | | | | | | | | | | | | | | | | | | |
| Atlanta-Metro data center | | $ | 17,964 | | | $ | 16,875 | | | $ | 14,752 | | | $ | 51,605 | | | $ | 44,348 | |
| Atlanta-Suwanee data center | | | 10,376 | | | | 10,094 | | | | 9,046 | | | | 30,600 | | | | 25,798 | |
| Santa Clara data center | | | 3,615 | | | | 3,574 | | | | 3,301 | | | | 10,566 | | | | 9,349 | |
| Richmond data center | | | 5,340 | | | | 4,933 | | | | 3,772 | | | | 14,528 | | | | 10,158 | |
| Sacramento data center | | | 1,870 | | | | 1,900 | | | | 1,938 | | | | 5,641 | | | | 6,601 | |
| Princeton data center | | | 2,331 | | | | 2,310 | | | | 2,066 | | | | 6,990 | | | | 2,089 | |
| Dallas-Fort Worth data center | | | 1,532 | | | | 1,462 | | | | 420 | | | | 3,743 | | | | 420 | |
| Carpathia data centers | | | 12,460 | | | | 2,250 | | | | - | | | | 14,710 | | | | - | |
| Other facilities | | | 1,015 | | | | 1,214 | | | | 904 | | | | 3,297 | | | | 2,629 | |
| NOI (1) | | $ | 56,503 | | | $ | 44,612 | | | $ | 36,199 | | | $ | 141,680 | | | $ | 101,392 | |
| (1) | Includes facility level G&A allocation charges of 4% of revenue for QTS entities and 10% of revenue for Carpathia entities which aggregated to $4.9 million, $2.7 million and $2.3 million for the three month periods ended September 30, 2015, June 30, 2015, and September 30, 2014, respectively, and $10.1 million and $6.3 million for the nine month periods ended September 30, 2015 and 2014, respectively. |
31 QTS Q3 Earnings 2015 | Contact: IR@qtsdatacenters.com |