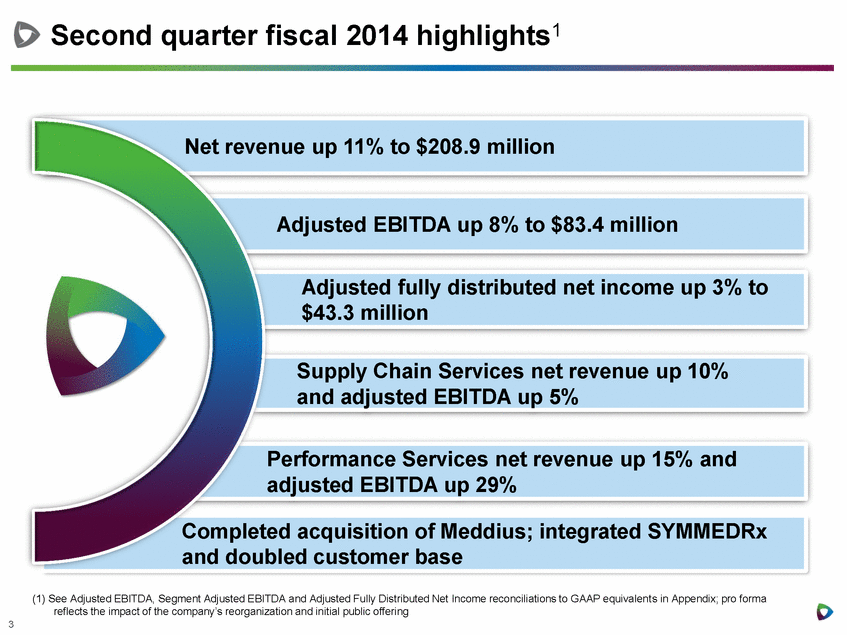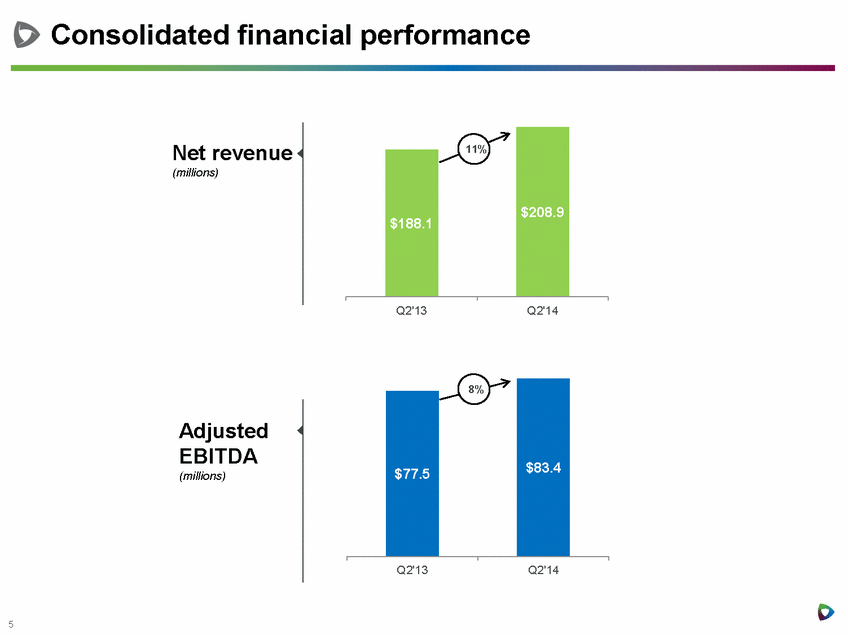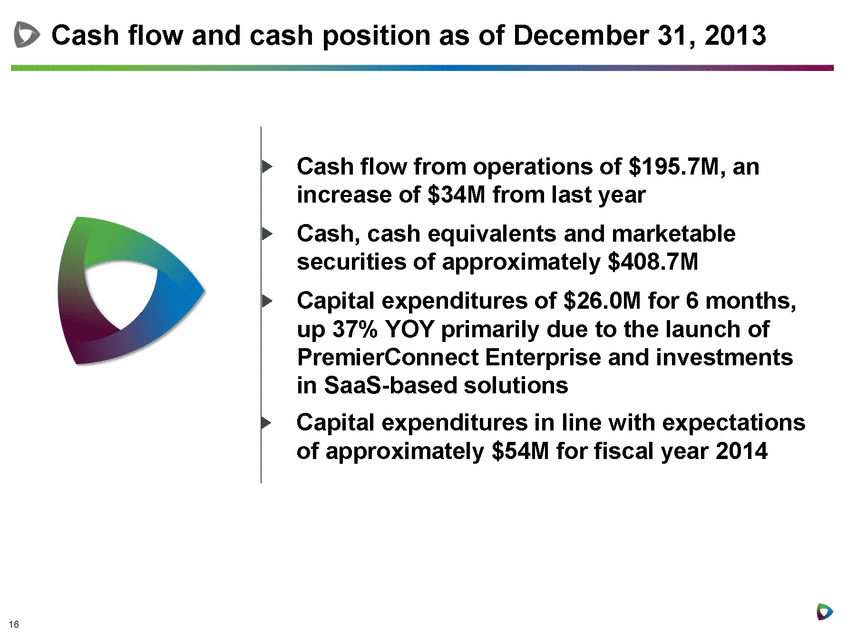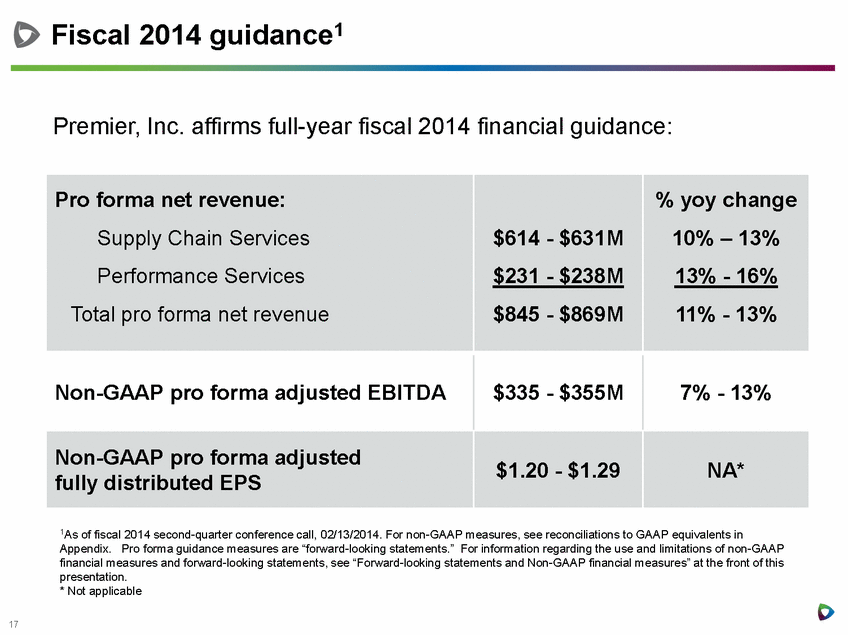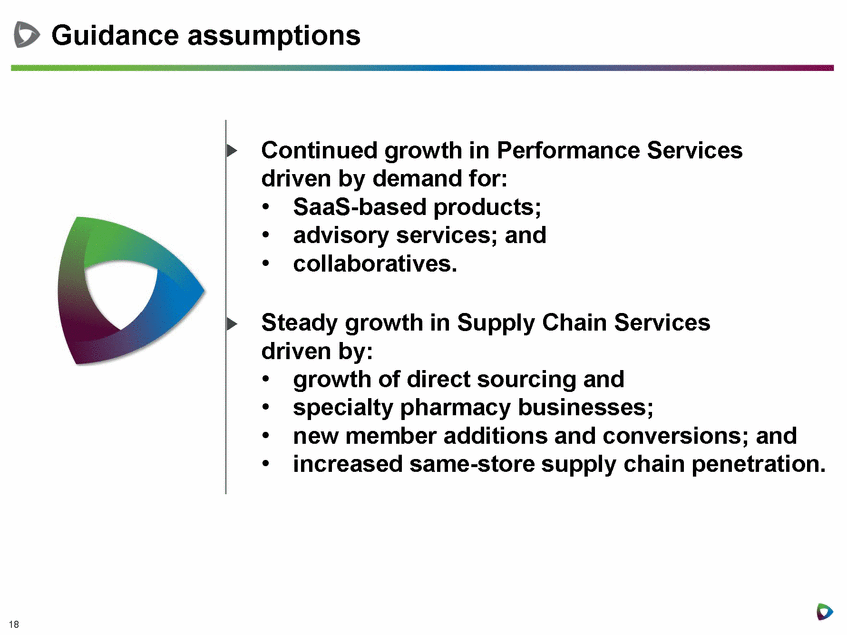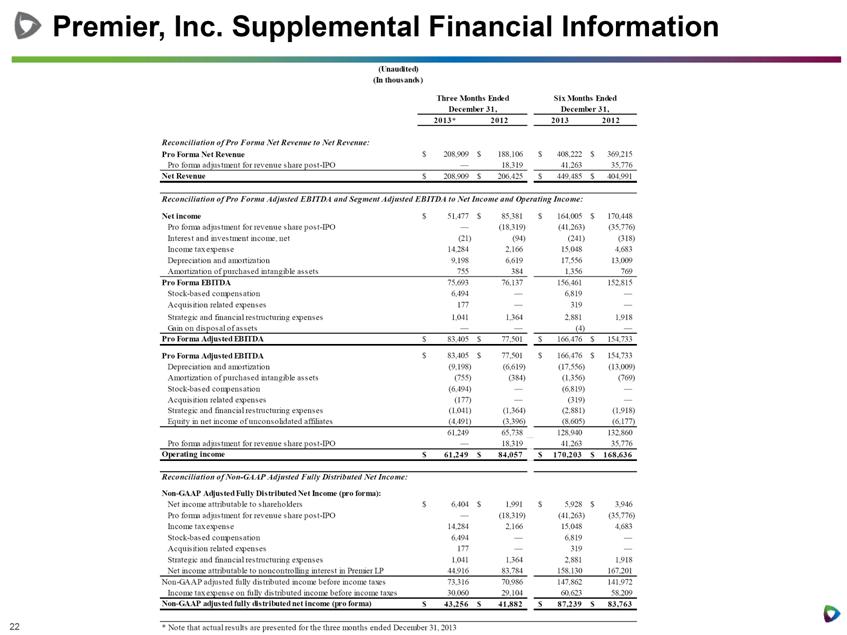
| Premier, Inc. Supplemental Financial Information 2013* 2012 2013 2012 Reconciliation of Pro Forma Net Revenue to Net Revenue: Pro Forma Net Revenue 208,909 $ 188,106 $ 408,222 $ 369,215 $ Pro forma adjustment for revenue share post-IPO — 18,319 41,263 35,776 Net Revenue 208,909 $ 206,425 $ 449,485 $ 404,991 $ Reconciliation of Pro Forma Adjusted EBITDA and Segment Adjusted EBITDA to Net Income and Operating Income: Net income 51,477 $ 85,381 $ 164,005 $ 170,448 $ Pro forma adjustment for revenue share post-IPO — (18,319) (41,263) (35,776) Interest and investment income, net (21) (94) (241) (318) Income tax expense 14,284 2,166 15,048 4,683 Depreciation and amortization 9,198 6,619 17,556 13,009 Amortization of purchased intangible assets 755 384 1,356 769 Pro Forma EBITDA 75,693 76,137 156,461 152,815 Stock-based compensation 6,494 — 6,819 — Acquisition related expenses 177 — 319 — Strategic and financial restructuring expenses 1,041 1,364 2,881 1,918 Gain on disposal of assets — — (4) — Pro Forma Adjusted EBITDA 83,405 $ 77,501 $ 166,476 $ 154,733 $ Pro Forma Adjusted EBITDA 83,405 $ 77,501 $ 166,476 $ 154,733 $ Depreciation and amortization (9,198) (6,619) (17,556) (13,009) Amortization of purchased intangible assets (755) (384) (1,356) (769) Stock-based compensation (6,494) — (6,819) — Acquisition related expenses (177) — (319) — Strategic and financial restructuring expenses (1,041) (1,364) (2,881) (1,918) Equity in net income of unconsolidated affiliates (4,491) (3,396) (8,605) (6,177) 61,249 65,738 128,940 132,860 Pro forma adjustment for revenue share post-IPO — 18,319 41,263 35,776 Operating income 61,249 $ 84,057 $ 170,203 $ 168,636 $ — $ — $ — $ — $ Reconciliation of Non-GAAP Adjusted Fully Distributed Net Income: Non-GAAP Adjusted Fully Distributed Net Income (pro forma): Net income attributable to shareholders 6,404 $ 1,991 $ 5,928 $ 3,946 $ Pro forma adjustment for revenue share post-IPO — (18,319) (41,263) (35,776) Income tax expense 14,284 2,166 15,048 4,683 Stock-based compensation 6,494 — 6,819 — Acquisition related expenses 177 — 319 — Strategic and financial restructuring expenses 1,041 1,364 2,881 1,918 Net income attributable to noncontrolling interest in Premier LP 44,916 83,784 158,130 167,201 Non-GAAP adjusted fully distributed income before income taxes 73,316 70,986 147,862 141,972 Income tax expense on fully distributed income before income taxes 30,060 29,104 60,623 58,209 Non-GAAP adjusted fully distributed net income (pro forma) 43,256 $ 41,882 $ 87,239 $ 83,763 $ * Note that actual results are presented for the three months ended December 31, 2013 Three Months Ended December 31, Six Months Ended December 31, (Unaudited) (In thousands) |