![]() TRANSFORMING HEALTHCARE 33 rd Annual J.P. Morgan Healthcare Conference January 12, 2015 FROM THE INSIDE Exhibit 99.1 |
![]() Forward-looking statements and Non-GAAP financial measures 2 PREMIER, INC. Forward-looking statements—Certain statements included in this presentation, including, but not limited to, those related to our financial and business outlook, strategy and growth drivers, member retention rates and revenue visibility, cross and upsell opportunities, acquisition activities and pipeline, revenue available under contract, and 2015 financial guidance and related assumptions, are “forward-looking statements” within the meaning of the federal securities laws. Forward-looking statements may involve known and unknown risks, uncertainties and other factors that may cause the actual results of Premier to be materially different from historical results or from any future results or projections expressed or implied by such forward- looking statements. Accordingly, readers should not place undue reliance on any forward looking statements. Readers are urged to consider statements in the conditional or future tenses or that include terms such as “believes,” “belief,” “expects,” “estimates,” “intends,” “anticipates” or “plans” to be uncertain and forward-looking. Forward-looking statements may include comments as to Premier’s beliefs and expectations as to future events and trends affecting its business and are necessarily subject to uncertainties, many of which are outside Premier’s control. More information on potential risks and other factors that could affect Premier’s financial results is included, and updated, from time to time, in Premier’s periodic and current filings with the SEC, including Premier’s most recent Form 10-K for the year ended June 30, 2014. Forward-looking statements speak only as of the date they are made. Premier undertakes no obligation to publicly update or revise any forward-looking statements. Non-GAAP financial measures—This presentation includes certain “non-GAAP financial measures” as defined in Regulation G under the Securities Exchange Act of 1934. Schedules are attached that reconcile the non-GAAP financial measures included in the following presentation to the most directly comparable financial measures calculated and presented in accordance with Generally Accepted Accounting Principles in the United States. Our Form 10-Q for the quarter ended September 30, 2014, filed on November 12, 2014, provides further explanation and disclosure regarding our use of non-GAAP financial measures and should be read in conjunction with this presentation. |
![]() Uniquely positioned to address industry challenges “Data, data, everywhere... … and not a drop to drink!” Premier is a uniquely-aligned healthcare performance improvement company that provides integrated data-analytics and business intelligence to comprehensively reduce costs, improve quality, and drive better patient outcomes. 3 PREMIER, INC. |
![]() Vision and objectives OUR VISION Through the collaborative power of the Premier alliance, we will lead the transformation to high-quality, cost-effective healthcare PREMIER, INC. 4 » Make healthcare supply chain efficient and effective » Deliver continuous improvement in cost and quality today and enable success in new healthcare delivery / payment models » Integrate data and knowledge to create meaningful business intelligence that drives improvement |
![]() Our business at a glance Alliance of approximately 3,400 hospitals – 68% of U.S. community hospitals – and 110,000 alternate sites of care 74% owned by health systems (1) ~$41 billion in group purchasing volume Insights into ~1 out of every 3 U.S. health system discharges Integrated clinical, financial and operational data Over 500 sales/field and advisory services employees that work with and inside our member hospitals Data as of September 30, 2014. (1) Following October 31, 2014 exchange. Premier’s unique customer alignment and data-driven intelligence platform allow us to help our health systems manage current challenges and build for the future… all at the same time PREMIER, INC. 5 |
![]() Unique business model drives innovation and growth PREMIER, INC. 6 INTEGRATED SALES/FIELD FORCE & PLATFORM Become the data analytics “backbone” with wrap-around services for cost and quality improvement over the short term and population health management solutions over the long term Change the game in supply chain, uncover unmatched savings and value, and lead the disruption of the industry Note: Consolidated revenue is presented on a non-GAAP pro forma basis for Supply Chain Services. See reconciliation pages in the appendix. Performance Services » SaaS-based informatics products » PremierConnect ® Enterprise » Advisory services » Performance improvement collaboratives 27% of FY’14 consolidated revenue Supply Chain Services 73% of FY’14 consolidated revenue » Group purchasing » Direct sourcing » Specialty pharmacy » Capital planning |
![]() Positioned to address industry needs PREMIER, INC. 7 Helping health systems manage challenges, optimize the transition, and build for the future . . . all at the same time |
![]() Key investment differentiators PREMIER, INC. 8 |
![]() Unique customer alignment 9 |
![]() Partnership model drives innovation and growth SCALE » Represent ~68% of U.S. community hospitals » Clinical, financial, operational data integrated on PremierConnect ® platform » Insights into ~1 out of every 3 U.S. health system discharges » Approximately $41 billion in supply chain spend » Manage ~1,900 contracts from ~1,100 suppliers ALIGNMENT » Members own ~74% of equity (1) » 10 health system board members » Premier field force embedded in member hospitals COMMITMENT » Member average tenure ~15 years (76% at 10+ years) » Members view Premier as strategic partner or organizational extension CO-INNOVATION » Co-develop solutions with members » Committees composed of ~165 member hospitals » ~1,100 hospitals in performance improvement collaboratives » Data Alliance Collaborative Note: Data as of September 30, 2014. (1) Following October 31, 2014 exchange. PREMIER, INC. 10 |
![]() Data-driven, technology enabled 11 |
![]() Connecting the data – Enabling the information driven enterprise 12 PREMIER, INC. |
![]() PremierConnect ® Enterprise & Data Alliance Collaborative » Clinical utilization effectiveness » Harm reporting » Community health & equity reporting » Ambulatory quality measures » Claims analytics » Total cost of care » Operational reporting » Predictive model for readmissions » Population health analytics » ACO reporting » Referral analytics » H&V procedural analytics » Readmissions metrics & management » Population health » Throughput analytics » Operations & throughput modeling » Population stratification » Disease modeling PREMIER, INC. 13 *PremierConnect Enterprise and Data Alliance Collaborative as of September 30, 2014. |
![]() Measurable and scalable impact through collaboratives PREMIER, INC. 14 ~ 350 U.S. hospital members ~ 160,000 deaths avoided ~ $13.2 billion saved ~ 55,800 readmissions prevented ~ 21,700 instances of harm prevented Approximately 1,100 U.S. hospital members participate in at least one of our performance improvement collaboratives Source: Premier QUEST participant performance data as of fiscal year end 6/30/2014 (Year 6, Q4 2013). Results are cumulative. Note: Deaths avoided and dollars saved over the first 6 years of the program; instances of harm measured over the past 4 years; readmissions prevented measured over the past 3 years. QUEST: Quality, Efficiency, Safety and Transparency. |
![]() Evolving QUEST to focus on integrated population health management PREMIER, INC. 15 Measures and focus areas have two-fold purpose: » Continue to drive improvement on inpatient metrics that align with value-based purchasing and payment reductions and penalties » Begin and enhance the improvement on ambulatory and community health-based metrics that will further help Premier members move to new models of care delivery The latest generation of QUEST began January 1, 2014, with over 365 members focusing on ambulatory and population health based metrics in addition to inpatient care |
![]() Services Integrated framework for delivering solutions Collaboratives Information Technology Solutions IMPROVEMENT • Quality and safety • Physician performance improvement • Regulatory compliance • Harm and readmissions POPULATION HEALTH COST MANAGEMENT • Group purchasing • Non-labor • Physician preference • Capital equipment • Labor • Total cost • Clinical variation • Resource utilization • Integrated pharmacy PREMIER, INC. 16 INTEGRATED SALES/FIELD FORCE & PLATFORM • Physician network management • Population analytics and risk management • Population engagement |
![]() Diversified growth engine 17 |
![]() Expanding supply chain solutions Steady acute GPO growth “Other” Upside Performance Services Supply Chain Services Non-acute and complementary services expansion Top Priority Strategic Initiatives Member penetration performance services New product development M&A and growth opportunities Attributes Top Priority Strategic Initiatives PREMIER, INC. 18 Multiple opportunities to drive long-term sustainable growth Expanded cost reduction Non acute and pharmacy growth Supply chain technology Strong distribution channel Desired expertise/ capabilities Clinical integration/ shared services Ambulatory data expansion Population health capabilities |
![]() Growing from within our member channel HISTORICAL BUSINESS GROWTH PREMIER, INC. 19 CURRENT BUSINESS GROWTH Note: The illustrations above are representative of Premier’s business growth and do not necessarily depict the specific product or service adoption patterns of the organizations represented here. |
![]() Member-driven co-development engine Organic Acquisitions Partnerships Premier platform enables rapid deployment of new solutions 2006 2007 2010 2011 2013 2014 ------------Post-IPO--------------------- 2013 2014 2014 PREMIER, INC. 20 |
![]() Strategic acquisitions address member needs Clinical & physician preference cost reduction Data acquisition from multiple technologies Health system capital expenditure cost reduction Supply chain technology enablement Quality & safety improvement Strategic Need (Closed July 2013) (Closed October 2013) (Closed April 2014) (Closed August 2014) (Closed September 2014) Company PREMIER, INC. 21 |
![]() Attractive opportunities for further capital deployment Performance Services Supply Chain Services Performance Services Diverse and growing end markets to drive Premier’s growth Supply Chain Services PREMIER, INC. 22 |
![]() Compelling financial profile 23 |
![]() MULTIPLE GROWTH DRIVERS • Consolidated double-digit net revenue and adjusted EBITDA (1) growth • Diversified revenue opportunities in Supply Chain Services and Performance Services • Multiple emerging growth drivers HIGH VISIBILITY • High retention rates in both business segments • 5-7 year contracts in Supply Chain Services and 3-5 year SaaS-based subscription contracts in Performance Services • Fiscal 2015 revenue visibility over 90% ATTRACTIVE ECONOMIC MODEL • Significant cross and upsell opportunities in existing member base • High margins and low marginal cost to support new GPO members and further penetration of existing GPO members • SaaS-based products generate high returns on new wins EVOLVING BUSINESS MIX • Investments in emerging growth initiatives will impact adjusted EBITDA (1) margins, but enhance adjusted EBITDA (1) growth • Capital investments increase D&A, impacting near-term net income margins DISCIPLINED CAPITAL DEPLOYMENT TRACK RECORD • Strong returns on acquired assets • Strategic, financial and execution framework in place for capital deployment Demonstrated financial model and performance PREMIER, INC. 24 (1) See Adjusted EBITDA reconciliation to GAAP equivalent in Appendix. |
![]() Our multiple business and growth drivers (1) GPO Specialty pharmacy Direct sourcing SaaS-based informatics products Performance improvement collaboratives Advisory services Data management/ warehousing Business Revenue Drivers FY’14 Results (1) Net Revenue 14% Segment Adjusted EBITDA 9% Net Revenue 13% Segment Adjusted EBITDA 31% Net Revenue 14% Adjusted EBITDA 12% Adjusted fully distributed EPS 9% Consolidated • Administrative fees paid by suppliers • Drug reimbursement • Fee for service • Product sales of contract manufactured items • SaaS-based subscriptions • Fee-for-service • Fee-for-service • SaaS-based subscriptions • SaaS-based subscriptions • Significant stickiness • Strong visibility across diverse revenue streams (1) Results are presented on a non-GAAP pro forma basis. See Adjusted EBITDA, Segment Adjusted EBITDA and fully distributed net income reconciliation to GAAP equivalent in the Appendix. Net Revenue 11% - 14% Adjusted EBITDA 8% - 11% Adjusted fully distributed EPS 7% - 11% PREMIER, INC. 25 |
![]() Net revenue (1) (millions) (1) See Net revenue, Segment Net Revenue, Adjusted EBITDA, Segment Adjusted EBITDA, non-GAAP pro forma adjusted fully distributed net income, and non- GAAP pro forma earnings per share on fully distributed net income reconciliations to GAAP equivalents in Appendix; financial information for fiscal year 2014 and fiscal year 2013 have been adjusted on a non-GAAP pro forma basis to reflect the impact of the company’s reorganization and initial public offering. Adjusted EBITDA (1) (millions) (2) Calculates income taxes at 40% on pre-tax income, assuming taxable C corporate structure. (3) Calculates adjusted fully distributed earnings per share, assuming total Class A and B common shares held by public Double-digit net revenue and adjusted EBITDA growth in Fiscal 2014 (1) Non-GAAP pro forma adjusted net income (2) (millions) Non-GAAP pro forma earnings per share on fully distributed net income (3) PREMIER, INC. 26 |
![]() Fiscal 2015 first-quarter update 1 Net revenue (1) (millions) (1) See Net Revenue, Segment Net Revenue, Adjusted EBITDA, Segment Adjusted EBITDA, non-GAAP adjusted fully distributed net income, and non-GAAP earnings per share on fully distributed net income reconciliations to GAAP equivalents in Appendix; comparisons are between actual financial results for the first quarter ended September 30, 2014, and non-GAAP pro forma results, which have been adjusted to reflect the impact of the company’s reorganization and initial public offering, for the first quarter ended September 30, 2013. Adjusted EBITDA (1) (millions) (2) Calculates income taxes at 40% on pre-tax income, assuming taxable C corporate structure. (3) Calculates adjusted fully distributed earnings per share, assuming total Class A and B common shares held by public Non-GAAP pro forma adjusted net income (2) (millions) Non-GAAP pro forma earnings per share on fully distributed net income (3) PREMIER, INC. 27 |
![]() Cash flow and capital flexibility at September 30, 2014 Cash, cash equivalents and marketable securities of $398.2 million No outstanding borrowings on $750 million five-year unsecured revolving credit facility Fiscal first-quarter cash flow from operations of $45.9 million CONSIDERABLE CASH AND DEBT CAPACITY AVAILABLE AMPLE CAPITAL FLEXIBILITY FOR FUTURE ACQUISITIONS AND GROWTH PREMIER, INC. 28 |
![]() Fiscal 2015 annual guidance (1) (in millions, except per share data) Pro Forma FY 2015 YoY Change Net Revenue: Supply Chain Services $688 - $707 8% - 11% Performance Services $281 - $288 21% - 24% Total Net Revenue $969 - $995 11% - 14% Non-GAAP adjusted EBITDA $379 - $390 8% - 11% Non-GAAP adjusted fully distributed EPS $1.39 - $1.44 7% - 11% (1) As of fiscal 2015 first-quarter conference call, 11/10/2014. For non-GAAP measures, see reconciliations to GAAP equivalents in Appendix. Guidance measures are “forward-looking statements.” For information regarding the use and limitations of non-GAAP financial measures and forward-looking statements, see “Forward-looking statements and Non-GAAP financial measures” at the front of this presentation. Guidance is based on comparisons with prior-year non-GAAP pro forma results, which have been adjusted to reflect the impact of the company’s reorganization and IPO. Financial guidance for year ending June 30, 2015: Supply Chain Services growth driven by: Guidance Assumptions: PREMIER, INC. 29 Performance Services growth driven by: » Low to mid-single-digit growth in net administrative fee revenue » Continuation of high GPO retention rates » 15% - 20% product growth » Continued demand for integrated offerings of SaaS-based products, advisory services and collaboratives » TheraDoc and Aperek full revenue contributions in second, third and fourth quarters » Continuation of high SaaS institutional renewal rates |
![]() Significant Fiscal 2015 revenue visibility: 90+% PERFORMANCE METRICS (1) FY 2015 FY 2014 3 Year Average Revenue available under contract $898M --- --- GPO retention rate (2) --- 99% 97% SaaS institutional renewal rate (3) --- 94% 94% (1) As of fiscal year-end June 30, 2014 (2) The retention rate is calculated based upon the aggregate purchasing volume among all members participating in our GPO for such fiscal year less the annualized GPO purchasing volume for departed members for such fiscal year, divided by the aggregate purchasing volume among all members participating in our GPO for such fiscal year. (3) The renewal rate is calculated based upon the total number of members that have SaaS revenue in a given period that also have revenue in the corresponding prior year period divided by the total number of members that have SaaS revenue in the same period of the prior year. OVER 90% FY 2015 REVENUE GUIDANCE RANGE ALREADY AVAILABLE UNDER CONTRACT PREMIER, INC. 30 HIGH GPO RETENTION AND SAAS INSTITUTIONAL RENEWAL RATES |
![]() Summary – Key investment differentiators UNIQUE CUSTOMER ALIGNMENT » Interests and perspectives are aligned with our customers » Members own ~74% of equity (1) and view Premier as strategic partner » Embedded field force co-developing solutions with members DATA-DRIVEN, TECHNOLOGY ENABLED » Integrated, payer- and vendor-agnostic data platform » Insights from approximately 1 in 3 U.S. health system discharges » Emerging data warehousing capabilities DIVERSIFIED GROWTH ENGINE » Multiple revenue levers » Attractive acquisition and partnership pipeline COMPELLING FINANCIAL PROFILE » Double digit revenue and EBITDA (2) growth in fiscal 2014 » Considerable cash and debt capacity for future growth PREMIER, INC. 31 (1) Following October 31, 2014 exchange. (2) See Net revenue and Adjusted EBITDA reconciliations to GAAP equivalents in Appendix; financial information for fiscal year 2014 and fiscal year 2013 have been adjusted on a non-GAAP pro forma basis to reflect the impact of the company’s reorganization and initial public offering. |
![]() Thank you 32 FOR MORE INFORMATION CONTACT: Jim Storey Vice President, Investor Relations Premier, Inc. 704-816-5958 jim_storey@premierinc.com |
![]() Appendix 33 |
![]() Our leadership team Susan DeVore, President and CEO 11 years Premier; 26 years healthcare Cap Gemini Ernst & Young PREMIER, INC. 34 |
![]() Structure Structural implications of Premier, Inc. Structured as “Up-C” with Premier, Inc. (parent C-Corp above operating partnership and subsidiaries) Premier, Inc. formed with two classes of stock • Class A shares held by public investors • Class B shares allocated to member owners 22% of Limited Partner interests sold to public, 78% retained by member owners as Class B units Class B units eligible to exchange 1/7th per year, over seven-year period Exchange of Class B units for A-shares (on a 1-for-1 basis) as B-units become eligible for exchange subject to ROFR by members owners and Premier, Inc. First exchange on October 31, 2014, and subsequent company directed offering injected 3.9 million shares of liquidity into the public market, resulting in public ownership of 26% and member owner interest of 74% Given Up-C structure and differences between taxes paid by our Class A unit holder (Premier GP) vs. distributions to our Class B unit holders (members owners), we calculate Adjusted Fully Distributed Net Income 1 for comparability purposes Reflects taxes and net income as if the Company was a C-Corp for all periods presented Class A and Class B shares will be used to calculate fully diluted EPS to eliminate variability due to member exchanges over time Impact of IPO and Exchange Process Adjusted fully distributed net income Share count PREMIER, INC. 35 (1) See Adjusted EBITDA and Adjusted Fully Distributed Net Income reconciliations to GAAP equivalents in Appendix |
![]() Member owners allocated income in operating partnership based on percentage ownership Income tax expense equals 40% of income attributable to Premier, Inc. Member owners receive tax distribution to cover any tax liability on allocated income Amount of retained profitability in business equal regardless of ownership structure Reflects 41% tax rate on 100% of pretax income (assumes full C-Corp tax treatment) Amount paid for taxes equal regardless of ownership structure Illustrative impact of ownership structure PREMIER, INC. 36 1 For illustrative purposes only. Ownership percentage is based on structure at the time of the October 2013 initial public offering and will change over time. Ownership (1) 22% Class A / 78% Class B Ownership 100% Class A Income Statement Net Revenue 500,000 500,000 Cost of Revenue 200,000 200,000 Gross Profit 300,000 300,000 Operating Expenses 140,000 140,000 Operating Income 160,000 160,000 Net Income Attributable to NCI in Premier LP (124,800) - Pre-Tax Income Attributable to Premier Inc. 35,200 160,000 Income Tax Expense 14,080 64,000 Net Income Attributable to Premier, Inc. 21,120 96,000 Income Retained in Business Net Income Attributable to Premier, Inc. 21,120 96,000 Net Income Attributable to NCI in Premier LP 124,800 - Tax Distribution to Premier LP Limited Partners (49,920) - Net Income Retained in Business 96,000 96,000 Adjusted Fully Distributed Net Income Net Income Attributable to Premier, Inc. 21,120 96,000 Add: Income Tax Expense 14,080 64,000 Add: Net Income Attributable to NCI in Premier 124,800 - Fully Distributed Income Before Income Taxes 160,000 160,000 Adjusted for income tax expense on fully distributed net income before income taxes 64,000 64,000 Adjusted Fully Distributed Net Income 96,000 96,000 Income Taxes/Tax Distributions Income Tax Expense 14,080 64,000 Tax Distribution to Class B Limited Partners 49,920 - Total Tax, including tax distribution to limited partners 64,000 64,000 |
![]() Fiscal 2014 and fiscal 2013 non-GAAP reconciliations Reconciliation of Selected Non-GAAP Measures to GAAP Measures (Unaudited, in thousands) Adjustments Adjustments Amount % of Net Revenue Amount Amount % of Net Revenue Amount % of Net Revenue Amount Amount % of Net Revenue Net revenue: Net administrative fees 464,837 $ 51% (41,263) $ 423,574 $ 49% 519,219 $ 60% (105,012) $ 414,207 $ 54% Other services and support 233,186 26% - 233,186 27% 205,685 24% - 205,685 27% Services 698,023 77% (41,263) 656,760 76% 724,904 84% (105,012) 619,892 81% Products 212,526 23% - 212,526 24% 144,386 16% - 144,386 19% Net revenue 910,549 100% (41,263) 869,286 100% 869,290 100% (105,012) 764,278 100% Cost of revenue: Services 115,740 13% - 115,740 13% 103,795 12% - 103,795 14% Products 191,885 21% - 191,885 22% 133,618 15% - 133,618 17% Cost of revenue 307,625 34% - 307,625 35% 237,413 27% - 237,413 31% Gross profit 602,924 66% (41,263) 561,661 65% 631,877 73% (105,012) 526,865 69% Operating expenses: Selling, general and administrative 294,421 33% - 294,421 35% 248,301 29% - 248,301 33% Research and development 3,389 — % - 3,389 — % 9,370 1% - 9,370 1% Amortization of purchased intangible assets 3,062 — % - 3,062 — % 1,539 — % - 1,539 — % Total operating expenses 300,872 33% - 300,872 35% 259,210 30% - 259,210 34% Operating income 302,052 33% (41,263) 260,789 30% 372,667 43% (105,012) 267,655 35% Other income, net 58,274 6% - 58,274 7% 12,145 1% - 12,145 2% Income before income taxes 360,326 40% (41,263) 319,063 37% 384,812 44% (105,012) 279,800 37% Income tax expense 27,709 3% (3,239) 24,470 3% 9,726 1% 22,813 32,539 4% Net income 332,617 37% (38,024) 294,593 34% 375,086 43% (127,825) 247,261 33% Net (income) loss attributable to noncontrolling interest in S2S Global (949) — % - (949) — % 1,479 — % - 1,479 — % Net income attributable to noncontrolling interest in Premier LP (303,336) (33)% 57,690 (245,646) (28)% (369,189) (42)% 150,726 (218,463) (29)% Net income attributable to noncontrolling interest (304,285) (33)% 57,690 (246,595) (28)% (367,710) (42)% 150,726 (216,984) (29)% Net income attributable to shareholders 28,332 $ 4% 19,666 $ 47,998 $ 6% 7,376 $ 1% 22,901 $ 30,277 $ 4% Adjustment of redeemable limited partners' capital to redemption amount (2,741,588) $ nm - $ (2,741,588) $ nm - $ nm - $ - $ nm Net income (loss) attributable to shareholders after adjustment of redeemable partners' capital to redemption amount (2,713,256) $ nm 19,666 $ (2,693,590) $ nm 7,376 $ nm 22,901 $ 30,277 $ nm Adjusted EBITDA 392,288 $ 43% (41,263) $ 351,025 $ 40% 419,025 $ 48% (105,012) $ 314,013 $ 41% Adjusted Fully Distributed Net Income na na na 188,561 $ 22% na na na 172,793 $ 23% nm - Not meaningful na - Not applicable Actual Actual Non-GAAP Pro Forma Year Ended June 30, 2014 2013 Non-GAAP Pro Forma PREMIER, INC. 37 |
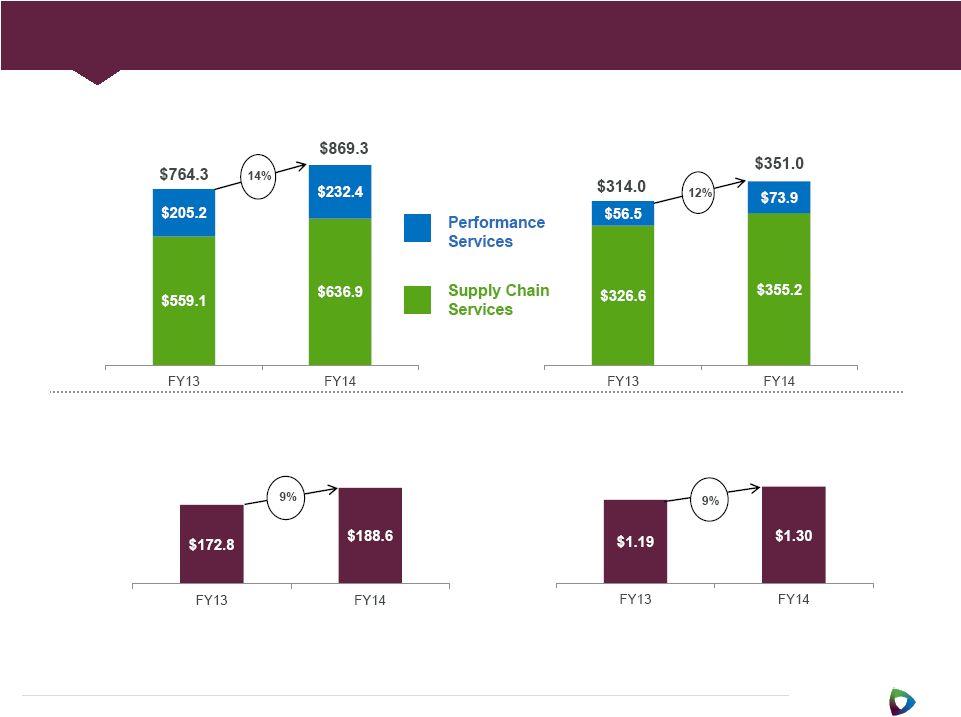
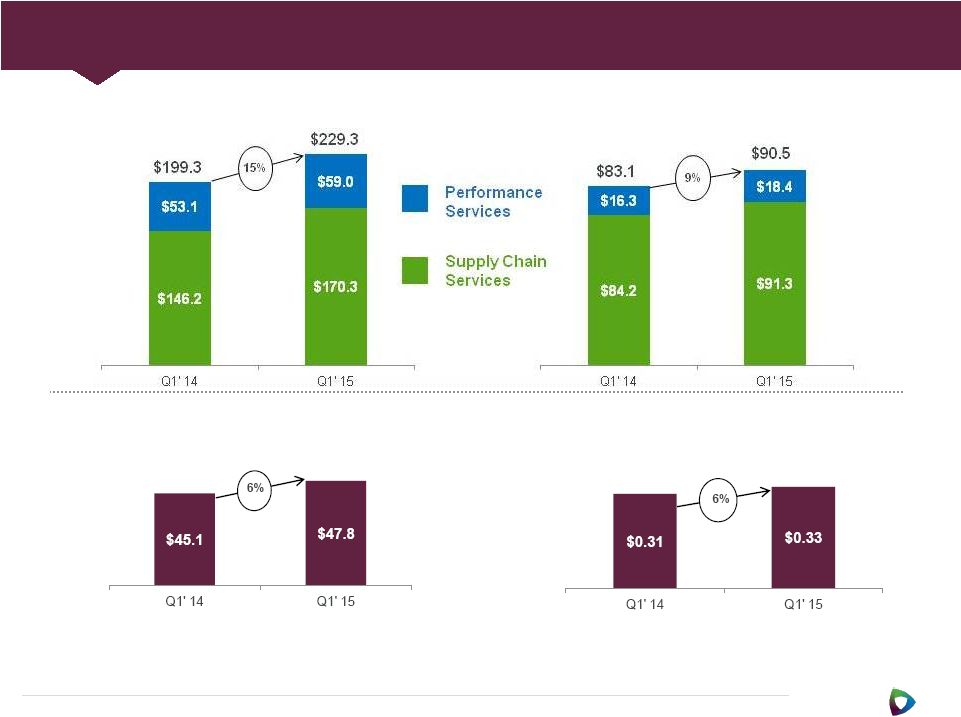
![]() Fiscal 2014 and fiscal 2013 non-GAAP reconciliations PREMIER, INC. 38 (Unaudited, in thousands) Actual Adjustments Non-GAAP Pro Forma Actual Adjustments Non-GAAP Pro Forma Reconciliation of Non-GAAP Pro Forma Net Revenue to Net Revenue: Supply Chain Services 678,141 $ (41,263) $ 636,878 $ 664,076 $ (105,012) $ 559,064 $ Performance Services 232,408 - 232,408 205,214 - 205,214 Net Revenue 910,549 (41,263) 869,286 869,290 (105,012) 764,278 Reconciliation of Net Income to Adjusted EBITDA and Reconciliation of Segment Adjusted EBITDA to Income Before Income Taxes: Net income 332,617 $ (38,024) $ 294,593 $ 375,086 $ (127,825) $ 247,261 $ Interest and investment income, net (1,019) - (1,019) (965) - (965) Income tax expense 27,709 (3,239) 24,470 9,726 22,813 32,539 Depreciation and amortization 36,761 - 36,761 27,681 - 27,681 Amortization of purchased intangible assets 3,062 - 3,062 1,539 - 1,539 EBITDA 399,130 (41,263) 357,867 413,067 (105,012) 308,055 Stock-based compensation expense 19,476 - 19,476 - - - Acquisition related expenses 2,014 - 2,014 - - - Strategic and financial restructuring expenses 3,760 - 3,760 5,170 - 5,170 Gain on sale of investment (38,372) - (38,372) - - - Adjustment to tax receivable agreement liability 6,215 - 6,215 - - - Other (income) expense, net 65 - 65 788 - 788 Adjusted EBITDA 392,288 $ (41,263) $ 351,025 $ 419,025 $ (105,012) $ 314,013 $ Segment Adjusted EBITDA: Supply Chain Services 396,470 $ (41,263) $ 355,207 $ 431,628 $ (105,012) $ 326,616 $ Performance Services 73,898 - 73,898 56,456 - 56,456 Corporate (g) (78,080) - (78,080) (69,059) - (69,059) Adjusted EBITDA 392,288 (41,263) 351,025 419,025 (105,012) 314,013 Depreciation and amortization (36,761) - (36,761) (27,681) - (27,681) Amortization of purchased intangible assets (3,062) - (3,062) (1,539) - (1,539) Stock-based compensation expense (19,476) - (19,476) - - - Acquisition related expenses (2,014) - (2,014) - - - Strategic and financial restructuring expenses (3,760) - (3,760) (5,170) - (5,170) Adjustment to tax receivable agreement liability (6,215) - (6,215) - - - Equity in net income of unconsolidated affiliates (16,976) - (16,976) (11,968) - (11,968) Deferred compensation plan expense (1,972) - (1,972) - - - Operating income 302,052 (41,263) 260,789 372,667 (105,012) 267,655 Equity in net income of unconsolidated affiliates 16,976 - 16,976 11,968 - 11,968 Interest and investment income, net 1,019 - 1,019 965 - 965 Gain on sale of investment 38,372 - 38,372 - - - Other income (expense), net 1,907 - 1,907 (788) - (788) Income before income taxes 360,326 $ (41,263) $ 319,063 $ 384,812 $ (105,012) $ 279,800 $ Year Ended June 30, 2014 2013 |
![]() Fiscal 2014 and fiscal 2013 non-GAAP reconciliations Reconciliation of Selected Non-GAAP Measures to GAAP Measures (Unaudited, in thousands) 2014 2013 28,332 $ 7,376 $ (41,263) (105,012) 27,709 9,726 19,476 — 2,014 — 3,760 5,170 (38,372) — 6,215 — 3,062 1,539 303,336 369,189 �� 314,269 287,988 125,708 115,195 188,561 $ 172,793 $ Non-GAAP Pro forma fully distributed income before income taxes Income tax expense on fully distributed income before income taxes Non-GAAP Pro Forma Adjusted Fully Distributed Net Income Acquisition related expenses Strategic and financial restructuring expenses Gain on sale of investment Adjustment to tax receivable agreement liability Amortization of purchased intangible assets Net income attributable to noncontrolling interest in Premier LP Stock-based compensation expense Year Ended June 30, Net income attributable to shareholders Pro forma adjustment for revenue share post-IPO Income tax expense PREMIER, INC. 39 |
![]() Fiscal 2014 and fiscal 2013 non-GAAP reconciliations PREMIER, INC. 40 2014 2013 Reconciliation of numerator for GAAP EPS to Non-GAAP EPS on Adjusted Fully Distributed Net Income Net income (loss) attributable to shareholders after adjustment of redeemable limited partners' capital to redemption amount (2,713,256) $ 7,376 $ Adjustment of redeemable limited partners' capital to redemption amount 2,741,588 - Net income (loss) attributable to shareholders 28,332 7,376 Pro forma adjustment for revenue share post-IPO (41,263) (105,012) Income tax expense 27,709 9,726 Stock-based compensation 19,476 — Gain on sale of investment (38,372) — Acquisition related expenses 2,014 — Strategic and financial restructuring expenses 3,760 5,170 Adjustment to tax receivable agreement liability 6,215 — Amortization of purchased intangible assets 3,062 1,539 Net income attributable to noncontrolling interest in Premier LP 303,336 369,189 Non-GAAP pro forma adjusted fully distributed income before income taxes 314,269 287,988 Income tax expense on fully distributed income before income taxes 125,708 115,195 Non-GAAP pro forma adjusted fully distributed net income 188,561 $ 172,793 $ Reconciliation of denominator for GAAP EPS to Non-GAAP to Adjusted Fully Distributed Net Income Weighted Average: Common shares used for basic and diluted earnings per share 25,633 5,858 Potentially dilutive shares 124 - Class A common shares outstanding 6,742 26,517 Conversion of Class B common units 112,584 112,608 Weighted average fully distributed shares outstanding - diluted 145,083 144,983 Reconciliation of GAAP EPS to Adjusted Fully Distributed EPS GAAP income (loss) per share $ (105.85) $ 1.26 Impact of adjustment of redeemable limited partners' capital to redemption amount $ 106.96 $ - Impact of additions: Pro forma adjustment for revenue share post-IPO $ (1.61) $ (17.93) Income tax expense $ 1.08 $ 1.66 Stock-based compensation $ 0.76 $ - Gain on sale of investment $ (1.50) $ - Acquisition related expenses $ 0.08 $ - Strategic and financial restructuring expenses $ 0.15 $ 0.88 Adjustment to tax receivable agreement liability $ 0.24 $ - Amortization of purchased intangible assets $ 0.12 $ 0.26 Net income attributable to noncontrolling interest in Premier LP $ 11.83 $ 63.02 Impact of corporation taxes $ (4.90) $ (19.66) Impact of increased share count $ (6.06) $ (28.31) Non-GAAP earnings per share on adjusted fully distributed net income - diluted $ 1.30 $ 1.19 Supplemental Financial Information - Reporting of Net Income and Earnings Per Share Reconciliation of Selected Non-GAAP Measures to GAAP Measures (Unaudited) (In thousands) Year Ended June 30, |
![]() Fiscal 2015 and fiscal 2014 first-quarter non-GAAP reconciliations (Unaudited, in thousands) 2014* 2013 Reconciliation of Non-GAAP Pro Forma Net Revenue to Net Revenue: Non-GAAP Pro Forma Net Revenue 229,308 $ 199,313 $ Non-GAAP pro forma adjustment for revenue share post-IPO — 41,263 Net Revenue 229,308 $ 240,576 $ Reconciliation of Supply Chain Services Non-GAAP Pro Forma Net Revenue to Supply Chain Services Net Revenue: Non-GAAP Pro Forma Supply Chain Services Net Revenue 170,302 $ 146,195 $ Non-GAAP pro forma adjustment for revenue share post-IPO — 41,263 Supply Chain Services Net Revenue 170,302 $ 187,458 $ Net income 64,887 $ 112,528 $ Non-GAAP pro forma adjustment for revenue share post-IPO — (41,263) Interest and investment income, net (191) (220) Income tax expense 5,811 764 Depreciation and amortization 10,308 8,356 Amortization of purchased intangible assets 903 601 EBITDA 81,718 80,766 Stock-based compensation 6,439 325 Acquisition related expenses 1,278 142 Strategic and financial restructuring expenses 96 1,842 Adjustment to tax receivable agreement liability (1,073) — Acquisition related adjustment - deferred revenue 2,065 — Other (income) expense, net (5) (4) Adjusted EBITDA 90,518 $ 83,071 $ Segment Adjusted EBITDA: Supply Chain Services 91,268 $ 125,480 $ Non-GAAP pro forma adjustment for revenue share post-IPO — (41,263) Supply Chain Services (including non-GAAP pro forma adjustment) 91,268 $ 84,217 $ Performance Services 18,362 16,329 Corporate (19,112) (17,475) Adjusted EBITDA 90,518 $ 83,071 $ Depreciation and amortization (10,308) (8,356) Amortization of purchased intangible assets (903) (601) Stock-based compensation (6,439) (325) Acquisition related expenses (1,278) (142) Strategic and financial restructuring expenses (96) (1,842) Adjustment to tax receivable agreement liability 1,073 — Acquisition related adjustment - deferred revenue (2,065) — Equity in net income of unconsolidated affiliates (4,866) (4,114) Deferred compensation plan expense 509 — 66,145 67,691 Non-GAAP pro forma adjustment for revenue share post-IPO — 41,263 Operating income 66,145 $ 108,954 $ Equity in net income of unconsolidated affiliates 4,866 4,114 Interest and investment income, net 191 220 Other (expense) income, net (504) 4 Income before income taxes 70,698 $ 113,292 $ * Note that no pro forma adjustments were made for the three months ended September 30, 2014; as such, actual results are presented for the three months ended September 30, 2014. Three Months Ended September 30, Reporting of Non-GAAP Pro Forma Adjusted EBITDA and Non-GAAP Adjusted Fully Distributed Net Income Reconciliation of Selected Non-GAAP Measures to GAAP Measures Reconciliation of Net Income to Adjusted EBITDA and Reconciliation of Segment Adjusted EBITDA to Income Before Income Taxes: PREMIER, INC. 41 |
![]() Fiscal 2015 and fiscal 2014 first-quarter non-GAAP reconciliations (Unaudited, in thousands) 2014* 2013 Reconciliation of Non-GAAP Pro Forma Adjusted Fully Distributed Net Income: Net income (loss) attributable to shareholders 9,273 $ (476) $ Non-GAAP pro forma adjustment for revenue share post-IPO — (41,263) Income tax expense 5,811 764 Stock-based compensation 6,439 325 Acquisition related expenses 1,278 142 Strategic and financial restructuring expenses 96 1,842 Adjustment to tax receivable agreement liability (1,073) — Acquisition related adjustment - deferred revenue 2,065 — Amortization of purchased intangible assets 903 601 Net income attributable to noncontrolling interest in Premier LP 54,816 113,214 Non-GAAP pro forma adjusted fully distributed income before income taxes 79,608 75,149 Income tax expense on fully distributed income before income taxes 31,843 30,060 Non-GAAP Pro Forma Adjusted Fully Distributed Net Income 47,765 $ 45,089 $ Reporting of Non-GAAP Pro Forma Adjusted EBITDA and Non-GAAP Adjusted Fully Distributed Net Income Reconciliation of Selected Non-GAAP Measures to GAAP Measures Three Months Ended September 30, * Note that no pro forma adjustments were made for the three months ended September 30, 2014; as such, actual results are presented for the three months ended September 30, 2014. PREMIER, INC. 42 |
![]() Fiscal 2015 and fiscal 2014 first-quarter non-GAAP reconciliations PREMIER, INC. 43 (Unaudited, in thousands, except per share data) 2014* 2013 Reconciliation of numerator for GAAP EPS to Non-GAAP EPS on Adjusted Fully Distributed Net Income Net loss attributable to shareholders after adjustment of redeemable limited partners' capital to redemption amount (373,384) $ (476) $ Adjustment of redeemable limited partners' capital to redemption amount 382,657 — Net income (loss) attributable to shareholders 9,273 (476) Non-GAAP pro forma adjustment for revenue share post-IPO — (41,263) Income tax expense 5,811 764 Stock-based compensation 6,439 325 Acquisition related expenses 1,278 142 Strategic and financial restructuring expenses 96 1,842 Adjustment to tax receivable agreement liability (1,073) — Acquisition related adjustment - deferred revenue 2,065 — Amortization of purchased intangible assets 903 601 Net income attributable to noncontrolling interest in Premier LP 54,816 113,214 Non-GAAP pro forma adjusted fully distributed income before income taxes 79,608 75,149 Income tax expense on fully distributed income before income taxes 31,843 30,060 Non-GAAP pro forma adjusted fully distributed net income 47,765 $ 45,089 $ Reconciliation of denominator for GAAP EPS to Non-GAAP Adjusted Fully Distributed Net Income Weighted Average: Common shares used for basic and diluted earnings per share 32,376 5,627 Potentially dilutive shares 253 25 Class A common shares outstanding - 26,749 Conversion of Class B common units 112,083 112,608 Weighted average fully distributed shares outstanding - diluted 144,712 145,009 Reconciliation of GAAP EPS to Adjusted Fully Distributed EPS GAAP loss per share $ (11.53) $ (0.08) Impact of adjustment of redeemable limited partners' capital to redemption amount $ 11.82 $ - Impact of additions: Non-GAAP pro forma adjustment for revenue share post-IPO $ - $ (7.33) Income tax expense $ 0.18 $ 0.14 Stock-based compensation $ 0.20 $ 0.06 Acquisition related expenses $ 0.04 $ 0.03 Strategic and financial restructuring expenses $ 0.00 $ 0.33 Adjustment to tax receivable agreement liability $ (0.03) $ - Acquisition related adjustment - deferred revenue $ 0.06 $ - Amortization of purchased intangible assets $ 0.03 $ 0.11 Net income attributable to noncontrolling interest in Premier LP $ 1.69 $ 20.12 Impact of corporation taxes $ (0.98) $ (5.34) Impact of increased share count $ (1.15) $ (7.70) Non-GAAP pro forma earnings per share on adjusted fully distributed net income - diluted $ 0.33 $ 0.31 * Note that no pro forma adjustments were made for the three months ended September 30, 2014; as such, actual results are presented for the three months ended September 30, 2014. Three Months Ended September 30, Reporting of Net Income and Earnings Per Share Reconciliation of Selected Non-GAAP Measures to GAAP Measures |