Bank of America Merrill Lynch 2015 Health Care Conference May 13, 2015 Transforming Healthcare from the Inside Exhibit 99.1 |
2 © 2015 PREMIER, INC. Forward-looking statements—Certain statements included in this presentation, including, but not limited to, those related to our financial and business outlook, strategy and growth drivers, member retention rates and revenue visibility, cross and upsell opportunities, acquisition activities and pipeline, revenue available under contract, and 2015 financial guidance and related assumptions, are “forward- looking statements” within the meaning of the federal securities laws. Forward-looking statements may involve known and unknown risks, uncertainties and other factors that may cause the actual results of Premier to be materially different from historical results or from any future results or projections expressed or implied by such forward-looking statements. Accordingly, readers should not place undue reliance on any forward looking statements. Readers are urged to consider statements in the conditional or future tenses or that include terms such as “believes,” “belief,” “expects,” “estimates,” “intends,” “anticipates” or “plans” to be uncertain and forward-looking. Forward-looking statements may include comments as to Premier’s beliefs and expectations as to future events and trends affecting its business and are necessarily subject to uncertainties, many of which are outside Premier’s control. More information on potential risks and other factors that could affect Premier’s financial results is included, and updated, from time to time, in Premier’s periodic and current filings with the SEC, including Premier’s most recent Form 10-K for the year ended June 30, 2014. Forward- looking statements speak only as of the date they are made. Premier undertakes no obligation to publicly update or revise any forward-looking statements. Non-GAAP financial measures—This presentation includes certain “non-GAAP financial measures” as defined in Regulation G under the Securities Exchange Act of 1934. Schedules are attached that reconcile the non-GAAP financial measures included in this presentation to the most directly comparable financial measures calculated and presented in accordance with Generally Accepted Accounting Principles in the United States. Our Form 10-Q for the quarter ended March 31, 2015, filed on or about May 12, 2015, provides further explanation and disclosure regarding our use of non-GAAP financial measures and should be read in conjunction with this presentation. Forward-looking statements and Non-GAAP financial measures |
3 © 2015 PREMIER, INC. Our business at a glance Alliance of approximately 3,400 hospitals – 68% of U.S. community hospitals – and 110,000 alternate sites of care Approximately 74% owned by health systems ¹ ~$41 billion in group purchasing volume Insights into ~1 out of every 3 U.S. health system discharges Integrated clinical, financial and operational data Over 500 sales/field and advisory services employees that work with and inside our member hospitals Data as of September 30, 2014. (1) As of April 30, 2015. Premier’s unique customer alignment and data-driven intelligence platform allow us to help our health systems manage current challenges and build for the future… all at the same time |
© 2015 PREMIER, INC. Partnership model drives innovation and growth SCALE » Represent ~68% of U.S. community hospitals » Clinical, financial, operational data integrated on PremierConnect ® platform » Insights into ~1 out of every 3 U.S. health system discharges » Approximately $41 billion in supply chain spend » Manage ~1,900 contracts from ~1,100 suppliers ALIGNMENT » Members own ~74% of equity (1) » 10 health system board members » Premier field force embedded in member hospitals COMMITMENT » Member owner average tenure ~15 years (76% at 10+ years) » Members view Premier as strategic partner or organizational extension CO-INNOVATION » Co-develop solutions with members » Committees composed of ~165 member hospitals » ~1,100 hospitals in performance improvement collaboratives » Data Alliance Collaborative Note: Data as of September 30, 2014. (1) As of April 30, 2015. © 2015 PREMIER, INC. |
Unique business model generates multiple revenue drivers Performance Services 27% of FY’14 consolidated revenue INTEGRATED SALES/FIELD FORCE & Become the data analytics “backbone” with wrap-around services for cost and quality improvement over the short term and population health management solutions over the long term Change the game in supply chain, uncover unmatched savings and value, and lead the disruption of the industry Note: Consolidated revenue is presented on a non-GAAP pro forma basis for Supply Chain Services. See reconciliation pages in the appendix. Supply Chain Services » Group purchasing » Direct sourcing » Specialty pharmacy » Capital planning 73% of FY’14 consolidated revenue © 2015 PREMIER, INC. 5 » SaaS-based informatics products » PremierConnect ® Enterprise » Advisory services » Performance improvement collaboratives |
6 © 2015 PREMIER, INC. A platform for continuous performance improvement Manage Populations Improve Quality and Safety Reduce Costs PREMIERCONNECT SUPPLY CHAIN BILLING PURCHASING CLAIMS CLINICAL FINANCIAL Combines People, Process, and Technology |
7 © 2015 PREMIER, INC. the Third-quarter consolidated and segment highlights 1 Consolidated Net revenue (millions) Supply Chain Services Net revenue (millions) Performance Services Net revenue (millions) Adjusted EBITDA (millions) Adjusted EBITDA (millions) Adjusted EBITDA (millions) (1) See non-GAAP Adjusted EBITDA and non-GAAP Segment Adjusted EBITDA reconciliations to GAAP equivalents in Appendix. |
8 © 2015 PREMIER, INC. Third-quarter non-GAAP adjusted fully distributed net income 1 $0.34 $0.38 Non-GAAP earnings per share on adjusted fully distributed net income – diluted (1) See non-GAAP adjusted fully distributed net income and non-GAAP earnings per share on fully distributed net income reconciliations to GAAP equivalents in Appendix » Calculates income taxes at 40% on pre-tax income, assuming taxable C corporate structure » Calculates adjusted fully distributed earnings per share, assuming total Class A and B common shares held by public (in millions, except per share data) |
9 © 2015 PREMIER, INC. Fiscal 2015 annual guidance 1 1 Guidance is based on comparisons with prior-year non-GAAP pro forma results, which have been adjusted to reflect the impact of the company’s reorganization and IPO. The Company does not reconcile guidance for adjusted EBITDA and non-GAAP adjusted fully distributed net income per-share to net income (loss) or GAAP earnings per share because the Company does not provide guidance for reconciling items between net income (loss) and adjusted EBITDA and non-GAAP adjusted fully distributed earnings per share. The Company is unable to provide guidance for these reconciling items since certain items that impact net income (loss) are outside of the Company’s control and cannot be reasonably predicted. Accordingly, a reconciliation to net income (loss) or GAAP earnings per share is not available without unreasonable effort. Financial guidance for year ending June 30, 2015 (updated May 11, 2015): Supply Chain Services growth driven by: » 6%-7% net administrative fee revenue growth » 27%-32% product revenue growth » Continued high GPO retention rates Guidance Assumptions: Performance Services growth driven by: » Continued demand for integrated offerings of SaaS-based subscription and licensed products, advisory services and collaboratives » Continuation of high SaaS institutional renewal rates Updated Pro Forma Previous (in millions, except per share data) FY 2015 % YoY Change FY 2015 Net Revenue: Supply Chain Services segment $720.0 - $733.0 13% - 15% $706.0 - $725.0 Performance Services segment $268.0 - $275.0 15% - 18% $268.0 - $275.0 Total Net Revenue $988.0 - $1008.0 14% - 16% $974.0 - $1000.0 Non-GAAP adjusted EBITDA $384.0 - $392.0 9% - 12% $382.0 - $390.0 Non-GAAP adjusted fully distributed EPS $1.40 - $1.44 8% - 11% $1.40 - $1.44 Premier, Inc. updates full-year fiscal 2015 financial guidance, as follows: Fiscal 2015 Financial Guidance |
10 © 2015 PREMIER, INC. Cash flow and capital flexibility at March 31, 2015 » Year-to-date cash flow from operations of $255.6 million » Third-quarter free cash flow of $59.5 million 1 » Cash, cash equivalents and marketable securities of $503.3 million » No outstanding borrowings on $750 million five-year unsecured revolving credit facility CONSIDERABLE CASH AND DEBT CAPACITY AVAILABLE AMPLE CAPITAL FLEXIBILITY FOR FUTURE ACQUISITIONS AND BUSINESS GROWTH (1) Three months ended March 31, 2015. Company defines free cash flow as cash provided by operating activities less distributions to limited partners and purchases of property and equipment. See non-GAAP free cash flow reconciliation to GAAP equivalent in Appendix. |
11 © 2015 PREMIER, INC. Strategic acquisitions address member needs (Closed July 2013) (Closed October 2013) (Closed April 2014) (Closed August 2014) (Closed September 2014) Company Clinical & physician preference cost reduction Data acquisition from multiple technologies Health system capital expenditure cost reduction Supply chain technology enablement Quality & safety improvement Strategic Need Direct sourcing (Closed February 2015 1 ) (1) Purchased initial 60% ownership in 2011. Remaining 40% minority interest purchased on February 2, 2015. |
12 © 2015 PREMIER, INC. Attractive opportunities for further capital deployment Supply Chain Services Performance Services Diverse and growing end markets to drive Premier’s growth |
13 © 2015 PREMIER, INC. Key investment differentiators Unique customer alignment Data-driven, technology enabled Diversified growth engine Compelling financial profile © 2015 PREMIER, INC. 13 |
Thank you For more information contact: Jim Storey Vice President, Investor Relations Premier, Inc. 704-816-5958 jim_storey@premierinc.com |
15 © 2015 PREMIER, INC. Appendix “Data, data, everywhere... … and not a drop to drink!” Premier is a uniquely-aligned healthcare performance improvement company that provides integrated data-analytics and business intelligence to comprehensively reduce costs, improve quality, and drive better patient outcomes. |
16 © 2015 PREMIER, INC. Our leadership team Susan DeVore, President and CEO 11 years Premier; 26 years healthcare Cap Gemini Ernst & Young Mike Alkire, COO 10 years Premier; 11 years healthcare Cap Gemini Ernst & Young Craig McKasson, CFO 17 years Premier; 21 years healthcare Ernst & Young Jeff Lemkin, General Counsel 4 years Premier; 41 years healthcare McDermott Will & Emery Terry Linn, SVP, Strategy 4 years Premier; 31 years healthcare Ernst & Young, American Medical International, Charter Medical Kelli Price, SVP, People 14 years Premier; 16 years healthcare Malcolm Baldrige National Quality Award expert Blair Childs, SVP, Public Affairs 7 years Premier; 26 years healthcare AdvaMed Durral Gilbert, President, Supply Chain Services 8 years Premier; 8 years healthcare BDS Management, Wachovia Securities Wes Champion, SVP, Performance Partners 7 years Premier; 23 years healthcare Cap Gemini Ernst & Young, Accenture Gary Long, SVP, Chief Sales Officer 2 years Premier; 21 years healthcare McKesson Andy Brailo, SVP, Member Field Services 13 years Premier; 21 years healthcare Medibuy, Bard Keith Figlioli, SVP, Informatics 5 years Premier; 11 years HIT Eclipsys (acquired by Allscripts) Jeff Petry, SVP, Marketing 17 years Premier; 23 years healthcare Mezzia, The Advisory Board Company |
17 © 2015 PREMIER, INC. Our multiple business and growth drivers 1 GPO Specialty pharmacy Direct sourcing SaaS-based informatics products Performance improvement collaboratives Advisory services Data management/ warehousing Business Revenue Drivers FY’14 Results 1 Net Revenue 14% Segment Adjusted EBITDA 9% Net Revenue 13% Segment Adjusted EBITDA 31% Net Revenue 14% Adjusted EBITDA 12% Adjusted fully distributed EPS 9% Consolidated • Administrative fees paid by suppliers • Drug reimbursement • Fee for service • Product sales of contract manufactured items • SaaS-based subscriptions • Fee-for-service • Fee-for-service • SaaS-based subscriptions • SaaS-based subscriptions • Significant stickiness • Strong visibility across diverse revenue streams (1) Results are presented on a non-GAAP pro forma basis. See Adjusted EBITDA, Segment Adjusted EBITDA and fully distributed net income reconciliation to GAAP equivalent in the Appendix. Net Revenue 11% - 14% Adjusted EBITDA 8% - 11% Adjusted fully distributed EPS 7% - 11% |
18 © 2015 PREMIER, INC. MULTIPLE GROWTH DRIVERS • Consolidated double-digit net revenue and adjusted EBITDA (1) growth • Diversified revenue opportunities in Supply Chain Services and Performance Services • Multiple emerging growth drivers HIGH VISIBILITY • High retention rates in both business segments • 5-7 year contracts in Supply Chain Services and 3-5 year SaaS-based subscription contracts in Performance Services • Fiscal 2015 revenue visibility over 90% ATTRACTIVE ECONOMIC MODEL • Significant cross and upsell opportunities in existing member base • High margins and low marginal cost to support new GPO members and further penetration of existing GPO members • SaaS-based products generate high returns on new wins EVOLVING BUSINESS MIX • Investments in emerging growth initiatives will impact adjusted EBITDA (1) margins, but enhance adjusted EBITDA (1) growth • Capital investments increase D&A, impacting near-term net income margins DISCIPLINED CAPITAL DEPLOYMENT TRACK RECORD • Strong returns on acquired assets • Strategic, financial and execution framework in place for capital deployment Demonstrated financial model and performance (1) See Adjusted EBITDA reconciliation to GAAP equivalent in Appendix. |
19 © 2015 PREMIER, INC. the Fiscal year-to-date nine-month financial highlights 1 Consolidated Net revenue (millions) Supply Chain Services Net revenue (millions) Performance Services Net revenue (millions) Adjusted EBITDA (millions) Adjusted EBITDA (millions) Adjusted EBITDA (millions) (1) Comparisons are with year-ago non-GAAP pro forma information that reflects the impact of the company’s reorganization and initial public offering. See Adjusted EBITDA, Segment Adjusted EBITDA and Adjusted Fully Distributed Net Income reconciliations to GAAP equivalents in Appendix. |
20 © 2015 PREMIER, INC. Significant Fiscal 2015 revenue visibility: 90+% PERFORMANCE METRICS 1 FY 2015 FY 2014 3 Year Average Revenue available under contract $898M --- --- GPO retention rate 2 --- 99% 97% SaaS institutional renewal rate 3 --- 94% 94% (1) As of fiscal year-end June 30, 2014 (2) The retention rate is calculated based upon the aggregate purchasing volume among all members participating in our GPO for such fiscal year less the annualized GPO purchasing volume for departed members for such fiscal year, divided by the aggregate purchasing volume among all members participating in our GPO for such fiscal year. (3) The renewal rate is calculated based upon the total number of members that have SaaS revenue in a given period that also have revenue in the corresponding prior year period divided by the total number of members that have SaaS revenue in the same period of the prior year. OVER 90% FY 2015 REVENUE GUIDANCE RANGE ALREADY AVAILABLE UNDER CONTRACT HIGH GPO RETENTION AND SAAS INSTITUTIONAL RENEWAL RATES |
21 © 2015 PREMIER, INC. Expanding supply chain solutions Steady acute GPO growth “Other” Upside Performance Services Supply Chain Services Non-acute and complementary services expansion Top Priority Strategic Initiatives Expanded cost reduction Non acute and pharmacy growth Supply chain technology Member penetration performance services New product development M&A and growth opportunities Attributes Strong distribution channel Desired expertise/ capabilities Top Priority Strategic Initiatives Clinical integration/ shared services Ambulatory data expansion Population health capabilities Multiple opportunities to drive long-term sustainable growth |
22 © 2015 PREMIER, INC. Structural implications of Premier, Inc. Structure Structured as “Up-C” with Premier, Inc. (parent C-Corp above operating partnership and subsidiaries) Premier, Inc. formed with two classes of stock • Class A shares held by public investors • Class B shares allocated to member owners 22% of Limited Partner interests sold to public, 78% retained by member owners as Class B units Class B units eligible to exchange 1/7th per year, over seven-year period Exchange of Class B units for A-shares (on a 1-for-1 basis) as B-units become eligible for exchange subject to ROFR by members owners and Premier, Inc. First exchange on October 31, 2014, and subsequent company directed offering injected 3.9 million shares of liquidity into the public market, resulting in public ownership of 26% and member owner interest of 74% Given Up-C structure and differences between taxes paid by our Class A unit holder (Premier GP) vs. distributions to our Class B unit holders (members owners), we calculate Adjusted Fully Distributed Net Income¹ for comparability purposes Reflects taxes and net income as if the Company was a C-Corp for all periods presented Class A and Class B shares will be used to calculate fully diluted EPS to eliminate variability due to member exchanges over time Impact of IPO and Exchange Process Adjusted fully distributed net income Share count (1) See Adjusted EBITDA and Adjusted Fully Distributed Net Income reconciliations to GAAP equivalents in Appendix |
23 © 2015 PREMIER, INC. Member owners allocated income in operating partnership based on percentage ownership Income tax expense equals 40% of income attributable to Premier, Inc. Member owners receive tax distribution to cover any tax liability on allocated income Amount of retained profitability in business equal regardless of ownership structure Reflects 41% tax rate on 100% of pretax income (assumes full C-Corp tax treatment) Amount paid for taxes equal regardless of ownership structure Illustrative impact of ownership structure Ownership (1) 22% Class A / 78% Class B Ownership 100% Class A 1 For illustrative purposes only. Ownership percentage is based on structure at the time of the October 2013 initial public offering and will change over time. Income Statement Net Revenue 500,000 500,000 Cost of Revenue 200,000 200,000 Gross Profit 300,000 300,000 Operating Expenses 140,000 140,000 Operating Income 160,000 160,000 Net Income Attributable to NCI in Premier LP (124,800) - Pre-Tax Income Attributable to Premier Inc. 35,200 160,000 Income Tax Expense 14,080 64,000 Net Income Attributable to Premier, Inc. 21,120 96,000 Income Retained in Business Net Income Attributable to Premier, Inc. 21,120 96,000 Net Income Attributable to NCI in Premier LP 124,800 - Tax Distribution to Premier LP Limited Partners (49,920) - Net Income Retained in Business 96,000 96,000 Adjusted Fully Distributed Net Income Net Income Attributable to Premier, Inc. 21,120 96,000 Add: Income Tax Expense 14,080 64,000 Add: Net Income Attributable to NCI in Premier 124,800 - Fully Distributed Income Before Income Taxes 160,000 160,000 Adjusted for income tax expense on fully distributed net income before income taxes 64,000 64,000 Adjusted Fully Distributed Net Income 96,000 96,000 Income Taxes/Tax Distributions Income Tax Expense 14,080 64,000 Tax Distribution to Class B Limited Partners 49,920 - Total Tax, including tax distribution to limited partners 64,000 64,000 |
24 © 2015 PREMIER, INC. Fiscal 2014 and fiscal 2013 non-GAAP reconciliations Reconciliation of Selected Non-GAAP Measures to GAAP Measures (Unaudited, in thousands) Adjustments Adjustments Amount % of Net Revenue Amount Amount % of Net Revenue Amount % of Net Revenue Amount Amount % of Net Revenue Net revenue: Net administrative fees 464,837 $ 51% (41,263) $ 423,574 $ 49% 519,219 $ 60% (105,012) $ 414,207 $ 54% Other services and support 233,186 26% - 233,186 27% 205,685 24% - 205,685 27% Services 698,023 77% (41,263) 656,760 76% 724,904 84% (105,012) 619,892 81% Products 212,526 23% - 212,526 24% 144,386 16% - 144,386 19% Net revenue 910,549 100% (41,263) 869,286 100% 869,290 100% (105,012) 764,278 100% Cost of revenue: Services 115,740 13% - 115,740 13% 103,795 12% - 103,795 14% Products 191,885 21% - 191,885 22% 133,618 15% - 133,618 17% Cost of revenue 307,625 34% - 307,625 35% 237,413 27% - 237,413 31% Gross profit 602,924 66% (41,263) 561,661 65% 631,877 73% (105,012) 526,865 69% Operating expenses: Selling, general and administrative 294,421 33% - 294,421 35% 248,301 29% - 248,301 33% Research and development 3,389 — % - 3,389 — % 9,370 1% - 9,370 1% Amortization of purchased intangible assets 3,062 — % - 3,062 — % 1,539 — % - 1,539 — % Total operating expenses 300,872 33% - 300,872 35% 259,210 30% - 259,210 34% Operating income 302,052 33% (41,263) 260,789 30% 372,667 43% (105,012) 267,655 35% Other income, net 58,274 6% - 58,274 7% 12,145 1% - 12,145 2% Income before income taxes 360,326 40% (41,263) 319,063 37% 384,812 44% (105,012) 279,800 37% Income tax expense 27,709 3% (3,239) 24,470 3% 9,726 1% 22,813 32,539 4% Net income 332,617 37% (38,024) 294,593 34% 375,086 43% (127,825) 247,261 33% Net (income) loss attributable to noncontrolling interest in S2S Global (949) — % - (949) — % 1,479 — % - 1,479 — % Net income attributable to noncontrolling interest in Premier LP (303,336) (33)% 57,690 (245,646) (28)% (369,189) (42)% 150,726 (218,463) (29)% Net income attributable to noncontrolling interest (304,285) (33)% 57,690 (246,595) (28)% (367,710) (42)% 150,726 (216,984) (29)% Net income attributable to shareholders 28,332 $ 4% 19,666 $ 47,998 $ 6% 7,376 $ 1% 22,901 $ 30,277 $ 4% Adjustment of redeemable limited partners' capital to redemption amount (2,741,588) $ nm - $ (2,741,588) $ nm - $ nm - $ - $ nm Net income (loss) attributable to shareholders after adjustment of redeemable partners' capital to redemption amount (2,713,256) $ nm 19,666 $ (2,693,590) $ nm 7,376 $ nm 22,901 $ 30,277 $ nm Adjusted EBITDA 392,288 $ 43% (41,263) $ 351,025 $ 40% 419,025 $ 48% (105,012) $ 314,013 $ 41% Adjusted Fully Distributed Net Income na na na 188,561 $ 22% na na na 172,793 $ 23% nm - Not meaningful na - Not applicable Actual Actual Non-GAAP Pro Forma Year Ended June 30, 2014 2013 Non-GAAP Pro Forma |
25 © 2015 PREMIER, INC. Fiscal 2014 and fiscal 2013 non-GAAP reconciliations (Unaudited, in thousands) Actual Adjustments Non-GAAP Pro Forma Actual Adjustments Non-GAAP Pro Forma Reconciliation of Non-GAAP Pro Forma Net Revenue to Net Revenue: Supply Chain Services 678,141 $ (41,263) $ 636,878 $ 664,076 $ (105,012) $ 559,064 $ Performance Services 232,408 - 232,408 205,214 - 205,214 Net Revenue 910,549 (41,263) 869,286 869,290 (105,012) 764,278 Reconciliation of Net Income to Adjusted EBITDA and Reconciliation of Segment Adjusted EBITDA to Income Before Income Taxes: Net income 332,617 $ (38,024) $ 294,593 $ 375,086 $ (127,825) $ 247,261 $ Interest and investment income, net (1,019) - (1,019) (965) - (965) Income tax expense 27,709 (3,239) 24,470 9,726 22,813 32,539 Depreciation and amortization 36,761 - 36,761 27,681 - 27,681 Amortization of purchased intangible assets 3,062 - 3,062 1,539 - 1,539 EBITDA 399,130 (41,263) 357,867 413,067 (105,012) 308,055 Stock-based compensation expense 19,476 - 19,476 - - - Acquisition related expenses 2,014 - 2,014 - - - Strategic and financial restructuring expenses 3,760 - 3,760 5,170 - 5,170 Gain on sale of investment (38,372) - (38,372) - - - Adjustment to tax receivable agreement liability 6,215 - 6,215 - - - Other (income) expense, net 65 - 65 788 - 788 Adjusted EBITDA 392,288 $ (41,263) $ 351,025 $ 419,025 $ (105,012) $ 314,013 $ Segment Adjusted EBITDA: Supply Chain Services 396,470 $ (41,263) $ 355,207 $ 431,628 $ (105,012) $ 326,616 $ Performance Services 73,898 - 73,898 56,456 - 56,456 Corporate (78,080) - (78,080) (69,059) - (69,059) Adjusted EBITDA 392,288 (41,263) 351,025 419,025 (105,012) 314,013 Depreciation and amortization (36,761) - (36,761) (27,681) - (27,681) Amortization of purchased intangible assets (3,062) - (3,062) (1,539) - (1,539) Stock-based compensation expense (19,476) - (19,476) - - - Acquisition related expenses (2,014) - (2,014) - - - Strategic and financial restructuring expenses (3,760) - (3,760) (5,170) - (5,170) Adjustment to tax receivable agreement liability (6,215) - (6,215) - - - Equity in net income of unconsolidated affiliates (16,976) - (16,976) (11,968) - (11,968) Deferred compensation plan expense (1,972) - (1,972) - - - Operating income 302,052 (41,263) 260,789 372,667 (105,012) 267,655 Equity in net income of unconsolidated affiliates 16,976 - 16,976 11,968 - 11,968 Interest and investment income, net 1,019 - 1,019 965 - 965 Gain on sale of investment 38,372 - 38,372 - - - Other income (expense), net 1,907 - 1,907 (788) - (788) Income before income taxes 360,326 $ (41,263) $ 319,063 $ 384,812 $ (105,012) $ 279,800 $ Year Ended June 30, 2014 2013 |
26 © 2015 PREMIER, INC. Fiscal 2014 and fiscal 2013 non-GAAP reconciliations Reconciliation of Selected Non-GAAP Measures to GAAP Measures (Unaudited, in thousands) 2014 2013 28,332 $ 7,376 $ (41,263) (105,012) 27,709 9,726 19,476 — 2,014 — 3,760 5,170 (38,372) — 6,215 — 3,062 1,539 303,336 369,189 314,269 287,988 125,708 115,195 188,561 $ 172,793 $ Non-GAAP Pro forma fully distributed income before income taxes Income tax expense on fully distributed income before income taxes Non-GAAP Pro Forma Adjusted Fully Distributed Net Income Acquisition related expenses Strategic and financial restructuring expenses Gain on sale of investment Adjustment to tax receivable agreement liability Amortization of purchased intangible assets Net income attributable to noncontrolling interest in Premier LP Stock-based compensation expense Year Ended June 30, Net income attributable to shareholders Pro forma adjustment for revenue share post-IPO Income tax expense |
27 © 2015 PREMIER, INC. Fiscal 2014 and fiscal 2013 non-GAAP reconciliations 2014 2013 Reconciliation of numerator for GAAP EPS to Non-GAAP EPS on Adjusted Fully Distributed Net Income Net income (loss) attributable to shareholders after adjustment of redeemable limited partners' capital to redemption amount (2,713,256) $ 7,376 $ Adjustment of redeemable limited partners' capital to redemption amount 2,741,588 - Net income (loss) attributable to shareholders 28,332 7,376 Pro forma adjustment for revenue share post-IPO (41,263) (105,012) Income tax expense 27,709 9,726 Stock-based compensation 19,476 — Gain on sale of investment (38,372) — Acquisition related expenses 2,014 — Strategic and financial restructuring expenses 3,760 5,170 Adjustment to tax receivable agreement liability 6,215 — Amortization of purchased intangible assets 3,062 1,539 Net income attributable to noncontrolling interest in Premier LP 303,336 369,189 Non-GAAP pro forma adjusted fully distributed income before income taxes 314,269 287,988 Income tax expense on fully distributed income before income taxes 125,708 115,195 Non-GAAP pro forma adjusted fully distributed net income 188,561 $ 172,793 $ Reconciliation of denominator for GAAP EPS to Non-GAAP to Adjusted Fully Distributed Net Income Weighted Average: Common shares used for basic and diluted earnings per share 25,633 5,858 Potentially dilutive shares 124 - Class A common shares outstanding 6,742 26,517 Conversion of Class B common units 112,584 112,608 Weighted average fully distributed shares outstanding - diluted 145,083 144,983 Reconciliation of GAAP EPS to Adjusted Fully Distributed EPS GAAP income (loss) per share $ (105.85) $ 1.26 Impact of adjustment of redeemable limited partners' capital to redemption amount $ 106.96 $ - Impact of additions: Pro forma adjustment for revenue share post-IPO $ (1.61) $ (17.93) Income tax expense $ 1.08 $ 1.66 Stock-based compensation $ 0.76 $ - Gain on sale of investment $ (1.50) $ - Acquisition related expenses $ 0.08 $ - Strategic and financial restructuring expenses $ 0.15 $ 0.88 Adjustment to tax receivable agreement liability $ 0.24 $ - Amortization of purchased intangible assets $ 0.12 $ 0.26 Net income attributable to noncontrolling interest in Premier LP $ 11.83 $ 63.02 Impact of corporation taxes $ (4.90) $ (19.66) Impact of increased share count $ (6.06) $ (28.31) Non-GAAP earnings per share on adjusted fully distributed net income - diluted $ 1.30 $ 1.19 Supplemental Financial Information - Reporting of Net Income and Earnings Per Share Reconciliation of Selected Non-GAAP Measures to GAAP Measures (Unaudited) (In thousands) Year Ended June 30, |
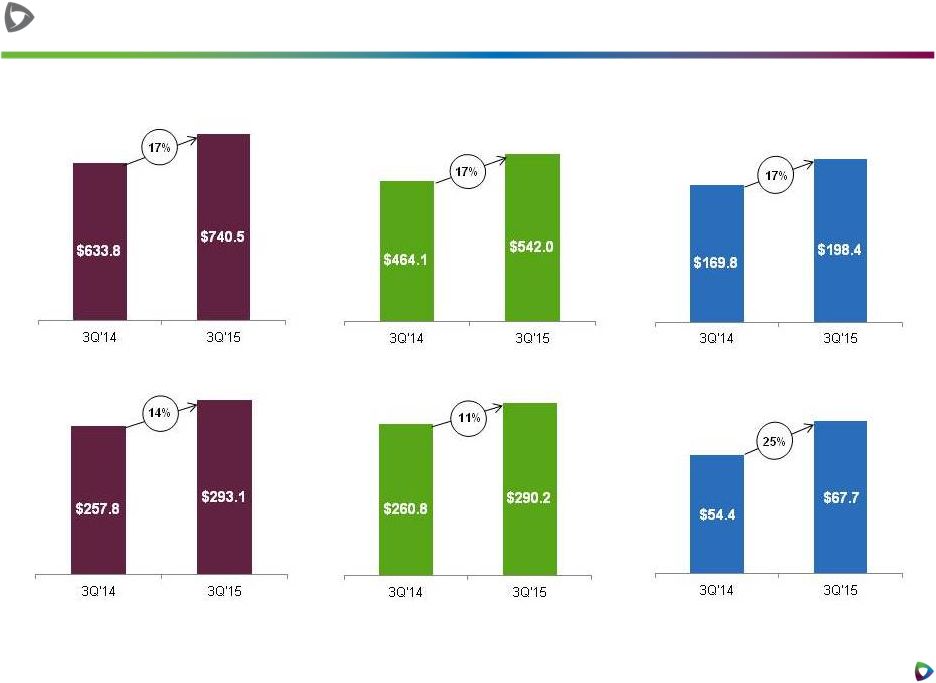
28 © 2015 PREMIER, INC. Fiscal 2015 and fiscal 2014 non-GAAP reconciliations 2015* 2014* 2015* 2014 Reconciliation of Pro Forma Net Revenue to Net Revenue: Pro Forma Net Revenue 261,723 $ 225,598 $ 740,476 $ 633,820 $ Pro forma adjustment for revenue share post-IPO — — — 41,263 Net Revenue 261,723 $ 225,598 $ 740,476 $ 675,083 $ Net income 72,029 $ 101,980 $ 202,724 $ 265,985 $ Pro forma adjustment for revenue share post-IPO — — — (41,263) Interest and investment income, net (204) (400) (517) (641) Income tax expense 2,026 9,413 12,107 24,461 Depreciation and amortization 11,538 9,396 33,107 26,952 Amortization of purchased intangible assets 2,554 802 6,598 2,158 EBITDA 87,943 121,191 254,019 277,652 Stock-based compensation 7,285 6,299 21,129 13,118 Acquisition related expenses 2,863 984 6,408 1,303 Strategic and financial restructuring expenses 2 733 1,281 3,614 Loss (gain) on investment 1,000 (37,850) 1,000 (37,850) Adjustment to tax receivable agreement liability 1,073 — — — Acquisition related adjustment - deferred revenue 3,563 — 9,224 — Other expense (income), net 16 (52) 10 (56) Adjusted EBITDA 103,745 $ 91,305 $ 293,071 $ 257,781 $ Segment Adjusted EBITDA: Supply Chain Services 101,600 $ 91,477 $ 290,210 $ 302,076 $ Pro forma adjustment for revenue share post-IPO — — — (41,263) Supply Chain Services (including pro forma adjustment) 101,600 $ 91,477 $ 290,210 $ 260,813 $ Performance Services 26,166 20,307 67,717 54,367 Corporate (24,021) (20,479) (64,856) (57,399) Adjusted EBITDA 103,745 $ 91,305 $ 293,071 $ 257,781 $ Depreciation and amortization (11,538) (9,396) (33,107) (26,952) Amortization of purchased intangible assets (2,554) (802) (6,598) (2,158) Stock-based compensation (7,285) (6,299) (21,129) (13,118) Acquisition related expenses (2,863) (984) (6,408) (1,303) Strategic and financial restructuring expenses (2) (733) (1,281) (3,614) Adjustment to tax receivable agreement liability (1,073) — — — Acquisition related adjustment - deferred revenue (3,563) — (9,224) — Equity in net income of unconsolidated affiliates (5,197) (3,566) (14,812) (12,171) Deferred compensation plan (income) expense (759) — 209 — 68,911 69,525 200,721 198,465 Pro forma adjustment for revenue share post-IPO — — — 41,263 Operating income 68,911 $ 69,525 $ 200,721 $ 239,728 $ Equity in net income of unconsolidated affiliates 5,197 3,566 14,812 12,171 Interest and investment income, net 204 400 517 641 (Loss) gain on investment (1,000) 37,850 (1,000) 37,850 Other income (expense), net 743 52 (219) 56 Income before income taxes 74,055 $ 111,393 $ 214,831 $ 290,446 $ * Note that no pro forma adjustments were made for the three and nine months ended March 31, 2015 and the three months ended March 31, 2014; as such, actual results are presented for each of these periods. Three Months Ended March 31, Nine Months Ended March 31, Supplemental Financial Information - Reporting of Pro Forma Adjusted EBITDA (Unaudited) (In thousands) Reconciliation of Selected Non-GAAP Measures to GAAP Measures and Non-GAAP Adjusted Fully Distributed Net Income Reconciliation of Net Income to Adjusted EBITDA and Reconciliation of Segment Adjusted EBITDA to Income Before Income Taxes: |
29 © 2015 PREMIER, INC. Fiscal 2015 and fiscal 2014 non-GAAP reconciliations 2015* 2014* 2015* 2014 Reconciliation of Non-GAAP Pro Forma Adjusted Fully Distributed Net Income: Net income attributable to shareholders 12,209 $ 13,525 $ 30,753 $ 19,453 $ Pro forma adjustment for revenue share post-IPO — — — (41,263) Income tax expense 2,026 9,413 12,107 24,461 Stock-based compensation 7,285 6,299 21,129 13,118 Acquisition related expenses 2,863 984 6,408 1,303 Strategic and financial restructuring expenses 2 733 1,281 3,614 Loss (gain) on investment 1,000 (37,850) 1,000 (37,850) Adjustment to tax receivable agreement liability 1,073 — — — Acquisition related adjustment - deferred revenue 3,563 — 9,224 — Amortization of purchased intangible assets 2,554 802 6,598 2,158 Net income attributable to noncontrolling interest in Premier LP 59,568 87,925 170,135 246,055 Non-GAAP pro forma adjusted fully distributed income before income taxes 92,143 81,831 258,635 231,049 Income tax expense on fully distributed income before income taxes 36,857 32,732 103,454 92,420 Non-GAAP Pro Forma Adjusted Fully Distributed Net Income 55,286 $ 49,099 $ 155,181 $ 138,629 $ * Note that no pro forma adjustments were made for the three and nine months ended March 31, 2015 and the three months ended March 31, 2014; as such, actual results are presented for each of these periods. Three Months Ended March 31, Nine Months Ended March 31, Supplemental Financial Information - Reporting of Pro Forma Adjusted EBITDA (Unaudited) (In thousands) Reconciliation of Selected Non-GAAP Measures to GAAP Measures and Non-GAAP Adjusted Fully Distributed Net Income |
30 © 2015 PREMIER, INC. Fiscal 2015 and fiscal 2014 non-GAAP reconciliations 2015 2014 Reconciliation of Non-GAAP Free Cash Flow to Net Cash Provided by Operating Activities: Net cash provided by operating activities 101,860 $ 90,173 $ Purchases of property and equipment (18,653) (13,823) Distributions to limited partners (23,701) (17,419) Non-GAAP free cash flow 59,506 $ 58,931 $ Non-GAAP Adjusted EBITDA 103,745 $ 91,305 $ Supplemental Financial Information - Reporting of Non-GAAP Free Cash Flow Reconciliation of Selected Non-GAAP Measures to GAAP Measures (Unaudited) (In thousands) Three Months Ended March 31, |
31 © 2015 PREMIER, INC. Fiscal 2015 and fiscal 2014 non-GAAP reconciliations 2015* 2014* 2015* 2014 Reconciliation of numerator for GAAP EPS to Non-GAAP EPS on Adjusted Fully Distributed Net Income Net income (loss) attributable to shareholders after adjustment of redeemable limited partners' capital to redemption amount (374,853) $ 509,239 $ (781,216) $ (3,204,645) $ Adjustment of redeemable limited partners' capital to redemption amount 387,062 (495,714) 811,969 3,224,098 Net income attributable to shareholders 12,209 13,525 30,753 19,453 Pro forma adjustment for revenue share post-IPO — — — (41,263) Income tax expense 2,026 9,413 12,107 24,461 Stock-based compensation 7,285 6,299 21,129 13,118 Acquisition related expenses 2,863 984 6,408 1,303 Strategic and financial restructuring expenses 2 733 1,281 3,614 Loss (gain) on investment 1,000 (37,850) 1,000 (37,850) Adjustment to tax receivable agreement liability 1,073 — — — Acquisition related adjustment - deferred revenue 3,563 — 9,224 — Amortization of purchased intangible assets 2,554 802 6,598 2,158 Net income attributable to noncontrolling interest in Premier LP 59,568 87,925 170,135 246,055 Non-GAAP pro forma adjusted fully distributed income before income taxes 92,143 81,831 258,635 231,049 Income tax expense on fully distributed income before income taxes 36,857 32,732 103,454 92,420 Non-GAAP pro forma adjusted fully distributed net income 55,286 $ 49,099 $ 155,181 $ 138,629 $ Reconciliation of denominator for GAAP EPS to Non-GAAP Adjusted Fully Distributed Net Income Weighted Average: Common shares used for basic and diluted earnings per share 37,316 32,375 35,066 23,394 Potentially dilutive shares 1,148 181 845 100 Class A common shares outstanding - - - 8,981 Conversion of Class B common units 106,706 112,608 109,184 112,608 Weighted average fully distributed shares outstanding - diluted 145,170 145,164 145,095 145,083 Reconciliation of GAAP EPS to Adjusted Fully Distributed EPS GAAP earnings (loss) per share $ (10.05) $ 15.73 $ (22.28) $ (136.99) Impact of adjustment of redeemable limited partners' capital to redemption amount $ 10.37 $ (15.31) $ 23.16 $ 137.82 Impact of additions: Pro forma adjustment for revenue share post-IPO $ - $ - $ - $ (1.76) Income tax expense $ 0.05 $ 0.29 $ 0.35 $ 1.05 Stock-based compensation $ 0.20 $ 0.19 $ 0.60 $ 0.56 Acquisition related expenses $ 0.08 $ 0.03 $ 0.18 $ 0.06 Strategic and financial restructuring expenses $ 0.00 $ 0.02 $ �� 0.04 $ 0.15 Loss (gain) on investment $ 0.03 $ (1.17) $ 0.03 $ (1.62) Adjustment to tax receivable agreement liability $ 0.03 $ - $ - $ - Acquisition related adjustment - deferred revenue $ 0.10 $ - $ 0.26 $ - Amortization of purchased intangible assets $ 0.07 $ 0.02 $ 0.19 $ 0.09 Net income attributable to noncontrolling interest in Premier LP $ 1.60 $ 2.72 $ 4.85 $ 10.52 Impact of corporation taxes $ (0.99) $ (1.01) $ (2.95) $ (3.95) Impact of increased share count $ (1.11) $ (1.17) $ (3.36) $ (4.97) Non-GAAP earnings per share on adjusted fully distributed net income - diluted $ 0.38 $ 0.34 $ 1.07 $ 0.96 * Note that no pro forma adjustments were made for the three and nine months ended March 31, 2015 and the three months ended March 31, 2014; as such, actual results are presented for each of these periods. Three Months Ended March 31, Nine Months Ended March 31, Supplemental Financial Information - Reporting of Net Income and Earnings Per Share (Unaudited) (In thousands, except per share data) Reconciliation of Selected Non-GAAP Measures to GAAP Measures |