|
Exhibit 99.3 
|
First-Quarter Fiscal
Year 2017 Financial
Results and Update
November 7, 2016
1
Forward-looking statements and Non-GAAP financial measures
Forward-looking statements Certain statements included in this presentation, including, but not limited to, those related to our financial and business outlook, strategy and growth drivers, member retention and renewal rates and revenue visibility, cross and upsell opportunities, acquisition activities and pipeline, revenue available under contract, 2017 financial guidance and related assumptions, and target growth rate are forward-looking statements within the meaning of the federal securities laws. Forward-looking statements may involve known and unknown risks, uncertainties and other factors that may cause the actual results of Premier to be materially different from historical results or from any future results or projections expressed or implied by such forward-looking statements. Accordingly, readers should not place undue reliance on any forward looking statements. Readers are urged to consider statements in the conditional or future tenses or that include terms such as believes, belief, expects, estimates, intends, anticipates or plans to be uncertain and forward-looking. Forward-looking statements may include comments as to Premier’s beliefs and expectations as to future events and trends affecting its business and are necessarily subject to uncertainties, many of which are outside Premier’s control. You should carefully read Premier’s current and future filings with the SEC for more information on potential risks and other factors that could affect Premier’s financial results. Forward-looking statements speak only as of the date they are made. Premier undertakes no obligation to publicly update or revise any forward-looking statements.
Non-GAAP financial measures This presentation includes certain non-GAAP financial measures as defined in Regulation G under the
Securities Exchange Act of 1934. Schedules are attached that reconcile the non-GAAP financial measures included in this presentation to the most directly comparable financial measures calculated and presented in accordance with Generally Accepted Accounting Principles in the
United States. You should carefully read Premier’s current and future filings with the SEC for definitions and further explanation and disclosure regarding our use of non-GAAP financial measures and such filings should be read in conjunction with this presentation.
2
Overview and Business Update
Susan DeVore President & CEO
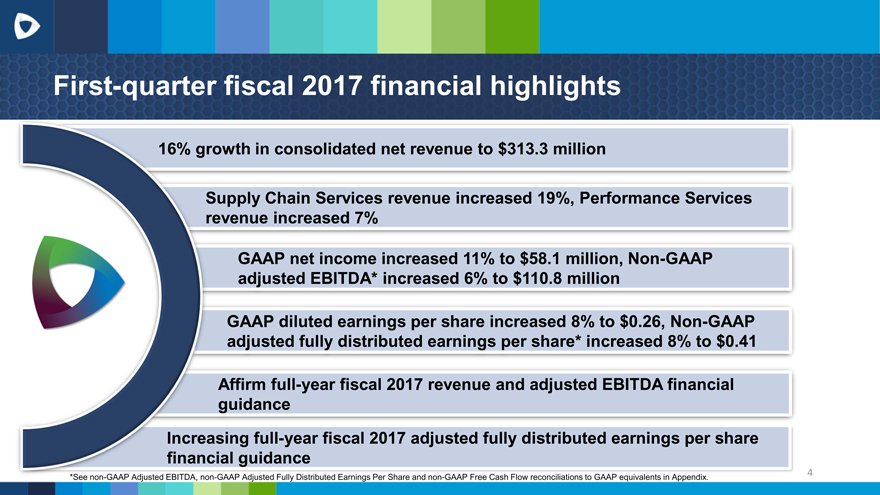
First-quarter fiscal 2017 financial highlights
growth in consolidated net revenue to $313.3 million
Supply Chain Services revenue increased 19%, Performance Services
revenue increased 7%
GAAP net income increased 11% to $58.1 million, Non-GAAP
adjusted EBITDA* increased 6% to $110.8 million
GAAP diluted earnings per share increased 8% to $0.26, Non-GAAP
adjusted fully distributed earnings per share* increased 8% to $0.41
Affirm full-year fiscal 2017 revenue and adjusted EBITDA financial
guidance
sing full-year fiscal 2017 adjusted fully distributed earnings per share
ial guidance
4
*See non-GAAP Adjusted EBITDA, non-GAAP Adjusted Fully Distributed Earnings Per Share and non-GAAP Free Cash Flow reconciliations to GAAP equivalents in Appendix.
Operations Update
Michael Alkire
Chief Operating Officer
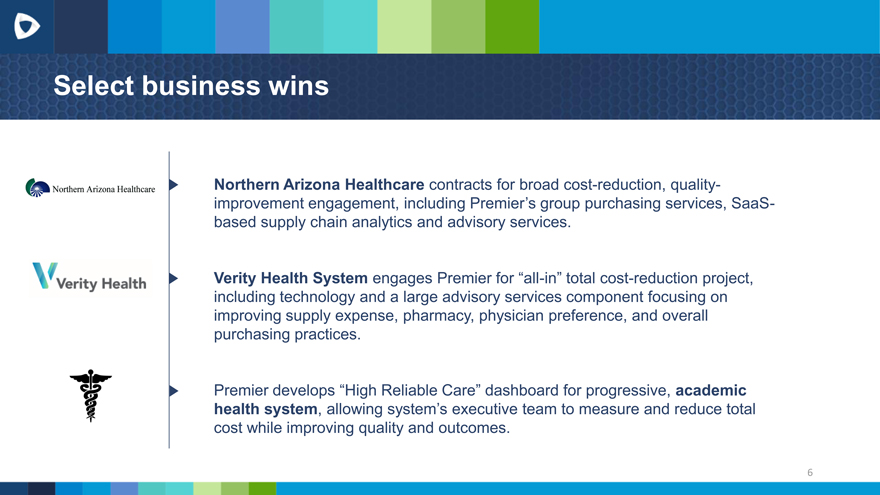
Select business wins
Northern Arizona Healthcare contracts for broad cost-reduction, quality-
improvement engagement, including Premier’s group purchasing services, SaaS-
based supply chain analytics and advisory services.
Verity Health System engages Premier for all-in total cost-reduction project, including technology and a large advisory services component focusing on improving supply expense, pharmacy, physician preference, and overall purchasing practices.
Premier develops High Reliable Care dashboard for progressive, academic health system, allowing system’s executive team to measure and reduce total cost while improving quality and outcomes.
6
Integrated Pharmacy opportunities
Drive down Create Drive
costs pricing competitive
transparency friction
7
Financial Review
Craig McKasson Chief Financial Officer
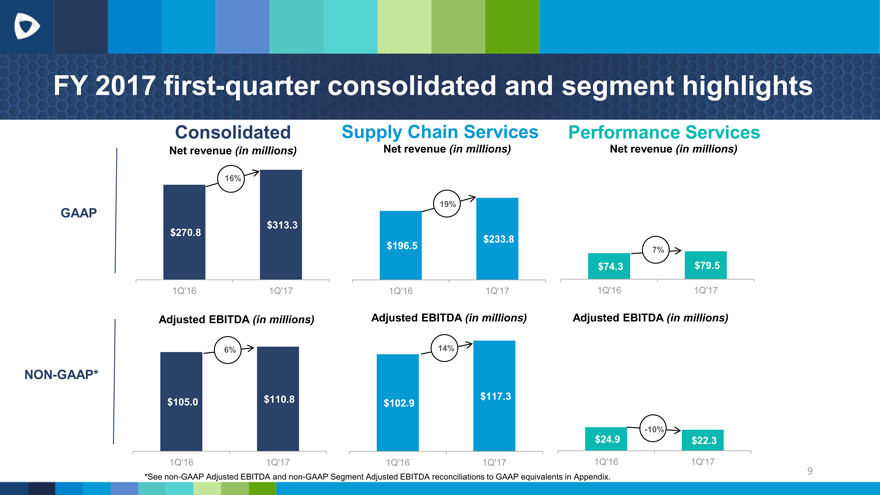
FY 2017 first-quarterconsolidated andsegment highlights
ConsolidatedSupply Chain ServicesPerformance Services
Net revenue (in millions)Net revenue (in millions)Net revenue (in millions)
16%
19%
GAAP
$313.3 $270.8 $233.8 $196.5 7% $74.3 $79.5
1Q’16 1Q’17 1Q’16 1Q’17 1Q’16 1Q’17
Adjusted EBITDA (in millions) Adjusted EBITDA (in millions) Adjusted EBITDA (in millions)
6% 14%
NON-GAAP*
$110.8 $117.3
$105.0 $102.9
-10%
$24.9 $22.3
1Q’16 1Q’17 1Q’16 1Q’17 1Q’16 1Q’17
9
*See non-GAAP Adjusted EBITDA and non-GAAP Segment Adjusted EBITDA reconciliations to GAAP equivalents in Appendix.
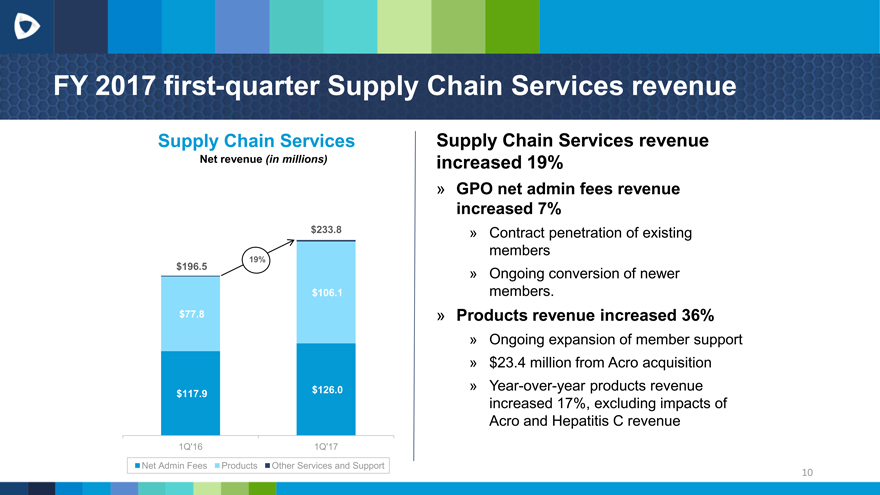
FY 2017 first-quarter Supply Chain Services revenue
Supply Chain Services
Net revenue (in millions)
$233.8
19%
$196.5 $106.1 $77.8
$117.9 $126.0
1Q’16 1Q’17
Net Admin Fees Products Other Services and Support
Supply Chain Services revenue
increased 19%
GPO net admin fees revenue
increased 7%
Contract penetration of existing
members
Ongoing conversion of newer
members.
Products revenue increased 36%
Ongoing expansion of member support
$23.4 million from Acro acquisition
Year-over-year products revenue
increased 17%, excluding impacts of
Acro and Hepatitis C revenue
10
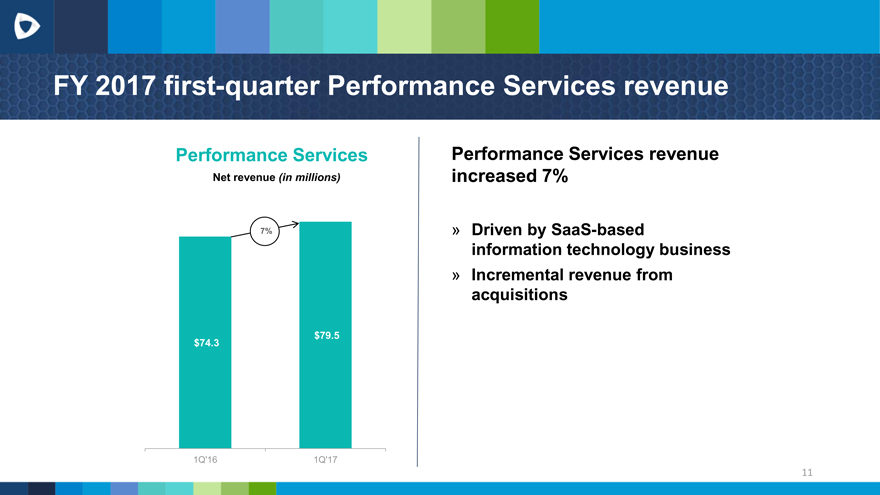
FY 2017 first-quarter Performance Services revenue
Performance Services Performance Services revenue
Net revenue (in millions) increased 7%
7% Driven by SaaS-based
information technology business
Incremental revenue from
acquisitions
$74.3
$79.5
1Q’16
1Q’17
11
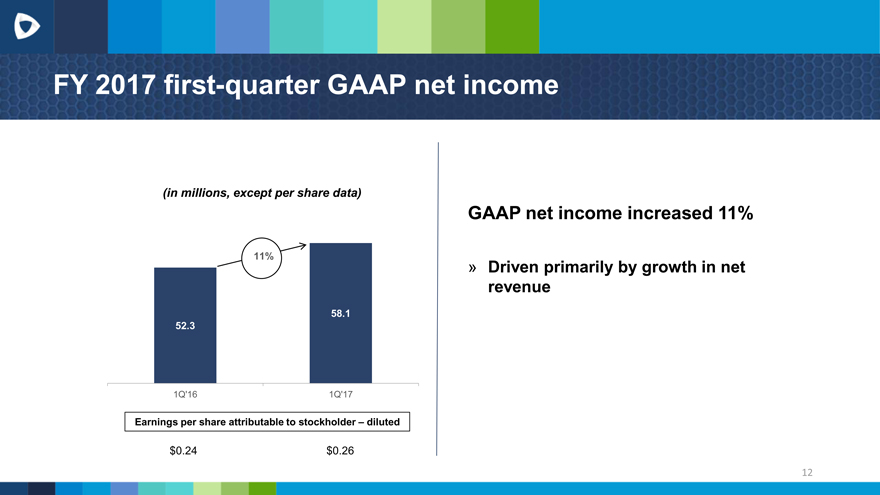
FY 2017 first-quarter GAAP net income
(in millions, except per share data)
11%
58.1
52.3
1Q’16
1Q’17
Earnings per share attributable to stockholder diluted
$0.24 $0.26
GAAP net income increased 11%
Driven primarily by growth in net
revenue
12
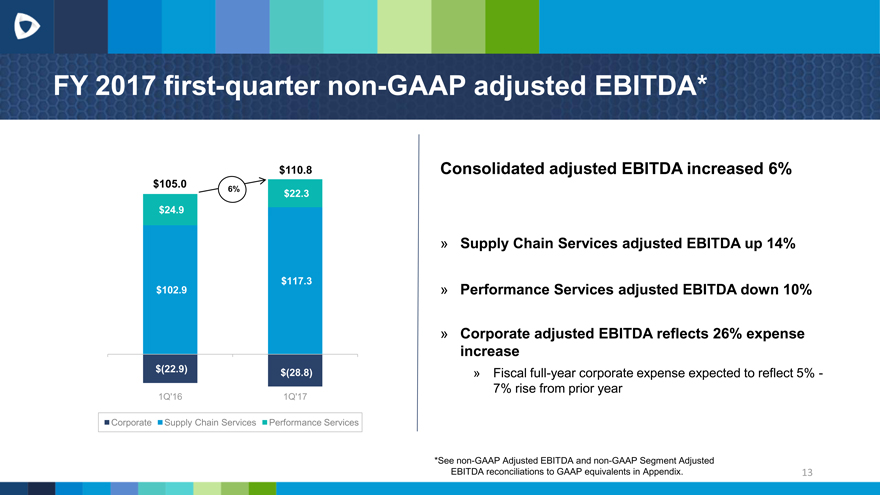
FY 2017 first-quarter non-GAAP adjusted EBITDA*
$110.8 $105.0
6% $22.3 $24.9
$102.9 $117.3
$(22.9) $(28.8)
1Q’16 1Q’17
Corporate Supply Chain Services Performance Services
Consolidated adjusted EBITDA increased 6%
Supply Chain Services adjusted EBITDA up 14%
Performance Services adjusted EBITDA down 10%
Corporate adjusted EBITDA reflects 26% expense
increase
Fiscal full-year corporate expense expected to reflect 5% -
7% rise from prior year
*See non-GAAP Adjusted EBITDA and non-GAAP Segment Adjusted
EBITDA reconciliations to GAAP equivalents in Appendix. 13
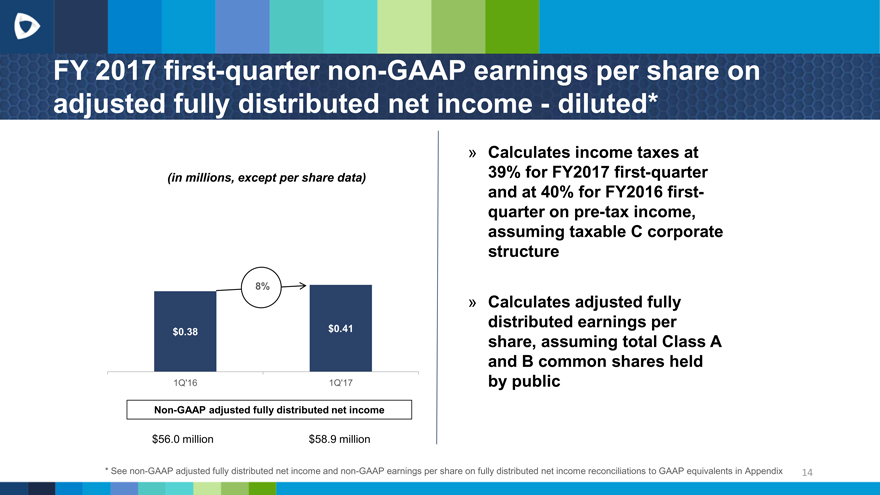
FY 2017 first-quarter non-GAAP earnings per share on adjusted fully distributed net income—diluted*
Calculates income taxes at
(in millions, except per share data) 39% for FY2017 first-quarter
and at 40% for FY2016 first-
quarter on pre-tax income,
assuming taxable C corporate
structure
8%
Calculates adjusted fully
distributed earnings per
$0.38 $0.41
share, assuming total Class A
and B common shares held
1Q’16 1Q’17 by public
Non-GAAP adjusted fully distributed net income
$56.0 million $58.9 million
* See non-GAAP adjusted fully distributed net income and non-GAAP earnings per share on fully distributed net income reconciliations to GAAP equivalents in Appendix 14
Cash flow and capital flexibility at September 30, 2016
Fiscal 2017 first-quarter cash flow from operations of
$41.8 million
Cash, cash equivalents & marketable securities of $156.0
million at September 30, 2016
No outstanding borrowings on $750 million five-year unsecured
revolving credit facility at September 30, 2016; $50 million
borrowed November 1, 2016
*Company defines free cash flow as cash provided by operating activities less distributions to limited partners, tax receivable agreement payments to limited partners and purchases of property and equipment. See non-GAAP free cash flow reconciliation to GAAP equivalent in Appendix. 15
Fiscal 2017 affirmed and updated guidance (for year ending June 30, 2017)
Full-year fiscal 2017 revenue and adjusted EBITDA financial guidance affirmed.
Increasing full year fiscal 2017 guidance range for non-GAAP adjusted fully distributed earnings per share by five cents to $1.76 to $1.87, from the previous range of $1.71 to $1.82.
New range reflects a 9% to 16% increase from the prior year.
$0.05 increase in guidance range due to:
Retirement of approximately 3 million Class B common shares in
connection with partial cash settlement of October 31, 2016 member
share exchange.
Impact of statutory 1% reduction in the North Carolina corporate
income tax rate.
Affirm assumptions underlying initial guidance issued August 22, 2016.
16
Exchange update
On October 31, 2016, approximately 5.0 million Class B units were exchanged in the most recent Class B unit exchange.
Approximately 3.0 million Class B units were exchanged for an aggregate of $100.0 million
Approximately 2.0 million Class B units were exchanged for a like number of Class A shares.
Approximately 5.0 million Class B shares were retired and approximately 2.0 million Class A shares were issued, which reduced our overall outstanding share count.
17
Questions
Appendix
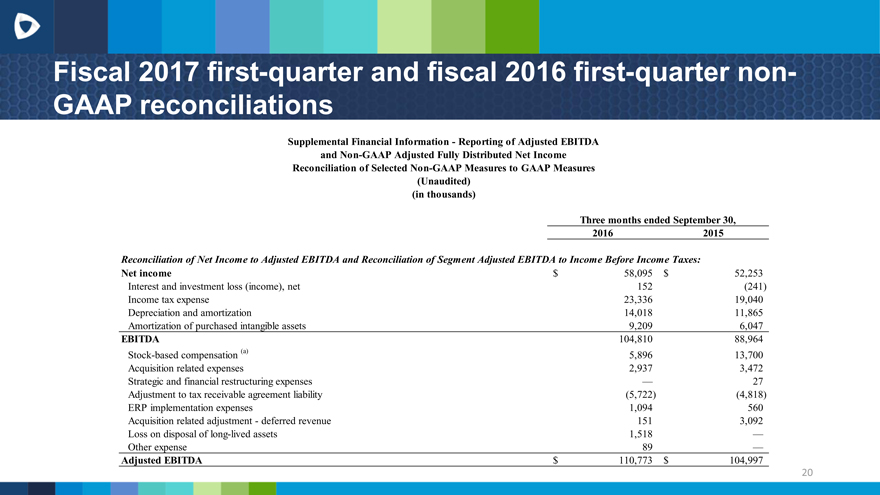
Fiscal 2017 first-quarter and fiscal 2016 first-quarter non-GAAP reconciliations
Supplemental Financial Information—Reporting of Adjusted EBITDA
and Non-GAAP Adjusted Fully Distributed Net Income
Reconciliation of Selected Non-GAAP Measures to GAAP Measures
(Unaudited)
(in thousands)
Three months ended September 30,
2016
2015
Reconciliation of Net Income to Adjusted EBITDA and Reconciliation of Segment Adjusted EBITDA to Income Before Income Taxes:
Net income $ 58,095 $52,253
Interest and investment loss (income), net 152 (241)
Income tax expense 23,336 19,040
Depreciation and amortization 14,018 11,865
Amortization of purchased intangible assets 9,209 6,047
EBITDA 104,810 88,964
Stock-based compensation (a) 5,896 13,700
Acquisition related expenses 2,937 3,472
Strategic and financial restructuring expenses 27
Adjustment to tax receivable agreement liability (5,722) (4,818)
ERP implementation expenses 1,094 560
Acquisition related adjustment—deferred revenue 151 3,092
Loss on disposal of long-lived assets 1,518
Other expense 89
Adjusted EBITDA $ 110,773 $104,997
20
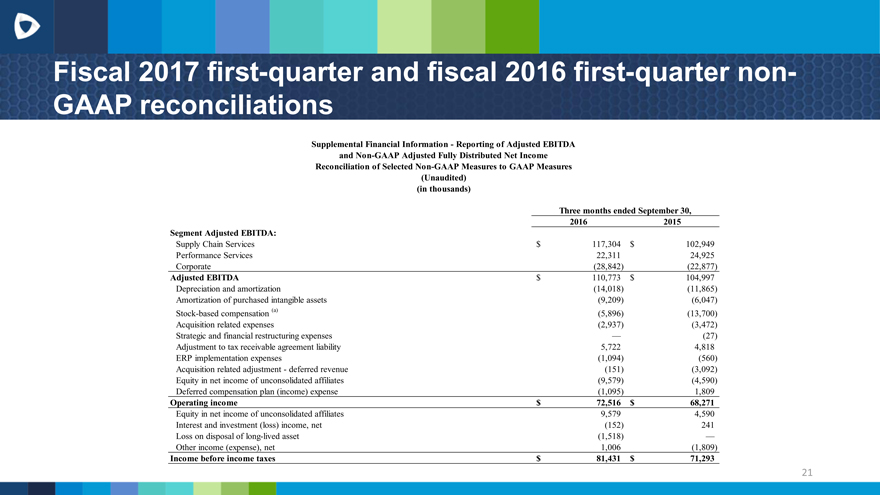
Fiscal 2017 first-quarter and fiscal 2016 first-quarter non-GAAP reconciliations
Supplemental Financial Information—Reporting of Adjusted EBITDA
and Non-GAAP Adjusted Fully Distributed Net Income
Reconciliation of Selected Non-GAAP Measures to GAAP Measures
(Unaudited)
(in thousands)
Three months ended September 30,
2016 2015
Segment Adjusted EBITDA:
Supply Chain Services $117,304$102,949
Performance Services 22,31124,925
Corporate (28,842)(22,877)
Adjusted EBITDA $110,773$104,997
Depreciation and amortization (14,018)(11,865)
Amortization of purchased intangible assets (9,209)(6,047)
Stock-based compensation (a) (5,896)(13,700)
Acquisition related expenses (2,937)(3,472)
Strategic and financial restructuring expenses (27)
Adjustment to tax receivable agreement liability 5,7224,818
ERP implementation expenses (1,094)(560)
Acquisition related adjustment—deferred revenue (151)(3,092)
Equity in net income of unconsolidated affiliates (9,579)(4,590)
Deferred compensation plan (income) expense (1,095)1,809
Operating income $72,516$68,271
Equity in net income of unconsolidated affiliates 9,5794,590
Interest and investment (loss) income, net (152)241
Loss on disposal of long-lived asset (1,518)
Other income (expense), net 1,006(1,809)
Income before income taxes $81,431$71,293
21
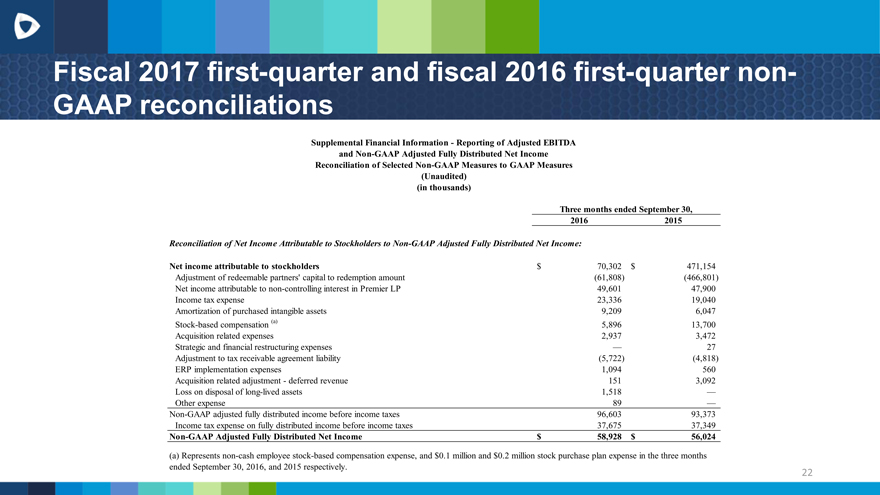
Fiscal 2017 first-quarter and fiscal 2016 first-quarter non-GAAP reconciliations
Supplemental Financial Information—Reporting of Adjusted EBITDA
and Non-GAAP Adjusted Fully Distributed Net Income
Reconciliation of Selected Non-GAAP Measures to GAAP Measures
(Unaudited)
(in thousands)
Three months ended September 30, 2016 2015
Reconciliation of Net Income Attributable to Stockholders to Non-GAAP Adjusted Fully Distributed Net Income:
Net income attributable to stockholders $70,302$471,154
Adjustment of redeemable partners’ capital to redemption amount (61,808)(466,801)
Net income attributable to non-controlling interest in Premier LP 49,60147,900
Income tax expense 23,33619,040
Amortization of purchased intangible assets 9,2096,047
Stock-based compensation (a) 5,89613,700
Acquisition related expenses 2,9373,472
Strategic and financial restructuring expenses 27
Adjustment to tax receivable agreement liability (5,722)(4,818)
ERP implementation expenses 1,094560
Acquisition related adjustment—deferred revenue 1513,092
Loss on disposal of long-lived assets 1,518
Other expense 89
Non-GAAP adjusted fully distributed income before income taxes 96,60393,373
Income tax expense on fully distributed income before income taxes 37,67537,349
Non-GAAP Adjusted Fully Distributed Net Income $58,928$56,024
(a) Represents non-cash employee stock-based compensation expense, and $0.1 million and $0.2 million stock purchase plan expense in the three months
ended September 30, 2016, and 2015 respectively.
22
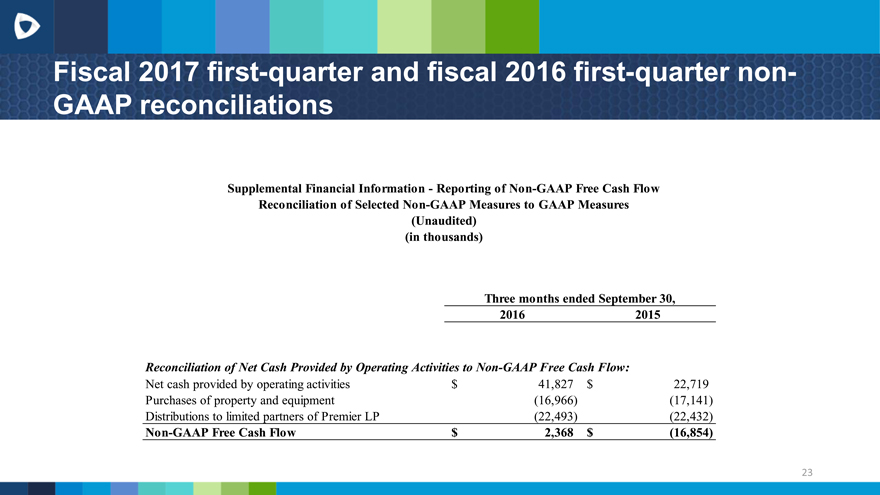
Fiscal 2017 first-quarter and fiscal 2016 first-quarter non-GAAP reconciliations
Supplemental Financial Information—Reporting of Non-GAAP Free Cash Flow Reconciliation of Selected Non-GAAP Measures to GAAP Measures (Unaudited) (in thousands)
Three months ended September 30, 2016 2015
Reconciliation of Net Cash Provided by Operating Activities to Non-GAAP Free Cash Flow:
Net cash provided by operating activities $41,827$22,719
Purchases of property and equipment (16,966)(17,141)
Distributions to limited partners of Premier LP (22,493)(22,432)
Non-GAAP Free Cash Flow $2,368$(16,854)
23
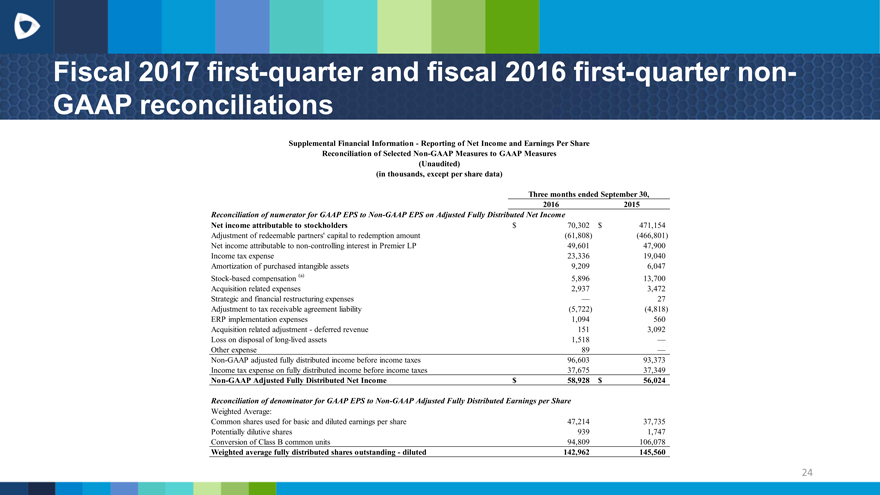
Fiscal 2017 first-quarter and fiscal 2016 first-quarter non-GAAP reconciliations
Supplemental Financial Information—Reporting of Net Income and Earnings Per Share
Reconciliation of Selected Non-GAAP Measures to GAAP Measures
(Unaudited)
(in thousands, except per share data)
Three months ended September 30,
2016 2015
Reconciliation of numerator for GAAP EPS to Non-GAAP EPS on Adjusted Fully Distributed Net Income
Net income attributable to stockholders $70,302$471,154
Adjustment of redeemable partners’ capital to redemption amount (61,808)(466,801)
Net income attributable to non-controlling interest in Premier LP 49,60147,900
Income tax expense 23,33619,040
Amortization of purchased intangible assets 9,2096,047
Stock-based compensation (a) 5,89613,700
Acquisition related expenses 2,9373,472
Strategic and financial restructuring expenses 27
Adjustment to tax receivable agreement liability (5,722)(4,818)
ERP implementation expenses 1,094560
Acquisition related adjustment—deferred revenue 1513,092
Loss on disposal of long-lived assets 1,518
Other expense 89
Non-GAAP adjusted fully distributed income before income taxes 96,60393,373
Income tax expense on fully distributed income before income taxes 37,67537,349
Non-GAAP Adjusted Fully Distributed Net Income $58,928$56,024
Reconciliation of denominator for GAAP EPS to Non-GAAP Adjusted Fully Distributed Earnings per Share
Weighted Average:
Common shares used for basic and diluted earnings per share 47,21437,735
Potentially dilutive shares 9391,747
Conversion of Class B common units 94,809106,078
Weighted average fully distributed shares outstanding—diluted 142,962145,560
24
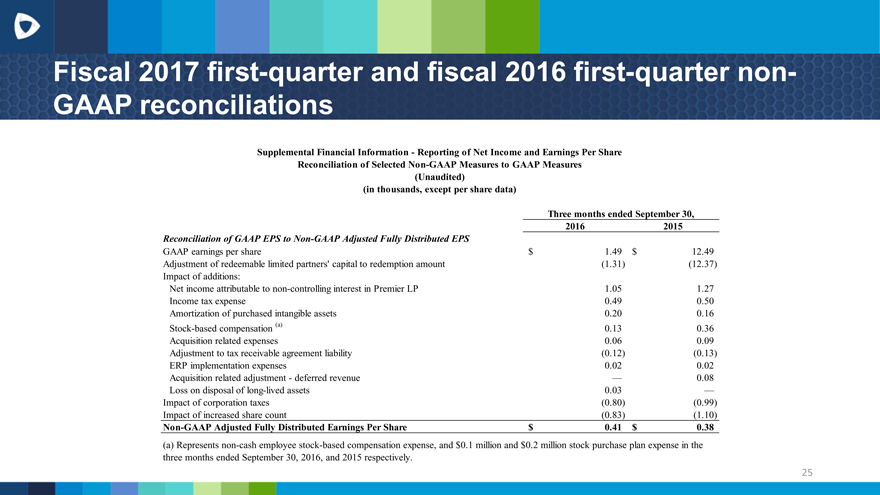
Fiscal 2017 first-quarter and fiscal 2016 first-quarter non-GAAP reconciliations
Supplemental Financial Information—Reporting of Net Income and Earnings Per Share
Reconciliation of Selected Non-GAAP Measures to GAAP Measures
(Unaudited)
(in thousands, except per share data)
Three months ended September 30,
2016 2015
Reconciliation of GAAP EPS to Non-GAAP Adjusted Fully Distributed EPS
GAAP earnings per share $1.49$12.49
Adjustment of redeemable limited partners’ capital to redemption amount (1.31)(12.37)
Impact of additions:
Net income attributable to non-controlling interest in Premier LP 1.051.27
Income tax expense 0.490.50
Amortization of purchased intangible assets 0.200.16
Stock-based compensation (a) 0.130.36
Acquisition related expenses 0.060.09
Adjustment to tax receivable agreement liability (0.12)(0.13)
ERP implementation expenses 0.020.02
Acquisition related adjustment—deferred revenue 0.08
Loss on disposal of long-lived assets 0.03
Impact of corporation taxes (0.80)(0.99)
Impact of increased share count (0.83)(1.10)
Non-GAAP Adjusted Fully Distributed Earnings Per Share $0.41$0.38
(a) Represents non-cash employee stock-based compensation expense, and $0.1 million and $0.2 million stock purchase plan expense in the three months ended September 30, 2016, and 2015 respectively.
25