
Third-Quarter Fiscal Year 2017 Financial Results and Update May 8, 2017 Exhibit 99.3
Forward-looking statements and Non-GAAP financial measures Forward-looking statements — Certain statements made during Premier’s webcast and included in this presentation, including, but not limited to, those related to our financial and business outlook, the impact of the evolving healthcare environment, strategy and growth drivers, member retention and renewal rates and revenue visibility, cross and upsell opportunities, acquisition activities and pipeline, revenue available under contract, 2017 financial guidance and related assumptions, and target growth rate are “forward-looking statements” within the meaning of the federal securities laws. Forward-looking statements may involve known and unknown risks, uncertainties and other factors that may cause the actual results of Premier to be materially different from historical results or from any future results or projections expressed or implied by such forward-looking statements. Accordingly, readers should not place undue reliance on any forward looking statements. Readers are urged to consider statements in the conditional or future tenses or that include terms such as “believes,” “belief,” “expects,” “estimates,” “intends,” “anticipates” or “plans” to be uncertain and forward-looking. Forward-looking statements may include comments as to Premier’s beliefs and expectations as to future events and trends affecting its business and are necessarily subject to uncertainties, many of which are outside Premier’s control. You should carefully read Premier’s current and future filings with the SEC for more information on potential risks and other factors that could affect Premier’s financial results. Forward-looking statements speak only as of the date they are made. Premier undertakes no obligation to publicly update or revise any forward-looking statements. Non-GAAP financial measures — This presentation includes certain “non-GAAP financial measures” as defined in Regulation G under the federal securities laws. Schedules are attached that reconcile the non-GAAP financial measures included in this presentation to the most directly comparable financial measures calculated and presented in accordance with Generally Accepted Accounting Principles in the United States. You should carefully read Premier’s current and future filings with the SEC for definitions and further explanation and disclosure regarding our use of non-GAAP financial measures and such filings should be read in conjunction with this presentation.

Overview and Business Update Susan DeVore President & CEO
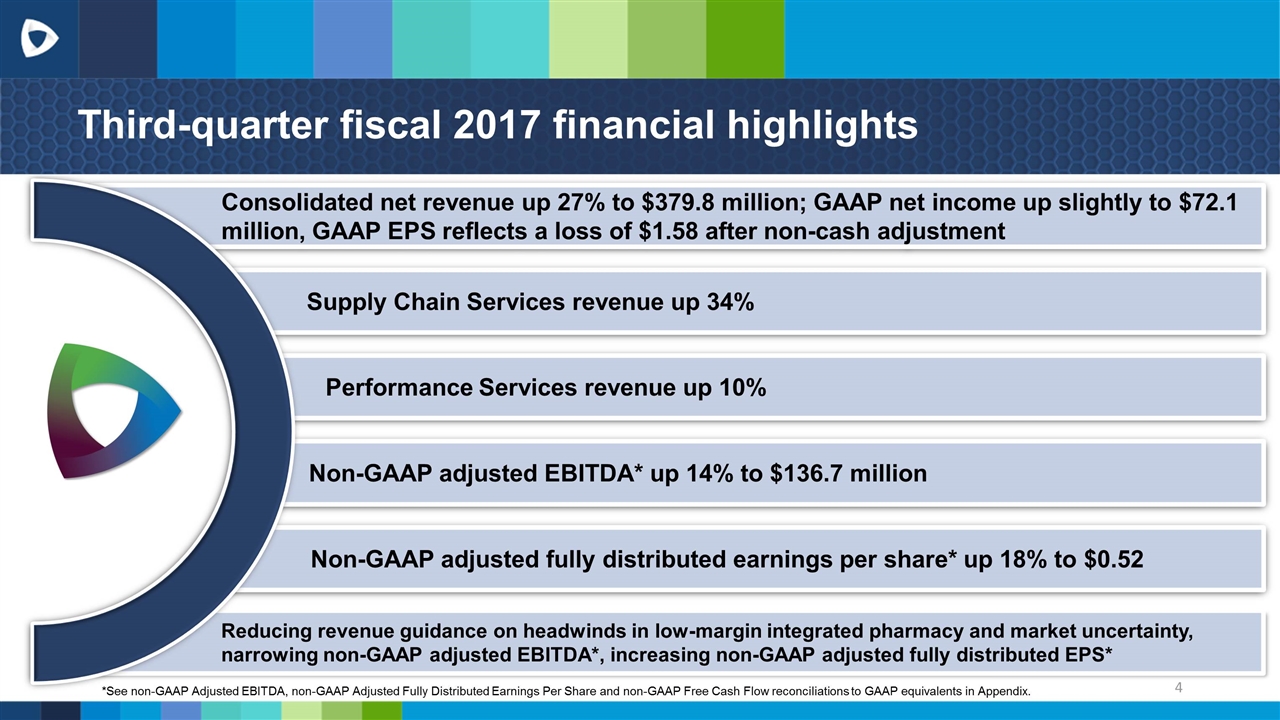
Performance Services revenue up 10% Third-quarter fiscal 2017 financial highlights Supply Chain Services revenue up 34% Non-GAAP adjusted EBITDA* up 14% to $136.7 million Non-GAAP adjusted fully distributed earnings per share* up 18% to $0.52 Reducing revenue guidance on headwinds in low-margin integrated pharmacy and market uncertainty, narrowing non-GAAP adjusted EBITDA*, increasing non-GAAP adjusted fully distributed EPS* Consolidated net revenue up 27% to $379.8 million; GAAP net income up slightly to $72.1 million, GAAP EPS reflects a loss of $1.58 after non-cash adjustment *See non-GAAP Adjusted EBITDA, non-GAAP Adjusted Fully Distributed Earnings Per Share and non-GAAP Free Cash Flow reconciliations to GAAP equivalents in Appendix.

Well-positioned in an evolving healthcare landscape

Operations Update Michael Alkire Chief Operating Officer
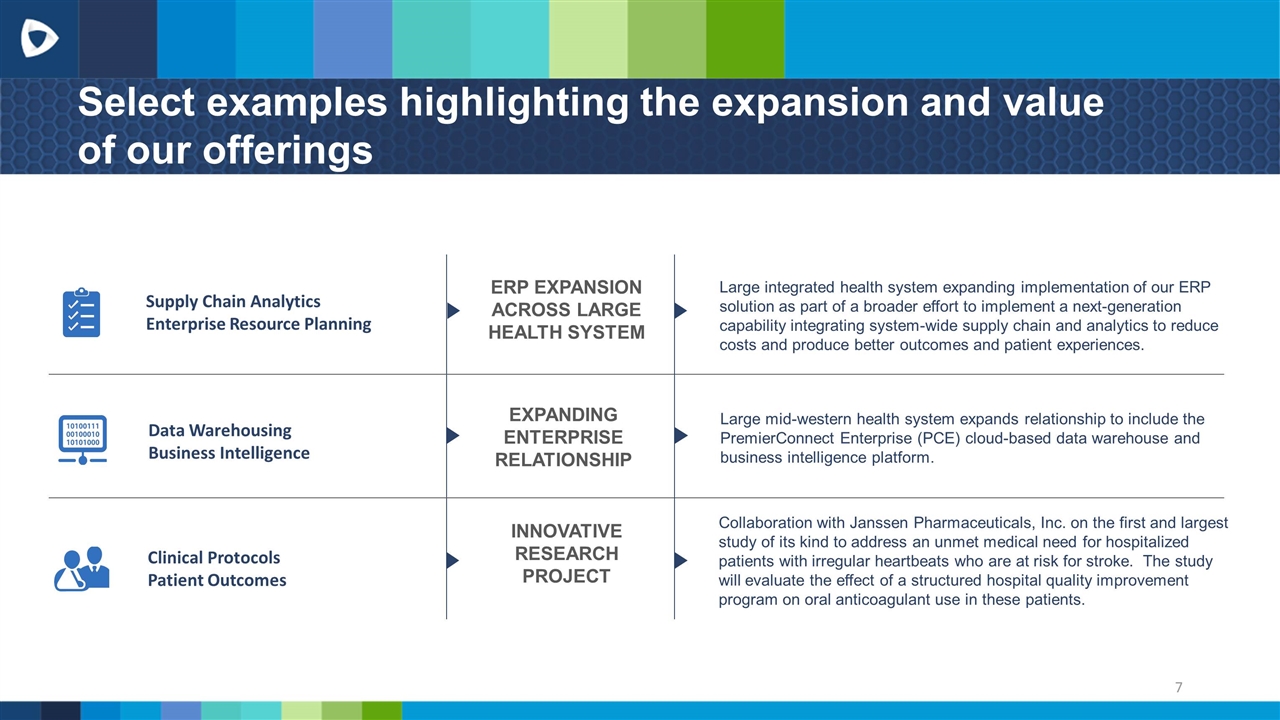
Select examples highlighting the expansion and value of our offerings Large integrated health system expanding implementation of our ERP solution as part of a broader effort to implement a next-generation capability integrating system-wide supply chain and analytics to reduce costs and produce better outcomes and patient experiences. Supply Chain Analytics Enterprise Resource Planning Clinical Protocols Patient Outcomes Data Warehousing Business Intelligence Large mid-western health system expands relationship to include the PremierConnect Enterprise (PCE) cloud-based data warehouse and business intelligence platform. Collaboration with Janssen Pharmaceuticals, Inc. on the first and largest study of its kind to address an unmet medical need for hospitalized patients with irregular heartbeats who are at risk for stroke. The study will evaluate the effect of a structured hospital quality improvement program on oral anticoagulant use in these patients. EXPANDING ENTERPRISE RELATIONSHIP ERP EXPANSION ACROSS LARGE HEALTH SYSTEM INNOVATIVE RESEARCH PROJECT

Update on recent acquisitions

Financial Review Craig McKasson Chief Financial Officer
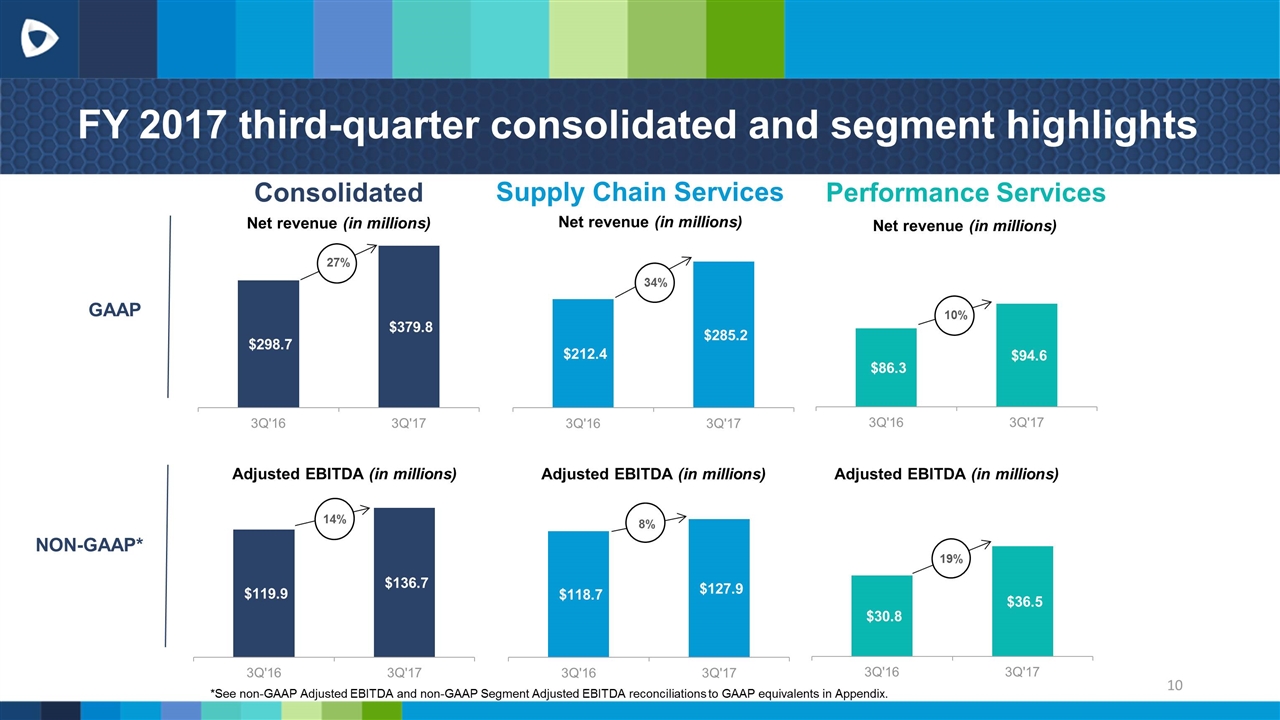
FY 2017 third-quarter consolidated and segment highlights Consolidated Net revenue (in millions) Supply Chain Services Net revenue (in millions) Performance Services Net revenue (in millions) Adjusted EBITDA (in millions) Adjusted EBITDA (in millions) Adjusted EBITDA (in millions) *See non-GAAP Adjusted EBITDA and non-GAAP Segment Adjusted EBITDA reconciliations to GAAP equivalents in Appendix. 27% 14% 34% 8% 10% 19% GAAP NON-GAAP*
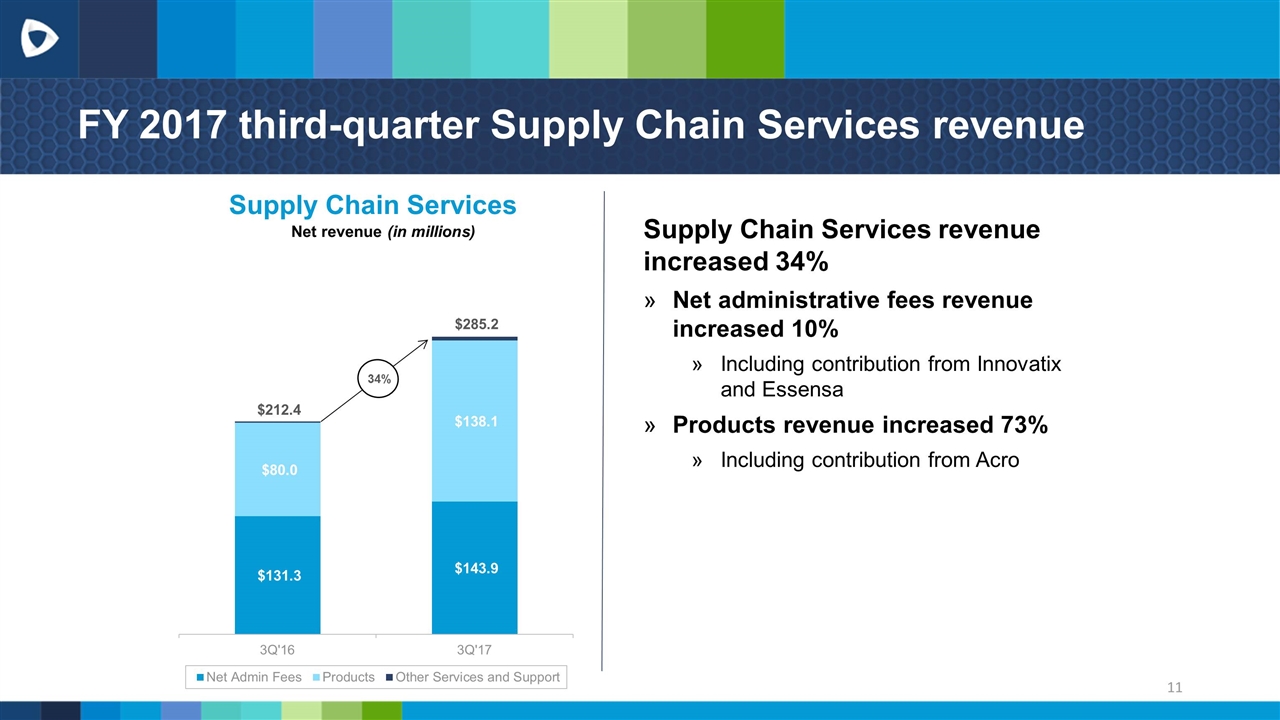
FY 2017 third-quarter Supply Chain Services revenue Supply Chain Services revenue increased 34% Net administrative fees revenue increased 10% Including contribution from Innovatix and Essensa Products revenue increased 73% Including contribution from Acro Supply Chain Services Net revenue (in millions) 34% $212.4 $285.2
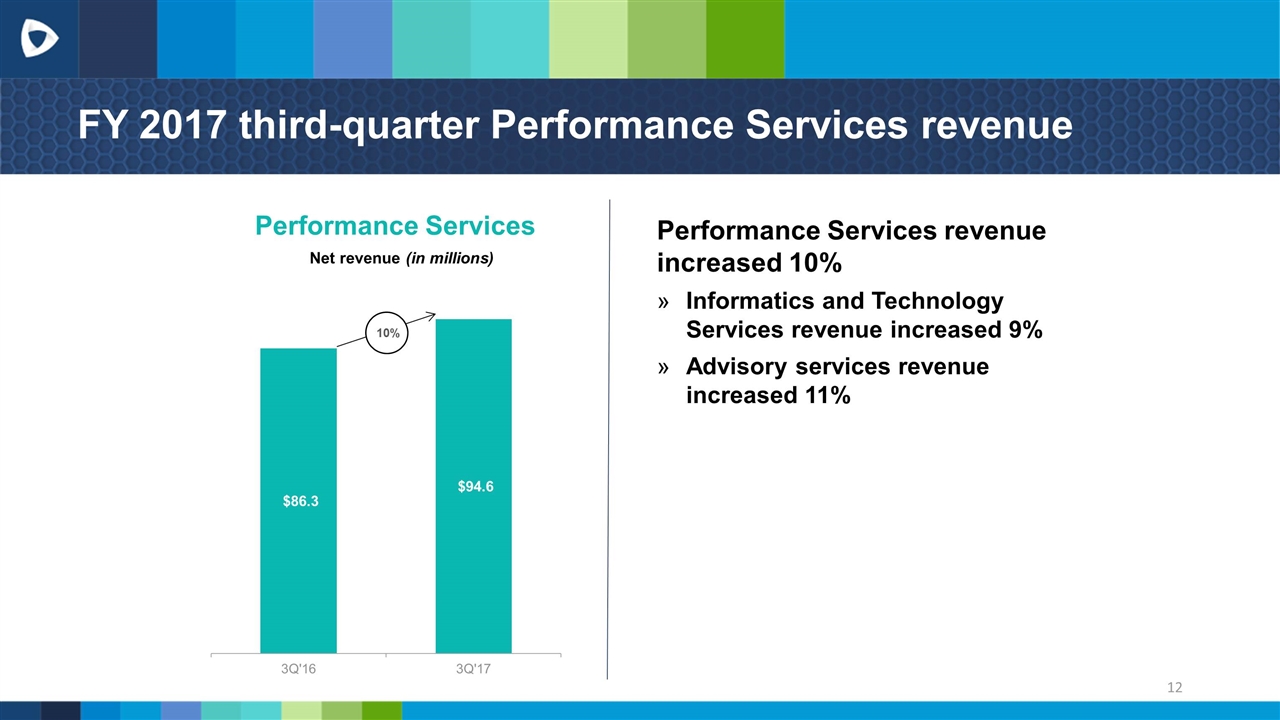
FY 2017 third-quarter Performance Services revenue Performance Services revenue increased 10% Informatics and Technology Services revenue increased 9% Advisory services revenue increased 11% Performance Services Net revenue (in millions) 10%

FY 2017 third-quarter GAAP net income 1% $0.43 $(1.58) Earnings per share attributable to stockholders* – diluted GAAP net income increased 1% *After non-cash adjustments to reflect the change in redemption amount of limited partners’ Class B common unit ownership at the end of each period
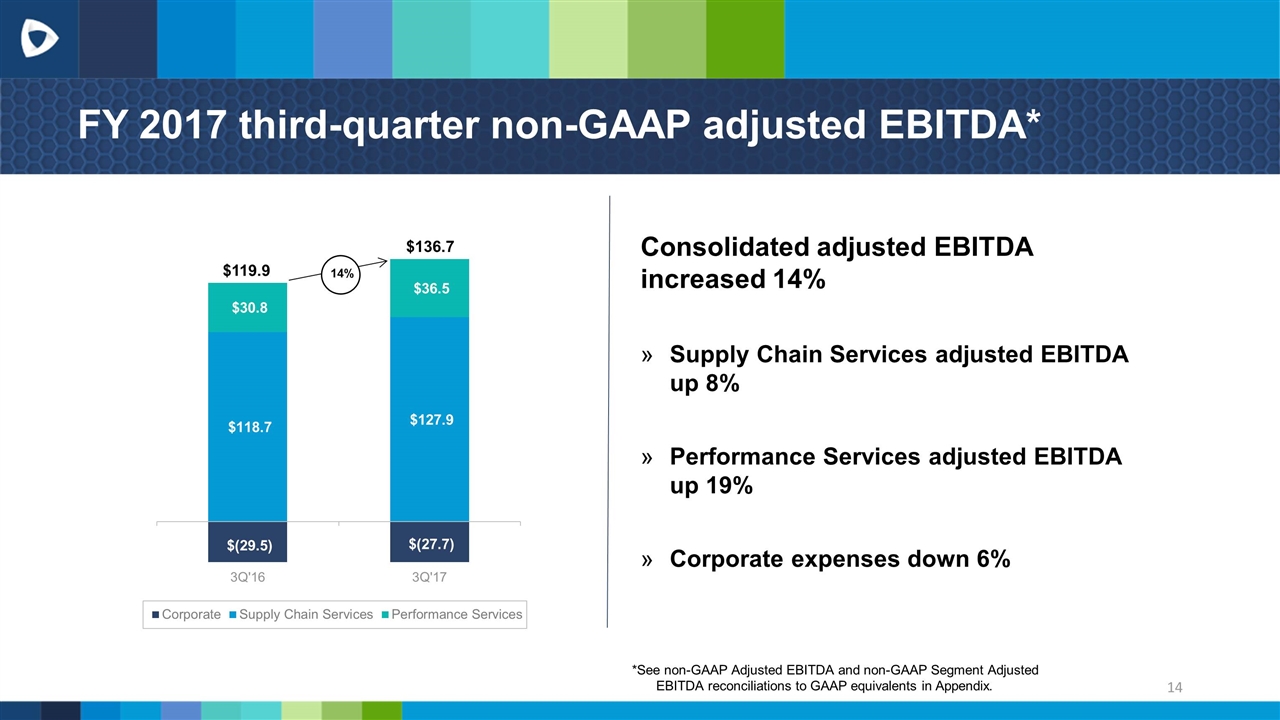
FY 2017 third-quarter non-GAAP adjusted EBITDA* Consolidated adjusted EBITDA increased 14% Supply Chain Services adjusted EBITDA up 8% Performance Services adjusted EBITDA up 19% Corporate expenses down 6% *See non-GAAP Adjusted EBITDA and non-GAAP Segment Adjusted EBITDA reconciliations to GAAP equivalents in Appendix. $136.7 $119.9
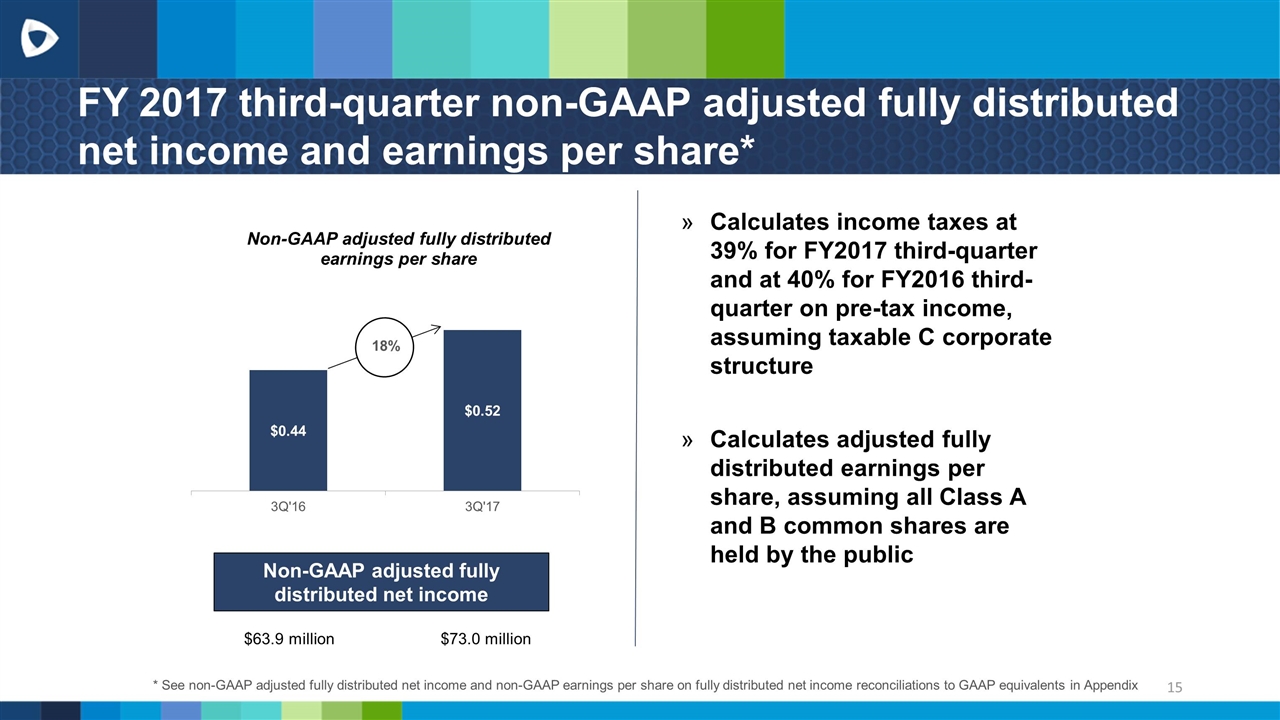
FY 2017 third-quarter non-GAAP adjusted fully distributed net income and earnings per share* 18% $63.9 million $73.0 million Non-GAAP adjusted fully distributed net income * See non-GAAP adjusted fully distributed net income and non-GAAP earnings per share on fully distributed net income reconciliations to GAAP equivalents in Appendix Calculates income taxes at 39% for FY2017 third-quarter and at 40% for FY2016 third-quarter on pre-tax income, assuming taxable C corporate structure Calculates adjusted fully distributed earnings per share, assuming all Class A and B common shares are held by the public
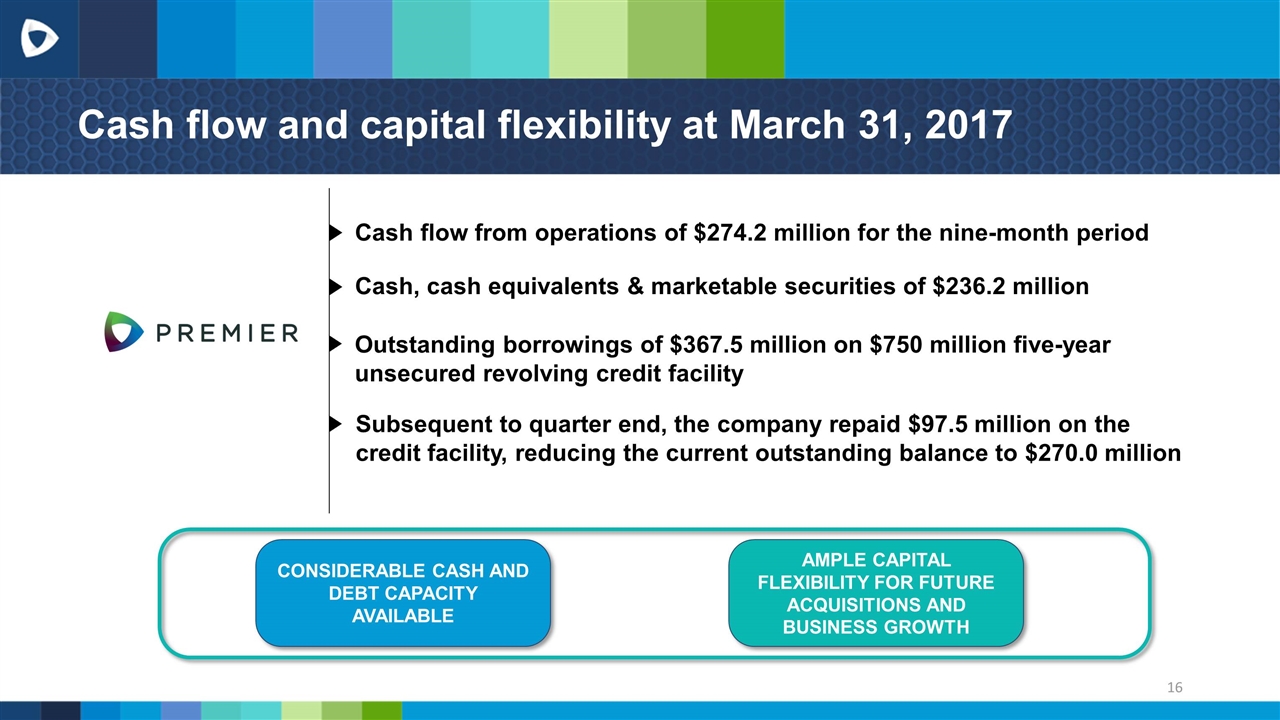
Cash flow and capital flexibility at March 31, 2017 CONSIDERABLE CASH AND DEBT CAPACITY AVAILABLE AMPLE CAPITAL FLEXIBILITY FOR FUTURE ACQUISITIONS AND BUSINESS GROWTH Cash flow from operations of $274.2 million for the nine-month period Cash, cash equivalents & marketable securities of $236.2 million Outstanding borrowings of $367.5 million on $750 million five-year unsecured revolving credit facility Subsequent to quarter end, the company repaid $97.5 million on the credit facility, reducing the current outstanding balance to $270.0 million
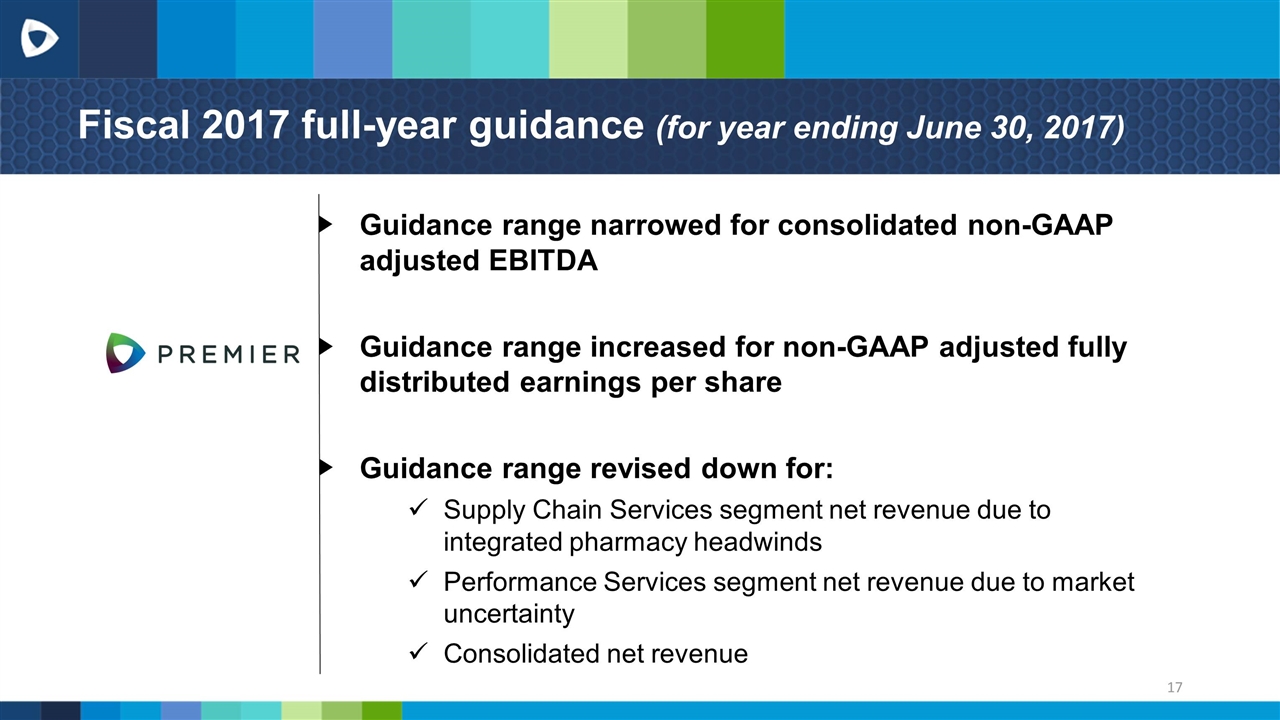
Fiscal 2017 full-year guidance (for year ending June 30, 2017) Guidance range narrowed for consolidated non-GAAP adjusted EBITDA Guidance range increased for non-GAAP adjusted fully distributed earnings per share Guidance range revised down for: Supply Chain Services segment net revenue due to integrated pharmacy headwinds Performance Services segment net revenue due to market uncertainty Consolidated net revenue
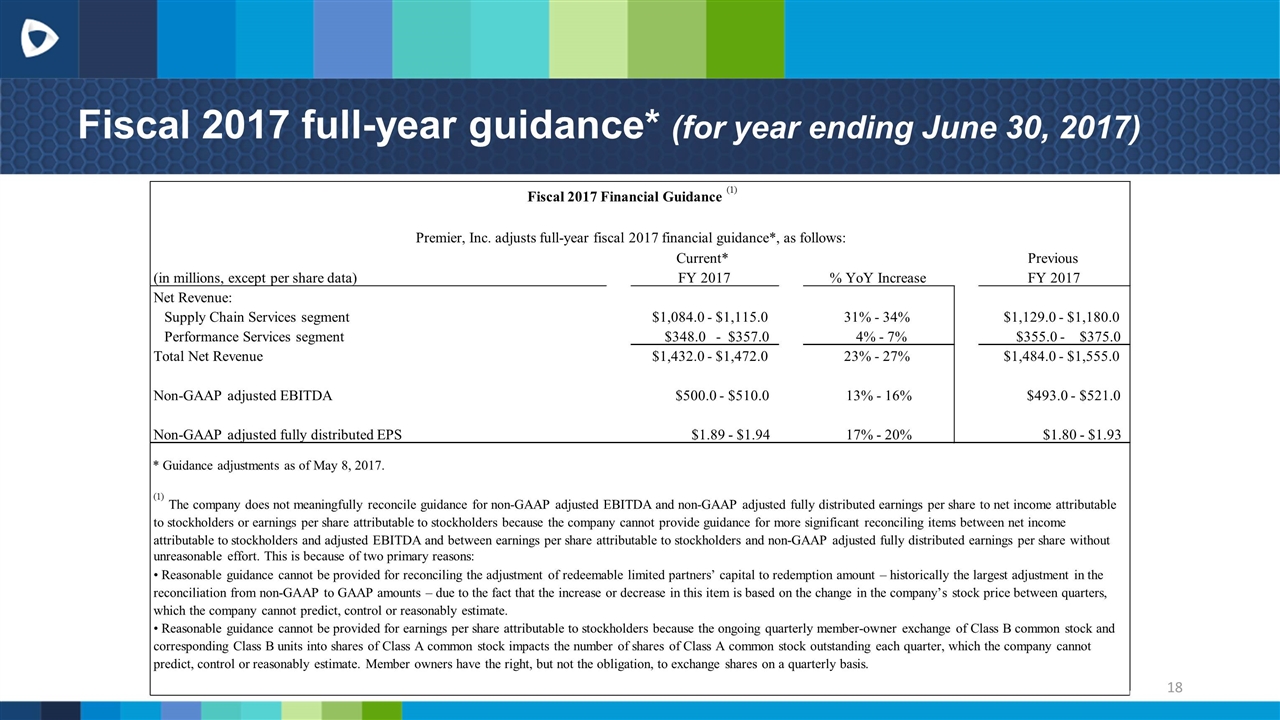
Fiscal 2017 full-year guidance* (for year ending June 30, 2017) Current* Previous (in millions, except per share data) FY 2017 % YoY Increase FY 2017 Net Revenue: Supply Chain Services segment $1,084.0 - $1,115.0 31% - 34% $1,129.0 - $1,180.0 Performance Services segment $348.0 - $357.0 4% - 7% $355.0 - $375.0 Total Net Revenue $1,432.0 - $1,472.0 23% - 27% $1,484.0 - $1,555.0 Non-GAAP adjusted EBITDA $500.0 - $510.0 13% - 16% $493.0 - $521.0 Non-GAAP adjusted fully distributed EPS $1.89 - $1.94 17% - 20% $1.80 - $1.93 Premier, Inc. adjusts full-year fiscal 2017 financial guidance*, as follows: Fiscal 2017 Financial Guidance (1) (1) The company does not meaningfully reconcile guidance for non-GAAP adjusted EBITDA and non-GAAP adjusted fully distributed earnings per share to net income attributable to stockholders or earnings per share attributable to stockholders because the company cannot provide guidance for more significant reconciling items between net income attributable to stockholders and adjusted EBITDA and between earnings per share attributable to stockholders and non-GAAP adjusted fully distributed earnings per share without unreasonable effort. This is because of two primary reasons: • Reasonable guidance cannot be provided for reconciling the adjustment of redeemable limited partners’ capital to redemption amount – historically the largest adjustment in the reconciliation from non-GAAP to GAAP amounts – due to the fact that the increase or decrease in this item is based on the change in the company’s stock price between quarters, which the company cannot predict, control or reasonably estimate. • Reasonable guidance cannot be provided for earnings per share attributable to stockholders because the ongoing quarterly member-owner exchange of Class B common stock and corresponding Class B units into shares of Class A common stock impacts the number of shares of Class A common stock outstanding each quarter, which the company cannot predict, control or reasonably estimate. Member owners have the right, but not the obligation, to exchange shares on a quarterly basis. * Guidance adjustments as of May 8, 2017.
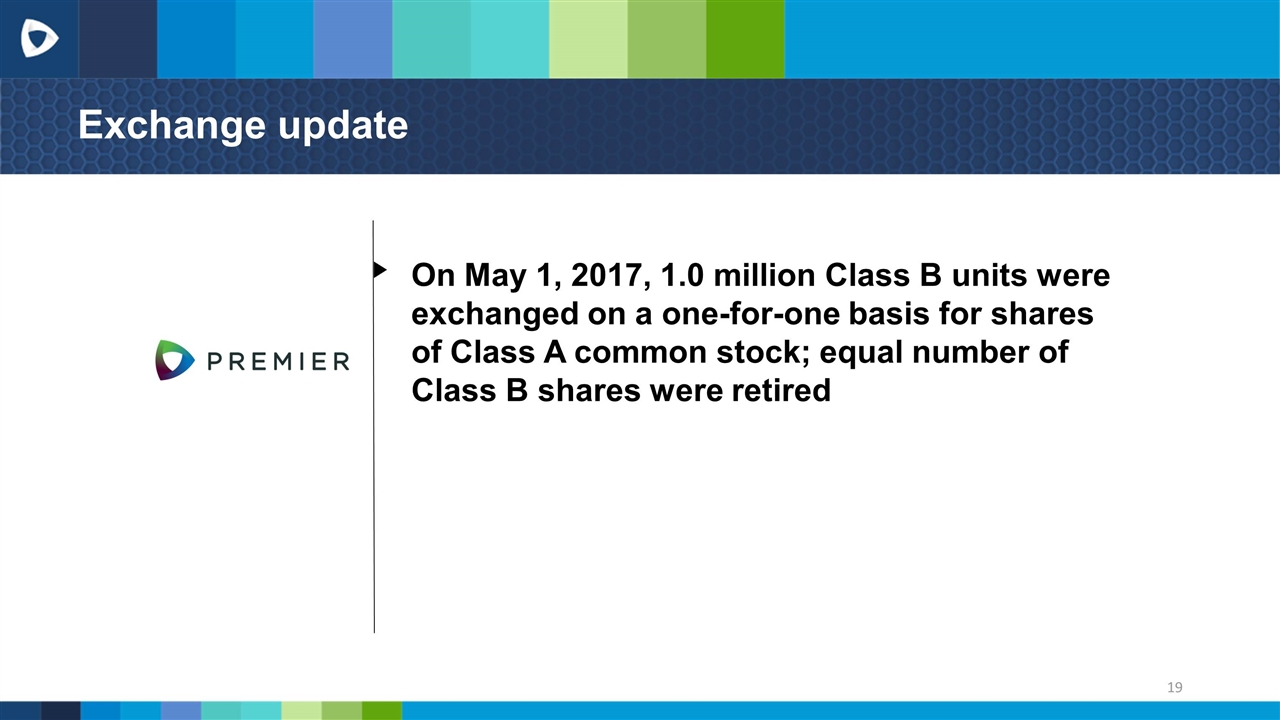
Exchange update On May 1, 2017, 1.0 million Class B units were exchanged on a one-for-one basis for shares of Class A common stock; equal number of Class B shares were retired

Questions

Appendix
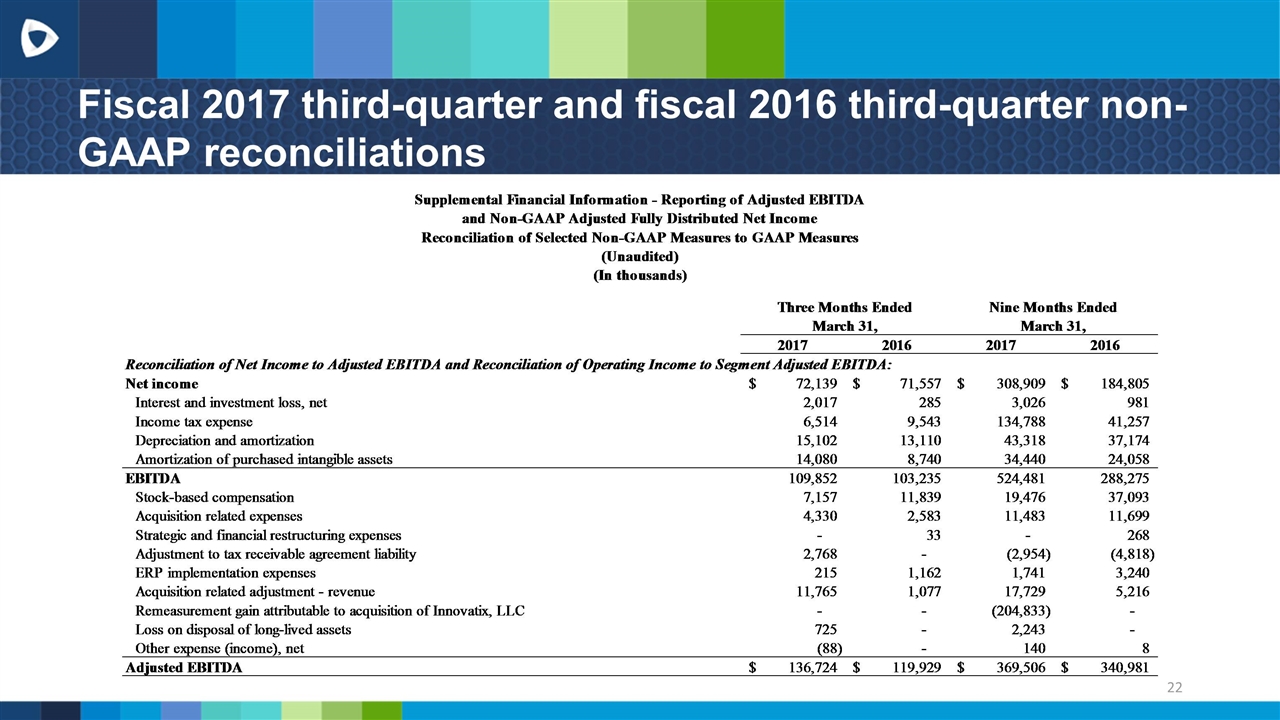
Fiscal 2017 third-quarter and fiscal 2016 third-quarter non-GAAP reconciliations
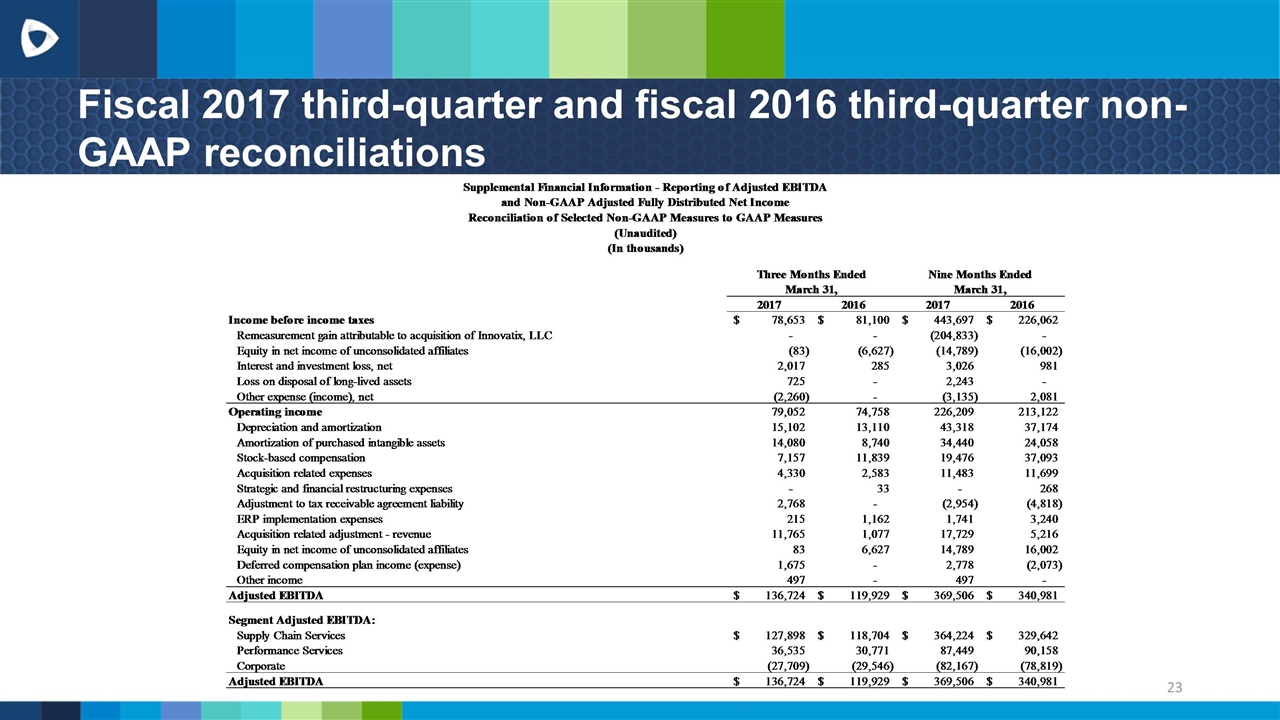
Fiscal 2017 third-quarter and fiscal 2016 third-quarter non-GAAP reconciliations
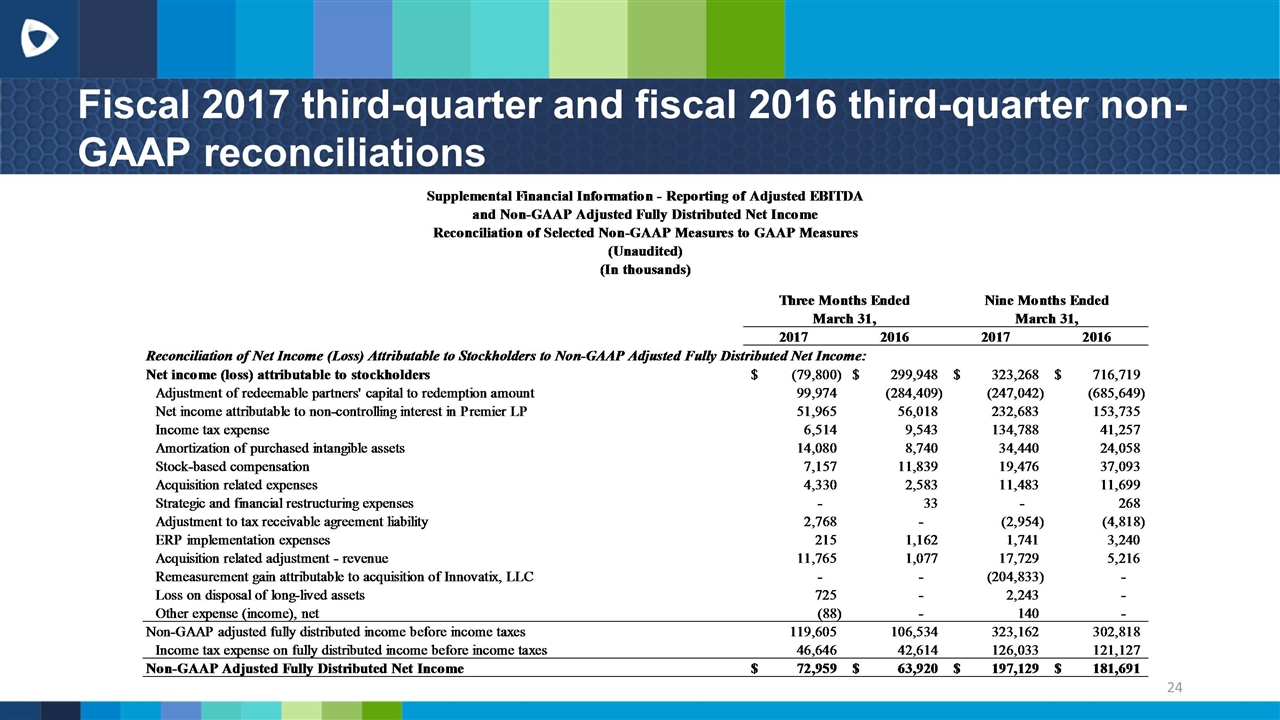
Fiscal 2017 third-quarter and fiscal 2016 third-quarter non-GAAP reconciliations
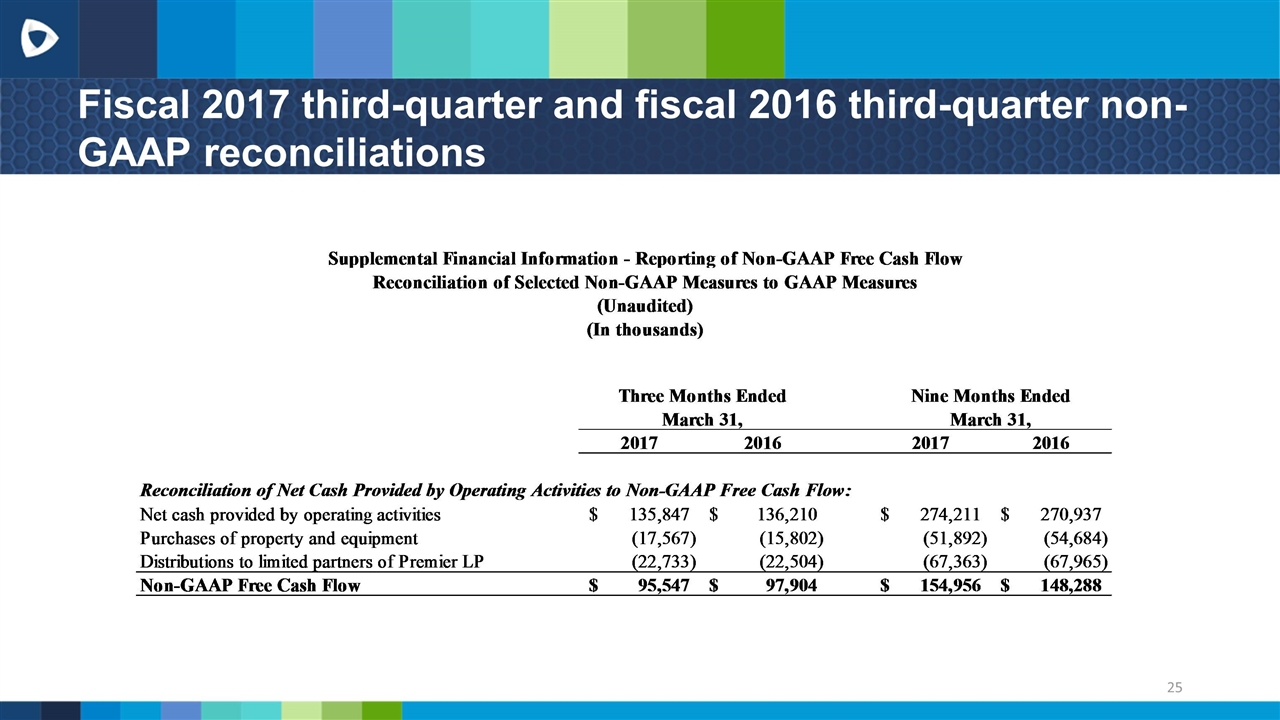
Fiscal 2017 third-quarter and fiscal 2016 third-quarter non-GAAP reconciliations
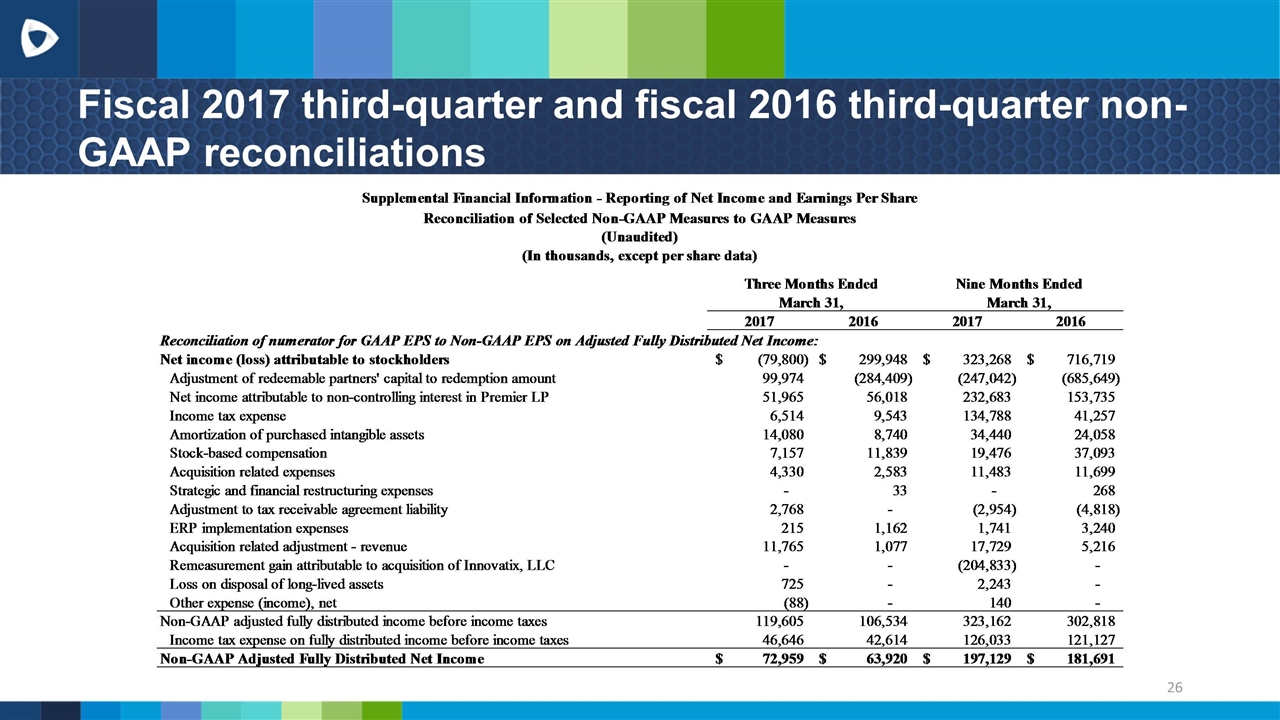
Fiscal 2017 third-quarter and fiscal 2016 third-quarter non-GAAP reconciliations
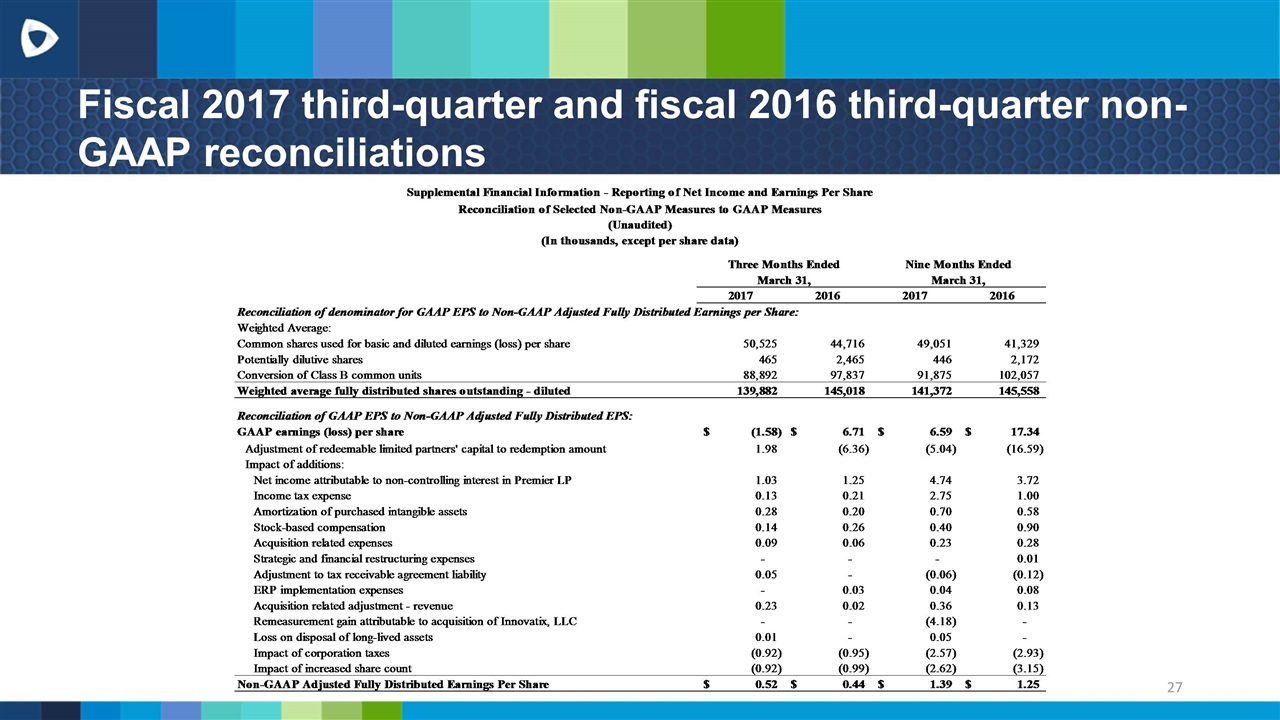
Fiscal 2017 third-quarter and fiscal 2016 third-quarter non-GAAP reconciliations


