
August 21, 2017 Fourth-Quarter and Full-Year Fiscal 2017 Financial Results and Update Exhibit 99.3
Forward-looking statements and Non-GAAP financial measures Forward-looking statements — Certain statements made during Premier’s webcast and included in this presentation, including, but not limited to, those related to our financial and business outlook, the impact of the evolving healthcare environment, strategy and growth drivers, member retention, renewal rates and revenue visibility, cross and upsell opportunities, acquisition contributions, activities and pipeline, revenue available under contract, 2018 financial guidance and related assumptions, and target growth rate are “forward-looking statements” within the meaning of the federal securities laws. Forward-looking statements may involve known and unknown risks, uncertainties and other factors that may cause the actual results of Premier to be materially different from historical results or from any future results or projections expressed or implied by such forward-looking statements. Accordingly, readers should not place undue reliance on any forward looking statements. Readers are urged to consider statements in the conditional or future tenses or that include terms such as “believes,” “belief,” “expects,” “estimates,” “intends,” “anticipates” or “plans” to be uncertain and forward-looking. Forward-looking statements may include comments as to Premier’s beliefs and expectations as to future events and trends affecting its business and are necessarily subject to uncertainties, many of which are outside Premier’s control. You should carefully read Premier’s current and future filings with the SEC for more information on potential risks and other factors that could affect Premier’s financial results. Forward-looking statements speak only as of the date they are made. Premier undertakes no obligation to publicly update or revise any forward-looking statements. Non-GAAP financial measures — This presentation includes certain “non-GAAP financial measures” as defined in Regulation G under the federal securities laws. Schedules are attached that reconcile the non-GAAP financial measures included in this presentation to the most directly comparable financial measures calculated and presented in accordance with Generally Accepted Accounting Principles in the United States. You should carefully read Premier’s current and future filings with the SEC for definitions and further explanation and disclosure regarding our use of non-GAAP financial measures and such filings should be read in conjunction with this presentation.
President and Chief Executive Officer Premier Inc. Susan DeVore OVERVIEW AND BUSINESS UPDATE
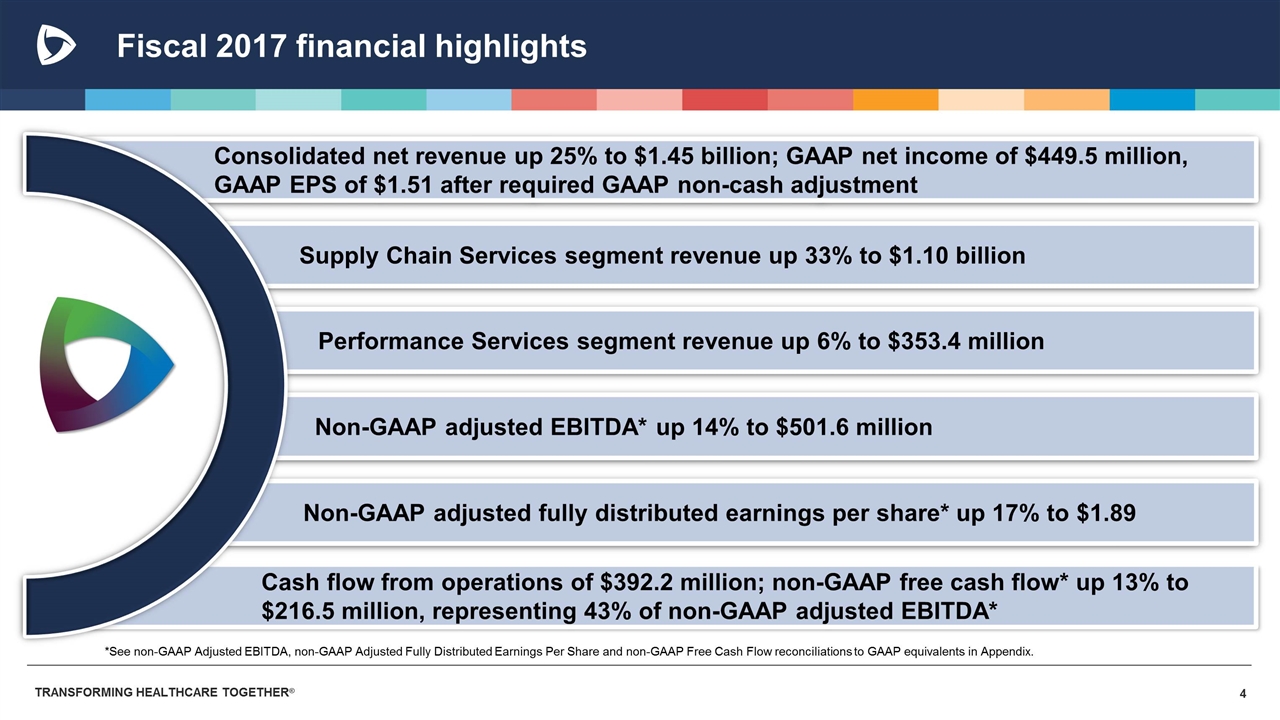
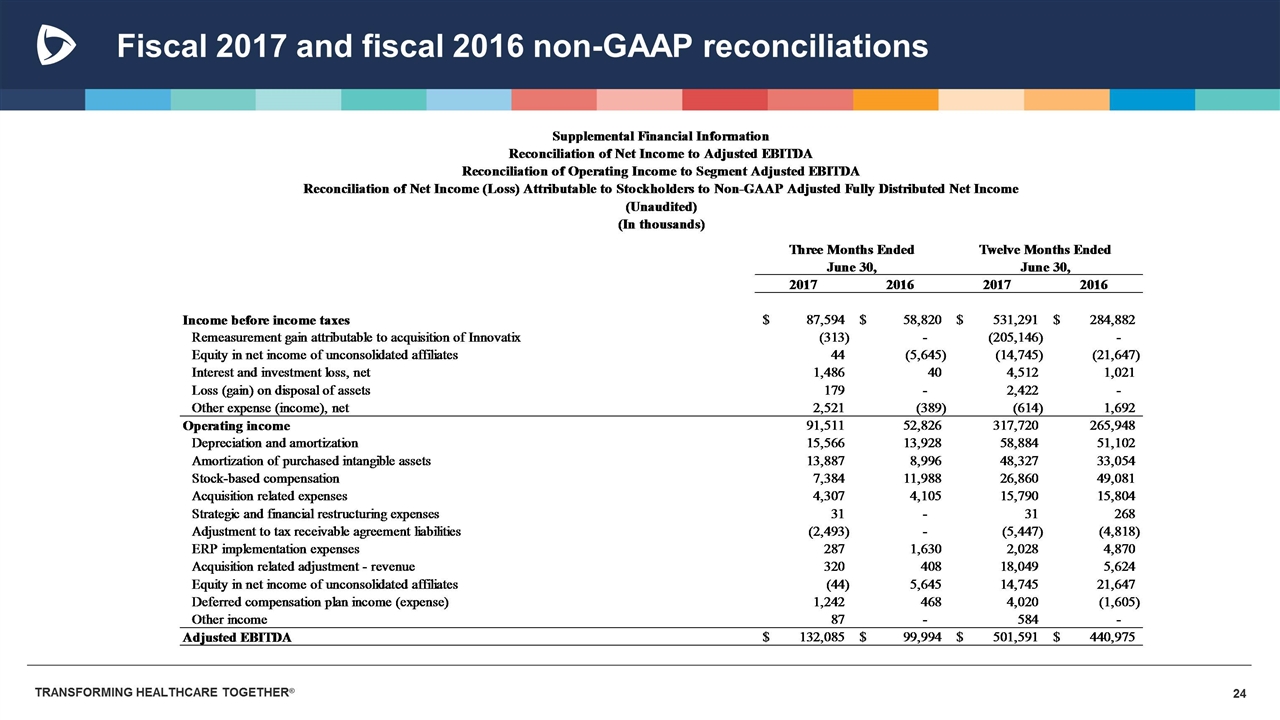
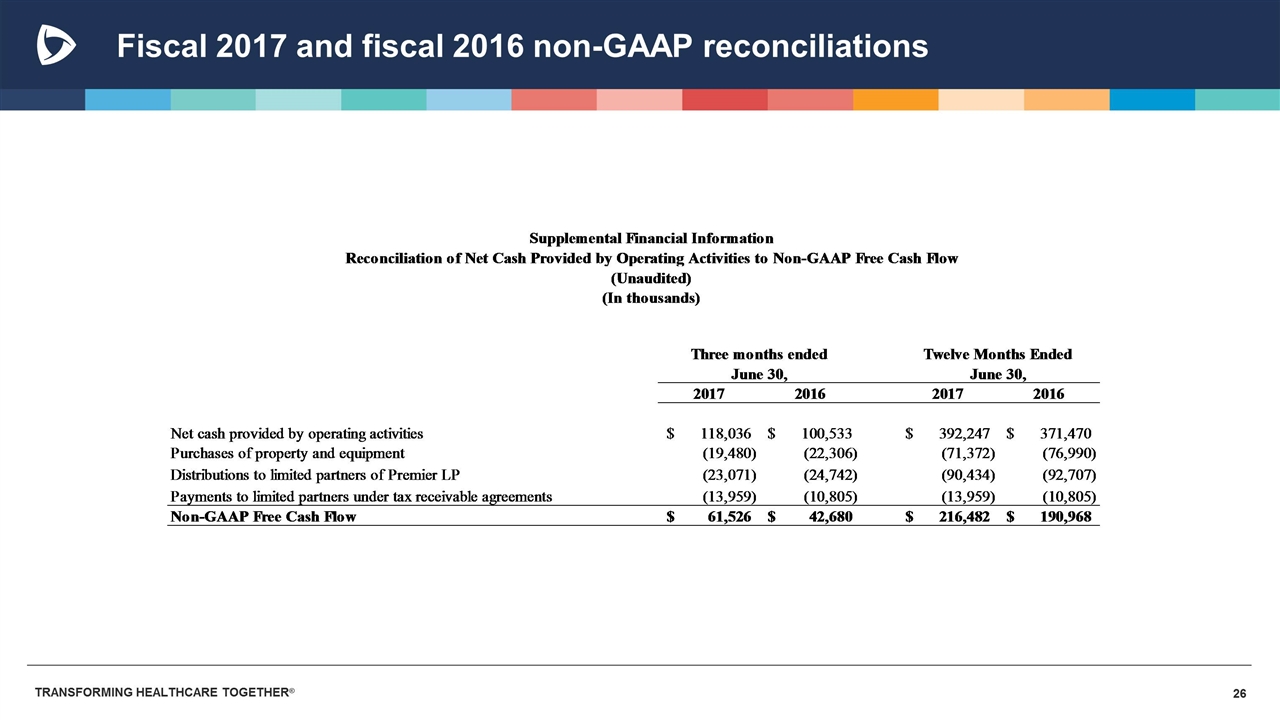
Fiscal 2017 financial highlights *See non-GAAP Adjusted EBITDA, non-GAAP Adjusted Fully Distributed Earnings Per Share and non-GAAP Free Cash Flow reconciliations to GAAP equivalents in Appendix. Performance Services segment revenue up 6% to $353.4 million Supply Chain Services segment revenue up 33% to $1.10 billion Non-GAAP adjusted EBITDA* up 14% to $501.6 million Non-GAAP adjusted fully distributed earnings per share* up 17% to $1.89 Cash flow from operations of $392.2 million; non-GAAP free cash flow* up 13% to $216.5 million, representing 43% of non-GAAP adjusted EBITDA* Consolidated net revenue up 25% to $1.45 billion; GAAP net income of $449.5 million, GAAP EPS of $1.51 after required GAAP non-cash adjustment *See non-GAAP Adjusted EBITDA, non-GAAP Adjusted Fully Distributed Earnings Per Share and non-GAAP Free Cash Flow reconciliations to GAAP equivalents in Appendix.
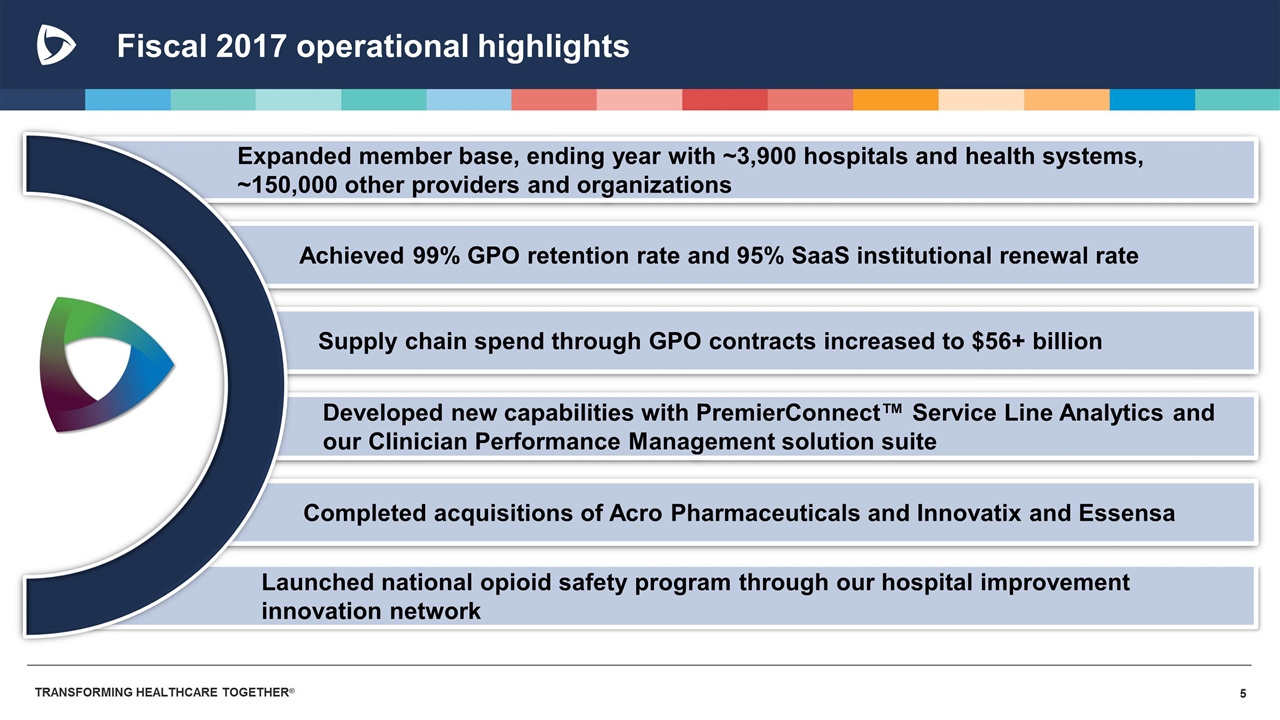
Fiscal 2017 operational highlights *See non-GAAP Adjusted EBITDA, non-GAAP Adjusted Fully Distributed Earnings Per Share and non-GAAP Free Cash Flow reconciliations to GAAP equivalents in Appendix. Supply chain spend through GPO contracts increased to $56+ billion Achieved 99% GPO retention rate and 95% SaaS institutional renewal rate Developed new capabilities with PremierConnect™ Service Line Analytics and our Clinician Performance Management solution suite Completed acquisitions of Acro Pharmaceuticals and Innovatix and Essensa Launched national opioid safety program through our hospital improvement innovation network Expanded member base, ending year with ~3,900 hospitals and health systems, ~150,000 other providers and organizations
Chief Operating Officer Premier Inc. Mike Alkire OPERATIONS REVIEW
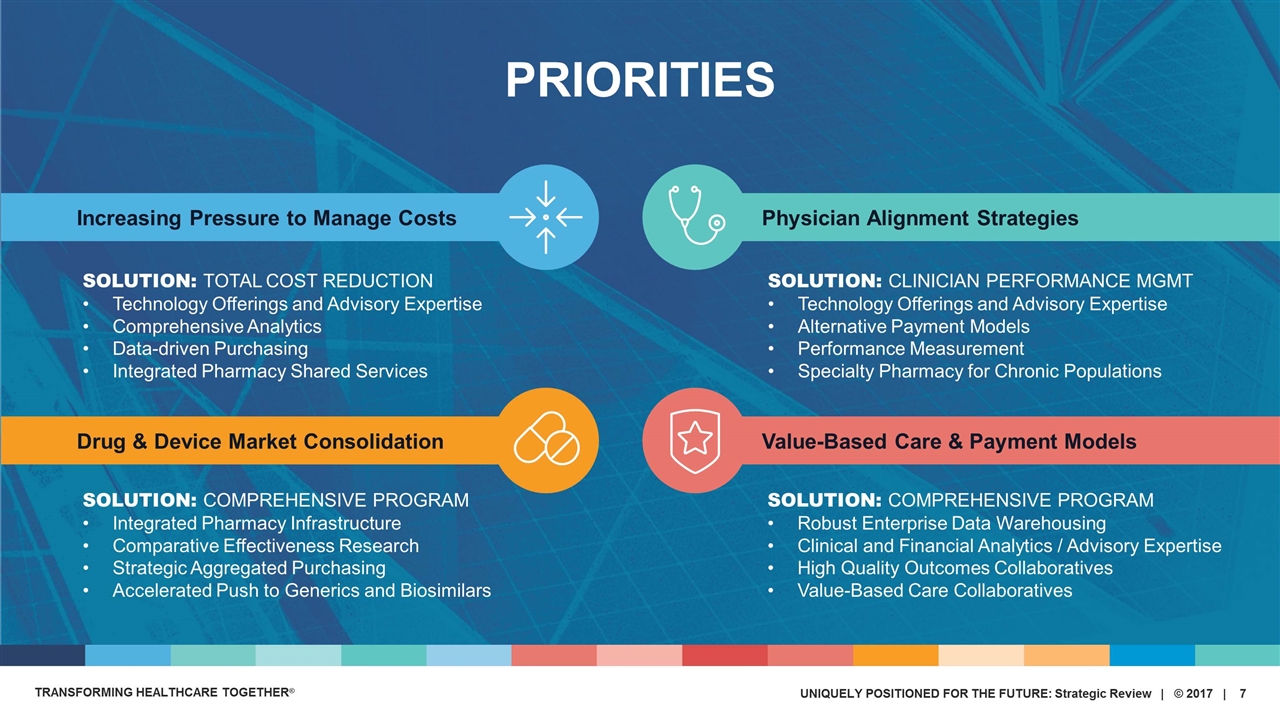
Increasing Pressure to Manage Costs SOLUTION: TOTAL COST REDUCTION Technology Offerings and Advisory Expertise Comprehensive Analytics Data-driven Purchasing Integrated Pharmacy Shared Services Drug & Device Market Consolidation SOLUTION: COMPREHENSIVE PROGRAM Integrated Pharmacy Infrastructure Comparative Effectiveness Research Strategic Aggregated Purchasing Accelerated Push to Generics and Biosimilars Physician Alignment Strategies SOLUTION: CLINICIAN PERFORMANCE MGMT Technology Offerings and Advisory Expertise Alternative Payment Models Performance Measurement Specialty Pharmacy for Chronic Populations Value-Based Care & Payment Models SOLUTION: COMPREHENSIVE PROGRAM Robust Enterprise Data Warehousing Clinical and Financial Analytics / Advisory Expertise High Quality Outcomes Collaboratives Value-Based Care Collaboratives PRIORITIES
New comprehensive engagements with academics
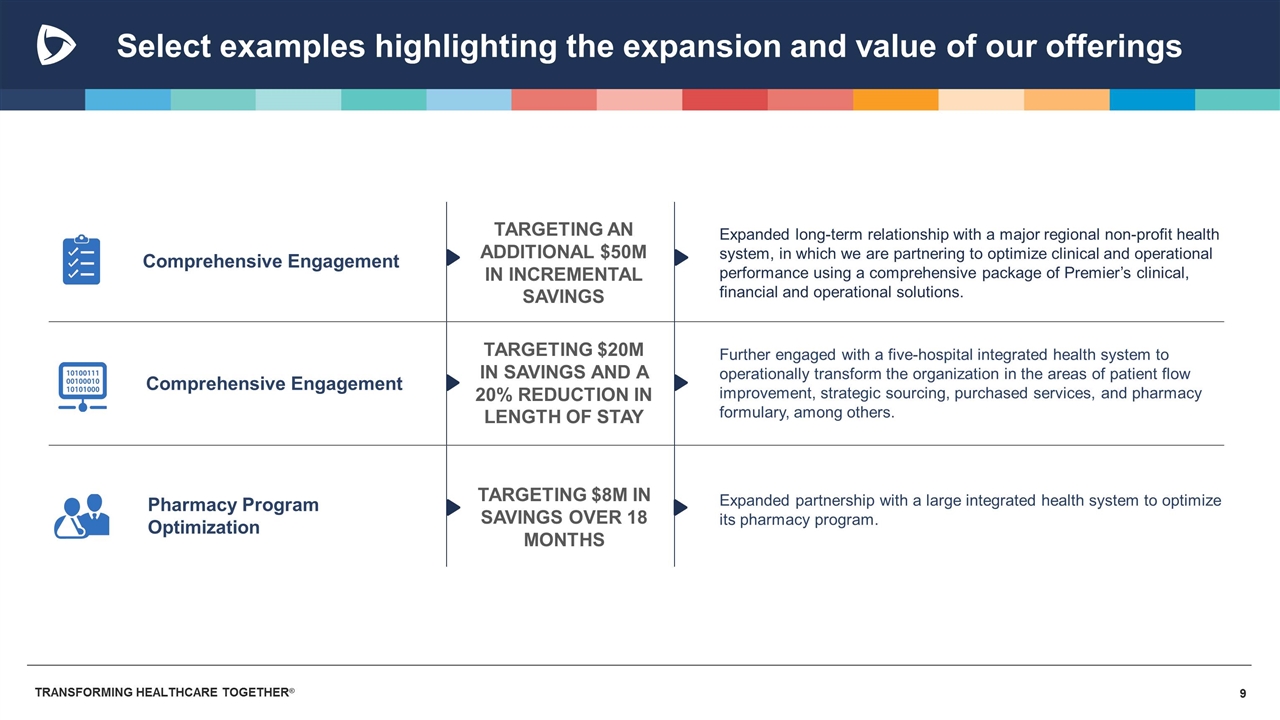
Select examples highlighting the expansion and value of our offerings Expanded long-term relationship with a major regional non-profit health system, in which we are partnering to optimize clinical and operational performance using a comprehensive package of Premier’s clinical, financial and operational solutions. Comprehensive Engagement Pharmacy Program Optimization Comprehensive Engagement Further engaged with a five-hospital integrated health system to operationally transform the organization in the areas of patient flow improvement, strategic sourcing, purchased services, and pharmacy formulary, among others. Expanded partnership with a large integrated health system to optimize its pharmacy program. TARGETING $20M IN SAVINGS AND A 20% REDUCTION IN LENGTH OF STAY TARGETING AN ADDITIONAL $50M IN INCREMENTAL SAVINGS TARGETING $8M IN SAVINGS OVER 18 MONTHS
Chief Financial Officer Premier Inc. Craig McKasson FINANCIAL REVIEW
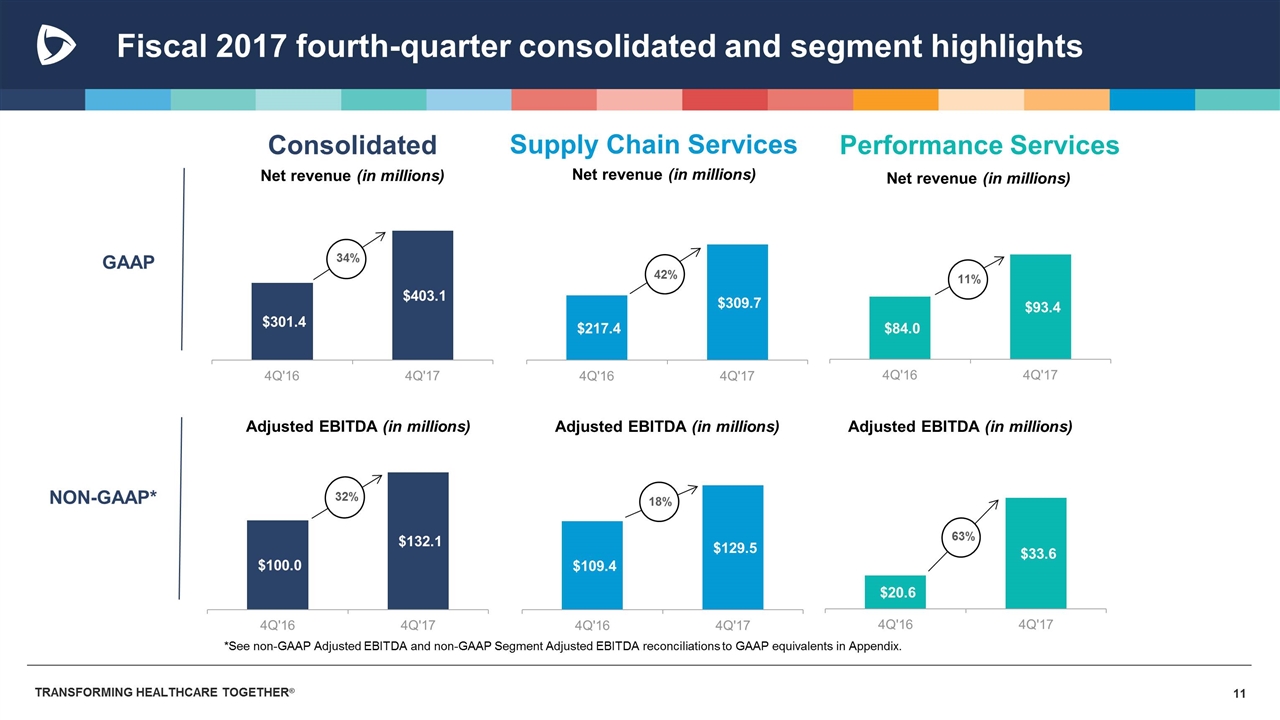
Fiscal 2017 fourth-quarter consolidated and segment highlights Consolidated Net revenue (in millions) Supply Chain Services Net revenue (in millions) Performance Services Net revenue (in millions) Adjusted EBITDA (in millions) Adjusted EBITDA (in millions) Adjusted EBITDA (in millions) *See non-GAAP Adjusted EBITDA and non-GAAP Segment Adjusted EBITDA reconciliations to GAAP equivalents in Appendix. 34% 32% 42% 18% 11% 63% GAAP NON-GAAP*
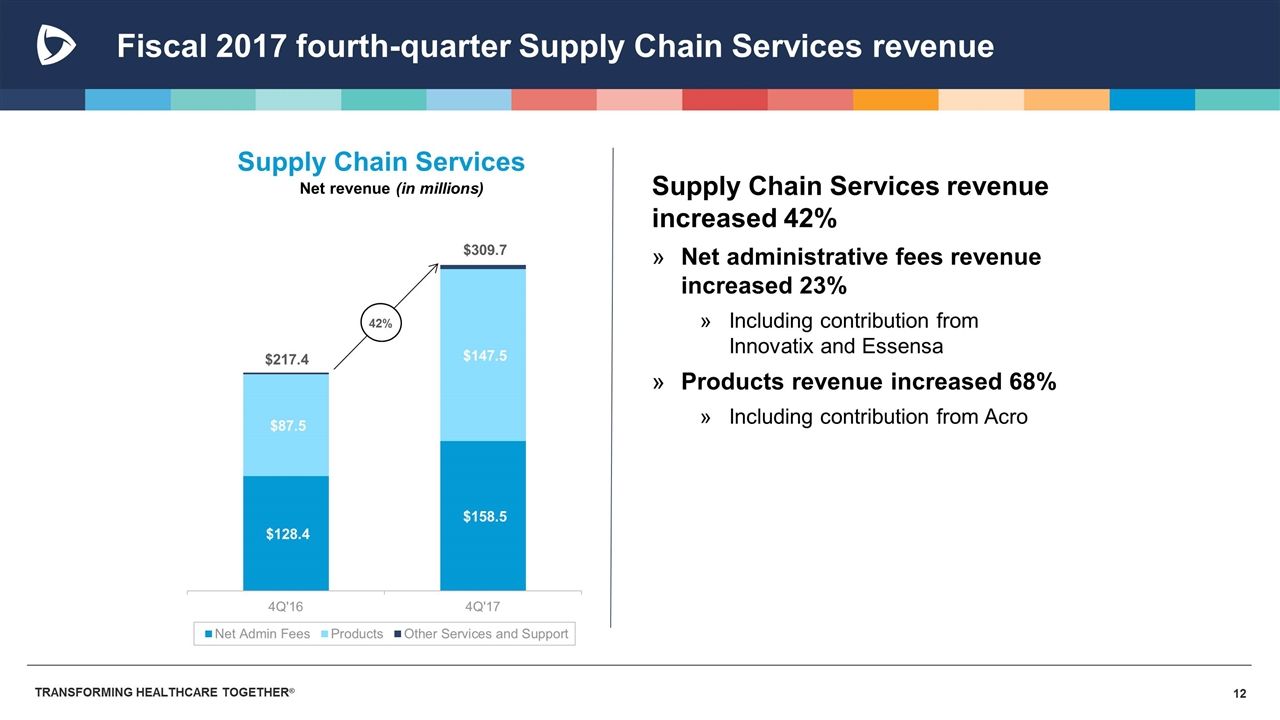
Fiscal 2017 fourth-quarter Supply Chain Services revenue Supply Chain Services revenue increased 42% Net administrative fees revenue increased 23% Including contribution from Innovatix and Essensa Products revenue increased 68% Including contribution from Acro Supply Chain Services Net revenue (in millions) 42% $217.4 $309.7
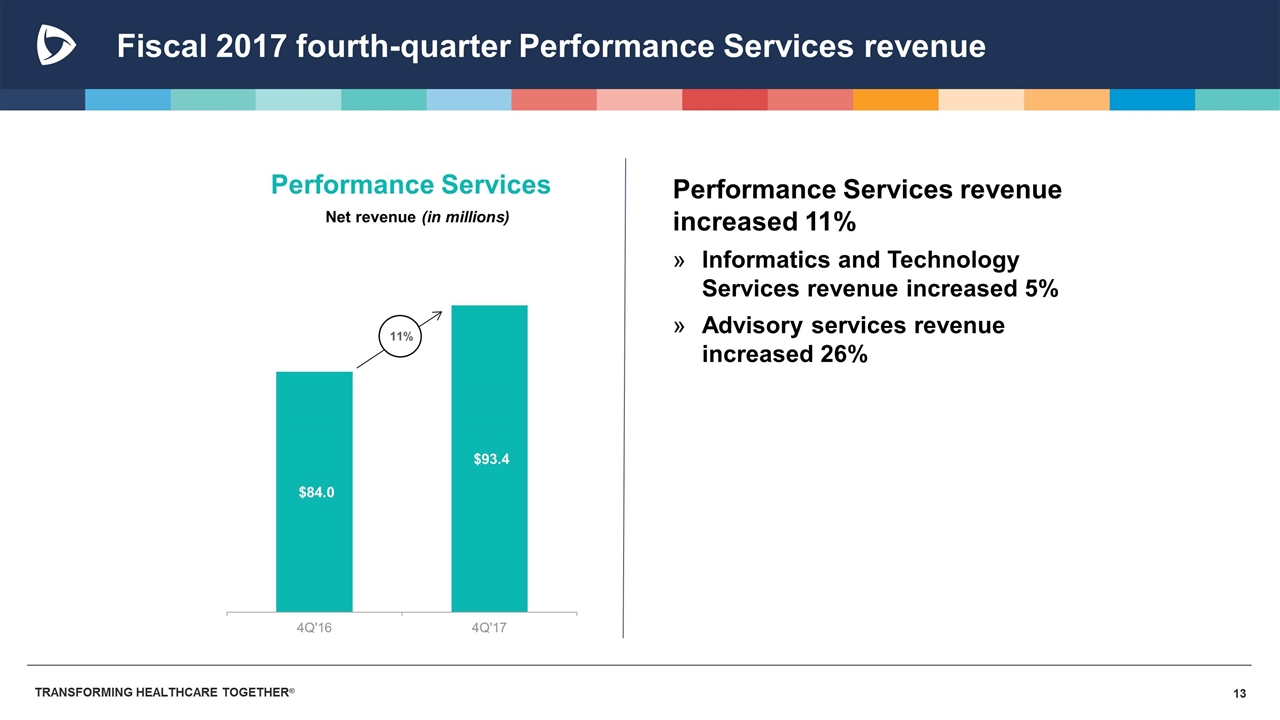
Fiscal 2017 fourth-quarter Performance Services revenue Performance Services revenue increased 11% Informatics and Technology Services revenue increased 5% Advisory services revenue increased 26% Performance Services Net revenue (in millions) 11%
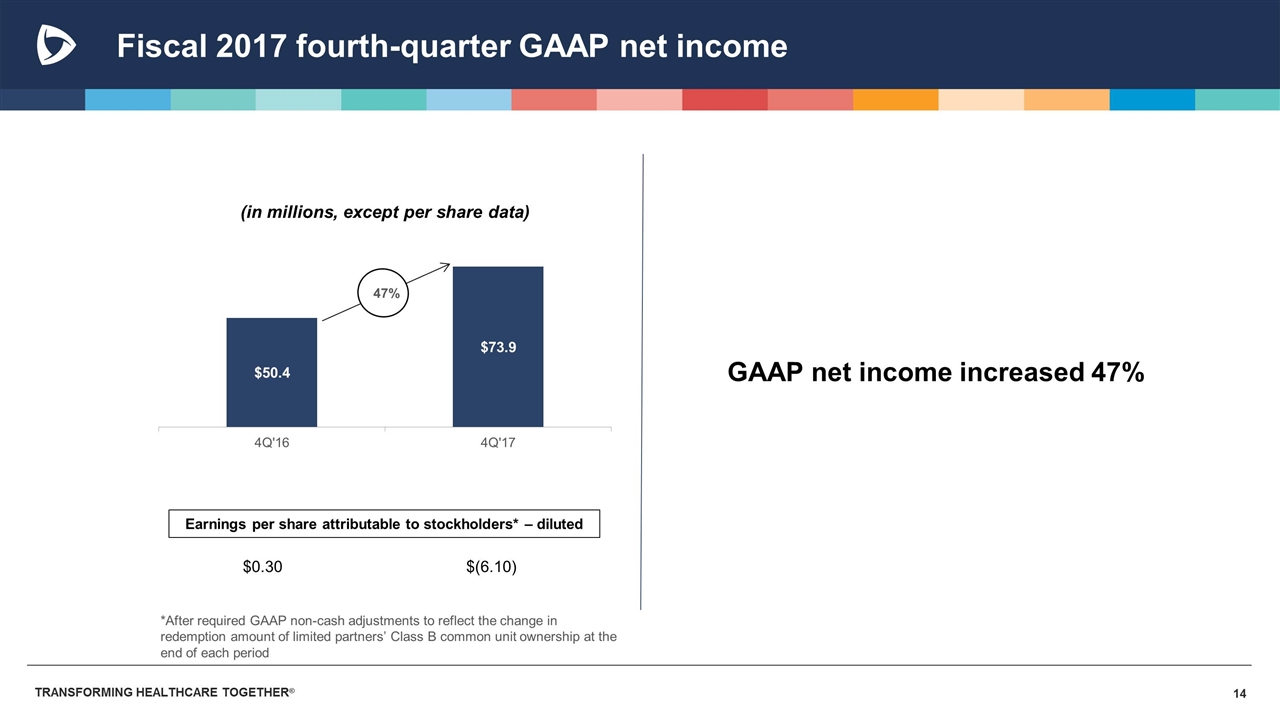
Fiscal 2017 fourth-quarter GAAP net income 47% $0.30 $(6.10) Earnings per share attributable to stockholders* – diluted GAAP net income increased 47% *After required GAAP non-cash adjustments to reflect the change in redemption amount of limited partners’ Class B common unit ownership at the end of each period
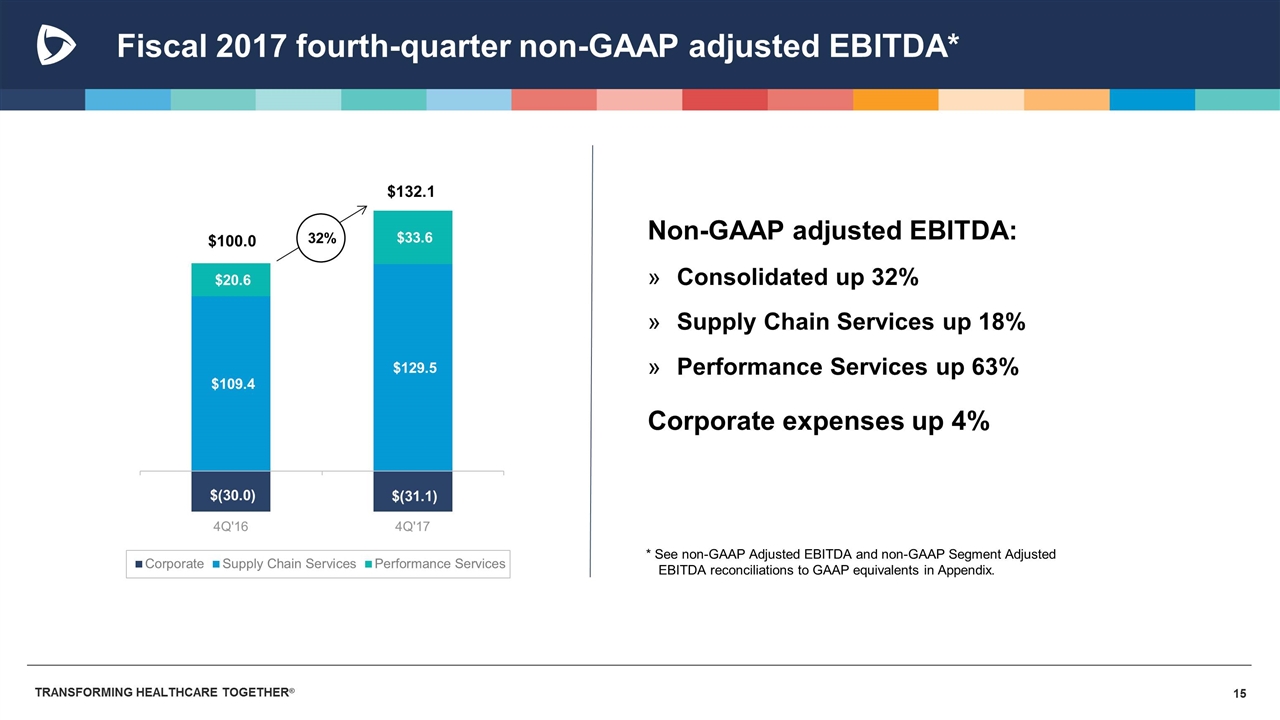
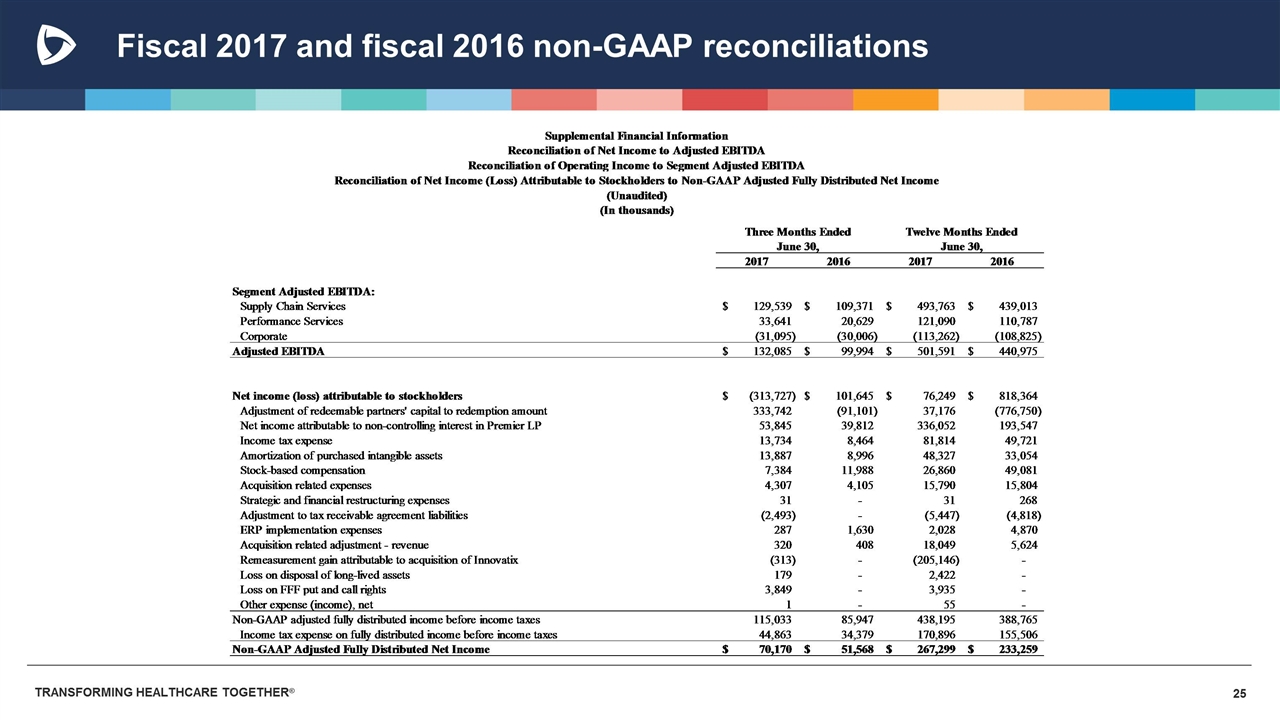
Fiscal 2017 fourth-quarter non-GAAP adjusted EBITDA* Non-GAAP adjusted EBITDA: Consolidated up 32% Supply Chain Services up 18% Performance Services up 63% Corporate expenses up 4% * See non-GAAP Adjusted EBITDA and non-GAAP Segment Adjusted EBITDA reconciliations to GAAP equivalents in Appendix. $132.1 $100.0
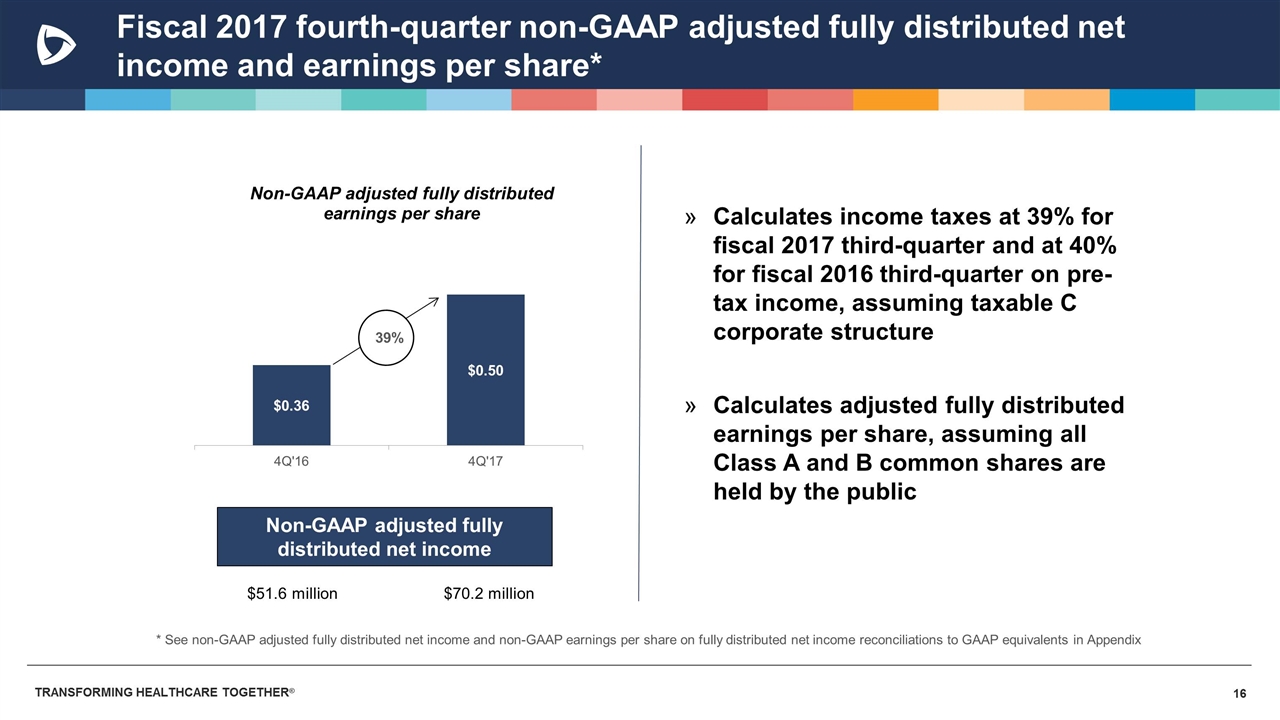
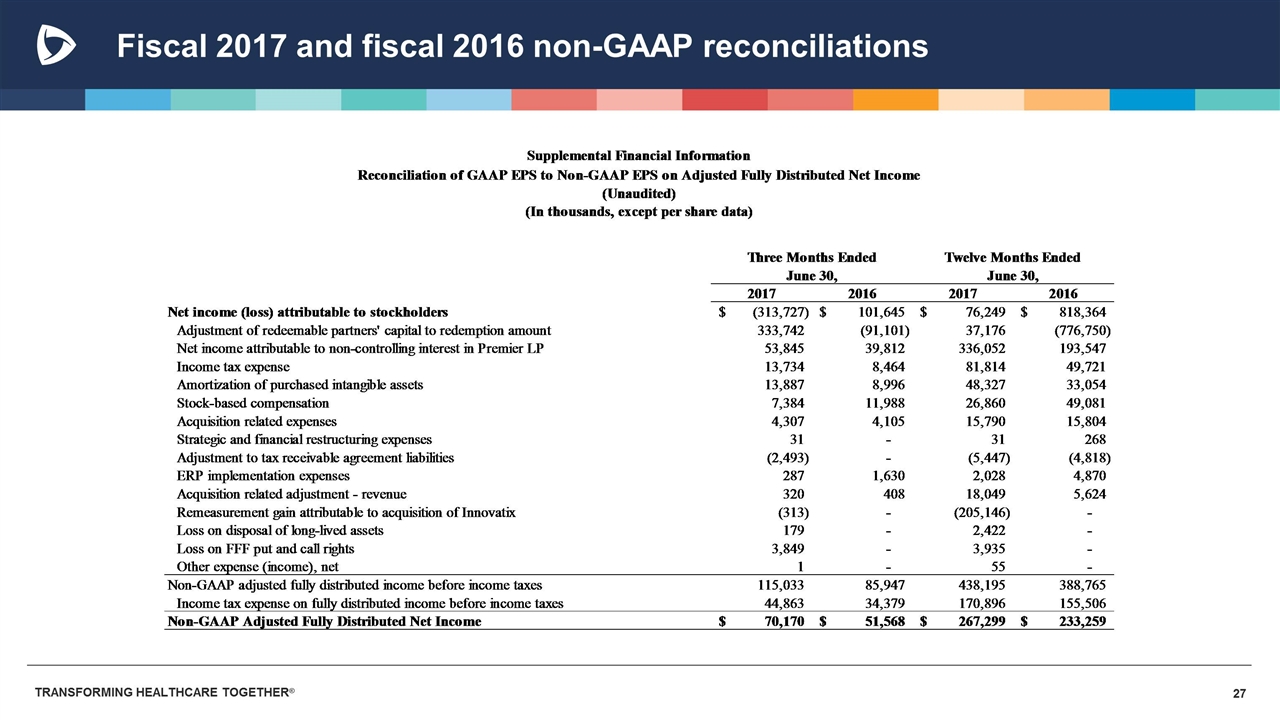
Fiscal 2017 fourth-quarter non-GAAP adjusted fully distributed net income and earnings per share* 39% $51.6 million $70.2 million Non-GAAP adjusted fully distributed net income * See non-GAAP adjusted fully distributed net income and non-GAAP earnings per share on fully distributed net income reconciliations to GAAP equivalents in Appendix Calculates income taxes at 39% for fiscal 2017 third-quarter and at 40% for fiscal 2016 third-quarter on pre-tax income, assuming taxable C corporate structure Calculates adjusted fully distributed earnings per share, assuming all Class A and B common shares are held by the public

Cash flow and capital flexibility at June 30, 2017 CONSIDERABLE CASH AND DEBT CAPACITY AVAILABLE AMPLE CAPITAL FLEXIBILITY FOR FUTURE ACQUISITIONS AND BUSINESS GROWTH Cash flow from operations of $392.2 million for fiscal 2017 Cash, cash equivalents & marketable securities of $156.7 million Outstanding borrowings of $220.0 million on $750.0 million five-year unsecured revolving credit facility Non-GAAP free cash flow* of $216.5 million for fiscal 2017, which represented 43% of non-GAAP adjusted EBITDA* Cash taxes of $26.1 million paid in fiscal 2017 compared with $24.9 million in fiscal 2016 *See non-GAAP Adjusted EBITDA, non-GAAP Segment Adjusted EBITDA, and non-GAAP Free Cash Flow reconciliations to GAAP equivalents in Appendix.
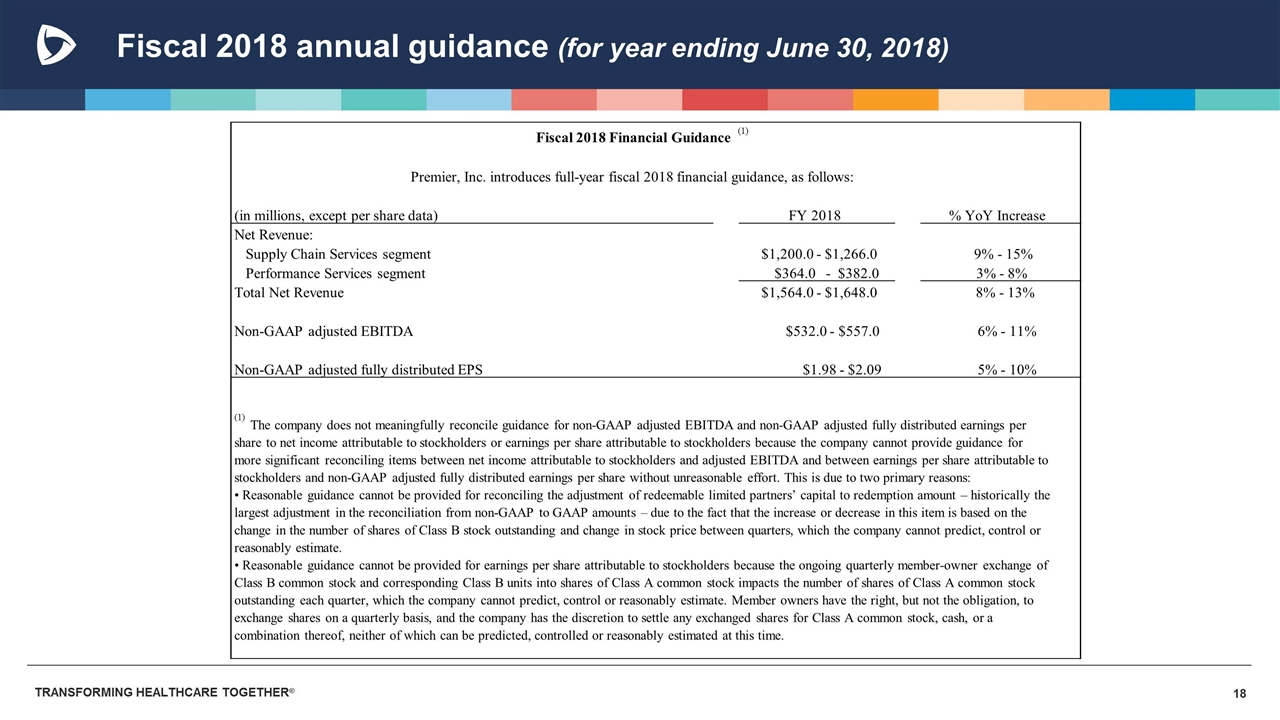
Fiscal 2018 annual guidance (for year ending June 30, 2018) (in millions, except per share data) FY 2018 % YoY Increase Net Revenue: Supply Chain Services segment $1,200.0 - $1,266.0 9% - 15% Performance Services segment $364.0 - $382.0 3% - 8% Total Net Revenue $1,564.0 - $1,648.0 8% - 13% Non-GAAP adjusted EBITDA $532.0 - $557.0 6% - 11% Non-GAAP adjusted fully distributed EPS $1.98 - $2.09 5% - 10% Fiscal 2018 Financial Guidance (1) Premier, Inc. introduces full-year fiscal 2018 financial guidance, as follows: (1) The company does not meaningfully reconcile guidance for non-GAAP adjusted EBITDA and non-GAAP adjusted fully distributed earnings per share to net income attributable to stockholders or earnings per share attributable to stockholders because the company cannot provide guidance for more significant reconciling items between net income attributable to stockholders and adjusted EBITDA and between earnings per share attributable to stockholders and non-GAAP adjusted fully distributed earnings per share without unreasonable effort. This is due to two primary reasons: • Reasonable guidance cannot be provided for reconciling the adjustment of redeemable limited partners’ capital to redemption amount – historically the largest adjustment in the reconciliation from non-GAAP to GAAP amounts – due to the fact that the increase or decrease in this item is based on the change in the number of shares of Class B stock outstanding and change in stock price between quarters, which the company cannot predict, control or reasonably estimate. • Reasonable guidance cannot be provided for earnings per share attributable to stockholders because the ongoing quarterly member-owner exchange of Class B common stock and corresponding Class B units into shares of Class A common stock impacts the number of shares of Class A common stock outstanding each quarter, which the company cannot predict, control or reasonably estimate. Member owners have the right, but not the obligation, to exchange shares on a quarterly basis, and the company has the discretion to settle any exchanged shares for Class A common stock, cash, or a combination thereof, neither of which can be predicted, controlled or reasonably estimated at this time.
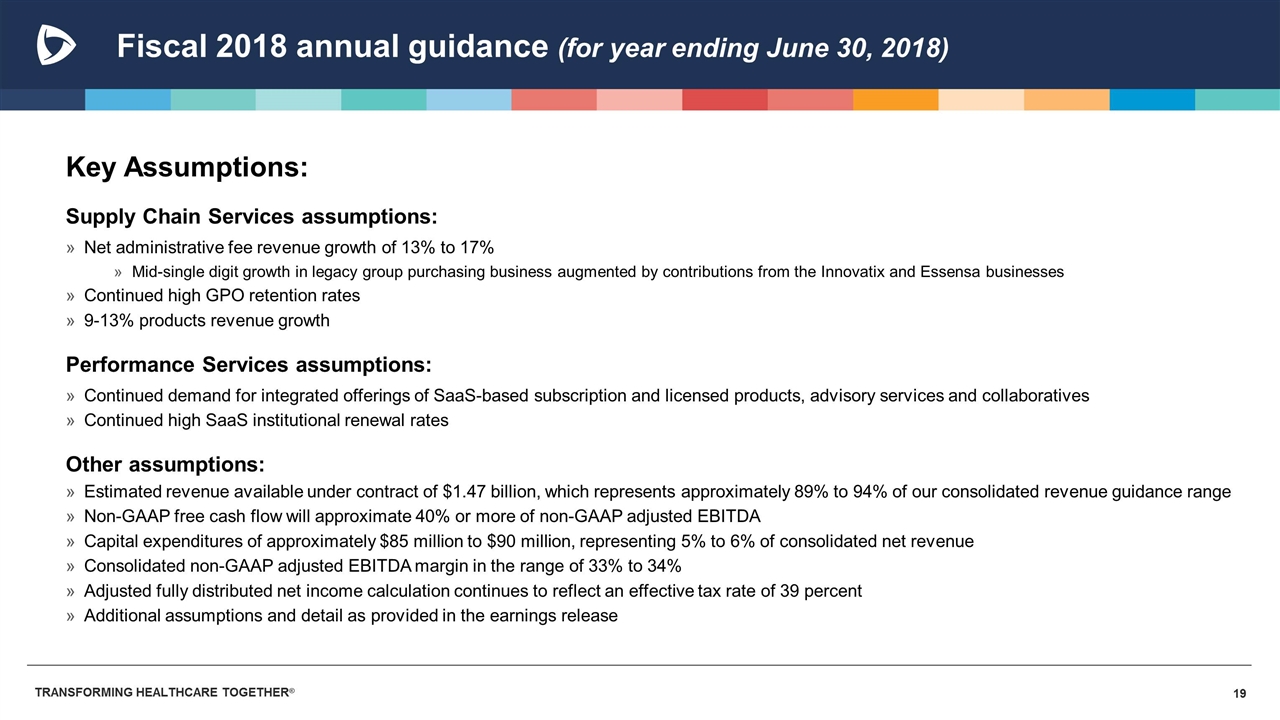
Fiscal 2018 annual guidance (for year ending June 30, 2018) Key Assumptions: Supply Chain Services assumptions: Net administrative fee revenue growth of 13% to 17% Mid-single digit growth in legacy group purchasing business augmented by contributions from the Innovatix and Essensa businesses Continued high GPO retention rates 9-13% products revenue growth Performance Services assumptions: Continued demand for integrated offerings of SaaS-based subscription and licensed products, advisory services and collaboratives Continued high SaaS institutional renewal rates Other assumptions: Estimated revenue available under contract of $1.47 billion, which represents approximately 89% to 94% of our consolidated revenue guidance range Non-GAAP free cash flow will approximate 40% or more of non-GAAP adjusted EBITDA Capital expenditures of approximately $85 million to $90 million, representing 5% to 6% of consolidated net revenue Consolidated non-GAAP adjusted EBITDA margin in the range of 33% to 34% Adjusted fully distributed net income calculation continues to reflect an effective tax rate of 39 percent Additional assumptions and detail as provided in the earnings release
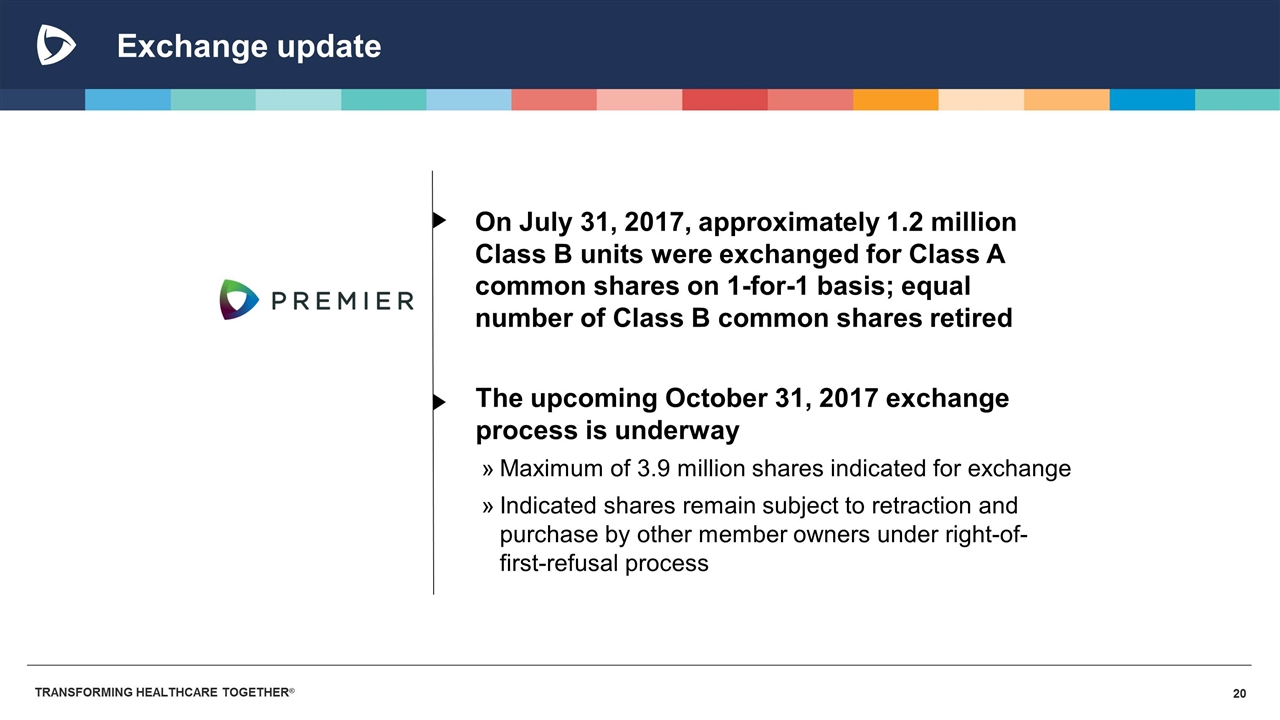
Exchange update On July 31, 2017, approximately 1.2 million Class B units were exchanged for Class A common shares on 1-for-1 basis; equal number of Class B common shares retired The upcoming October 31, 2017 exchange process is underway Maximum of 3.9 million shares indicated for exchange Indicated shares remain subject to retraction and purchase by other member owners under right-of-first-refusal process

QUESTIONS
APPENDIX
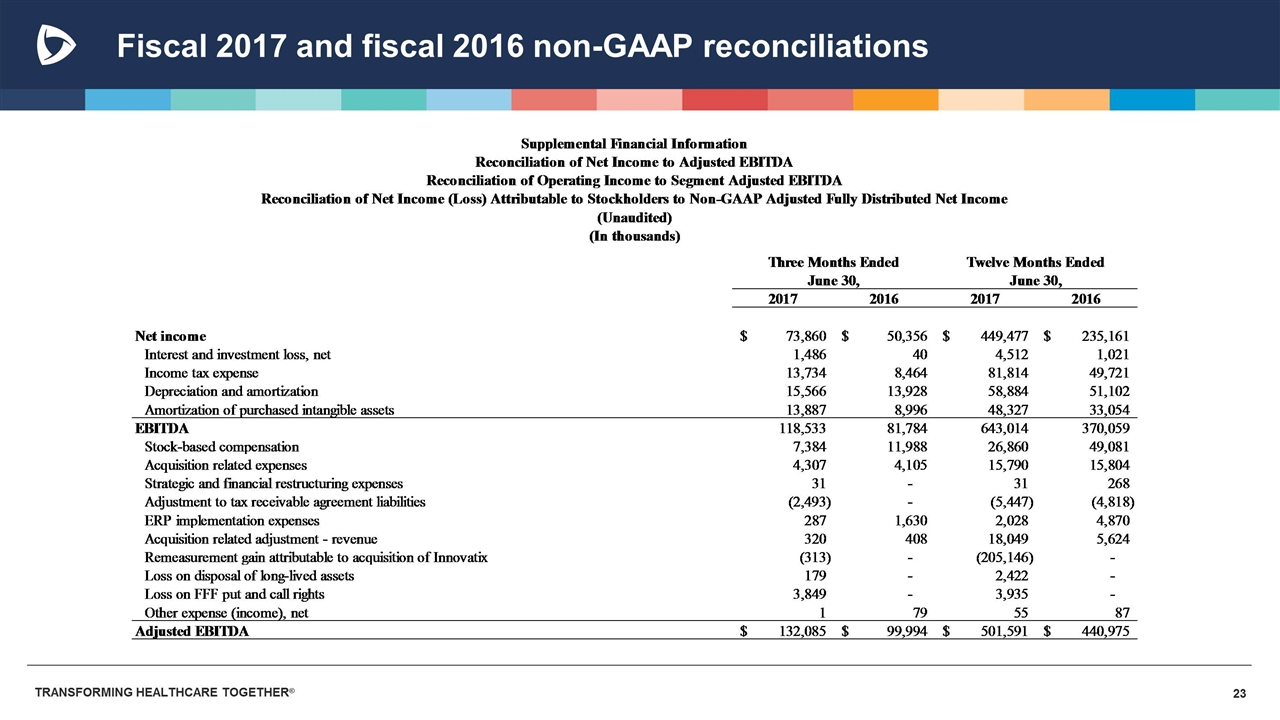
Fiscal 2017 and fiscal 2016 non-GAAP reconciliations
Fiscal 2017 and fiscal 2016 non-GAAP reconciliations
Fiscal 2017 and fiscal 2016 non-GAAP reconciliations
Fiscal 2017 and fiscal 2016 non-GAAP reconciliations
Fiscal 2017 and fiscal 2016 non-GAAP reconciliations
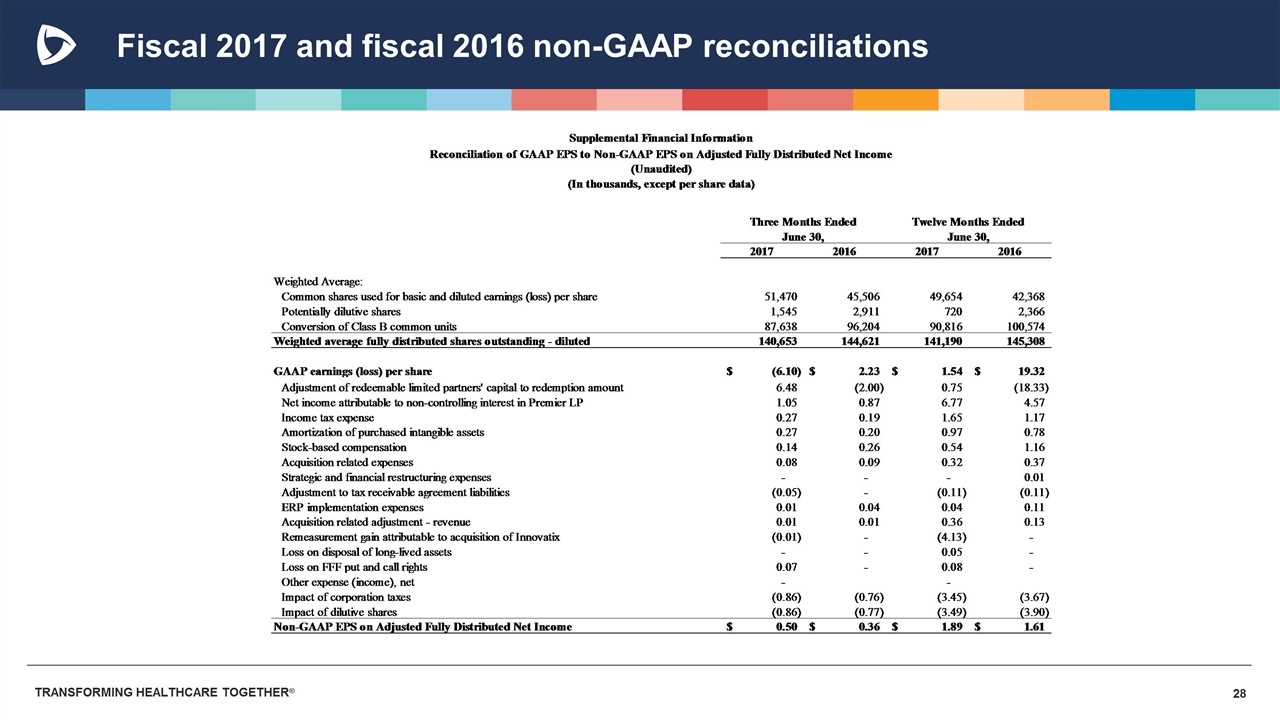
Fiscal 2017 and fiscal 2016 non-GAAP reconciliations


