
Exhibit 99.3 Second-Quarter Fiscal 2019 Financial Results and Update February 5, 2019Exhibit 99.3 Second-Quarter Fiscal 2019 Financial Results and Update February 5, 2019
Forward-looking statements and non-GAAP financial measures Forward-looking statements – Statements made in this presentation that are not statements of historical or current facts, such as those related to expected financial performance, non-GAAP free cash flow generation, the impact of the new revenue recognition standards, share repurchases under our fiscal 2019 stock repurchase program, and the statements related to fiscal 2019 outlook and guidance and the assumptions underlying such guidance, are “forward-looking statements” within the meaning of the Private Securities Litigation Reform Act of 1995. Forward-looking statements may involve known and unknown risks, uncertainties and other factors that may cause the actual results, performance or achievements of Premier to be materially different from historical results or from any future results or projections expressed or implied by such forward-looking statements. Accordingly, readers should not place undue reliance on any forward looking statements. In addition to statements that explicitly describe such risks and uncertainties, readers are urged to consider statements in the conditional or future tenses or that include terms such as “believes,” “belief,” “expects,” “estimates,” “intends,” “anticipates” or “plans” to be uncertain and forward-looking. Forward-looking statements may include comments as to Premier’s beliefs and expectations as to future events and trends affecting its business and are necessarily subject to uncertainties, many of which are outside Premier’s control. More information on potential factors that could affect Premier’s financial results is included from time to time in the “Cautionary Note Regarding Forward-Looking Statements,” “Risk Factors” and “Management’s Discussion and Analysis of Financial Condition and Results of Operations” sections of Premier’s periodic and current filings with the SEC, including those discussed under the “Risk Factors” and “Cautionary Note Regarding Forward-Looking Statements” section of Premier’s Form 10-K for the year ended June 30, 2018 as well as the Form 10-Q for the quarter ended December 31, 2018, expected to be filed with the SEC shortly after the date of this presentation, and also made available on Premier’s website at investors.premierinc.com. Forward-looking statements speak only as of the date they are made, and Premier undertakes no obligation to publicly update or revise any forward-looking statements, whether as a result of new information or future events that occur after that date, or otherwise. Non-GAAP financial measures – This presentation includes certain “non-GAAP financial measures” as defined in Regulation G under the Securities Exchange Act of 1934. Schedules are attached that reconcile the non-GAAP financial measures included in this presentation to the most directly comparable financial measures calculated and presented in accordance with Generally Accepted Accounting Principles in the United States. You should carefully read Premier’s periodic and current filings with the SEC for definitions and further explanation and disclosure regarding our use of non-GAAP financial measures and such filings should be read in conjunction with this presentation. 2Forward-looking statements and non-GAAP financial measures Forward-looking statements – Statements made in this presentation that are not statements of historical or current facts, such as those related to expected financial performance, non-GAAP free cash flow generation, the impact of the new revenue recognition standards, share repurchases under our fiscal 2019 stock repurchase program, and the statements related to fiscal 2019 outlook and guidance and the assumptions underlying such guidance, are “forward-looking statements” within the meaning of the Private Securities Litigation Reform Act of 1995. Forward-looking statements may involve known and unknown risks, uncertainties and other factors that may cause the actual results, performance or achievements of Premier to be materially different from historical results or from any future results or projections expressed or implied by such forward-looking statements. Accordingly, readers should not place undue reliance on any forward looking statements. In addition to statements that explicitly describe such risks and uncertainties, readers are urged to consider statements in the conditional or future tenses or that include terms such as “believes,” “belief,” “expects,” “estimates,” “intends,” “anticipates” or “plans” to be uncertain and forward-looking. Forward-looking statements may include comments as to Premier’s beliefs and expectations as to future events and trends affecting its business and are necessarily subject to uncertainties, many of which are outside Premier’s control. More information on potential factors that could affect Premier’s financial results is included from time to time in the “Cautionary Note Regarding Forward-Looking Statements,” “Risk Factors” and “Management’s Discussion and Analysis of Financial Condition and Results of Operations” sections of Premier’s periodic and current filings with the SEC, including those discussed under the “Risk Factors” and “Cautionary Note Regarding Forward-Looking Statements” section of Premier’s Form 10-K for the year ended June 30, 2018 as well as the Form 10-Q for the quarter ended December 31, 2018, expected to be filed with the SEC shortly after the date of this presentation, and also made available on Premier’s website at investors.premierinc.com. Forward-looking statements speak only as of the date they are made, and Premier undertakes no obligation to publicly update or revise any forward-looking statements, whether as a result of new information or future events that occur after that date, or otherwise. Non-GAAP financial measures – This presentation includes certain “non-GAAP financial measures” as defined in Regulation G under the Securities Exchange Act of 1934. Schedules are attached that reconcile the non-GAAP financial measures included in this presentation to the most directly comparable financial measures calculated and presented in accordance with Generally Accepted Accounting Principles in the United States. You should carefully read Premier’s periodic and current filings with the SEC for definitions and further explanation and disclosure regarding our use of non-GAAP financial measures and such filings should be read in conjunction with this presentation. 2

Susan DeVore President and Chief Executive Officer Premier, Inc. Overview and Business UpdateSusan DeVore President and Chief Executive Officer Premier, Inc. Overview and Business Update
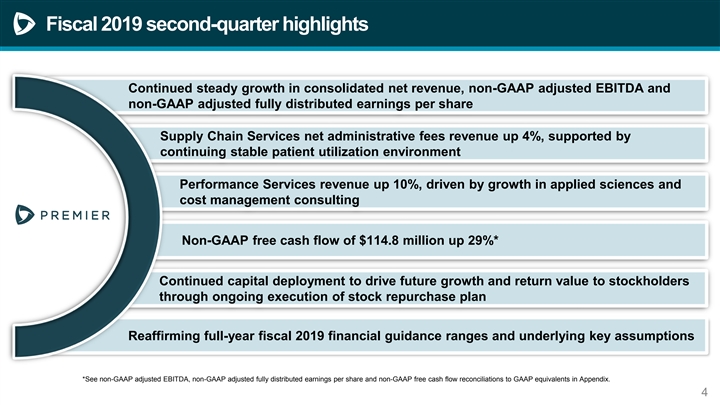
Fiscal 2019 second-quarter highlights Continued steady growth in consolidated net revenue, non-GAAP adjusted EBITDA and non-GAAP adjusted fully distributed earnings per share Supply Chain Services net administrative fees revenue up 4%, supported by continuing stable patient utilization environment Performance Services revenue up 10%, driven by growth in applied sciences and cost management consulting Non-GAAP free cash flow of $114.8 million up 29%* Continued capital deployment to drive future growth and return value to stockholders through ongoing execution of stock repurchase plan Reaffirming full-year fiscal 2019 financial guidance ranges and underlying key assumptions *See non-GAAP Adjusted EBITDA, non-GAAP Adjusted Fully Distributed Earnings Per Share and non-GAAP Free Cash Flow reconciliations to GAAP equivalents in Appendix. *See non-GAAP adjusted EBITDA, non-GAAP adjusted fully distributed earnings per share and non-GAAP free cash flow reconciliations to GAAP equivalents in Appendix. 4Fiscal 2019 second-quarter highlights Continued steady growth in consolidated net revenue, non-GAAP adjusted EBITDA and non-GAAP adjusted fully distributed earnings per share Supply Chain Services net administrative fees revenue up 4%, supported by continuing stable patient utilization environment Performance Services revenue up 10%, driven by growth in applied sciences and cost management consulting Non-GAAP free cash flow of $114.8 million up 29%* Continued capital deployment to drive future growth and return value to stockholders through ongoing execution of stock repurchase plan Reaffirming full-year fiscal 2019 financial guidance ranges and underlying key assumptions *See non-GAAP Adjusted EBITDA, non-GAAP Adjusted Fully Distributed Earnings Per Share and non-GAAP Free Cash Flow reconciliations to GAAP equivalents in Appendix. *See non-GAAP adjusted EBITDA, non-GAAP adjusted fully distributed earnings per share and non-GAAP free cash flow reconciliations to GAAP equivalents in Appendix. 4

Well positioned for emerging healthcare trends Significant proposed reform 1 Acceleration in the shift to 4 of the pharmaceutical market value-based care and risk is creating financial pressure Increasing physician participation 2 5 and alignment with alternative Turning data into actionable payment programs insights at the point of care Employers contracting with Vertical and horizontal 3 6 providers; active consumer consolidation engagement 5Well positioned for emerging healthcare trends Significant proposed reform 1 Acceleration in the shift to 4 of the pharmaceutical market value-based care and risk is creating financial pressure Increasing physician participation 2 5 and alignment with alternative Turning data into actionable payment programs insights at the point of care Employers contracting with Vertical and horizontal 3 6 providers; active consumer consolidation engagement 5

Mike Alkire Chief Operating Officer Premier, Inc. Operations ReviewMike Alkire Chief Operating Officer Premier, Inc. Operations Review
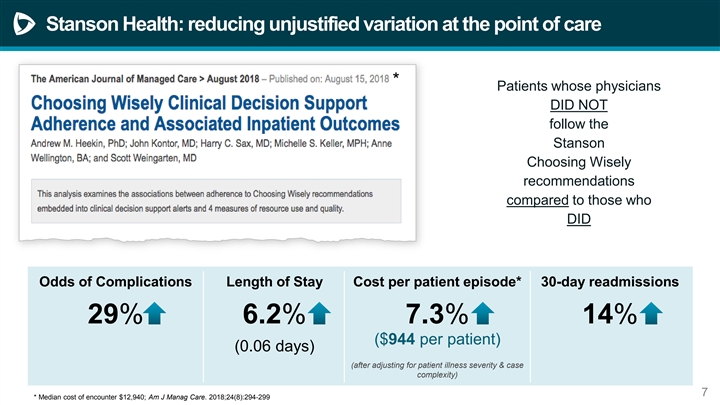
Stanson Health: reducing unjustified variation at the point of care * Patients whose physicians DID NOT follow the Stanson Choosing Wisely recommendations compared to those who DID Odds of Complications Length of Stay Cost per patient episode* 30-day readmissions 29% 6.2% 7.3% 14% ($944 per patient) (0.06 days) (after adjusting for patient illness severity & case complexity) 7 * Median cost of encounter $12,940; Am J Manag Care. 2018;24(8):294-299Stanson Health: reducing unjustified variation at the point of care * Patients whose physicians DID NOT follow the Stanson Choosing Wisely recommendations compared to those who DID Odds of Complications Length of Stay Cost per patient episode* 30-day readmissions 29% 6.2% 7.3% 14% ($944 per patient) (0.06 days) (after adjusting for patient illness severity & case complexity) 7 * Median cost of encounter $12,940; Am J Manag Care. 2018;24(8):294-299

Operational initiatives solving for the gaining winning in a generic drug momentum in consolidating shortage applied sciences marketplace 8Operational initiatives solving for the gaining winning in a generic drug momentum in consolidating shortage applied sciences marketplace 8

Craig McKasson Chief Financial Officer Premier, Inc. Financial ReviewCraig McKasson Chief Financial Officer Premier, Inc. Financial Review
Adoption of new revenue recognition standard The company adopted new revenue recognition standard ASC 606 on July 1, 2018 using the modified retrospective approach and did not restate prior periods. Accordingly, the year-over-year comparisons in this presentation compare fiscal 2019 second- quarter results under ASC 606 to fiscal 2018 second-quarter results under the previous revenue recognition standard ASC 605. 10Adoption of new revenue recognition standard The company adopted new revenue recognition standard ASC 606 on July 1, 2018 using the modified retrospective approach and did not restate prior periods. Accordingly, the year-over-year comparisons in this presentation compare fiscal 2019 second- quarter results under ASC 606 to fiscal 2018 second-quarter results under the previous revenue recognition standard ASC 605. 10
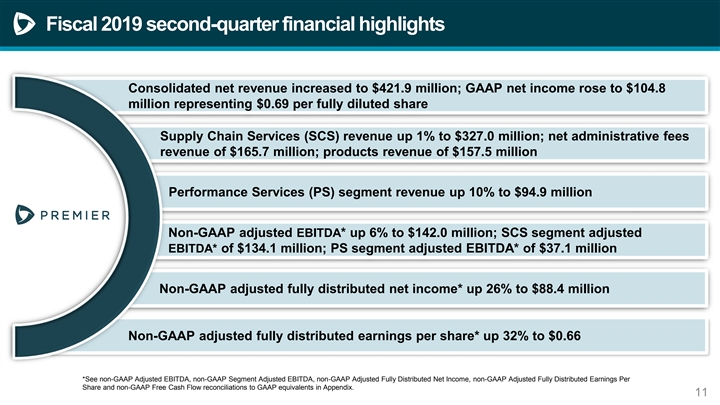
Fiscal 2019 second-quarter financial highlights Consolidated net revenue increased to $421.9 million; GAAP net income rose to $104.8 million representing $0.69 per fully diluted share Supply Chain Services (SCS) revenue up 1% to $327.0 million; net administrative fees revenue of $165.7 million; products revenue of $157.5 million Performance Services (PS) segment revenue up 10% to $94.9 million Non-GAAP adjusted EBITDA* up 6% to $142.0 million; SCS segment adjusted EBITDA* of $134.1 million; PS segment adjusted EBITDA* of $37.1 million Non-GAAP adjusted fully distributed net income* up 26% to $88.4 million Non-GAAP adjusted fully distributed earnings per share* up 32% to $0.66 *See non-GAAP Adjusted EBITDA, non-GAAP Adjusted Fully Distributed Earnings Per Share and non-GAAP Free Cash Flow reconciliations to GAAP equivalents in Appendix. *See non-GAAP Adjusted EBITDA, non-GAAP Segment Adjusted EBITDA, non-GAAP Adjusted Fully Distributed Net Income, non-GAAP Adjusted Fully Distributed Earnings Per Share and non-GAAP Free Cash Flow reconciliations to GAAP equivalents in Appendix. 11Fiscal 2019 second-quarter financial highlights Consolidated net revenue increased to $421.9 million; GAAP net income rose to $104.8 million representing $0.69 per fully diluted share Supply Chain Services (SCS) revenue up 1% to $327.0 million; net administrative fees revenue of $165.7 million; products revenue of $157.5 million Performance Services (PS) segment revenue up 10% to $94.9 million Non-GAAP adjusted EBITDA* up 6% to $142.0 million; SCS segment adjusted EBITDA* of $134.1 million; PS segment adjusted EBITDA* of $37.1 million Non-GAAP adjusted fully distributed net income* up 26% to $88.4 million Non-GAAP adjusted fully distributed earnings per share* up 32% to $0.66 *See non-GAAP Adjusted EBITDA, non-GAAP Adjusted Fully Distributed Earnings Per Share and non-GAAP Free Cash Flow reconciliations to GAAP equivalents in Appendix. *See non-GAAP Adjusted EBITDA, non-GAAP Segment Adjusted EBITDA, non-GAAP Adjusted Fully Distributed Net Income, non-GAAP Adjusted Fully Distributed Earnings Per Share and non-GAAP Free Cash Flow reconciliations to GAAP equivalents in Appendix. 11
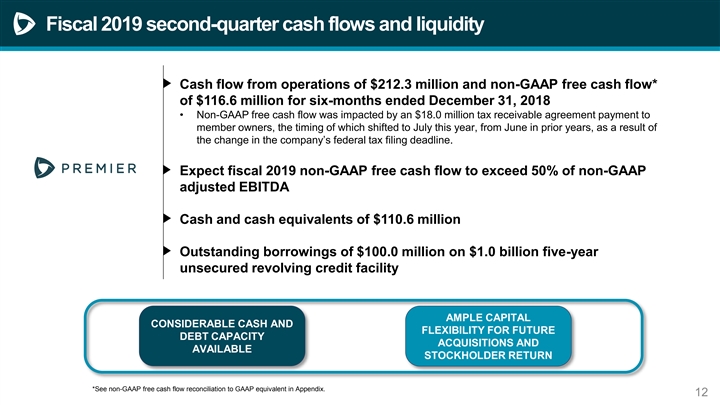
Fiscal 2019 second-quarter cash flows and liquidity Cash flow from operations of $212.3 million and non-GAAP free cash flow* of $116.6 million for six-months ended December 31, 2018 • Non-GAAP free cash flow was impacted by an $18.0 million tax receivable agreement payment to member owners, the timing of which shifted to July this year, from June in prior years, as a result of the change in the company’s federal tax filing deadline. Expect fiscal 2019 non-GAAP free cash flow to exceed 50% of non-GAAP adjusted EBITDA Cash and cash equivalents of $110.6 million Outstanding borrowings of $100.0 million on $1.0 billion five-year unsecured revolving credit facility AMPLE CAPITAL CONSIDERABLE CASH AND FLEXIBILITY FOR FUTURE DEBT CAPACITY ACQUISITIONS AND AVAILABLE STOCKHOLDER RETURN *See non-GAAP free cash flow reconciliation to GAAP equivalent in Appendix. 12Fiscal 2019 second-quarter cash flows and liquidity Cash flow from operations of $212.3 million and non-GAAP free cash flow* of $116.6 million for six-months ended December 31, 2018 • Non-GAAP free cash flow was impacted by an $18.0 million tax receivable agreement payment to member owners, the timing of which shifted to July this year, from June in prior years, as a result of the change in the company’s federal tax filing deadline. Expect fiscal 2019 non-GAAP free cash flow to exceed 50% of non-GAAP adjusted EBITDA Cash and cash equivalents of $110.6 million Outstanding borrowings of $100.0 million on $1.0 billion five-year unsecured revolving credit facility AMPLE CAPITAL CONSIDERABLE CASH AND FLEXIBILITY FOR FUTURE DEBT CAPACITY ACQUISITIONS AND AVAILABLE STOCKHOLDER RETURN *See non-GAAP free cash flow reconciliation to GAAP equivalent in Appendix. 12
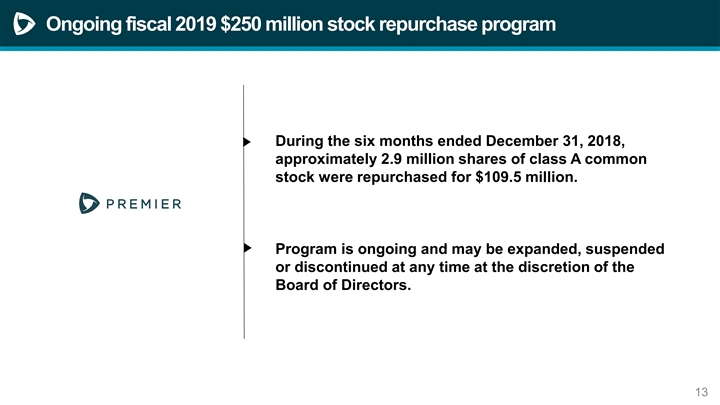
Ongoing fiscal 2019 $250 million stock repurchase program During the six months ended December 31, 2018, approximately 2.9 million shares of class A common stock were repurchased for $109.5 million. Program is ongoing and may be expanded, suspended or discontinued at any time at the discretion of the Board of Directors. 13Ongoing fiscal 2019 $250 million stock repurchase program During the six months ended December 31, 2018, approximately 2.9 million shares of class A common stock were repurchased for $109.5 million. Program is ongoing and may be expanded, suspended or discontinued at any time at the discretion of the Board of Directors. 13

(1) Fiscal 2019 guidance reiterated Fiscal 2019 Financial Guidance ASC 606 (in millions, except per share data) Net Revenue: Supply Chain Services segment $1,305.0 - $1,357.0 Performance Services segment $350.0 - $364.0 Total Net Revenue $1,655.0 - $1,721.0 Non-GAAP adjusted EBITDA $550.0 - $572.0 Non-GAAP adjusted fully distributed EPS $2.55 - $2.67 (1) For the year ending June 30, 2019. As of February 5, 2019. See accompanying page for fiscal 2019 notes and assumptions to guidance. 14(1) Fiscal 2019 guidance reiterated Fiscal 2019 Financial Guidance ASC 606 (in millions, except per share data) Net Revenue: Supply Chain Services segment $1,305.0 - $1,357.0 Performance Services segment $350.0 - $364.0 Total Net Revenue $1,655.0 - $1,721.0 Non-GAAP adjusted EBITDA $550.0 - $572.0 Non-GAAP adjusted fully distributed EPS $2.55 - $2.67 (1) For the year ending June 30, 2019. As of February 5, 2019. See accompanying page for fiscal 2019 notes and assumptions to guidance. 14
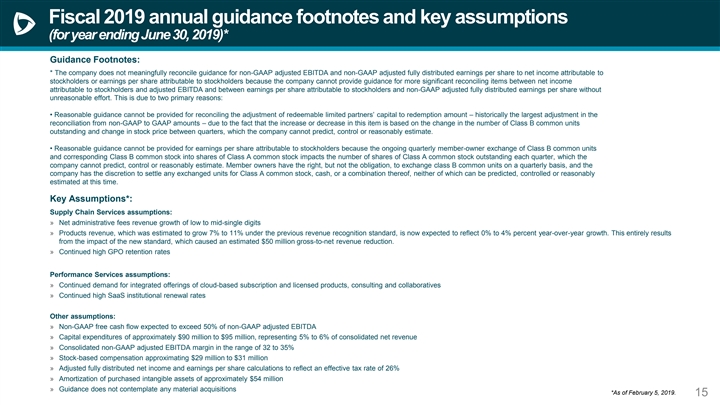
Fiscal 2019 annual guidance footnotes and key assumptions (for year ending June 30, 2019)* Guidance Footnotes: * The company does not meaningfully reconcile guidance for non-GAAP adjusted EBITDA and non-GAAP adjusted fully distributed earnings per share to net income attributable to stockholders or earnings per share attributable to stockholders because the company cannot provide guidance for more significant reconciling items between net income attributable to stockholders and adjusted EBITDA and between earnings per share attributable to stockholders and non-GAAP adjusted fully distributed earnings per share without unreasonable effort. This is due to two primary reasons: • Reasonable guidance cannot be provided for reconciling the adjustment of redeemable limited partners’ capital to redemption amount – historically the largest adjustment in the reconciliation from non-GAAP to GAAP amounts – due to the fact that the increase or decrease in this item is based on the change in the number of Class B common units outstanding and change in stock price between quarters, which the company cannot predict, control or reasonably estimate. • Reasonable guidance cannot be provided for earnings per share attributable to stockholders because the ongoing quarterly member-owner exchange of Class B common units and corresponding Class B common stock into shares of Class A common stock impacts the number of shares of Class A common stock outstanding each quarter, which the company cannot predict, control or reasonably estimate. Member owners have the right, but not the obligation, to exchange class B common units on a quarterly basis, and the company has the discretion to settle any exchanged units for Class A common stock, cash, or a combination thereof, neither of which can be predicted, controlled or reasonably estimated at this time. Key Assumptions*: Supply Chain Services assumptions: » Net administrative fees revenue growth of low to mid-single digits » Products revenue, which was estimated to grow 7% to 11% under the previous revenue recognition standard, is now expected to reflect 0% to 4% percent year-over-year growth. This entirely results from the impact of the new standard, which caused an estimated $50 million gross-to-net revenue reduction. » Continued high GPO retention rates Performance Services assumptions: » Continued demand for integrated offerings of cloud-based subscription and licensed products, consulting and collaboratives » Continued high SaaS institutional renewal rates Other assumptions: » Non-GAAP free cash flow expected to exceed 50% of non-GAAP adjusted EBITDA » Capital expenditures of approximately $90 million to $95 million, representing 5% to 6% of consolidated net revenue » Consolidated non-GAAP adjusted EBITDA margin in the range of 32 to 35% » Stock-based compensation approximating $29 million to $31 million » Adjusted fully distributed net income and earnings per share calculations to reflect an effective tax rate of 26% » Amortization of purchased intangible assets of approximately $54 million » Guidance does not contemplate any material acquisitions *As of February 5, 2019. 15Fiscal 2019 annual guidance footnotes and key assumptions (for year ending June 30, 2019)* Guidance Footnotes: * The company does not meaningfully reconcile guidance for non-GAAP adjusted EBITDA and non-GAAP adjusted fully distributed earnings per share to net income attributable to stockholders or earnings per share attributable to stockholders because the company cannot provide guidance for more significant reconciling items between net income attributable to stockholders and adjusted EBITDA and between earnings per share attributable to stockholders and non-GAAP adjusted fully distributed earnings per share without unreasonable effort. This is due to two primary reasons: • Reasonable guidance cannot be provided for reconciling the adjustment of redeemable limited partners’ capital to redemption amount – historically the largest adjustment in the reconciliation from non-GAAP to GAAP amounts – due to the fact that the increase or decrease in this item is based on the change in the number of Class B common units outstanding and change in stock price between quarters, which the company cannot predict, control or reasonably estimate. • Reasonable guidance cannot be provided for earnings per share attributable to stockholders because the ongoing quarterly member-owner exchange of Class B common units and corresponding Class B common stock into shares of Class A common stock impacts the number of shares of Class A common stock outstanding each quarter, which the company cannot predict, control or reasonably estimate. Member owners have the right, but not the obligation, to exchange class B common units on a quarterly basis, and the company has the discretion to settle any exchanged units for Class A common stock, cash, or a combination thereof, neither of which can be predicted, controlled or reasonably estimated at this time. Key Assumptions*: Supply Chain Services assumptions: » Net administrative fees revenue growth of low to mid-single digits » Products revenue, which was estimated to grow 7% to 11% under the previous revenue recognition standard, is now expected to reflect 0% to 4% percent year-over-year growth. This entirely results from the impact of the new standard, which caused an estimated $50 million gross-to-net revenue reduction. » Continued high GPO retention rates Performance Services assumptions: » Continued demand for integrated offerings of cloud-based subscription and licensed products, consulting and collaboratives » Continued high SaaS institutional renewal rates Other assumptions: » Non-GAAP free cash flow expected to exceed 50% of non-GAAP adjusted EBITDA » Capital expenditures of approximately $90 million to $95 million, representing 5% to 6% of consolidated net revenue » Consolidated non-GAAP adjusted EBITDA margin in the range of 32 to 35% » Stock-based compensation approximating $29 million to $31 million » Adjusted fully distributed net income and earnings per share calculations to reflect an effective tax rate of 26% » Amortization of purchased intangible assets of approximately $54 million » Guidance does not contemplate any material acquisitions *As of February 5, 2019. 15
Member owner Class B exchange update On January 31, 2019, approximately 3.7 million Class B units were exchanged for Class A common shares on 1- for-1 basis; equal number of Class B common shares retired. Next quarterly exchange will occur on April 30, 2019. 16Member owner Class B exchange update On January 31, 2019, approximately 3.7 million Class B units were exchanged for Class A common shares on 1- for-1 basis; equal number of Class B common shares retired. Next quarterly exchange will occur on April 30, 2019. 16

QuestionsQuestions

AppendixAppendix
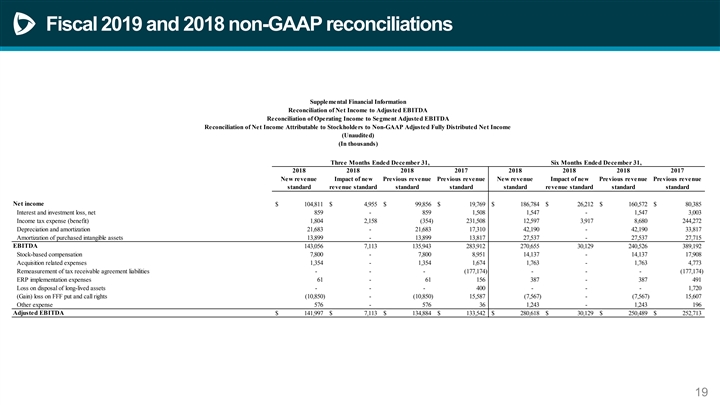
Fiscal 2019 and 2018 non-GAAP reconciliations Supplemental Financial Information Reconciliation of Net Income to Adjusted EBITDA Reconciliation of Operating Income to Segment Adjusted EBITDA Reconciliation of Net Income Attributable to Stockholders to Non-GAAP Adjusted Fully Distributed Net Income (Unaudited) (In thousands) Three Months Ended December 31, Six Months Ended December 31, 2018 2018 2018 2017 2018 2018 2018 2017 New revenue Impact of new Previous revenue Previous revenue New revenue Impact of new Previous revenue Previous revenue standard revenue standard standard standard standard revenue standard standard standard Net income $ 104,811 $ 4,955 $ 99,856 $ 19,769 $ 186,784 $ 26,212 $ 160,572 $ 80,385 Interest and investment loss, net 859 - 859 1,508 1,547 - 1,547 3,003 Income tax expense (benefit) 1,804 2,158 (354) 231,508 1 2,597 3,917 8,680 244,272 Depreciation and amortization 21,683 - 2 1,683 17,310 42,190 - 4 2,190 33,817 Amortization of purchased intangible assets 13,899 - 13,899 13,817 2 7,537 - 2 7,537 27,715 EBITDA 143,056 7,113 135,943 283,912 270,655 3 0,129 240,526 389,192 Stock-based compensation 7,800 - 7,800 8,951 1 4,137 - 1 4,137 17,908 Acquisition related expenses 1,354 - 1,354 1,674 1,763 - 1,763 4,773 Remeasurement of tax receivable agreement liabilities - - - (177,174) - - - (177,174) ERP implementation expenses 61 - 61 156 387 - 387 491 Loss on disposal of long-lived assets - - - 400 - - - 1,720 (Gain) loss on FFF put and call rights (10,850) - (10,850) 1 5,587 (7,567) - (7,567) 1 5,607 Other expense 576 - 576 36 1,243 - 1,243 196 Adjusted EBITDA $ 141,997 $ 7 ,113 $ 134,884 $ 133,542 $ 280,618 $ 30,129 $ 250,489 $ 252,713 19Fiscal 2019 and 2018 non-GAAP reconciliations Supplemental Financial Information Reconciliation of Net Income to Adjusted EBITDA Reconciliation of Operating Income to Segment Adjusted EBITDA Reconciliation of Net Income Attributable to Stockholders to Non-GAAP Adjusted Fully Distributed Net Income (Unaudited) (In thousands) Three Months Ended December 31, Six Months Ended December 31, 2018 2018 2018 2017 2018 2018 2018 2017 New revenue Impact of new Previous revenue Previous revenue New revenue Impact of new Previous revenue Previous revenue standard revenue standard standard standard standard revenue standard standard standard Net income $ 104,811 $ 4,955 $ 99,856 $ 19,769 $ 186,784 $ 26,212 $ 160,572 $ 80,385 Interest and investment loss, net 859 - 859 1,508 1,547 - 1,547 3,003 Income tax expense (benefit) 1,804 2,158 (354) 231,508 1 2,597 3,917 8,680 244,272 Depreciation and amortization 21,683 - 2 1,683 17,310 42,190 - 4 2,190 33,817 Amortization of purchased intangible assets 13,899 - 13,899 13,817 2 7,537 - 2 7,537 27,715 EBITDA 143,056 7,113 135,943 283,912 270,655 3 0,129 240,526 389,192 Stock-based compensation 7,800 - 7,800 8,951 1 4,137 - 1 4,137 17,908 Acquisition related expenses 1,354 - 1,354 1,674 1,763 - 1,763 4,773 Remeasurement of tax receivable agreement liabilities - - - (177,174) - - - (177,174) ERP implementation expenses 61 - 61 156 387 - 387 491 Loss on disposal of long-lived assets - - - 400 - - - 1,720 (Gain) loss on FFF put and call rights (10,850) - (10,850) 1 5,587 (7,567) - (7,567) 1 5,607 Other expense 576 - 576 36 1,243 - 1,243 196 Adjusted EBITDA $ 141,997 $ 7 ,113 $ 134,884 $ 133,542 $ 280,618 $ 30,129 $ 250,489 $ 252,713 19
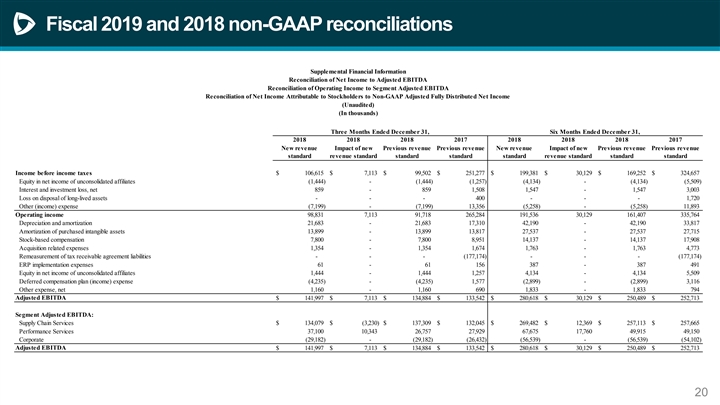
Fiscal 2019 and 2018 non-GAAP reconciliations Supplemental Financial Information Reconciliation of Net Income to Adjusted EBITDA Reconciliation of Operating Income to Segment Adjusted EBITDA Reconciliation of Net Income Attributable to Stockholders to Non-GAAP Adjusted Fully Distributed Net Income (Unaudited) (In thousands) Three Months Ended December 31, Six Months Ended December 31, 2018 2018 2018 2017 2018 2018 2018 2017 New revenue Impact of new Previous revenue Previous revenue New revenue Impact of new Previous revenue Previous revenue standard revenue standard standard standard standard revenue standard standard standard Income before income taxes $ 106,615 $ 7 ,113 $ 99,502 $ 251,277 $ 199,381 $ 30,129 $ 169,252 $ 324,657 Equity in net income of unconsolidated affiliates (1,444) - (1,444) (1,257) (4,134) - (4,134) (5,509) Interest and investment loss, net 859 - 859 1,508 1,547 - 1,547 3,003 Loss on disposal of long-lived assets - - - 400 - - - 1,720 Other (income) expense (7,199) - (7,199) 13,356 (5,258) - (5,258) 11,893 Operating income 98,831 7,113 91,718 265,284 191,536 30,129 161,407 335,764 Depreciation and amortization 2 1,683 - 21,683 1 7,310 4 2,190 - 42,190 3 3,817 Amortization of purchased intangible assets 13,899 - 1 3,899 1 3,817 2 7,537 - 27,537 2 7,715 Stock-based compensation 7,800 - 7,800 8,951 14,137 - 14,137 17,908 Acquisition related expenses 1,354 - 1,354 1,674 1,763 - 1,763 4,773 Remeasurement of tax receivable agreement liabilities - - - (177,174) - - - (177,174) ERP implementation expenses 61 - 61 156 387 - 387 491 Equity in net income of unconsolidated affiliates 1,444 - 1,444 1,257 4,134 - 4,134 5,509 Deferred compensation plan (income) expense (4,235) - (4,235) 1,577 (2,899) - (2,899) 3,116 Other expense, net 1,160 - 1,160 690 1,833 - 1,833 794 Adjusted EBITDA $ 141,997 $ 7,113 $ 134,884 $ 133,542 $ 280,618 $ 30,129 $ 250,489 $ 252,713 Segment Adjusted EBITDA: Supply Chain Services $ 134,079 $ (3,230) $ 137,309 $ 132,045 $ 269,482 $ 12,369 $ 257,113 $ 257,665 Performance Services 37,100 10,343 26,757 27,929 67,675 17,760 49,915 49,150 Corporate (29,182) - (29,182) (26,432) (56,539) - (56,539) (54,102) Adjusted EBITDA $ 141,997 $ 7,113 $ 134,884 $ 133,542 $ 280,618 $ 30,129 $ 250,489 $ 252,713 20Fiscal 2019 and 2018 non-GAAP reconciliations Supplemental Financial Information Reconciliation of Net Income to Adjusted EBITDA Reconciliation of Operating Income to Segment Adjusted EBITDA Reconciliation of Net Income Attributable to Stockholders to Non-GAAP Adjusted Fully Distributed Net Income (Unaudited) (In thousands) Three Months Ended December 31, Six Months Ended December 31, 2018 2018 2018 2017 2018 2018 2018 2017 New revenue Impact of new Previous revenue Previous revenue New revenue Impact of new Previous revenue Previous revenue standard revenue standard standard standard standard revenue standard standard standard Income before income taxes $ 106,615 $ 7 ,113 $ 99,502 $ 251,277 $ 199,381 $ 30,129 $ 169,252 $ 324,657 Equity in net income of unconsolidated affiliates (1,444) - (1,444) (1,257) (4,134) - (4,134) (5,509) Interest and investment loss, net 859 - 859 1,508 1,547 - 1,547 3,003 Loss on disposal of long-lived assets - - - 400 - - - 1,720 Other (income) expense (7,199) - (7,199) 13,356 (5,258) - (5,258) 11,893 Operating income 98,831 7,113 91,718 265,284 191,536 30,129 161,407 335,764 Depreciation and amortization 2 1,683 - 21,683 1 7,310 4 2,190 - 42,190 3 3,817 Amortization of purchased intangible assets 13,899 - 1 3,899 1 3,817 2 7,537 - 27,537 2 7,715 Stock-based compensation 7,800 - 7,800 8,951 14,137 - 14,137 17,908 Acquisition related expenses 1,354 - 1,354 1,674 1,763 - 1,763 4,773 Remeasurement of tax receivable agreement liabilities - - - (177,174) - - - (177,174) ERP implementation expenses 61 - 61 156 387 - 387 491 Equity in net income of unconsolidated affiliates 1,444 - 1,444 1,257 4,134 - 4,134 5,509 Deferred compensation plan (income) expense (4,235) - (4,235) 1,577 (2,899) - (2,899) 3,116 Other expense, net 1,160 - 1,160 690 1,833 - 1,833 794 Adjusted EBITDA $ 141,997 $ 7,113 $ 134,884 $ 133,542 $ 280,618 $ 30,129 $ 250,489 $ 252,713 Segment Adjusted EBITDA: Supply Chain Services $ 134,079 $ (3,230) $ 137,309 $ 132,045 $ 269,482 $ 12,369 $ 257,113 $ 257,665 Performance Services 37,100 10,343 26,757 27,929 67,675 17,760 49,915 49,150 Corporate (29,182) - (29,182) (26,432) (56,539) - (56,539) (54,102) Adjusted EBITDA $ 141,997 $ 7,113 $ 134,884 $ 133,542 $ 280,618 $ 30,129 $ 250,489 $ 252,713 20
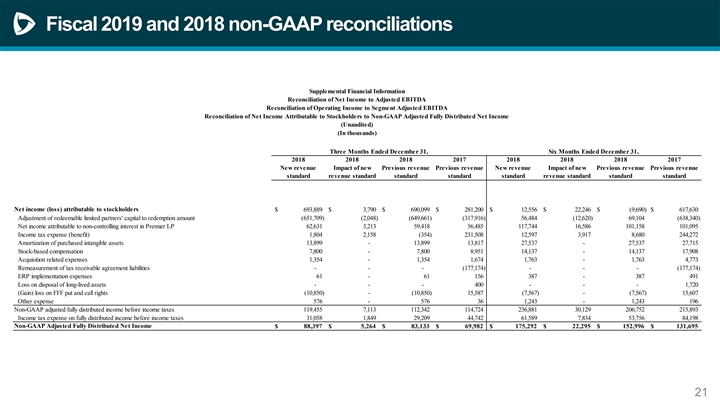
Fiscal 2019 and 2018 non-GAAP reconciliations Supplemental Financial Information Reconciliation of Net Income to Adjusted EBITDA Reconciliation of Operating Income to Segment Adjusted EBITDA Reconciliation of Net Income Attributable to Stockholders to Non-GAAP Adjusted Fully Distributed Net Income (Unaudited) (In thousands) Three Months Ended December 31, Six Months Ended December 31, 2018 2018 2018 2017 2018 2018 2018 2017 New revenue Impact of new Previous revenue Previous revenue New revenue Impact of new Previous revenue Previous revenue standard revenue standard standard standard standard revenue standard standard standard Net income (loss) attributable to stockholders $ 693,889 $ 3 ,790 $ 690,099 $ 281,200 $ 12,556 $ 22,246 $ (9,690) $ 617,630 Adjustment of redeemable limited partners' capital to redemption amount (6 51,709) (2,048) (649,661) (3 17,916) 56,484 (12,620) 6 9,104 (638,340) Net income attributable to non-controlling interest in Premier LP 6 2,631 3,213 59,418 56,485 117,744 16,586 101,158 101,095 Income tax expense (benefit) 1,804 2,158 (3 54) 231,508 12,597 3,917 8,680 244,272 Amortization of purchased intangible assets 1 3,899 - 13,899 13,817 2 7,537 - 2 7,537 27,715 Stock-based compensation 7,800 - 7,800 8,951 14,137 - 1 4,137 1 7,908 Acquisition related expenses 1,354 - 1,354 1,674 1,763 - 1,763 4,773 Remeasurement of tax receivable agreement liabilities - - - (1 77,174) - - - (1 77,174) ERP implementation expenses 61 - 61 156 387 - 387 491 Loss on disposal of long-lived assets - - - 400 - - - 1,720 (Gain) loss on FFF put and call rights (10,850) - (10,850) 15,587 (7,567) - (7,567) 15,607 Other expense 576 - 576 36 1,243 - 1,243 196 Non-GAAP adjusted fully distributed income before income taxes 119,455 7,113 112,342 114,724 236,881 30,129 206,752 215,893 Income tax expense on fully distributed income before income taxes 31,058 1,849 29,209 44,742 6 1,589 7,834 53,756 84,198 Non-GAAP Adjusted Fully Distributed Net Income $ 88,397 $ 5,264 $ 83,133 $ 69,982 $ 175,292 $ 22,295 $ 152,996 $ 131,695 21Fiscal 2019 and 2018 non-GAAP reconciliations Supplemental Financial Information Reconciliation of Net Income to Adjusted EBITDA Reconciliation of Operating Income to Segment Adjusted EBITDA Reconciliation of Net Income Attributable to Stockholders to Non-GAAP Adjusted Fully Distributed Net Income (Unaudited) (In thousands) Three Months Ended December 31, Six Months Ended December 31, 2018 2018 2018 2017 2018 2018 2018 2017 New revenue Impact of new Previous revenue Previous revenue New revenue Impact of new Previous revenue Previous revenue standard revenue standard standard standard standard revenue standard standard standard Net income (loss) attributable to stockholders $ 693,889 $ 3 ,790 $ 690,099 $ 281,200 $ 12,556 $ 22,246 $ (9,690) $ 617,630 Adjustment of redeemable limited partners' capital to redemption amount (6 51,709) (2,048) (649,661) (3 17,916) 56,484 (12,620) 6 9,104 (638,340) Net income attributable to non-controlling interest in Premier LP 6 2,631 3,213 59,418 56,485 117,744 16,586 101,158 101,095 Income tax expense (benefit) 1,804 2,158 (3 54) 231,508 12,597 3,917 8,680 244,272 Amortization of purchased intangible assets 1 3,899 - 13,899 13,817 2 7,537 - 2 7,537 27,715 Stock-based compensation 7,800 - 7,800 8,951 14,137 - 1 4,137 1 7,908 Acquisition related expenses 1,354 - 1,354 1,674 1,763 - 1,763 4,773 Remeasurement of tax receivable agreement liabilities - - - (1 77,174) - - - (1 77,174) ERP implementation expenses 61 - 61 156 387 - 387 491 Loss on disposal of long-lived assets - - - 400 - - - 1,720 (Gain) loss on FFF put and call rights (10,850) - (10,850) 15,587 (7,567) - (7,567) 15,607 Other expense 576 - 576 36 1,243 - 1,243 196 Non-GAAP adjusted fully distributed income before income taxes 119,455 7,113 112,342 114,724 236,881 30,129 206,752 215,893 Income tax expense on fully distributed income before income taxes 31,058 1,849 29,209 44,742 6 1,589 7,834 53,756 84,198 Non-GAAP Adjusted Fully Distributed Net Income $ 88,397 $ 5,264 $ 83,133 $ 69,982 $ 175,292 $ 22,295 $ 152,996 $ 131,695 21
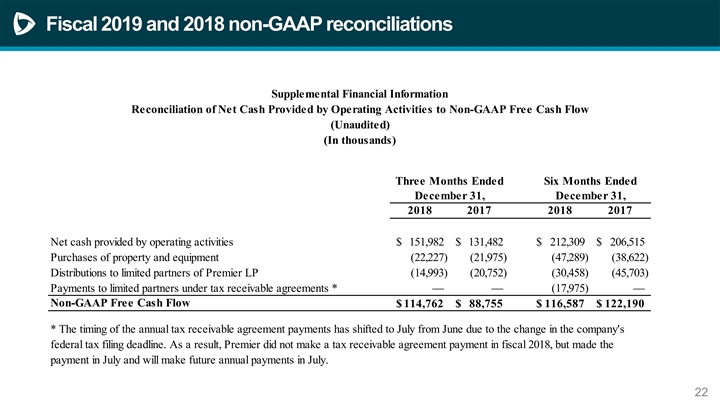
Fiscal 2019 and 2018 non-GAAP reconciliations Supplemental Financial Information Reconciliation of Net Cash Provided by Operating Activities to Non-GAAP Free Cash Flow (Unaudited) (In thousands) Three Months Ended Six Months Ended December 31, December 31, 2018 2017 2018 2017 Net cash provided by operating activities $ 151,982 $ 131,482 $ 212,309 $ 206,515 Purchases of property and equipment (22,227) (21,975) (47,289) (38,622) Distributions to limited partners of Premier LP (14,993) (20,752) (30,458) (45,703) Payments to limited partners under tax receivable agreements *—— (17,975)— Non-GAAP Free Cash Flow $ 114,762 $ 88,755 $ 116,587 $ 122,190 * The timing of the annual tax receivable agreement payments has shifted to July from June due to the change in the company's federal tax filing deadline. As a result, Premier did not make a tax receivable agreement payment in fiscal 2018, but made the payment in July and will make future annual payments in July. 22Fiscal 2019 and 2018 non-GAAP reconciliations Supplemental Financial Information Reconciliation of Net Cash Provided by Operating Activities to Non-GAAP Free Cash Flow (Unaudited) (In thousands) Three Months Ended Six Months Ended December 31, December 31, 2018 2017 2018 2017 Net cash provided by operating activities $ 151,982 $ 131,482 $ 212,309 $ 206,515 Purchases of property and equipment (22,227) (21,975) (47,289) (38,622) Distributions to limited partners of Premier LP (14,993) (20,752) (30,458) (45,703) Payments to limited partners under tax receivable agreements *—— (17,975)— Non-GAAP Free Cash Flow $ 114,762 $ 88,755 $ 116,587 $ 122,190 * The timing of the annual tax receivable agreement payments has shifted to July from June due to the change in the company's federal tax filing deadline. As a result, Premier did not make a tax receivable agreement payment in fiscal 2018, but made the payment in July and will make future annual payments in July. 22
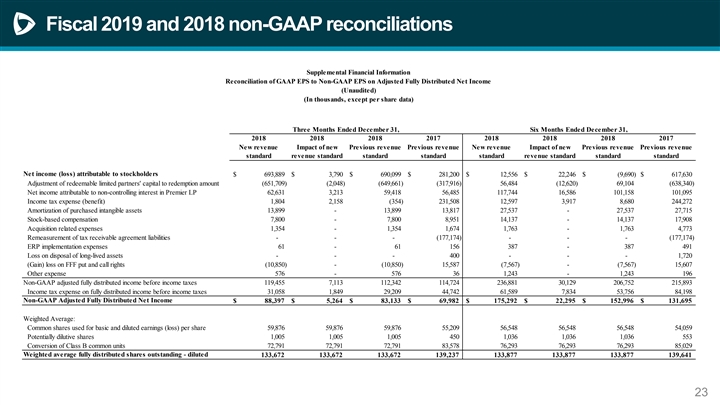
Fiscal 2019 and 2018 non-GAAP reconciliations Supplemental Financial Information Reconciliation of GAAP EPS to Non-GAAP EPS on Adjusted Fully Distributed Net Income (Unaudited) (In thousands, except per share data) Three Months Ended December 31, Six Months Ended December 31, 2018 2018 2018 2017 2018 2018 2018 2017 New revenue Impact of new Previous revenue Previous revenue New revenue Impact of new Previous revenue Previous revenue standard revenue standard standard standard standard revenue standard standard standard Net income (loss) attributable to stockholders $ 693,889 $ 3 ,790 $ 690,099 $ 281,200 $ 12,556 $ 22,246 $ (9,690) $ 617,630 Adjustment of redeemable limited partners' capital to redemption amount (6 51,709) (2,048) (6 49,661) (3 17,916) 56,484 (12,620) 6 9,104 (6 38,340) Net income attributable to non-controlling interest in Premier LP 6 2,631 3,213 59,418 5 6,485 117,744 16,586 101,158 101,095 Income tax expense (benefit) 1,804 2,158 (3 54) 231,508 12,597 3,917 8,680 244,272 Amortization of purchased intangible assets 13,899 - 13,899 1 3,817 2 7,537 - 2 7,537 2 7,715 Stock-based compensation 7,800 - 7,800 8,951 14,137 - 14,137 17,908 Acquisition related expenses 1,354 - 1,354 1,674 1,763 - 1,763 4,773 Remeasurement of tax receivable agreement liabilities - - - (177,174) - - - (177,174) ERP implementation expenses 61 - 61 156 387 - 387 491 Loss on disposal of long-lived assets - - - 400 - - - 1,720 (Gain) loss on FFF put and call rights (10,850) - (10,850) 15,587 (7,567) - (7,567) 15,607 Other expense 576 - 576 36 1,243 - 1,243 196 Non-GAAP adjusted fully distributed income before income taxes 119,455 7,113 112,342 114,724 236,881 30,129 206,752 215,893 Income tax expense on fully distributed income before income taxes 3 1,058 1,849 29,209 4 4,742 6 1,589 7,834 53,756 84,198 Non-GAAP Adjusted Fully Distributed Net Income $ 88,397 $ 5,264 $ 83,133 $ 69,982 $ 175,292 $ 22,295 $ 152,996 $ 131,695 Weighted Average: Common shares used for basic and diluted earnings (loss) per share 5 9,876 5 9,876 59,876 55,209 56,548 56,548 5 6,548 54,059 Potentially dilutive shares 1,005 1,005 1,005 450 1,036 1,036 1,036 553 Conversion of Class B common units 72,791 7 2,791 72,791 83,578 76,293 7 6,293 7 6,293 85,029 Weighted average fully distributed shares outstanding - diluted 133,672 133,672 133,672 139,237 133,877 133,877 133,877 139,641 23Fiscal 2019 and 2018 non-GAAP reconciliations Supplemental Financial Information Reconciliation of GAAP EPS to Non-GAAP EPS on Adjusted Fully Distributed Net Income (Unaudited) (In thousands, except per share data) Three Months Ended December 31, Six Months Ended December 31, 2018 2018 2018 2017 2018 2018 2018 2017 New revenue Impact of new Previous revenue Previous revenue New revenue Impact of new Previous revenue Previous revenue standard revenue standard standard standard standard revenue standard standard standard Net income (loss) attributable to stockholders $ 693,889 $ 3 ,790 $ 690,099 $ 281,200 $ 12,556 $ 22,246 $ (9,690) $ 617,630 Adjustment of redeemable limited partners' capital to redemption amount (6 51,709) (2,048) (6 49,661) (3 17,916) 56,484 (12,620) 6 9,104 (6 38,340) Net income attributable to non-controlling interest in Premier LP 6 2,631 3,213 59,418 5 6,485 117,744 16,586 101,158 101,095 Income tax expense (benefit) 1,804 2,158 (3 54) 231,508 12,597 3,917 8,680 244,272 Amortization of purchased intangible assets 13,899 - 13,899 1 3,817 2 7,537 - 2 7,537 2 7,715 Stock-based compensation 7,800 - 7,800 8,951 14,137 - 14,137 17,908 Acquisition related expenses 1,354 - 1,354 1,674 1,763 - 1,763 4,773 Remeasurement of tax receivable agreement liabilities - - - (177,174) - - - (177,174) ERP implementation expenses 61 - 61 156 387 - 387 491 Loss on disposal of long-lived assets - - - 400 - - - 1,720 (Gain) loss on FFF put and call rights (10,850) - (10,850) 15,587 (7,567) - (7,567) 15,607 Other expense 576 - 576 36 1,243 - 1,243 196 Non-GAAP adjusted fully distributed income before income taxes 119,455 7,113 112,342 114,724 236,881 30,129 206,752 215,893 Income tax expense on fully distributed income before income taxes 3 1,058 1,849 29,209 4 4,742 6 1,589 7,834 53,756 84,198 Non-GAAP Adjusted Fully Distributed Net Income $ 88,397 $ 5,264 $ 83,133 $ 69,982 $ 175,292 $ 22,295 $ 152,996 $ 131,695 Weighted Average: Common shares used for basic and diluted earnings (loss) per share 5 9,876 5 9,876 59,876 55,209 56,548 56,548 5 6,548 54,059 Potentially dilutive shares 1,005 1,005 1,005 450 1,036 1,036 1,036 553 Conversion of Class B common units 72,791 7 2,791 72,791 83,578 76,293 7 6,293 7 6,293 85,029 Weighted average fully distributed shares outstanding - diluted 133,672 133,672 133,672 139,237 133,877 133,877 133,877 139,641 23
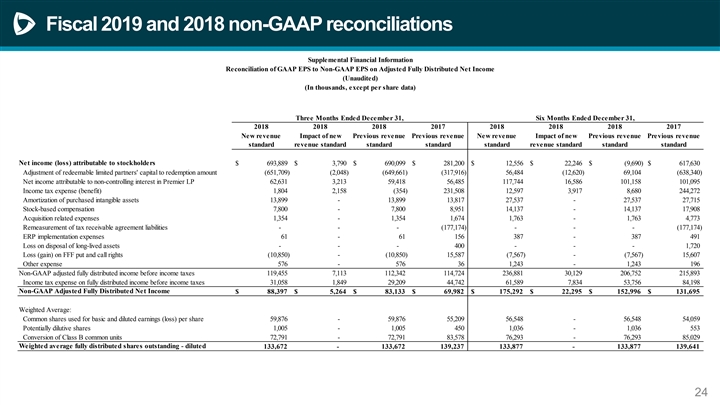
Fiscal 2019 and 2018 non-GAAP reconciliations Supplemental Financial Information Reconciliation of GAAP EPS to Non-GAAP EPS on Adjusted Fully Distributed Net Income (Unaudited) (In thousands, except per share data) Three Months Ended December 31, Six Months Ended December 31, 2018 2018 2018 2017 2018 2018 2018 2017 New revenue Impact of new Previous revenue Previous revenue New revenue Impact of new Previous revenue Previous revenue standard revenue standard standard standard standard revenue standard standard standard Net income (loss) attributable to stockholders $ 693,889 $ 3 ,790 $ 690,099 $ 281,200 $ 12,556 $ 22,246 $ (9,690) $ 617,630 Adjustment of redeemable limited partners' capital to redemption amount (6 51,709) (2,048) (649,661) (317,916) 5 6,484 (12,620) 6 9,104 (6 38,340) Net income attributable to non-controlling interest in Premier LP 6 2,631 3,213 5 9,418 56,485 117,744 16,586 101,158 101,095 Income tax expense (benefit) 1,804 2,158 (354) 231,508 12,597 3,917 8,680 244,272 Amortization of purchased intangible assets 13,899 - 13,899 13,817 2 7,537 - 27,537 27,715 Stock-based compensation 7,800 - 7,800 8,951 14,137 - 14,137 1 7,908 Acquisition related expenses 1,354 - 1,354 1,674 1,763 - 1,763 4,773 Remeasurement of tax receivable agreement liabilities - - - (177,174) - - - (177,174) ERP implementation expenses 61 - 61 156 387 - 387 491 Loss on disposal of long-lived assets - - - 400 - - - 1,720 Loss (gain) on FFF put and call rights (10,850) - (10,850) 15,587 (7,567) - (7,567) 15,607 Other expense 576 - 576 36 1,243 - 1,243 196 Non-GAAP adjusted fully distributed income before income taxes 119,455 7,113 112,342 114,724 236,881 30,129 206,752 215,893 Income tax expense on fully distributed income before income taxes 3 1,058 1,849 29,209 4 4,742 6 1,589 7,834 53,756 84,198 Non-GAAP Adjusted Fully Distributed Net Income $ 88,397 $ 5,264 $ 83,133 $ 69,982 $ 175,292 $ 22,295 $ 152,996 $ 131,695 Weighted Average: Common shares used for basic and diluted earnings (loss) per share 59,876 - 5 9,876 5 5,209 56,548 - 5 6,548 54,059 Potentially dilutive shares 1,005 - 1,005 450 1,036 - 1,036 553 Conversion of Class B common units 7 2,791 - 7 2,791 83,578 7 6,293 - 76,293 85,029 Weighted average fully distributed shares outstanding - diluted 133,672 - 133,672 139,237 133,877 - 133,877 139,641 24Fiscal 2019 and 2018 non-GAAP reconciliations Supplemental Financial Information Reconciliation of GAAP EPS to Non-GAAP EPS on Adjusted Fully Distributed Net Income (Unaudited) (In thousands, except per share data) Three Months Ended December 31, Six Months Ended December 31, 2018 2018 2018 2017 2018 2018 2018 2017 New revenue Impact of new Previous revenue Previous revenue New revenue Impact of new Previous revenue Previous revenue standard revenue standard standard standard standard revenue standard standard standard Net income (loss) attributable to stockholders $ 693,889 $ 3 ,790 $ 690,099 $ 281,200 $ 12,556 $ 22,246 $ (9,690) $ 617,630 Adjustment of redeemable limited partners' capital to redemption amount (6 51,709) (2,048) (649,661) (317,916) 5 6,484 (12,620) 6 9,104 (6 38,340) Net income attributable to non-controlling interest in Premier LP 6 2,631 3,213 5 9,418 56,485 117,744 16,586 101,158 101,095 Income tax expense (benefit) 1,804 2,158 (354) 231,508 12,597 3,917 8,680 244,272 Amortization of purchased intangible assets 13,899 - 13,899 13,817 2 7,537 - 27,537 27,715 Stock-based compensation 7,800 - 7,800 8,951 14,137 - 14,137 1 7,908 Acquisition related expenses 1,354 - 1,354 1,674 1,763 - 1,763 4,773 Remeasurement of tax receivable agreement liabilities - - - (177,174) - - - (177,174) ERP implementation expenses 61 - 61 156 387 - 387 491 Loss on disposal of long-lived assets - - - 400 - - - 1,720 Loss (gain) on FFF put and call rights (10,850) - (10,850) 15,587 (7,567) - (7,567) 15,607 Other expense 576 - 576 36 1,243 - 1,243 196 Non-GAAP adjusted fully distributed income before income taxes 119,455 7,113 112,342 114,724 236,881 30,129 206,752 215,893 Income tax expense on fully distributed income before income taxes 3 1,058 1,849 29,209 4 4,742 6 1,589 7,834 53,756 84,198 Non-GAAP Adjusted Fully Distributed Net Income $ 88,397 $ 5,264 $ 83,133 $ 69,982 $ 175,292 $ 22,295 $ 152,996 $ 131,695 Weighted Average: Common shares used for basic and diluted earnings (loss) per share 59,876 - 5 9,876 5 5,209 56,548 - 5 6,548 54,059 Potentially dilutive shares 1,005 - 1,005 450 1,036 - 1,036 553 Conversion of Class B common units 7 2,791 - 7 2,791 83,578 7 6,293 - 76,293 85,029 Weighted average fully distributed shares outstanding - diluted 133,672 - 133,672 139,237 133,877 - 133,877 139,641 24
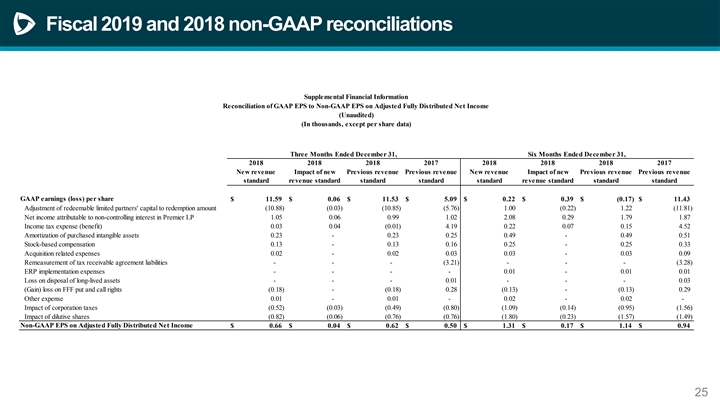
Fiscal 2019 and 2018 non-GAAP reconciliations Supplemental Financial Information Reconciliation of GAAP EPS to Non-GAAP EPS on Adjusted Fully Distributed Net Income (Unaudited) (In thousands, except per share data) Three Months Ended December 31, Six Months Ended December 31, 2018 2018 2018 2017 2018 2018 2018 2017 New revenue Impact of new Previous revenue Previous revenue New revenue Impact of new Previous revenue Previous revenue standard revenue standard standard standard standard revenue standard standard standard GAAP earnings (loss) per share $ 11.59 $ 0.06 $ 11.53 $ 5.09 $ 0.22 $ 0.39 $ (0.17) $ 11.43 Adjustment of redeemable limited partners' capital to redemption amount (10.88) (0 .03) (10.85) (5 .76) 1.00 (0 .22) 1.22 (11.81) Net income attributable to non-controlling interest in Premier LP 1.05 0.06 0.99 1.02 2.08 0.29 1.79 1.87 Income tax expense (benefit) 0.03 0.04 (0 .01) 4.19 0.22 0.07 0.15 4.52 Amortization of purchased intangible assets 0.23 - 0.23 0.25 0.49 - 0.49 0.51 Stock-based compensation 0.13 - 0.13 0.16 0.25 - 0.25 0.33 Acquisition related expenses 0.02 - 0.02 0.03 0.03 - 0.03 0.09 Remeasurement of tax receivable agreement liabilities - - - (3 .21) - - - (3.28) ERP implementation expenses - - - - 0.01 - 0.01 0.01 Loss on disposal of long-lived assets - - - 0.01 - - - 0.03 (Gain) loss on FFF put and call rights (0 .18) - (0 .18) 0.28 (0.13) - (0 .13) 0.29 Other expense 0.01 - 0.01 - 0.02 - 0.02 - Impact of corporation taxes (0.52) (0.03) (0 .49) (0 .80) (1 .09) (0 .14) (0.95) (1 .56) Impact of dilutive shares (0.82) (0 .06) (0 .76) (0 .76) (1.80) (0 .23) (1 .57) (1 .49) Non-GAAP EPS on Adjusted Fully Distributed Net Income $ 0.66 $ 0.04 $ 0.62 $ 0.50 $ 1.31 $ 0.17 $ 1.14 $ 0.94 25Fiscal 2019 and 2018 non-GAAP reconciliations Supplemental Financial Information Reconciliation of GAAP EPS to Non-GAAP EPS on Adjusted Fully Distributed Net Income (Unaudited) (In thousands, except per share data) Three Months Ended December 31, Six Months Ended December 31, 2018 2018 2018 2017 2018 2018 2018 2017 New revenue Impact of new Previous revenue Previous revenue New revenue Impact of new Previous revenue Previous revenue standard revenue standard standard standard standard revenue standard standard standard GAAP earnings (loss) per share $ 11.59 $ 0.06 $ 11.53 $ 5.09 $ 0.22 $ 0.39 $ (0.17) $ 11.43 Adjustment of redeemable limited partners' capital to redemption amount (10.88) (0 .03) (10.85) (5 .76) 1.00 (0 .22) 1.22 (11.81) Net income attributable to non-controlling interest in Premier LP 1.05 0.06 0.99 1.02 2.08 0.29 1.79 1.87 Income tax expense (benefit) 0.03 0.04 (0 .01) 4.19 0.22 0.07 0.15 4.52 Amortization of purchased intangible assets 0.23 - 0.23 0.25 0.49 - 0.49 0.51 Stock-based compensation 0.13 - 0.13 0.16 0.25 - 0.25 0.33 Acquisition related expenses 0.02 - 0.02 0.03 0.03 - 0.03 0.09 Remeasurement of tax receivable agreement liabilities - - - (3 .21) - - - (3.28) ERP implementation expenses - - - - 0.01 - 0.01 0.01 Loss on disposal of long-lived assets - - - 0.01 - - - 0.03 (Gain) loss on FFF put and call rights (0 .18) - (0 .18) 0.28 (0.13) - (0 .13) 0.29 Other expense 0.01 - 0.01 - 0.02 - 0.02 - Impact of corporation taxes (0.52) (0.03) (0 .49) (0 .80) (1 .09) (0 .14) (0.95) (1 .56) Impact of dilutive shares (0.82) (0 .06) (0 .76) (0 .76) (1.80) (0 .23) (1 .57) (1 .49) Non-GAAP EPS on Adjusted Fully Distributed Net Income $ 0.66 $ 0.04 $ 0.62 $ 0.50 $ 1.31 $ 0.17 $ 1.14 $ 0.94 25