
Fourth-Quarter Fiscal 2019 Financial Results and Update August 20, 2019 Exhibit 99.3
Forward-looking statements and non-GAAP financial measures Forward-looking statements – Statements made in this presentation that are not statements of historical or current facts, such as those related to the current market environment and uncertainties, expected financial performance, non-GAAP free cash flow generation, the impact of the new revenue recognition standards, share repurchases, if any, under our current and future stock repurchase program, the success of our incremental investments in growth opportunities, the financial and strategic impact of our decision to exit the specialty pharmacy business and the statements related to fiscal 2020 outlook and guidance and the assumptions underlying such guidance, are “forward-looking statements” within the meaning of the Private Securities Litigation Reform Act of 1995. Forward-looking statements may involve known and unknown risks, uncertainties and other factors that may cause the actual results, performance or achievements of Premier to be materially different from historical results or from any future results or projections expressed or implied by such forward-looking statements. Accordingly, readers should not place undue reliance on any forward-looking statements. In addition to statements that explicitly describe such risks and uncertainties, readers are urged to consider statements in the conditional or future tenses or that include terms such as “believes,” “belief,” “expects,” “estimates,” “intends,” “anticipates” or “plans” to be uncertain and forward-looking. Forward-looking statements may include comments as to Premier’s beliefs and expectations as to future events and trends affecting its business and are necessarily subject to uncertainties, many of which are outside Premier’s control. More information on potential factors that could affect Premier’s financial results is included from time to time in the “Cautionary Note Regarding Forward-Looking Statements,” “Risk Factors” and “Management’s Discussion and Analysis of Financial Condition and Results of Operations” sections of Premier’s periodic and current filings with the SEC, including those discussed under the “Risk Factors” and “Cautionary Note Regarding Forward-Looking Statements” section of Premier’s Form 10-K for the year ended June 30, 2019, expected to be filed with the SEC shortly after the date of this presentation, and also made available on Premier’s website at investors.premierinc.com. Forward-looking statements speak only as of the date they are made, and Premier undertakes no obligation to publicly update or revise any forward-looking statements, whether as a result of new information or future events that occur after that date, or otherwise. Non-GAAP financial measures – This presentation and accompanying webcast includes certain “non-GAAP financial measures” as defined in Regulation G under the Securities Exchange Act of 1934. Schedules are attached that reconcile the non-GAAP financial measures included in this presentation to the most directly comparable financial measures calculated and presented in accordance with Generally Accepted Accounting Principles in the United States. You should carefully read Premier’s periodic and current filings with the SEC for definitions and further explanation and disclosure regarding our use of non-GAAP financial measures and such filings should be read in conjunction with this presentation.

Susan DeVore Chief Executive Officer Premier, Inc. Overview and Business Update
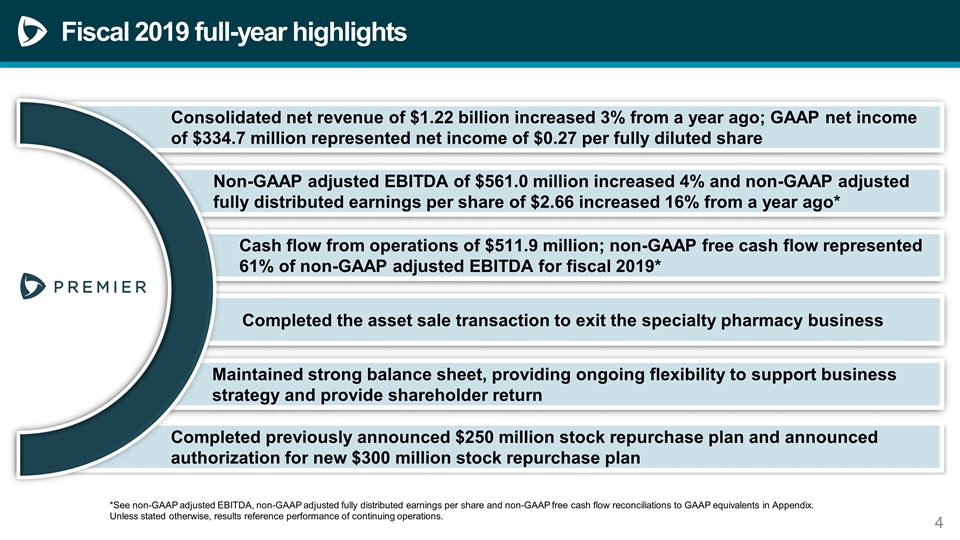
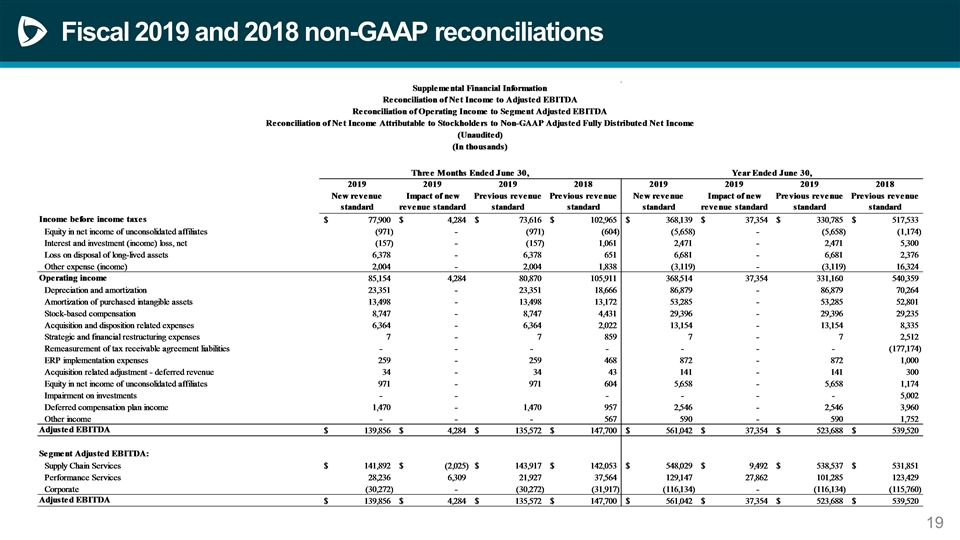
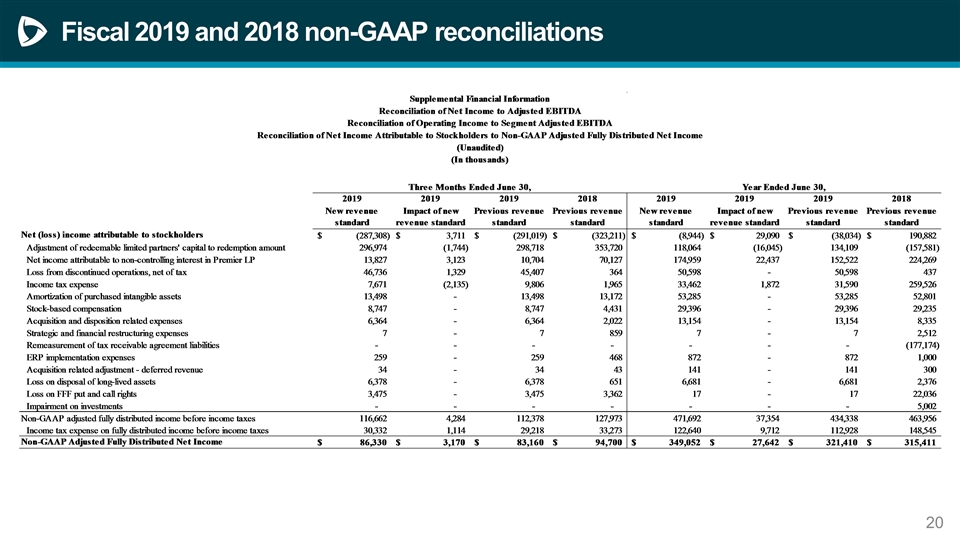
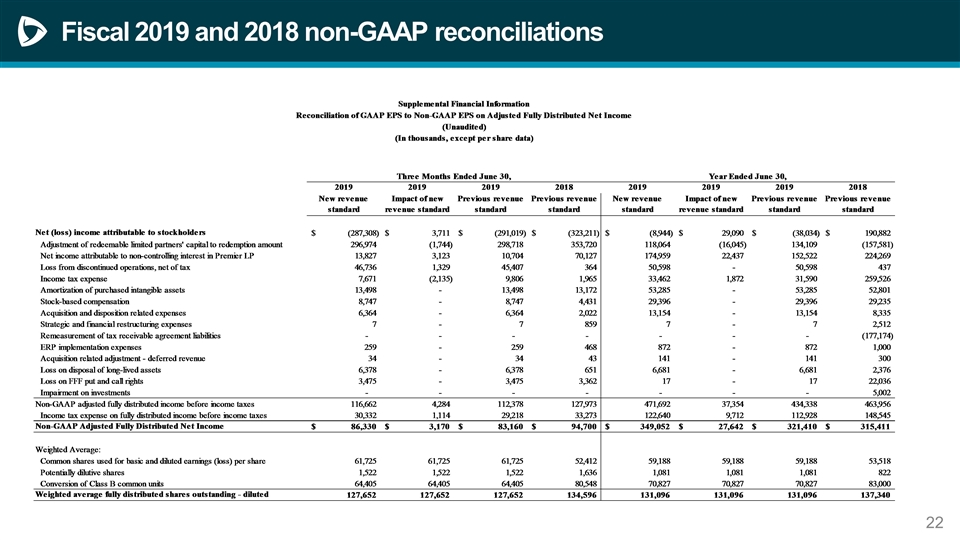
*See non-GAAP Adjusted EBITDA, non-GAAP Adjusted Fully Distributed Earnings Per Share and non-GAAP Free Cash Flow reconciliations to GAAP equivalents in Appendix. Cash flow from operations of $511.9 million; non-GAAP free cash flow represented 61% of non-GAAP adjusted EBITDA for fiscal 2019* Non-GAAP adjusted EBITDA of $561.0 million increased 4% and non-GAAP adjusted fully distributed earnings per share of $2.66 increased 16% from a year ago* Completed the asset sale transaction to exit the specialty pharmacy business Maintained strong balance sheet, providing ongoing flexibility to support business strategy and provide shareholder return Completed previously announced $250 million stock repurchase plan and announced authorization for new $300 million stock repurchase plan Consolidated net revenue of $1.22 billion increased 3% from a year ago; GAAP net income of $334.7 million represented net income of $0.27 per fully diluted share *See non-GAAP adjusted EBITDA, non-GAAP adjusted fully distributed earnings per share and non-GAAP free cash flow reconciliations to GAAP equivalents in Appendix. Unless stated otherwise, results reference performance of continuing operations. Fiscal 2019 full-year highlights
Fiscal 2020 outlook: Modest consolidated growth Initial financial guidance ranges reflect anticipated impact of continued political and regulatory uncertainty Experiencing some ongoing challenges in Performance Services segment Uncertainty related to significant reduction or elimination of the CMS Hospital Improvement project that Premier has participated in for the last three years. Supply Chain Services segment expected to continue to deliver steady growth. Premier is focused on expanding our supply chain business and improving the growth of our enterprise analytics and performance improvement capabilities. Fiscal 2020 outlook
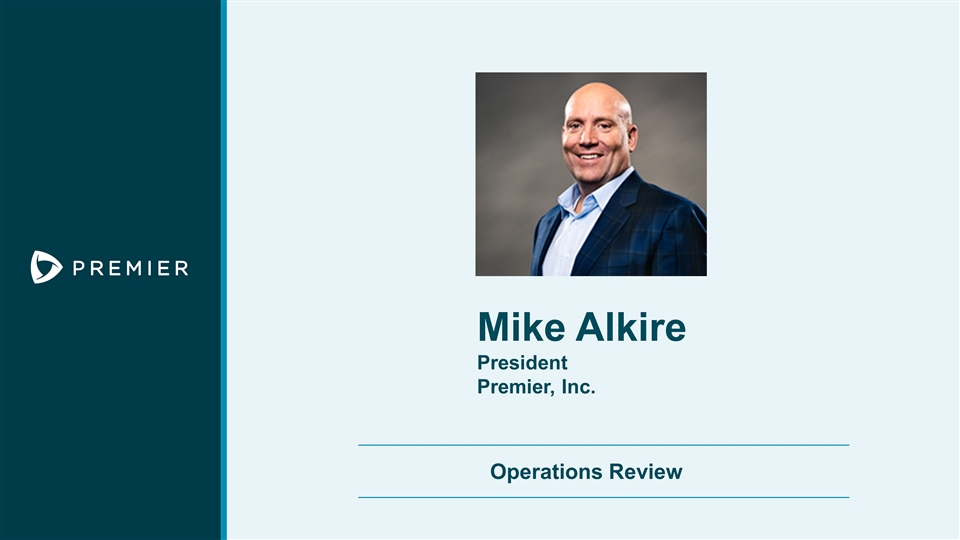
Mike Alkire President Premier, Inc. Operations Review
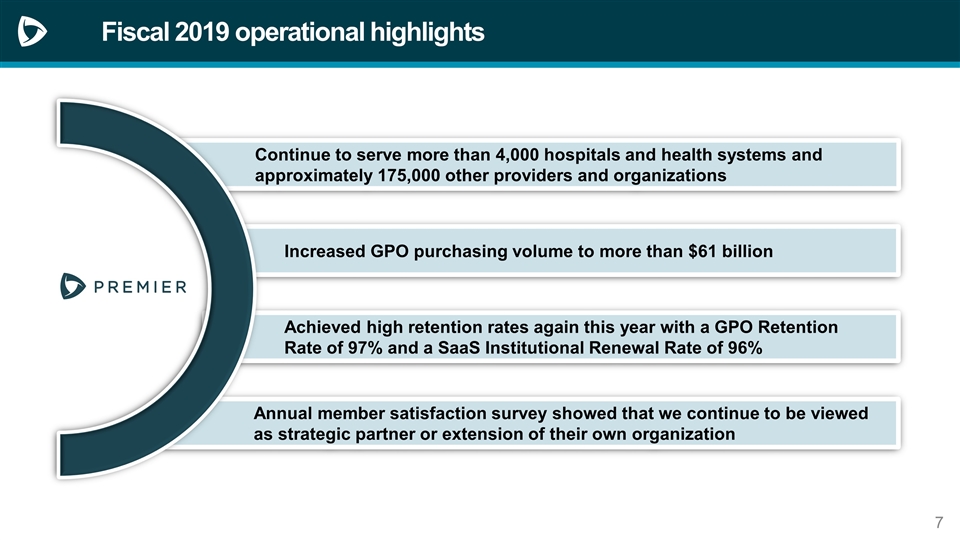
Annual member satisfaction survey showed that we continue to be viewed as strategic partner or extension of their own organization Increased GPO purchasing volume to more than $61 billion Achieved high retention rates again this year with a GPO Retention Rate of 97% and a SaaS Institutional Renewal Rate of 96% Continue to serve more than 4,000 hospitals and health systems and approximately 175,000 other providers and organizations Fiscal 2019 operational highlights
Operational initiatives High- value care network Clinical decision support technology Applied sciences research

Craig McKasson Chief Administrative and Financial Officer Premier, Inc. Financial Review
Adoption of new revenue recognition standard and discontinued operations The company adopted new revenue recognition standard ASC 606 on July 1, 2018 using the modified retrospective approach and did not restate prior periods. Accordingly, the year-over-year comparisons in this presentation compare fiscal 2019 fourth-quarter and full-year results under ASC 606 to fiscal 2018 fourth-quarter and full-year results under the previous revenue recognition standard ASC 605. On May 6, 2019, the company announced that it committed to a plan to sell certain assets of its specialty pharmacy business and to discontinue operations of, and wind down and exit from the specialty pharmacy business. On June 7, 2019, the company closed the transaction. As such, and unless stated otherwise, all results presented in the following presentation reflect those of continuing operations.
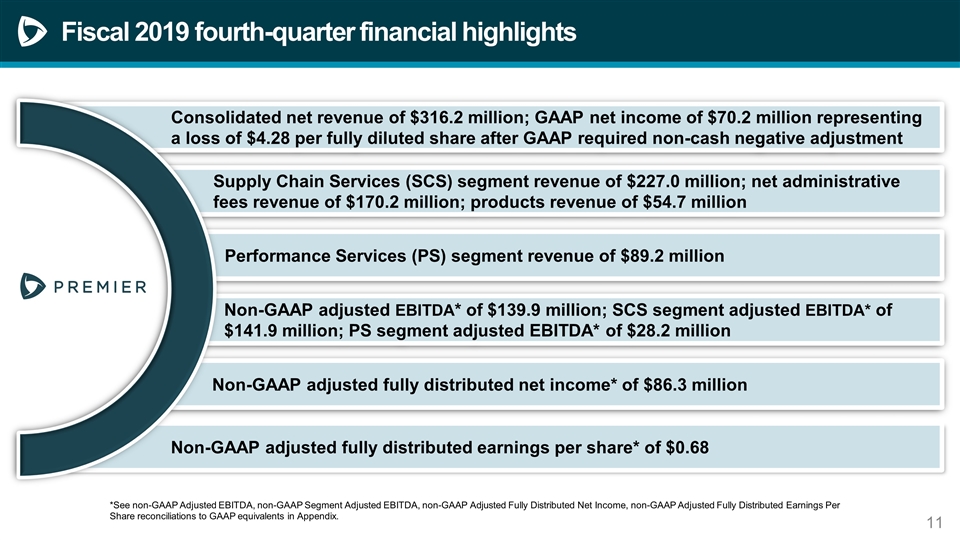
*See non-GAAP Adjusted EBITDA, non-GAAP Adjusted Fully Distributed Earnings Per Share and non-GAAP Free Cash Flow reconciliations to GAAP equivalents in Appendix. Performance Services (PS) segment revenue of $89.2 million Supply Chain Services (SCS) segment revenue of $227.0 million; net administrative fees revenue of $170.2 million; products revenue of $54.7 million Non-GAAP adjusted EBITDA* of $139.9 million; SCS segment adjusted EBITDA* of $141.9 million; PS segment adjusted EBITDA* of $28.2 million Non-GAAP adjusted fully distributed net income* of $86.3 million Non-GAAP adjusted fully distributed earnings per share* of $0.68 Consolidated net revenue of $316.2 million; GAAP net income of $70.2 million representing a loss of $4.28 per fully diluted share after GAAP required non-cash negative adjustment *See non-GAAP Adjusted EBITDA, non-GAAP Segment Adjusted EBITDA, non-GAAP Adjusted Fully Distributed Net Income, non-GAAP Adjusted Fully Distributed Earnings Per Share reconciliations to GAAP equivalents in Appendix. Fiscal 2019 fourth-quarter financial highlights

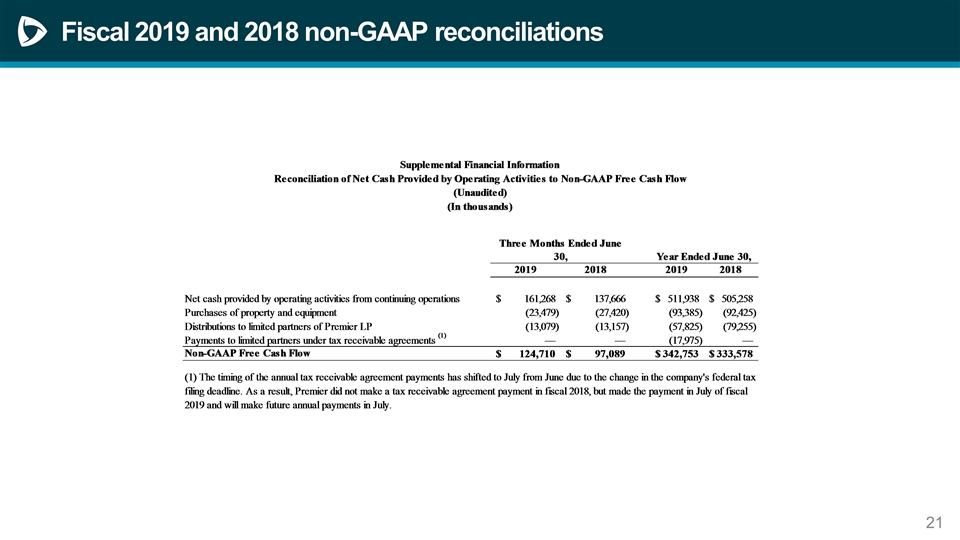
Cash flow from operations of $511.9 million and non-GAAP free cash flow* of $342.8 million for fiscal year ended June 30, 2019 Non-GAAP free cash flow approximated 61% of non-GAAP adjusted EBITDA for the fiscal year Cash and cash equivalents of $141.1 million Outstanding borrowings of $25.0 million on $1.0 billion five-year unsecured revolving credit facility; repaid outstanding balance in July 2019 Fiscal 2019 fourth-quarter cash flows and liquidity CONSIDERABLE CASH AND DEBT CAPACITY AVAILABLE AMPLE CAPITAL FLEXIBILITY FOR FUTURE ACQUISITIONS AND STOCKHOLDER RETURN *See non-GAAP free cash flow reconciliation to GAAP equivalent in Appendix.
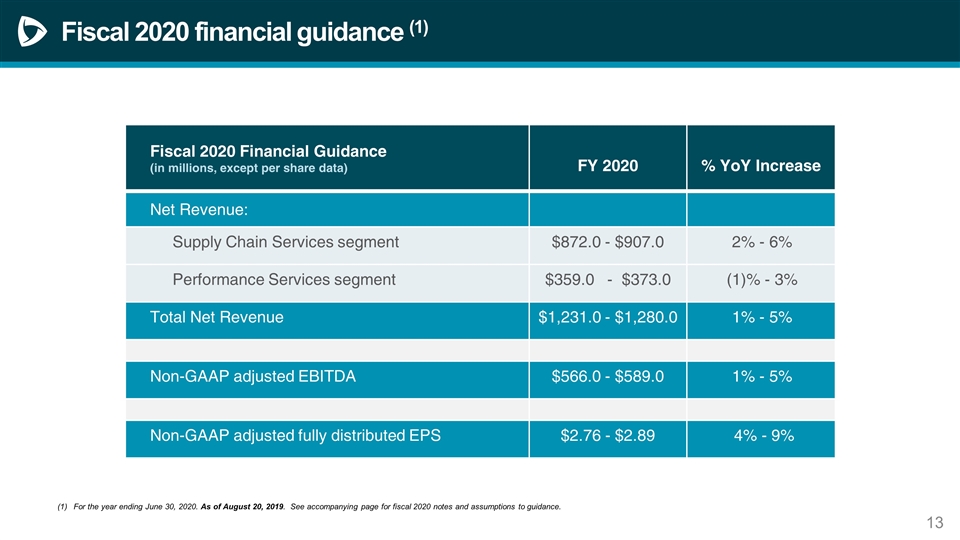
Fiscal 2020 financial guidance (1) For the year ending June 30, 2020. As of August 20, 2019. See accompanying page for fiscal 2020 notes and assumptions to guidance. Fiscal 2020 Financial Guidance (in millions, except per share data) FY 2020 % YoY Increase Net Revenue: Supply Chain Services segment $872.0 - $907.0 2% - 6% Performance Services segment $359.0 - $373.0 (1)% - 3% Total Net Revenue $1,231.0 - $1,280.0 1% - 5% Non-GAAP adjusted EBITDA $566.0 - $589.0 1% - 5% Non-GAAP adjusted fully distributed EPS $2.76 - $2.89 4% - 9%
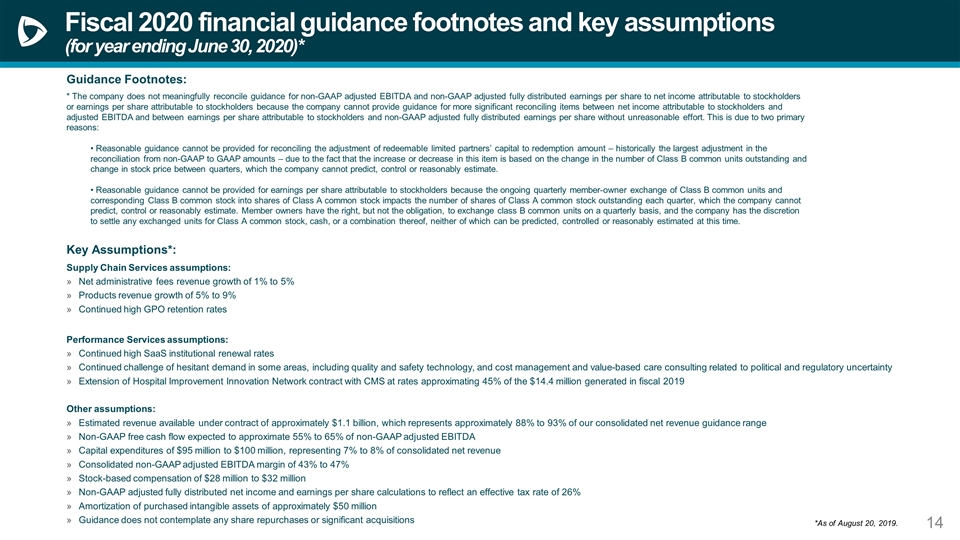
Guidance Footnotes: * The company does not meaningfully reconcile guidance for non-GAAP adjusted EBITDA and non-GAAP adjusted fully distributed earnings per share to net income attributable to stockholders or earnings per share attributable to stockholders because the company cannot provide guidance for more significant reconciling items between net income attributable to stockholders and adjusted EBITDA and between earnings per share attributable to stockholders and non-GAAP adjusted fully distributed earnings per share without unreasonable effort. This is due to two primary reasons: • Reasonable guidance cannot be provided for reconciling the adjustment of redeemable limited partners’ capital to redemption amount – historically the largest adjustment in the reconciliation from non-GAAP to GAAP amounts – due to the fact that the increase or decrease in this item is based on the change in the number of Class B common units outstanding and change in stock price between quarters, which the company cannot predict, control or reasonably estimate. • Reasonable guidance cannot be provided for earnings per share attributable to stockholders because the ongoing quarterly member-owner exchange of Class B common units and corresponding Class B common stock into shares of Class A common stock impacts the number of shares of Class A common stock outstanding each quarter, which the company cannot predict, control or reasonably estimate. Member owners have the right, but not the obligation, to exchange class B common units on a quarterly basis, and the company has the discretion to settle any exchanged units for Class A common stock, cash, or a combination thereof, neither of which can be predicted, controlled or reasonably estimated at this time. Fiscal 2020 financial guidance footnotes and key assumptions (for year ending June 30, 2020)* Key Assumptions*: Supply Chain Services assumptions: Net administrative fees revenue growth of 1% to 5% Products revenue growth of 5% to 9% Continued high GPO retention rates Performance Services assumptions: Continued high SaaS institutional renewal rates Continued challenge of hesitant demand in some areas, including quality and safety technology, and cost management and value-based care consulting related to political and regulatory uncertainty Extension of Hospital Improvement Innovation Network contract with CMS at rates approximating 45% of the $14.4 million generated in fiscal 2019 Other assumptions: Estimated revenue available under contract of approximately $1.1 billion, which represents approximately 88% to 93% of our consolidated net revenue guidance range Non-GAAP free cash flow expected to approximate 55% to 65% of non-GAAP adjusted EBITDA Capital expenditures of $95 million to $100 million, representing 7% to 8% of consolidated net revenue Consolidated non-GAAP adjusted EBITDA margin of 43% to 47% Stock-based compensation of $28 million to $32 million Non-GAAP adjusted fully distributed net income and earnings per share calculations to reflect an effective tax rate of 26% Amortization of purchased intangible assets of approximately $50 million Guidance does not contemplate any share repurchases or significant acquisitions *As of August 20, 2019.
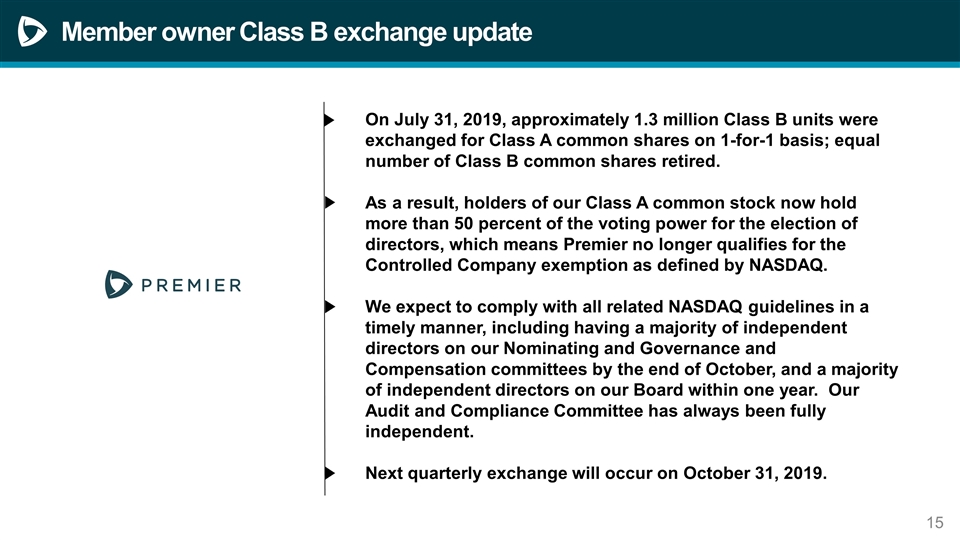
Member owner Class B exchange update On July 31, 2019, approximately 1.3 million Class B units were exchanged for Class A common shares on 1-for-1 basis; equal number of Class B common shares retired. As a result, holders of our Class A common stock now hold more than 50 percent of the voting power for the election of directors, which means Premier no longer qualifies for the Controlled Company exemption as defined by NASDAQ. We expect to comply with all related NASDAQ guidelines in a timely manner, including having a majority of independent directors on our Nominating and Governance and Compensation committees by the end of October, and a majority of independent directors on our Board within one year. Our Audit and Compliance Committee has always been fully independent. Next quarterly exchange will occur on October 31, 2019.

Questions

Appendix
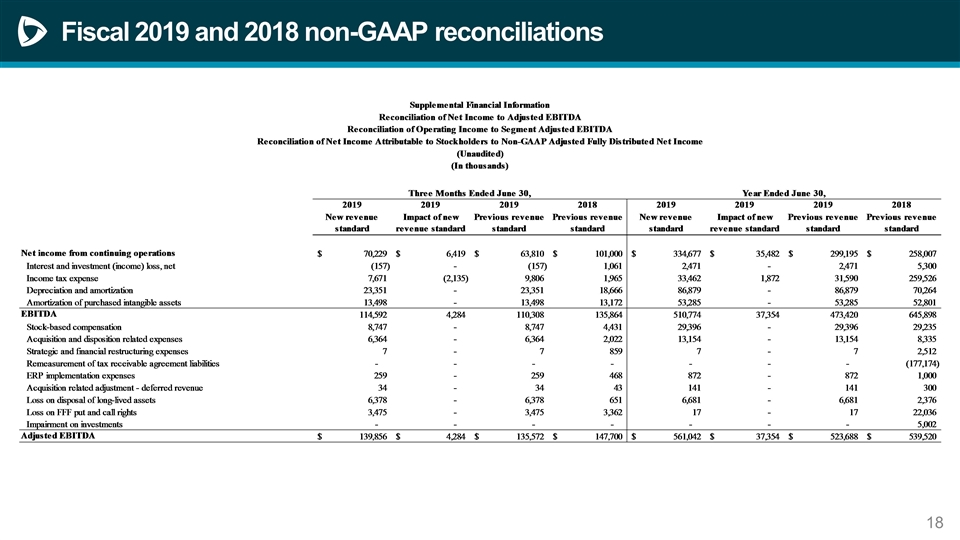
Fiscal 2019 and 2018 non-GAAP reconciliations
Fiscal 2019 and 2018 non-GAAP reconciliations
Fiscal 2019 and 2018 non-GAAP reconciliations
Fiscal 2019 and 2018 non-GAAP reconciliations
Fiscal 2019 and 2018 non-GAAP reconciliations
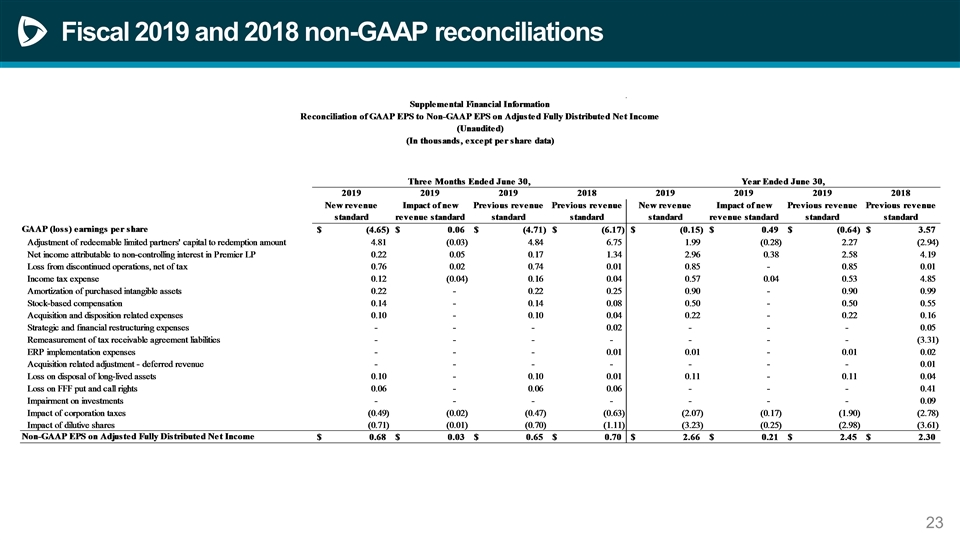
Fiscal 2019 and 2018 non-GAAP reconciliations


