
Baird 2019 Global Healthcare Conference September 4, 2019 Exhibit 99.1
Forward-looking statements and non-GAAP financial measures Forward-looking statements – Statements made in this presentation that are not statements of historical or current facts, such as those related to the current market environment and uncertainties, expected financial performance and fiscal 2020 revenue visibility, non-GAAP free cash flow generation, out ability to invest in future growth and return capital to stockholders, share repurchases, if any, under our current and future stock repurchase program, the success of our incremental investments in growth opportunities, the financial and strategic impact of our decision to exit the specialty pharmacy business and the statements related to fiscal 2020 outlook and guidance and the assumptions underlying such guidance, are “forward-looking statements” within the meaning of the Private Securities Litigation Reform Act of 1995. Forward-looking statements may involve known and unknown risks, uncertainties and other factors that may cause the actual results, performance or achievements of Premier to be materially different from historical results or from any future results or projections expressed or implied by such forward-looking statements. Accordingly, readers should not place undue reliance on any forward-looking statements. In addition to statements that explicitly describe such risks and uncertainties, readers are urged to consider statements in the conditional or future tenses or that include terms such as “believes,” “belief,” “expects,” “estimates,” “intends,” “anticipates” or “plans” to be uncertain and forward-looking. Forward-looking statements may include comments as to Premier’s beliefs and expectations as to future events and trends affecting its business and are necessarily subject to uncertainties, many of which are outside Premier’s control. More information on potential factors that could affect Premier’s financial results is included from time to time in the “Cautionary Note Regarding Forward-Looking Statements,” “Risk Factors” and “Management’s Discussion and Analysis of Financial Condition and Results of Operations” sections of Premier’s periodic and current filings with the SEC, including those discussed under the “Risk Factors” and “Cautionary Note Regarding Forward-Looking Statements” section of Premier’s Form 10-K for the year ended June 30, 2019, filed with the SEC and also made available on Premier’s website at investors.premierinc.com. Forward-looking statements speak only as of the date they are made, and Premier undertakes no obligation to publicly update or revise any forward-looking statements, whether as a result of new information or future events that occur after that date, or otherwise. Non-GAAP financial measures – This presentation and accompanying webcast includes certain “non-GAAP financial measures” as defined in Regulation G under the Securities Exchange Act of 1934. Schedules are attached that reconcile the non-GAAP financial measures included in this presentation to the most directly comparable financial measures calculated and presented in accordance with Generally Accepted Accounting Principles in the United States. You should carefully read Premier’s periodic and current filings with the SEC for definitions and further explanation and disclosure regarding our use of non-GAAP financial measures and such filings should be read in conjunction with this presentation.

Company Overview

Premier is a leading healthcare improvement company with a multi-year track record of revenue and earnings growth, a flexible balance sheet and strong cash flow generation. We believe we are well positioned to invest in future growth and return capital to stockholders. Investment profile Positioned to deliver stockholder value.
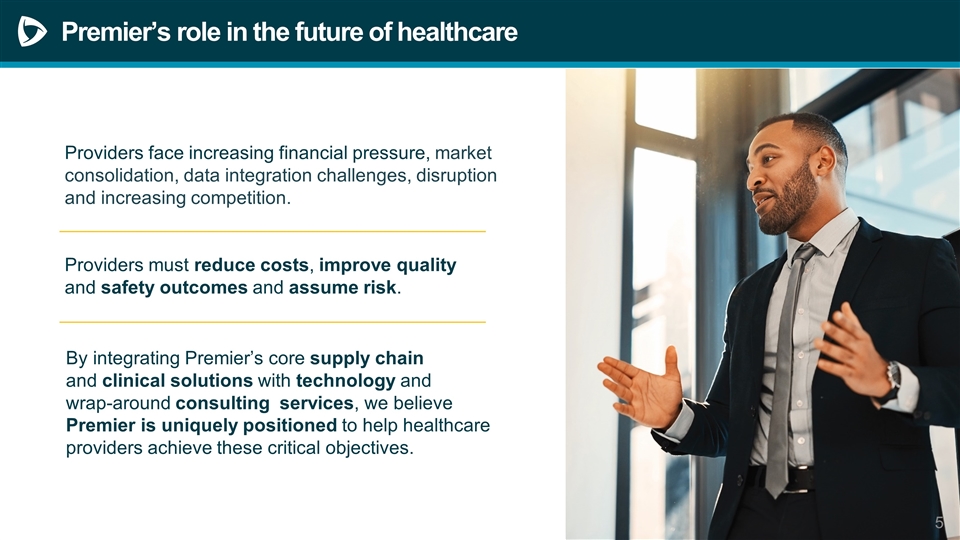
By integrating Premier’s core supply chain and clinical solutions with technology and wrap-around consulting services, we believe Premier is uniquely positioned to help healthcare providers achieve these critical objectives. Premier’s role in the future of healthcare Providers face increasing financial pressure, market consolidation, data integration challenges, disruption and increasing competition. Providers must reduce costs, improve quality and safety outcomes and assume risk.
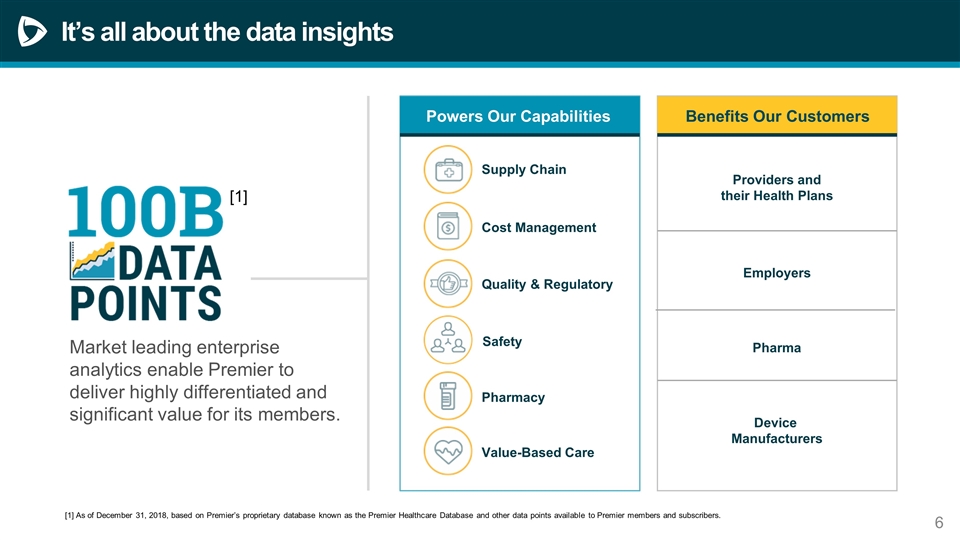
It’s all about the data insights Supply Chain Value-Based Care Quality & Regulatory Cost Management Safety Pharmacy Market leading enterprise analytics enable Premier to deliver highly differentiated and significant value for its members. [1] As of December 31, 2018, based on Premier’s proprietary database known as the Premier Healthcare Database and other data points available to Premier members and subscribers. Powers Our Capabilities Benefits Our Customers Device Manufacturers Providers and their Health Plans Employers Pharma [1]
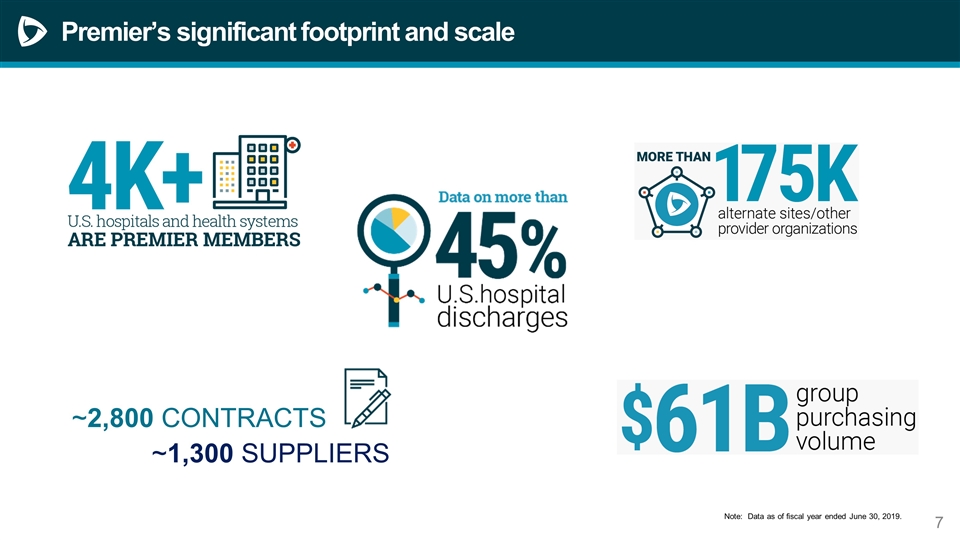
~1,300 SUPPLIERS Premier’s significant footprint and scale ~2,800 CONTRACTS Note: Data as of fiscal year ended June 30, 2019.
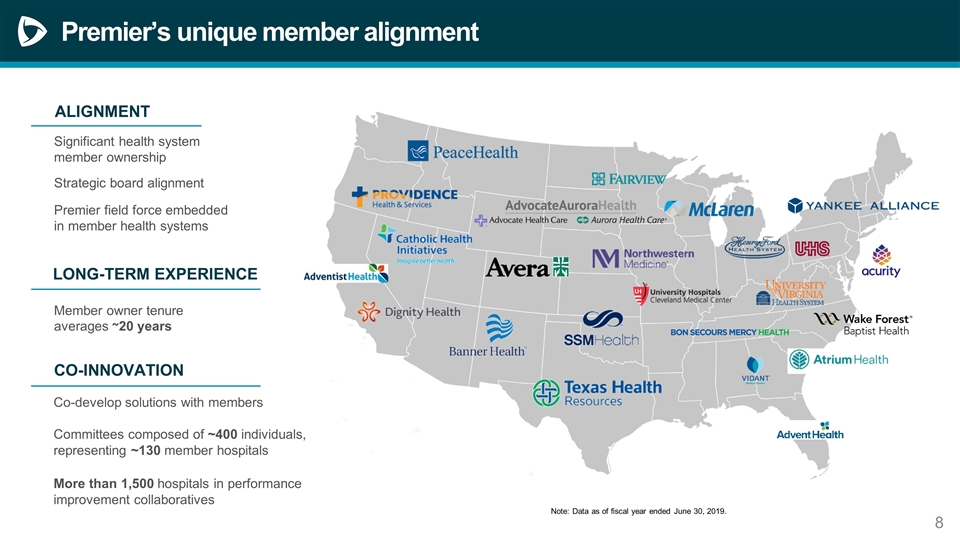
Premier’s unique member alignment Co-develop solutions with members Committees composed of ~400 individuals, representing ~130 member hospitals More than 1,500 hospitals in performance improvement collaboratives Note: Data as of fiscal year ended June 30, 2019. LONG-TERM EXPERIENCE Significant health system member ownership ALIGNMENT Strategic board alignment Premier field force embedded in member health systems LONG-TERM EXPERIENCE CO-INNOVATION Member owner tenure averages ~20 years
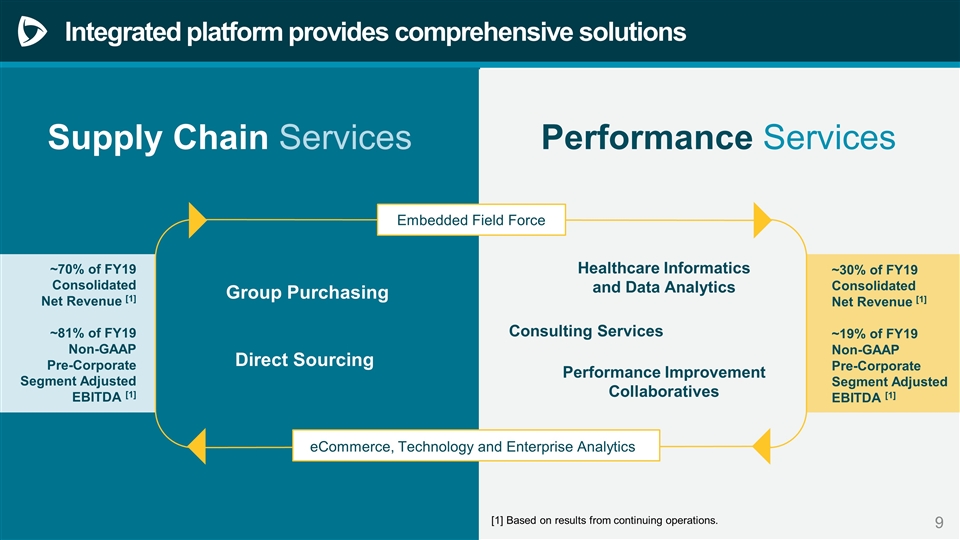
Supply Chain Services Group Purchasing Performance Services Direct Sourcing ~70% of FY19 Consolidated Net Revenue [1] ~81% of FY19 Non-GAAP Pre-Corporate Segment Adjusted EBITDA [1] ~30% of FY19 Consolidated Net Revenue [1] ~19% of FY19 Non-GAAP Pre-Corporate Segment Adjusted EBITDA [1] eCommerce, Technology and Enterprise Analytics Healthcare Informatics and Data Analytics Performance Improvement Collaboratives Consulting Services Integrated platform provides comprehensive solutions Embedded Field Force [1] Based on results from continuing operations.
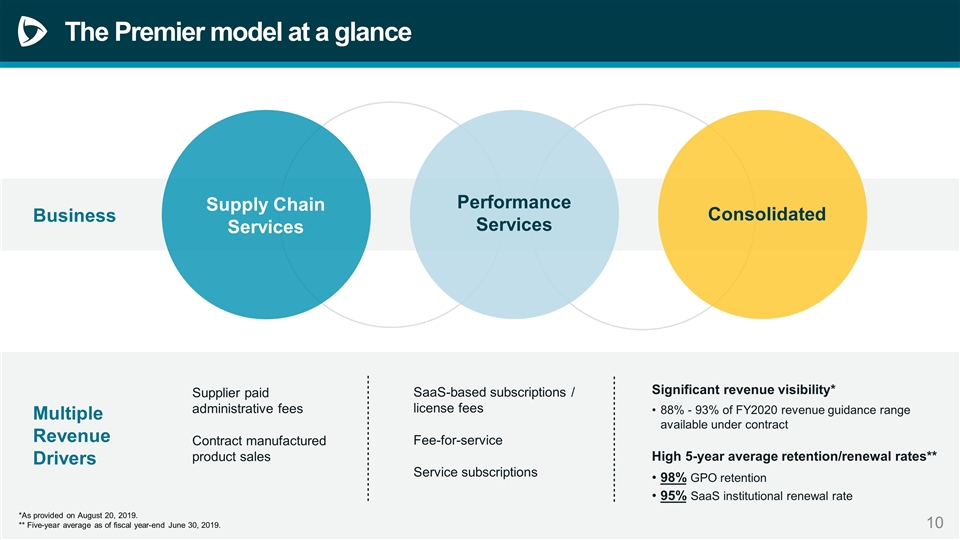
The Premier model at a glance Business Multiple Revenue Drivers Significant revenue visibility* 88% - 93% of FY2020 revenue guidance range available under contract High 5-year average retention/renewal rates** 98% GPO retention 95% SaaS institutional renewal rate SaaS-based subscriptions / license fees Fee-for-service Service subscriptions Supply Chain Services Performance Services Consolidated *As provided on August 20, 2019. ** Five-year average as of fiscal year-end June 30, 2019. Supplier paid administrative fees Contract manufactured product sales
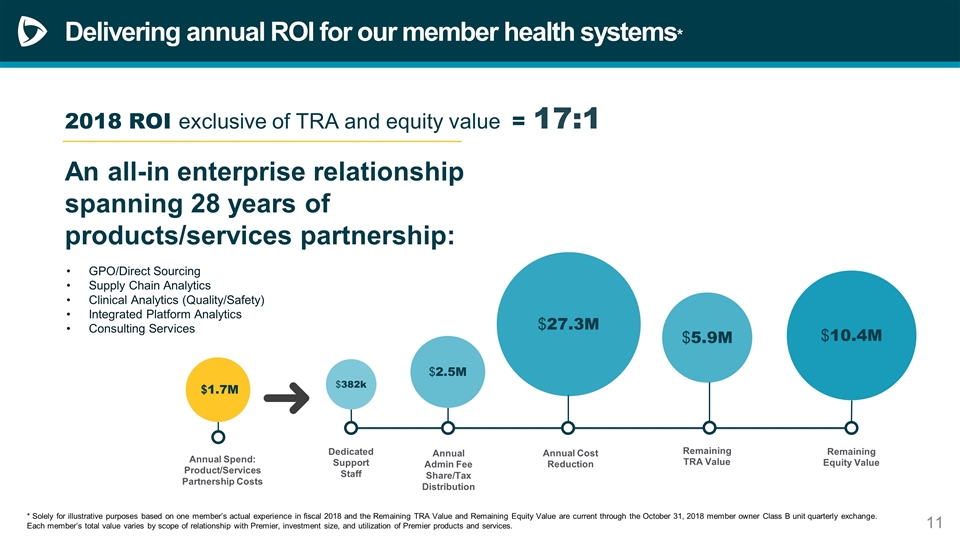
$2.5M Delivering annual ROI for our member health systems* GPO/Direct Sourcing Supply Chain Analytics Clinical Analytics (Quality/Safety) Integrated Platform Analytics Consulting Services $382k Dedicated Support Staff Annual Admin Fee Share/Tax Distribution Remaining TRA Value $10.4M Annual Cost Reduction Remaining Equity Value $1.7M Annual Spend: Product/Services Partnership Costs * Solely for illustrative purposes based on one member’s actual experience in fiscal 2018 and the Remaining TRA Value and Remaining Equity Value are current through the October 31, 2018 member owner Class B unit quarterly exchange. Each member’s total value varies by scope of relationship with Premier, investment size, and utilization of Premier products and services. 2018 ROI exclusive of TRA and equity value = 17:1 An all-in enterprise relationship spanning 28 years of products/services partnership: $27.3M $5.9M
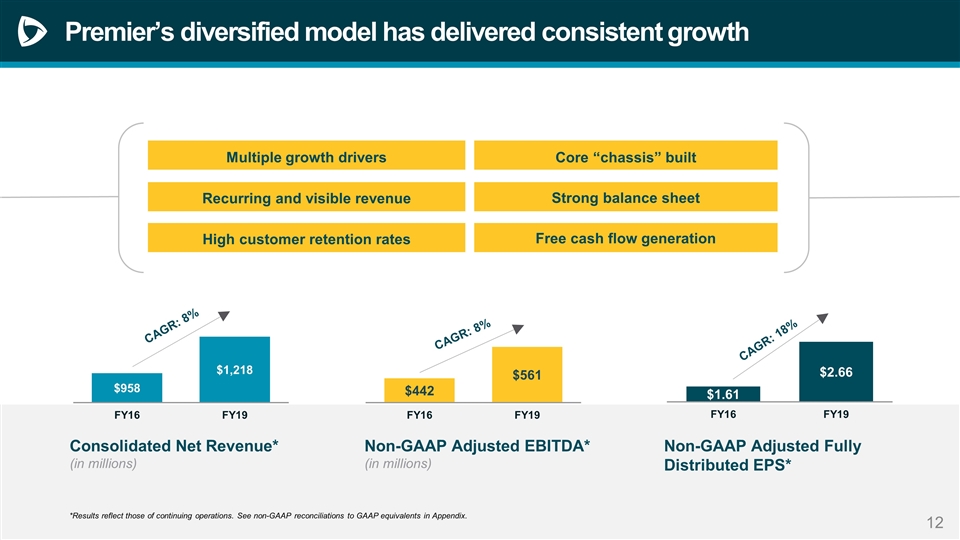
CAGR: 8% CAGR: 8% CAGR: 18% Consolidated Net Revenue* (in millions) Non-GAAP Adjusted EBITDA* (in millions) Non-GAAP Adjusted Fully Distributed EPS* *Results reflect those of continuing operations. See non-GAAP reconciliations to GAAP equivalents in Appendix. Recurring and visible revenue High customer retention rates Free cash flow generation Strong balance sheet Multiple growth drivers Core “chassis” built Premier’s diversified model has delivered consistent growth
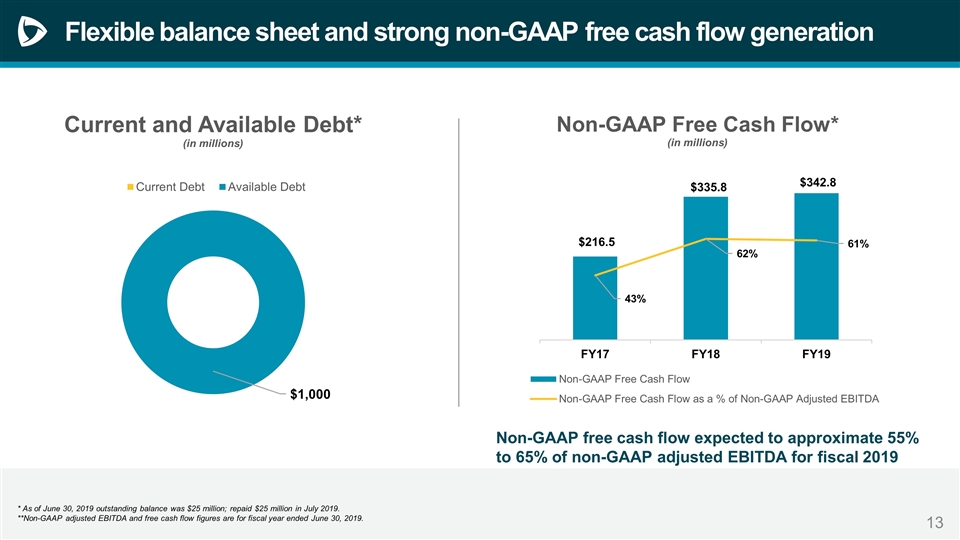
* As of June 30, 2019 outstanding balance was $25 million; repaid $25 million in July 2019. **Non-GAAP adjusted EBITDA and free cash flow figures are for fiscal year ended June 30, 2019. Flexible balance sheet and strong non-GAAP free cash flow generation * Non-GAAP free cash flow expected to approximate 55% to 65% of non-GAAP adjusted EBITDA for fiscal 2019
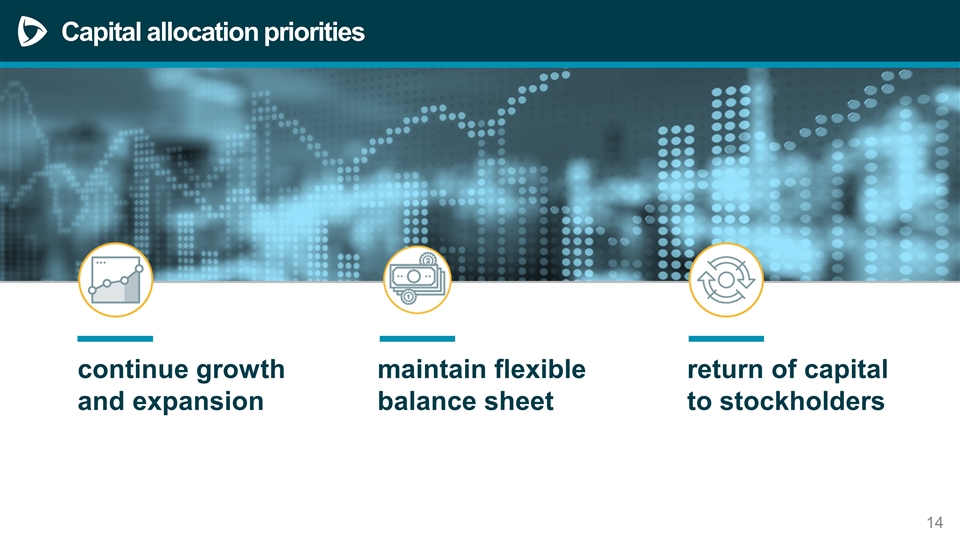
Capital allocation priorities return of capital to stockholders continue growth and expansion maintain flexible balance sheet
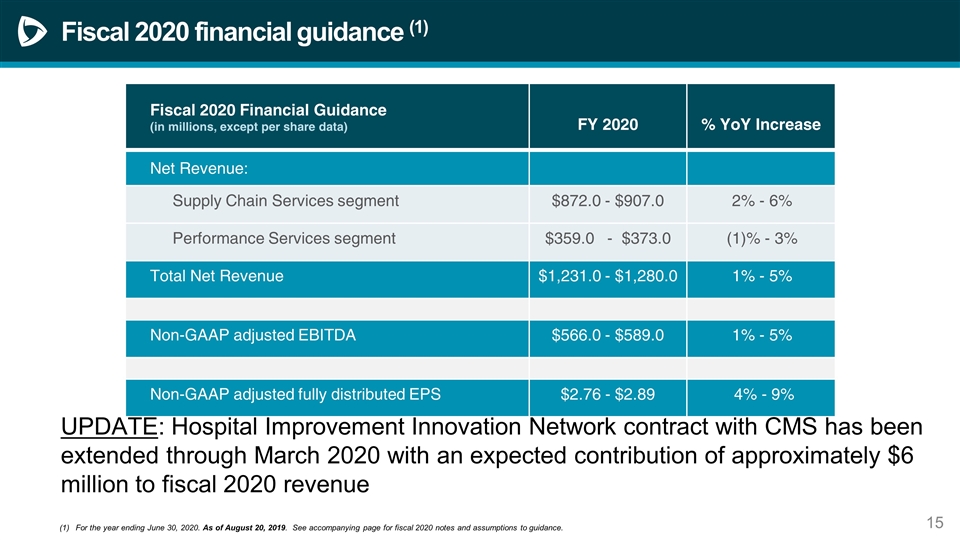
Fiscal 2020 financial guidance (1) For the year ending June 30, 2020. As of August 20, 2019. See accompanying page for fiscal 2020 notes and assumptions to guidance. Fiscal 2020 Financial Guidance (in millions, except per share data) FY 2020 % YoY Increase Net Revenue: Supply Chain Services segment $872.0 - $907.0 2% - 6% Performance Services segment $359.0 - $373.0 (1)% - 3% Total Net Revenue $1,231.0 - $1,280.0 1% - 5% Non-GAAP adjusted EBITDA $566.0 - $589.0 1% - 5% Non-GAAP adjusted fully distributed EPS $2.76 - $2.89 4% - 9% UPDATE: Hospital Improvement Innovation Network contract with CMS has been extended through March 2020 with an expected contribution of approximately $6 million to fiscal 2020 revenue
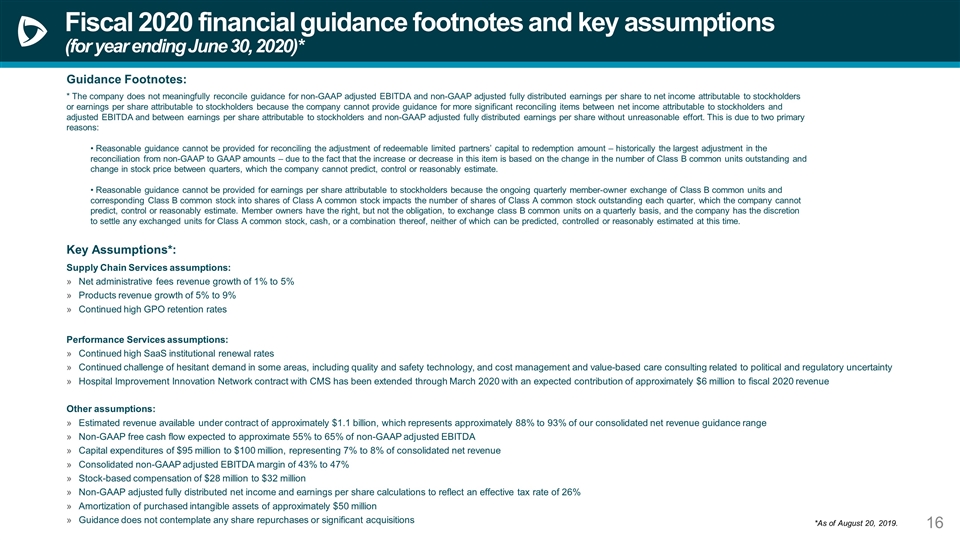
Guidance Footnotes: * The company does not meaningfully reconcile guidance for non-GAAP adjusted EBITDA and non-GAAP adjusted fully distributed earnings per share to net income attributable to stockholders or earnings per share attributable to stockholders because the company cannot provide guidance for more significant reconciling items between net income attributable to stockholders and adjusted EBITDA and between earnings per share attributable to stockholders and non-GAAP adjusted fully distributed earnings per share without unreasonable effort. This is due to two primary reasons: • Reasonable guidance cannot be provided for reconciling the adjustment of redeemable limited partners’ capital to redemption amount – historically the largest adjustment in the reconciliation from non-GAAP to GAAP amounts – due to the fact that the increase or decrease in this item is based on the change in the number of Class B common units outstanding and change in stock price between quarters, which the company cannot predict, control or reasonably estimate. • Reasonable guidance cannot be provided for earnings per share attributable to stockholders because the ongoing quarterly member-owner exchange of Class B common units and corresponding Class B common stock into shares of Class A common stock impacts the number of shares of Class A common stock outstanding each quarter, which the company cannot predict, control or reasonably estimate. Member owners have the right, but not the obligation, to exchange class B common units on a quarterly basis, and the company has the discretion to settle any exchanged units for Class A common stock, cash, or a combination thereof, neither of which can be predicted, controlled or reasonably estimated at this time. Fiscal 2020 financial guidance footnotes and key assumptions (for year ending June 30, 2020)* Key Assumptions*: Supply Chain Services assumptions: Net administrative fees revenue growth of 1% to 5% Products revenue growth of 5% to 9% Continued high GPO retention rates Performance Services assumptions: Continued high SaaS institutional renewal rates Continued challenge of hesitant demand in some areas, including quality and safety technology, and cost management and value-based care consulting related to political and regulatory uncertainty Hospital Improvement Innovation Network contract with CMS has been extended through March 2020 with an expected contribution of approximately $6 million to fiscal 2020 revenue Other assumptions: Estimated revenue available under contract of approximately $1.1 billion, which represents approximately 88% to 93% of our consolidated net revenue guidance range Non-GAAP free cash flow expected to approximate 55% to 65% of non-GAAP adjusted EBITDA Capital expenditures of $95 million to $100 million, representing 7% to 8% of consolidated net revenue Consolidated non-GAAP adjusted EBITDA margin of 43% to 47% Stock-based compensation of $28 million to $32 million Non-GAAP adjusted fully distributed net income and earnings per share calculations to reflect an effective tax rate of 26% Amortization of purchased intangible assets of approximately $50 million Guidance does not contemplate any share repurchases or significant acquisitions *As of August 20, 2019.

Final Thoughts
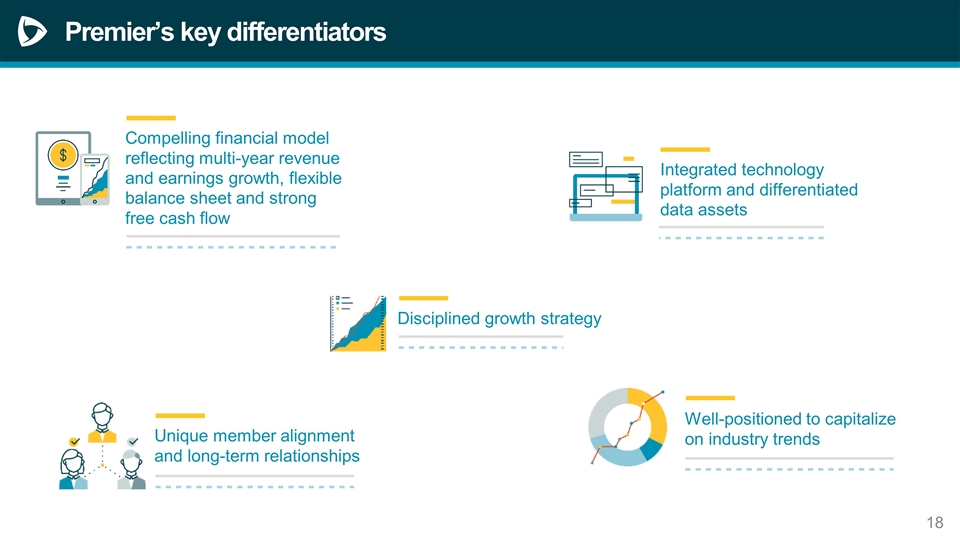
Premier’s key differentiators Compelling financial model reflecting multi-year revenue and earnings growth, flexible balance sheet and strong free cash flow Unique member alignment and long-term relationships Integrated technology platform and differentiated data assets Well-positioned to capitalize on industry trends Disciplined growth strategy

Non-GAAP Reconciliation Tables
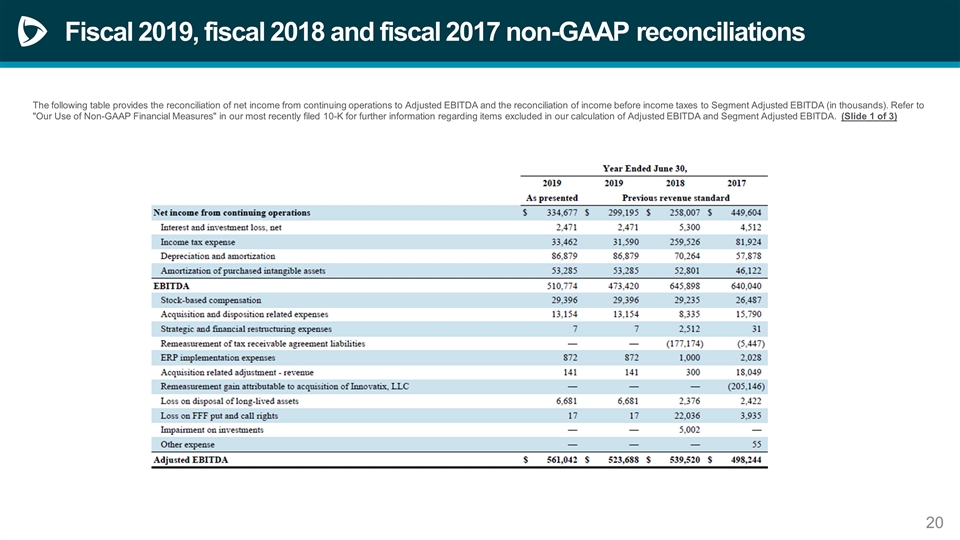
Fiscal 2019, fiscal 2018 and fiscal 2017 non-GAAP reconciliations The following table provides the reconciliation of net income from continuing operations to Adjusted EBITDA and the reconciliation of income before income taxes to Segment Adjusted EBITDA (in thousands). Refer to "Our Use of Non-GAAP Financial Measures" in our most recently filed 10-K for further information regarding items excluded in our calculation of Adjusted EBITDA and Segment Adjusted EBITDA. (Slide 1 of 3)
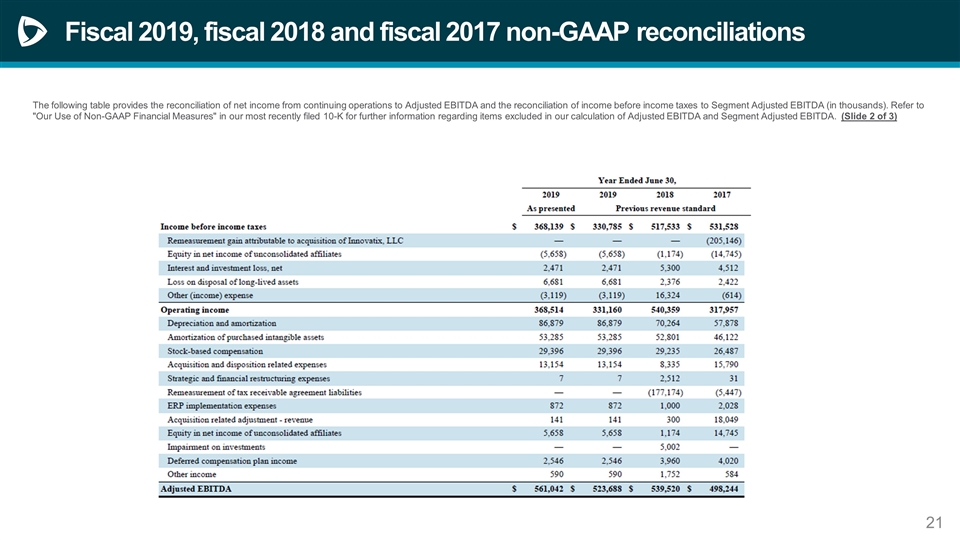
Fiscal 2019, fiscal 2018 and fiscal 2017 non-GAAP reconciliations The following table provides the reconciliation of net income from continuing operations to Adjusted EBITDA and the reconciliation of income before income taxes to Segment Adjusted EBITDA (in thousands). Refer to "Our Use of Non-GAAP Financial Measures" in our most recently filed 10-K for further information regarding items excluded in our calculation of Adjusted EBITDA and Segment Adjusted EBITDA. (Slide 2 of 3)
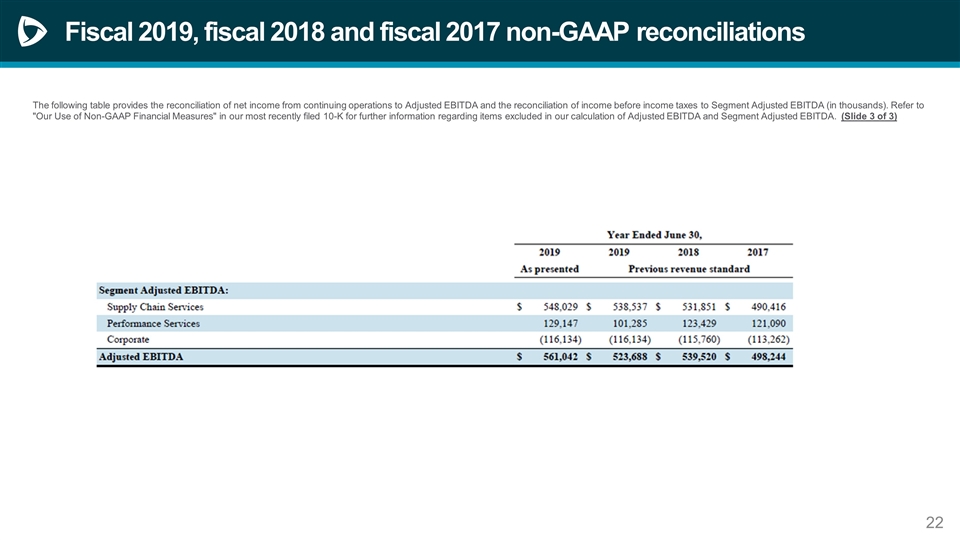
Fiscal 2019, fiscal 2018 and fiscal 2017 non-GAAP reconciliations The following table provides the reconciliation of net income from continuing operations to Adjusted EBITDA and the reconciliation of income before income taxes to Segment Adjusted EBITDA (in thousands). Refer to "Our Use of Non-GAAP Financial Measures" in our most recently filed 10-K for further information regarding items excluded in our calculation of Adjusted EBITDA and Segment Adjusted EBITDA. (Slide 3 of 3)
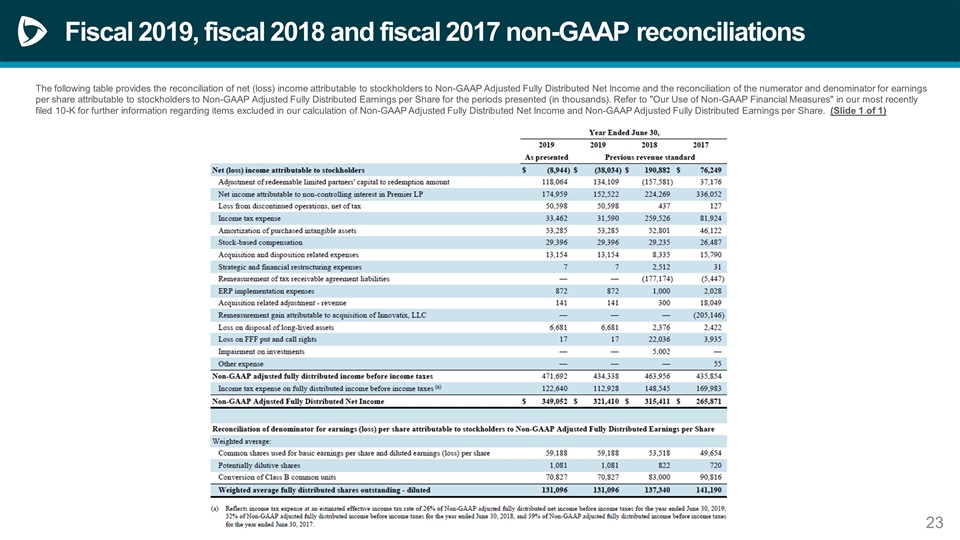
Fiscal 2019, fiscal 2018 and fiscal 2017 non-GAAP reconciliations The following table provides the reconciliation of net (loss) income attributable to stockholders to Non-GAAP Adjusted Fully Distributed Net Income and the reconciliation of the numerator and denominator for earnings per share attributable to stockholders to Non-GAAP Adjusted Fully Distributed Earnings per Share for the periods presented (in thousands). Refer to "Our Use of Non-GAAP Financial Measures" in our most recently filed 10-K for further information regarding items excluded in our calculation of Non-GAAP Adjusted Fully Distributed Net Income and Non-GAAP Adjusted Fully Distributed Earnings per Share. (Slide 1 of 1)
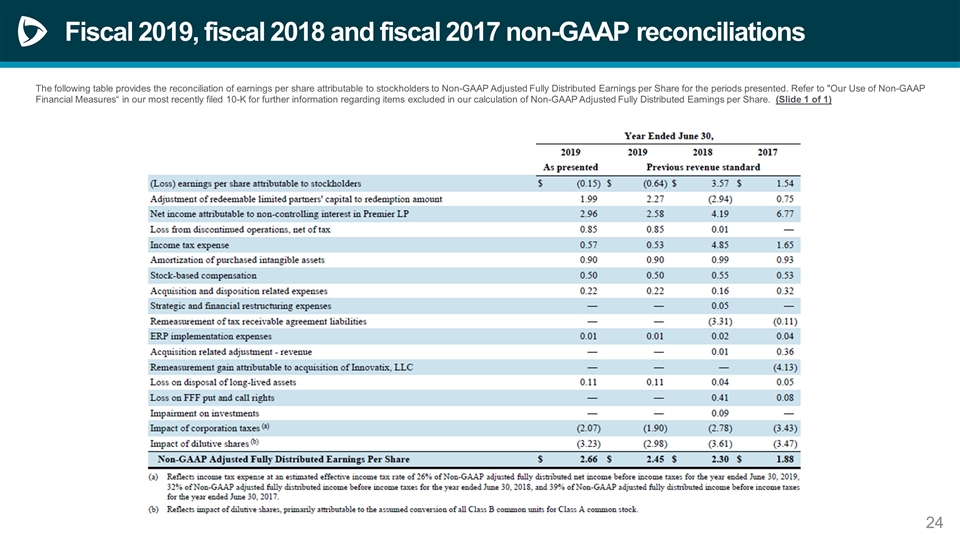
Fiscal 2019, fiscal 2018 and fiscal 2017 non-GAAP reconciliations The following table provides the reconciliation of earnings per share attributable to stockholders to Non-GAAP Adjusted Fully Distributed Earnings per Share for the periods presented. Refer to "Our Use of Non-GAAP Financial Measures“ in our most recently filed 10-K for further information regarding items excluded in our calculation of Non-GAAP Adjusted Fully Distributed Earnings per Share. (Slide 1 of 1)
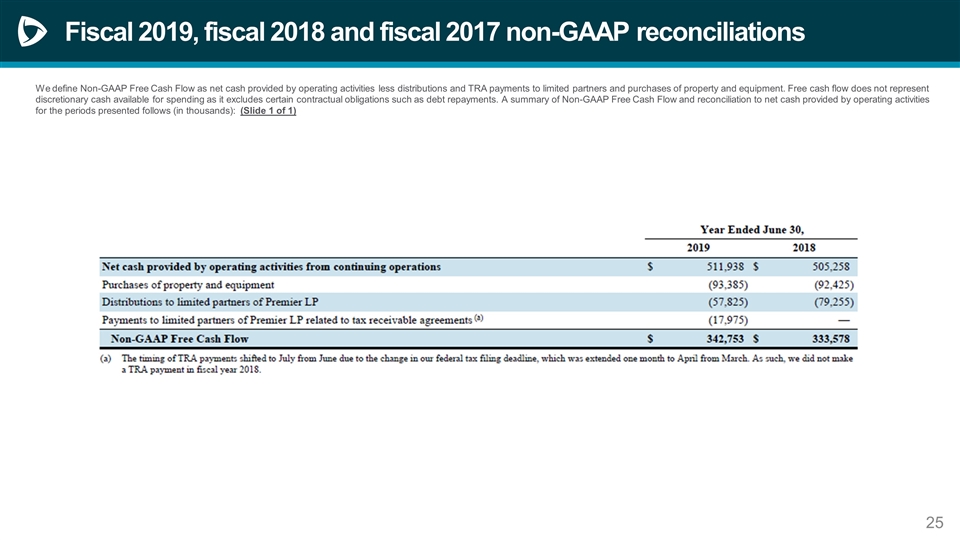
Fiscal 2019, fiscal 2018 and fiscal 2017 non-GAAP reconciliations We define Non-GAAP Free Cash Flow as net cash provided by operating activities less distributions and TRA payments to limited partners and purchases of property and equipment. Free cash flow does not represent discretionary cash available for spending as it excludes certain contractual obligations such as debt repayments. A summary of Non-GAAP Free Cash Flow and reconciliation to net cash provided by operating activities for the periods presented follows (in thousands): (Slide 1 of 1)
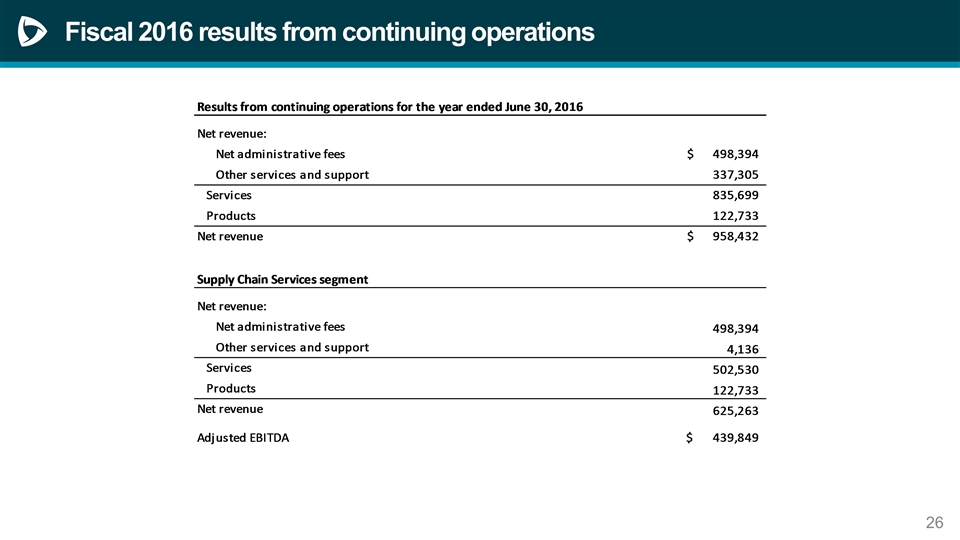
Fiscal 2016 results from continuing operations
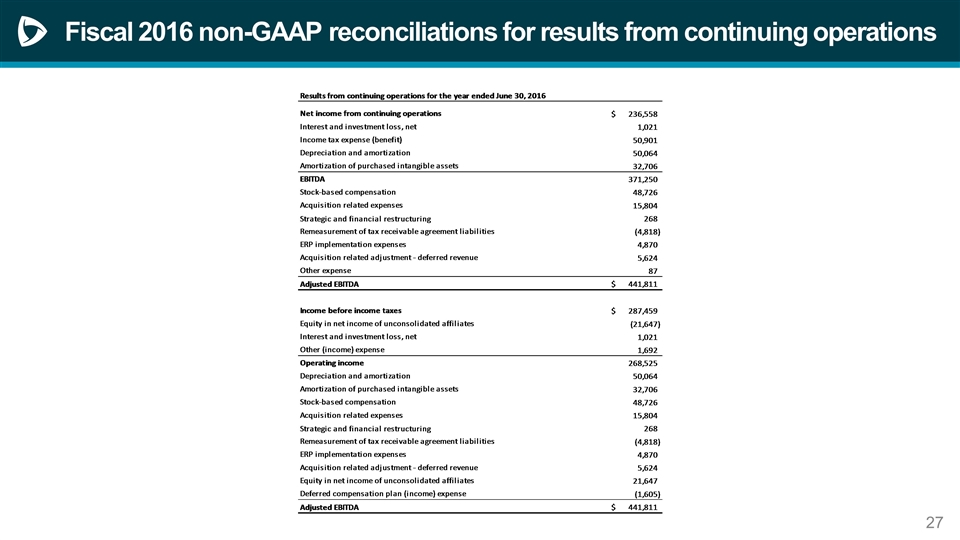
Fiscal 2016 non-GAAP reconciliations for results from continuing operations
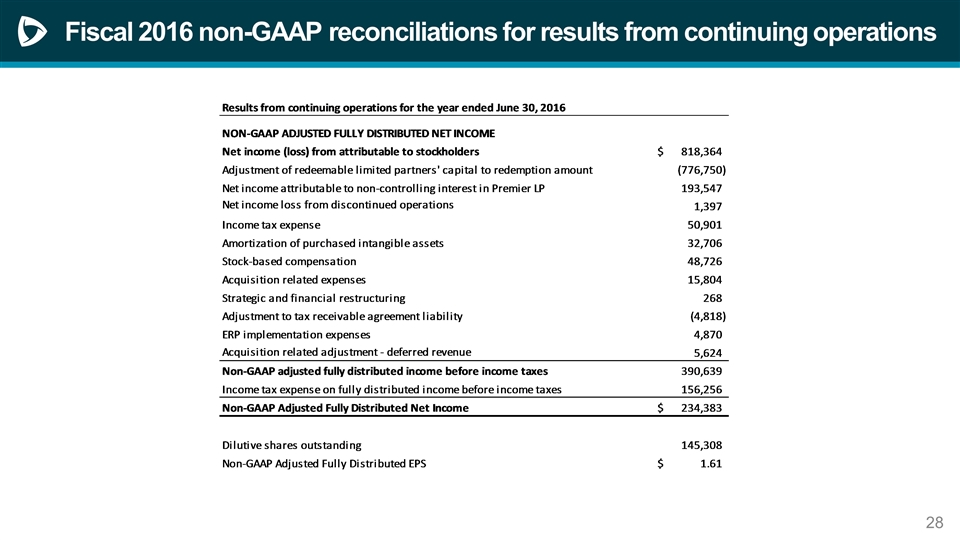
Fiscal 2016 non-GAAP reconciliations for results from continuing operations


