
Exhibit 99.3 Fiscal 2023 First-Quarter Earnings Conference Call /////// November 1, 2022 © 2022. All rights reserved. | Premier Inc. | 1
Forward-looking Statements and Non-GAAP Financial Measures Forward-looking statements– Statements made in this presentation and the accompanying webcast that are not statements of historical or current facts, such as those related to our ability to advance our long-term strategies, our ability to achieve fiscal 2023 guidance and multi-year compound annual growth targets for total net revenue, adjusted EBITDA and adjusted EPS, our continued ability to address the evolving healthcare trends in supply chain, staffing, technology-enablement and artificial intelligence, the impact of a shift to enterprise-level analytics agreements and our ability to replace converted SaaS-based revenue from existing members, the impact of our investments in adjacent markets businesses, our future organic growth and acquisition strategies, the impact of our subsidiary reorganization on our expected effective income tax rate, the payment of dividends at current levels, or at all, the timing and number of shares repurchased under our share repurchase program, the statements under the heading “Fiscal 2023 Guidance” and the key assumptions underlying fiscal 2023 guidance, are “forward-looking statements” within the meaning of the Private Securities Litigation Reform Act of 1995. Forward-looking statements may involve known and unknown risks, uncertainties and other factors that may cause the actual results, performance or achievements of Premier to be materially different from historical results or from any future results or projections expressed or implied by such forward-looking statements. Accordingly, readers should not place undue reliance on any forward-looking statements. In addition to statements that explicitly describe such risks and uncertainties, readers are urged to consider statements in the conditional or future tenses or that include terms such as “believes,” “belief,” “expects,” “estimates,” “intends,” “remains committed to,” “anticipates” or “plans” to be uncertain and forward-looking. Forward-looking statements may include comments as to Premier’s beliefs and expectations as to future events and trends affecting its business and are necessarily subject to uncertainties, many of which are outside Premier’s control. More information on potential factors that could affect Premier’s financial results is included from time to time in the “Cautionary Note Regarding Forward-Looking Statements,” “Risk Factors” and “Management’s Discussion and Analysis of Financial Condition and Results of Operations” sections of Premier’s periodic and current filings with the SEC, including those discussed under the “Risk Factors” and “Cautionary Note Regarding Forward-Looking Statements” section of Premier’s Form 10-K for the year ended June 30, 2022. Premier’s periodic and current filings with the SEC are available on the company’s website at investors.premierinc.com. Forward-looking statements speak only as of the date they are made, and Premier undertakes no obligation to publicly update or revise any forward-looking statements, whether as a result of new information or future events that occur after that date, or otherwise. Non-GAAP financial measures– This presentation and accompanying webcast includes certain “adjusted” or “non-GAAP” financial measures as defined in Regulation G under the Securities Exchange Act of 1934. Schedules are attached that reconcile the non-GAAP financial measures included in this presentation to the most directly comparable financial measures calculated and presented in accordance with Generally Accepted Accounting Principles in the United States. You should carefully read Premier’s periodic and current filings with the SEC for definitions and further explanation and disclosure regarding our use of non-GAAP financial measures and such filings should be read in conjunction with this presentation. © 2022. All rights reserved. | Premier Inc. | 2

Overview Financial and Michael J. Alkire Operational Review President and Craig McKasson Chief Executive Officer Chief Administrative and Chief Financial Officer © 2022. All rights reserved. | Premier Inc. | 3
Executing multi-year strategy to achieve longer-term goals ❖ Fiscal 1Q23 performance consistent with company expectations • Reflects continued execution of strategy to provide value to members and other customers through technology-enabled solutions ❖ Reaffirming fiscal 2023 financial guidance ❖ Business built on strong foundation providing stability and enabling growth ❖ Developing technology-enabled solutions to help members and customers in delivery of care ❖ Multi-year strategy expected to result in sustainable, long-term growth and value creation © 2022. All rights reserved. | Premier Inc. | 4
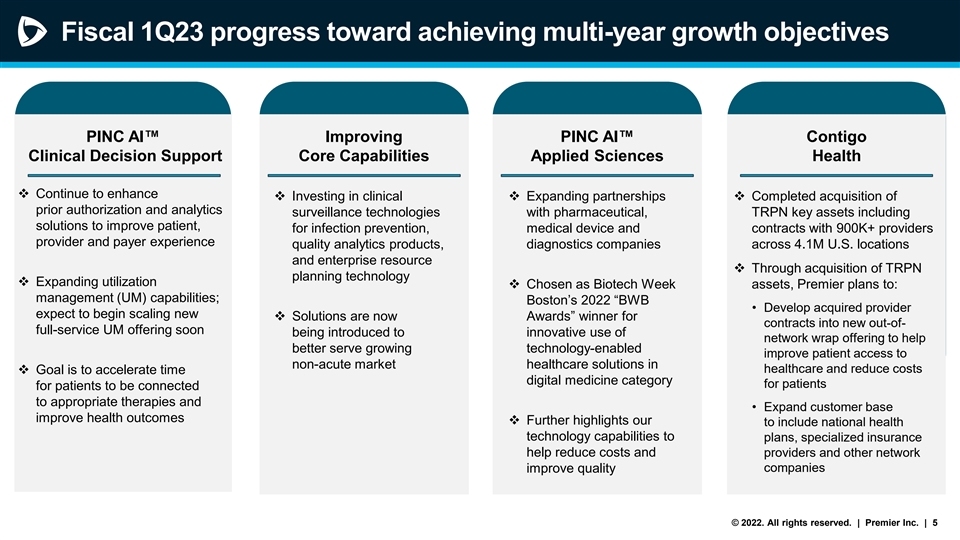
Fiscal 1Q23 progress toward achieving multi-year growth objectives PINC AI™ Improving PINC AI™ Contigo Clinical Decision Support Core Capabilities Applied Sciences Health ❖ Continue to enhance ❖ Investing in clinical ❖ Expanding partnerships ❖ Completed acquisition of prior authorization and analytics surveillance technologies with pharmaceutical, TRPN key assets including solutions to improve patient, for infection prevention, medical device and contracts with 900K+ providers provider and payer experience quality analytics products, diagnostics companies across 4.1M U.S. locations and enterprise resource ❖ Through acquisition of TRPN planning technology ❖ Expanding utilization ❖ Chosen as Biotech Week assets, Premier plans to: management (UM) capabilities; Boston’s 2022 “BWB • Develop acquired provider expect to begin scaling new ❖ Solutions are now Awards” winner for contracts into new out-of- full-service UM offering soon being introduced to innovative use of network wrap offering to help better serve growing technology-enabled improve patient access to non-acute market healthcare solutions in healthcare and reduce costs ❖ Goal is to accelerate time digital medicine category for patients for patients to be connected to appropriate therapies and • Expand customer base improve health outcomes ❖ Further highlights our to include national health technology capabilities to plans, specialized insurance help reduce costs and providers and other network companies improve quality © 2022. All rights reserved. | Premier Inc. | 5
Advancing Environmental, Social and Governance (ESG) Efforts Support our strategies to create value for all stakeholders and critical to our mission to improve health of communities ❖ Recently published 2022 Sustainability Report highlighting practices and initiatives aimed at improving healthcare, building trust, operating responsibly and positively impacting communities ❖ Signed HHS OCCHE* “Climate Pledge” as part of our commitment to reduce greenhouse gas emissions and increase climate resilience ❖ Together with our Vision, Mission and Values, our ESG practices are guideposts to help ensure our strategies deliver long-term, sustainable growth and have positive global impact *HHS OCCHE = U.S. Department of Health and Human Services Office of Climate Change and Health Equity © 2022. All rights reserved. | Premier Inc. | 6
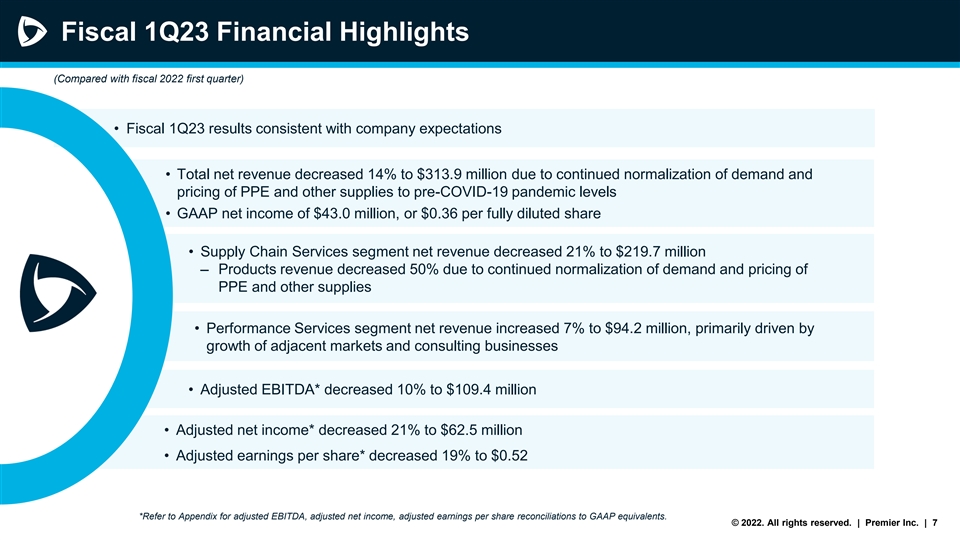
Fiscal 1Q23 Financial Highlights (Compared with fiscal 2022 first quarter) • Fiscal 1Q23 results consistent with company expectations • Total net revenue decreased 14% to $313.9 million due to continued normalization of demand and pricing of PPE and other supplies to pre-COVID-19 pandemic levels • GAAP net income of $43.0 million, or $0.36 per fully diluted share • Supply Chain Services segment net revenue decreased 21% to $219.7 million ‒ Products revenue decreased 50% due to continued normalization of demand and pricing of PPE and other supplies • Performance Services segment net revenue increased 7% to $94.2 million, primarily driven by growth of adjacent markets and consulting businesses • Adjusted EBITDA* decreased 10% to $109.4 million • Adjusted net income* decreased 21% to $62.5 million • Adjusted earnings per share* decreased 19% to $0.52 *Refer to Appendix for adjusted EBITDA, adjusted net income, adjusted earnings per share reconciliations to GAAP equivalents. © 2022. All rights reserved. | Premier Inc. | 7
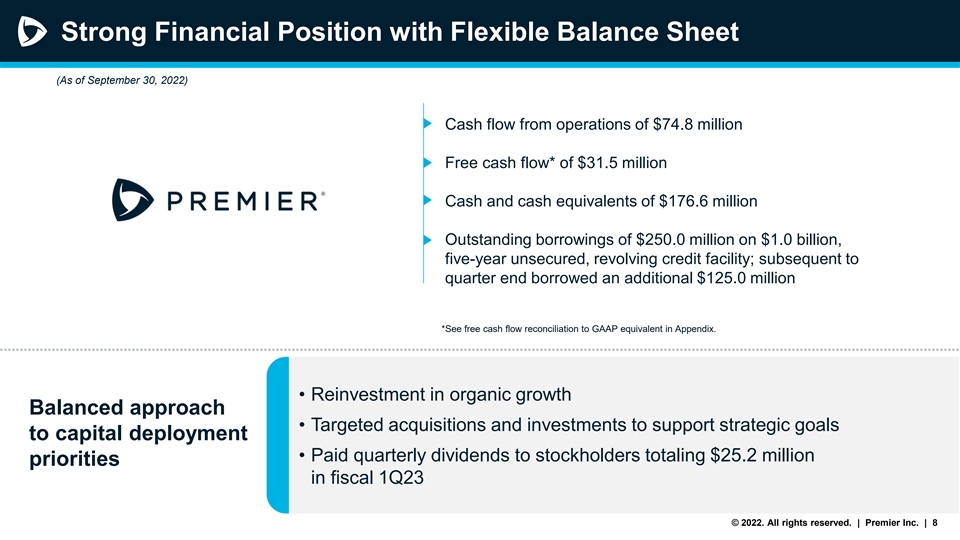
Strong Financial Position with Flexible Balance Sheet (As of September 30, 2022) Cash flow from operations of $74.8 million Free cash flow* of $31.5 million Cash and cash equivalents of $176.6 million Outstanding borrowings of $250.0 million on $1.0 billion, five-year unsecured, revolving credit facility; subsequent to quarter end borrowed an additional $125.0 million *See free cash flow reconciliation to GAAP equivalent in Appendix. • Reinvestment in organic growth Balanced approach • Targeted acquisitions and investments to support strategic goals to capital deployment • Paid quarterly dividends to stockholders totaling $25.2 million priorities in fiscal 1Q23 © 2022. All rights reserved. | Premier Inc. | 8
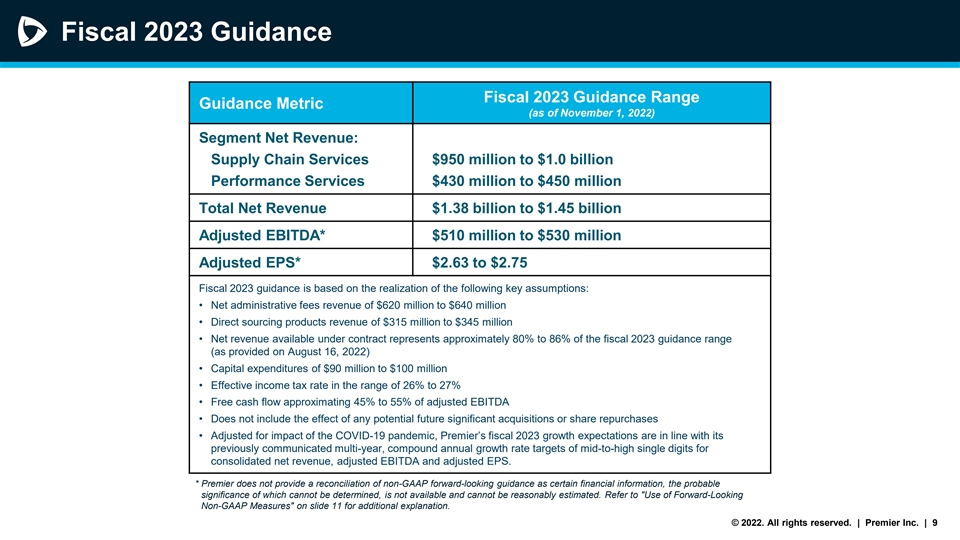
Fiscal 2023 Guidance Fiscal 2023 Guidance Range Guidance Metric (as of November 1, 2022) Segment Net Revenue: Supply Chain Services $950 million to $1.0 billion Performance Services $430 million to $450 million Total Net Revenue $1.38 billion to $1.45 billion Adjusted EBITDA* $510 million to $530 million Adjusted EPS* $2.63 to $2.75 Fiscal 2023 guidance is based on the realization of the following key assumptions: • Net administrative fees revenue of $620 million to $640 million • Direct sourcing products revenue of $315 million to $345 million • Net revenue available under contract represents approximately 80% to 86% of the fiscal 2023 guidance range (as provided on August 16, 2022) • Capital expenditures of $90 million to $100 million • Effective income tax rate in the range of 26% to 27% • Free cash flow approximating 45% to 55% of adjusted EBITDA • Does not include the effect of any potential future significant acquisitions or share repurchases • Adjusted for impact of the COVID-19 pandemic, Premier’s fiscal 2023 growth expectations are in line with its previously communicated multi-year, compound annual growth rate targets of mid-to-high single digits for consolidated net revenue, adjusted EBITDA and adjusted EPS. * Premier does not provide a reconciliation of non-GAAP forward-looking guidance as certain financial information, the probable significance of which cannot be determined, is not available and cannot be reasonably estimated. Refer to Use of Forward-Looking Non-GAAP Measures on slide 11 for additional explanation. © 2022. All rights reserved. | Premier Inc. | 9

Appendix © 2022. All rights reserved. | Premier Inc. | 10

Use of Forward-looking Non-GAAP Financial Measures The company does not believe it can meaningfully reconcile guidance for non-GAAP adjusted EBITDA and non-GAAP adjusted earnings per share to net income attributable to stockholders or earnings per share attributable to stockholders because the company cannot provide guidance for the more significant reconciling items between net income attributable to stockholders and adjusted EBITDA and between earnings per share attributable to stockholders and non-GAAP adjusted earnings per share without unreasonable effort. This is due to the fact that future period non-GAAP guidance includes adjustments for items not indicative of our core operations, which may include, without limitation, items included in the supplemental financial information for reconciliation of reported GAAP results to non-GAAP results. Such items may, from time to time, include merger- and acquisition-related expenses for professional fees; mark to market adjustments for put options and contingent liabilities; gains and losses on stock-based performance shares; adjustments to its income tax provision (such as valuation allowance adjustments and settlements of income tax claims); items such as strategic initiative and financial restructuring-related expenses; and certain other items the company believes to be non-indicative of its ongoing operations. Such adjustments may be affected by changes in ongoing assumptions, judgements, as well as nonrecurring, unusual or unanticipated charges, expenses or gains/losses or other items that may not directly correlate to the underlying performance of our business operations. The exact amount of these adjustments are not currently determinable but may be significant. © 2022. All rights reserved. | Premier Inc. | 11
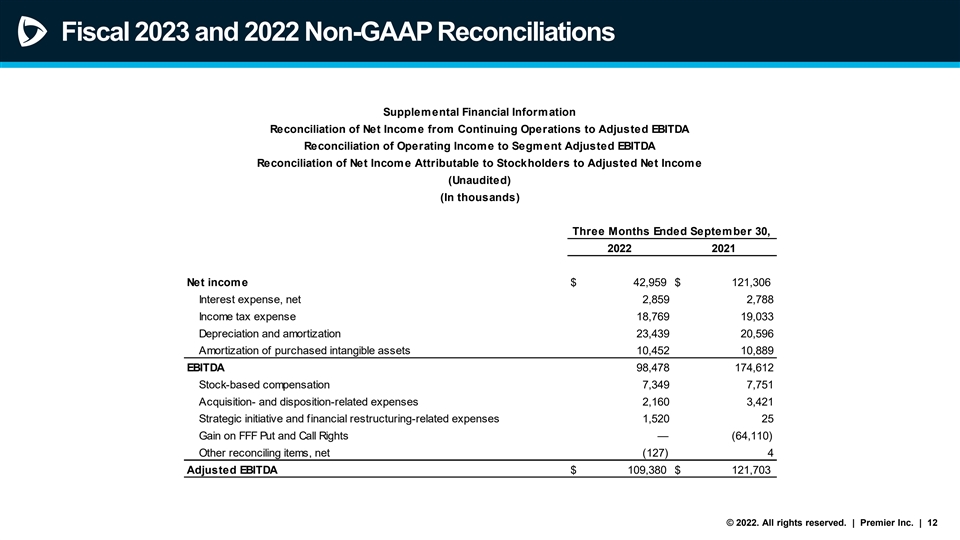
Fiscal 2023 and 2022 Non-GAAP Reconciliations Supplemental Financial Information Reconciliation of Net Income from Continuing Operations to Adjusted EBITDA Reconciliation of Operating Income to Segment Adjusted EBITDA Reconciliation of Net Income Attributable to Stockholders to Adjusted Net Income (Unaudited) (In thousands) Three Months Ended September 30, 2022 2021 Net income $ 42,959 $ 121,306 Interest expense, net 2,859 2,788 Income tax expense 18,769 19,033 Depreciation and amortization 23,439 20,596 Amortization of purchased intangible assets 10,452 10,889 EBITDA 98,478 174,612 Stock-based compensation 7,349 7,751 Acquisition- and disposition-related expenses 2,160 3,421 Strategic initiative and financial restructuring-related expenses 1,520 25 Gain on FFF Put and Call Rights — (64,110) Other reconciling items, net (127) 4 Adjusted EBITDA $ 109,380 $ 121,703 © 2022. All rights reserved. | Premier Inc. | 12
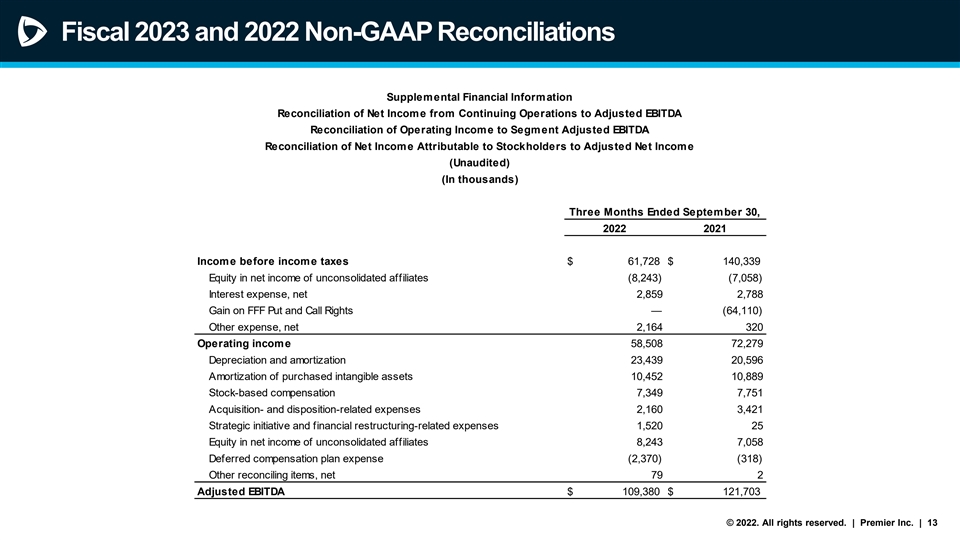
Fiscal 2023 and 2022 Non-GAAP Reconciliations Supplemental Financial Information Reconciliation of Net Income from Continuing Operations to Adjusted EBITDA Reconciliation of Operating Income to Segment Adjusted EBITDA Reconciliation of Net Income Attributable to Stockholders to Adjusted Net Income (Unaudited) (In thousands) Three Months Ended September 30, 2022 2021 Income before income taxes $ 61,728 $ 140,339 Equity in net income of unconsolidated affiliates (8,243) (7,058) Interest expense, net 2,859 2,788 Gain on FFF Put and Call Rights — (64,110) Other expense, net 2,164 320 Operating income 58,508 72,279 Depreciation and amortization 23,439 20,596 Amortization of purchased intangible assets 10,452 10,889 Stock-based compensation 7,349 7,751 Acquisition- and disposition-related expenses 2,160 3,421 Strategic initiative and financial restructuring-related expenses 1,520 25 Equity in net income of unconsolidated affiliates 8,243 7,058 Deferred compensation plan expense (2,370) (318) Other reconciling items, net 79 2 Adjusted EBITDA $ 109,380 $ 121,703 © 2022. All rights reserved. | Premier Inc. | 13
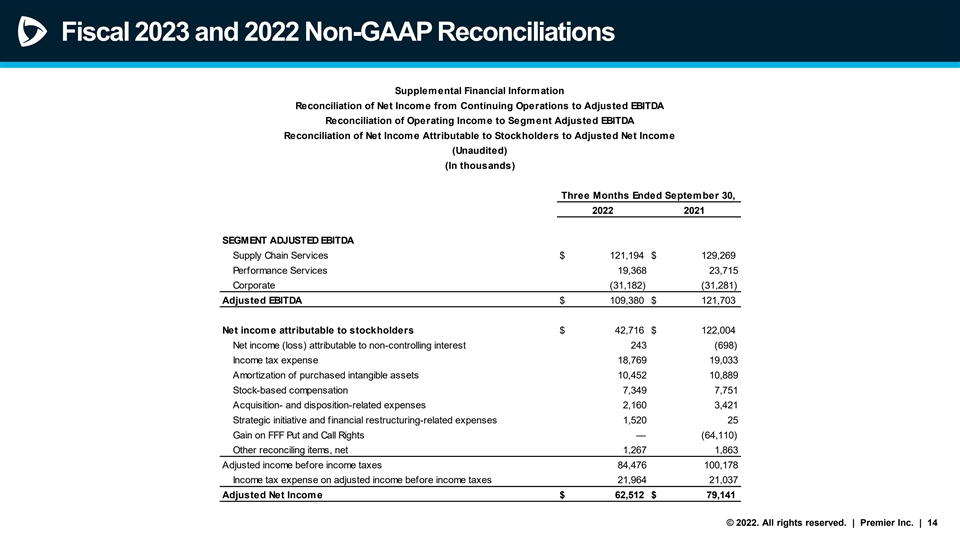
Fiscal 2023 and 2022 Non-GAAP Reconciliations Supplemental Financial Information Reconciliation of Net Income from Continuing Operations to Adjusted EBITDA Reconciliation of Operating Income to Segment Adjusted EBITDA Reconciliation of Net Income Attributable to Stockholders to Adjusted Net Income (Unaudited) (In thousands) Three Months Ended September 30, 2022 2021 SEGMENT ADJUSTED EBITDA Supply Chain Services $ 121,194 $ 129,269 Performance Services 19,368 23,715 Corporate (31,182) (31,281) Adjusted EBITDA $ 109,380 $ 121,703 Net income attributable to stockholders $ 42,716 $ 122,004 Net income (loss) attributable to non-controlling interest 243 (698) Income tax expense 18,769 19,033 Amortization of purchased intangible assets 10,452 10,889 Stock-based compensation 7,349 7,751 Acquisition- and disposition-related expenses 2,160 3,421 Strategic initiative and financial restructuring-related expenses 1,520 25 Gain on FFF Put and Call Rights — (64,110) Other reconciling items, net 1,267 1,863 Adjusted income before income taxes 84,476 100,178 Income tax expense on adjusted income before income taxes 21,964 21,037 Adjusted Net Income $ 62,512 $ 79,141 © 2022. All rights reserved. | Premier Inc. | 14
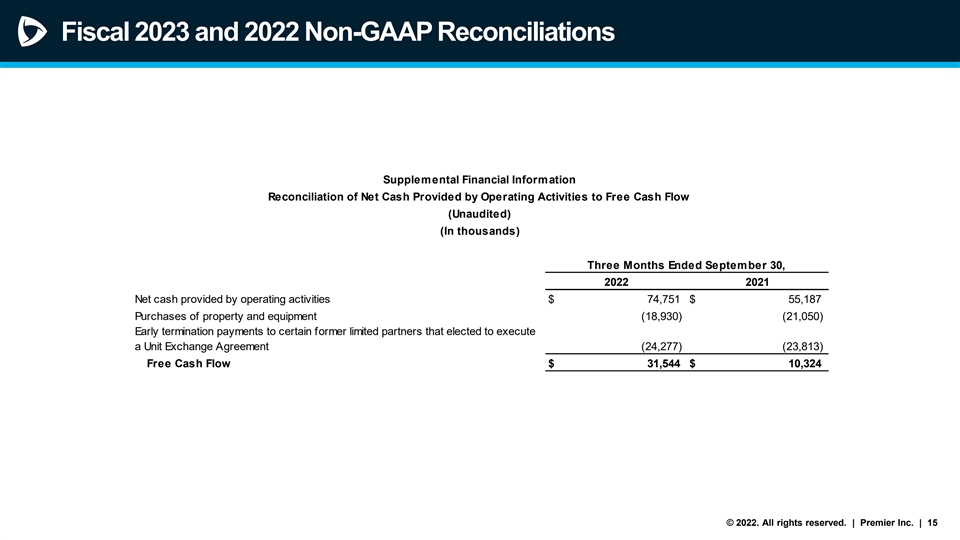
Fiscal 2023 and 2022 Non-GAAP Reconciliations Supplemental Financial Information Reconciliation of Net Cash Provided by Operating Activities to Free Cash Flow (Unaudited) (In thousands) Three Months Ended September 30, 2022 2021 Net cash provided by operating activities $ 74,751 $ 55,187 Purchases of property and equipment (18,930) (21,050) Early termination payments to certain former limited partners that elected to execute a Unit Exchange Agreement (24,277) (23,813) Free Cash Flow $ 31,544 $ 10,324 © 2022. All rights reserved. | Premier Inc. | 15
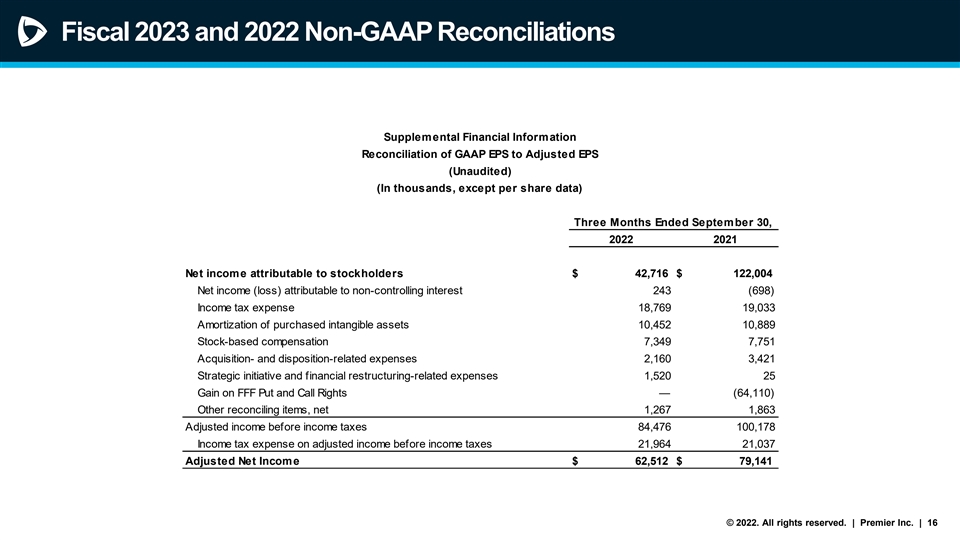
Fiscal 2023 and 2022 Non-GAAP Reconciliations Supplemental Financial Information Reconciliation of GAAP EPS to Adjusted EPS (Unaudited) (In thousands, except per share data) Three Months Ended September 30, 2022 2021 Net income attributable to stockholders $ 42,716 $ 122,004 Net income (loss) attributable to non-controlling interest 243 (698) Income tax expense 18,769 19,033 Amortization of purchased intangible assets 10,452 10,889 Stock-based compensation 7,349 7,751 Acquisition- and disposition-related expenses 2,160 3,421 Strategic initiative and financial restructuring-related expenses 1,520 25 Gain on FFF Put and Call Rights — (64,110) Other reconciling items, net 1,267 1,863 Adjusted income before income taxes 84,476 100,178 Income tax expense on adjusted income before income taxes 21,964 21,037 Adjusted Net Income $ 62,512 $ 79,141 © 2022. All rights reserved. | Premier Inc. | 16
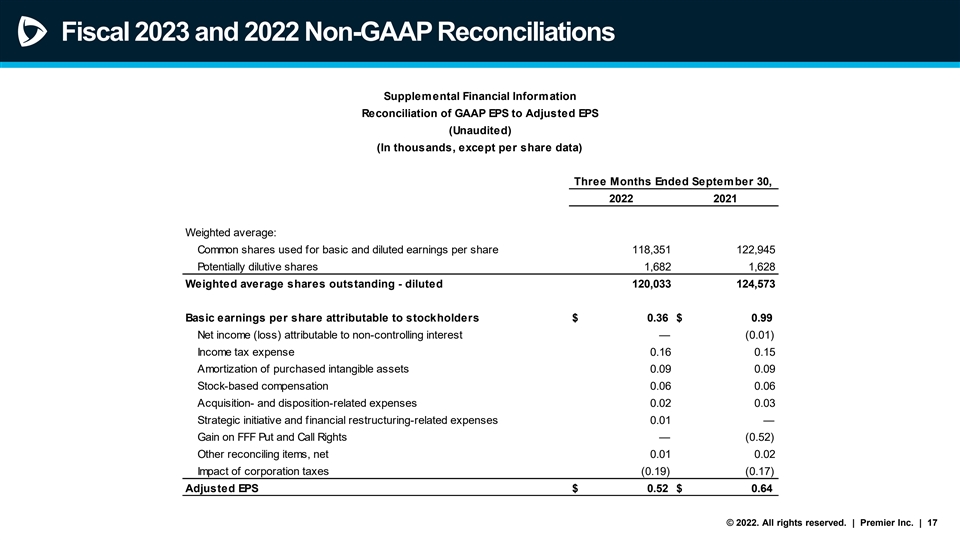
Fiscal 2023 and 2022 Non-GAAP Reconciliations Supplemental Financial Information Reconciliation of GAAP EPS to Adjusted EPS (Unaudited) (In thousands, except per share data) Three Months Ended September 30, 2022 2021 Weighted average: Common shares used for basic and diluted earnings per share 118,351 122,945 Potentially dilutive shares 1,682 1,628 Weighted average shares outstanding - diluted 120,033 124,573 0 0 Basic earnings per share attributable to stockholders $ 0.36 $ 0.99 Net income (loss) attributable to non-controlling interest — (0.01) Income tax expense 0.16 0.15 Amortization of purchased intangible assets 0.09 0.09 Stock-based compensation 0.06 0.06 Acquisition- and disposition-related expenses 0.02 0.03 Strategic initiative and financial restructuring-related expenses 0.01 — Gain on FFF Put and Call Rights — (0.52) Other reconciling items, net 0.01 0.02 Impact of corporation taxes (0.19) (0.17) Adjusted EPS $ 0.52 $ 0.64 © 2022. All rights reserved. | Premier Inc. | 17