
Fiscal 2024 Fourth-Quarter Earnings Conference Call /////// August 20, 2024 Exhibit 99.3
Forward-looking Statements and Non-GAAP Financial Measures Forward-looking statements – Statements made in this presentation and the accompanying webcast that are not statements of historical or current facts, such as those related to our ability to advance our long-term strategies and develop innovations for, transform and improve healthcare, our ability to find partners for our S2S Global and Contigo Health businesses and the potential benefits thereof, our ability to fund and conduct share repurchases pursuant to the outstanding share repurchase authorization and the potential benefits thereof, the payment of dividends at current levels or at all, guidance on expected future financial performance and assumptions underlying that guidance, and our expected effective income tax rate are “forward-looking statements” within the meaning of the Private Securities Litigation Reform Act of 1995. Forward-looking statements may involve known and unknown risks, uncertainties and other factors that may cause the actual results, performance or achievements of Premier to be materially different from historical results or from any future results or projections expressed or implied by such forward-looking statements. Accordingly, readers should not place undue reliance on any forward-looking statements. In addition to statements that explicitly describe such risks and uncertainties, readers are urged to consider statements in the conditional or future tenses or that include terms such as “believes,” “belief,” “expects,” “estimates,” “intends,” “remains committed to,” “anticipates” or “plans” to be uncertain and forward-looking. Forward-looking statements may include comments as to Premier’s beliefs and expectations as to future events and trends affecting its business and are necessarily subject to risks and uncertainties, many of which are outside Premier’s control. More information on risks and uncertainties that could affect Premier’s business, achievements, performance, financial condition, and financial results is included from time to time in the “Cautionary Note Regarding Forward-Looking Statements,” “Risk Factors” and “Management’s Discussion and Analysis of Financial Condition and Results of Operations” sections of Premier’s periodic and current filings with the SEC, including the information in those sections of Premier’s Form 10-K for the year ended June 30, 2024, expected to be filed with the SEC shortly after this presentation. Premier’s periodic and current filings with the SEC are made available on the company’s website at investors.premierinc.com. Forward-looking statements speak only as of the date they are made, and Premier undertakes no obligation to publicly update or revise any forward-looking statements, whether as a result of new information or future events that occur after that date, or otherwise. Non-GAAP financial measures – This presentation and accompanying webcast include certain “adjusted” and other “non-GAAP” financial measures, including free cash flow, as defined in the SEC’s Regulation G. These measures are not in accordance with, or an alternative to, GAAP. The Appendix to this presentation includes schedules that reconcile the historical non-GAAP financial measures included in this presentation to the most directly comparable GAAP financial measures. You should carefully read Premier’s earnings release and Annual Report on Form 10-K for the year ended June 30, 2024, expected to be filed shortly after this presentation, for definitions of Premier’s non-GAAP financial measures and further explanation and disclosure regarding Premier’s use of non-GAAP financial measures, and such information should be read in conjunction with this presentation. These materials are made available on the company’s website at investors.premierinc.com.

Overview Michael J. Alkire President and Chief Executive Officer Financial and Operational Review Craig McKasson Chief Administrative and Financial Officer
Fiscal 2024 fourth-quarter and full-year results exceeded expectations Year ahead includes: Advance strategy to technology-enable better healthcare performance and a smarter supply chain Plan to continue to return value to stockholders as our Board approved execution of another share repurchase of $200 million of Class A common shares under our $1 billion share repurchase authorization Plan to divest non-core assets, S2S Global and Contigo Health, for which the processes, launched in second quarter of fiscal 2024, remain ongoing and we are hopeful to have something to announce soon
Expanding role as strategic partner with healthcare providers 97% GPO retention rate and 95% SaaS institutional renewal rate Identified significant targeted supply chain savings for members 5 new supply chain co-management agreements with health systems in fiscal 2024 AllSpire Health Partners selected Premier as its national GPO to support its more than $3.5 billion in annual purchasing volume 32 new health systems adopted our healthcare-specific enterprise resource planning solution Secured a major integrated delivery network and their health plan in the Southwest, which will now use our AI solution to automate prior authorization
Expanding role as strategic partner with other customers We are executing our plan to use our robust data and AI-enabled technology to deliver unparalleled insights and efficiencies for these customers We are leveraging our digital supply chain capabilities to ensure timely payment, accurate reporting and reduced administrative burden, while also adding transparency and efficiency to the entire provider-manufacturer exchange We believe that technology-enabling our network will drive innovation in healthcare and lead to a unified approach for delivering higher-quality, more affordable care
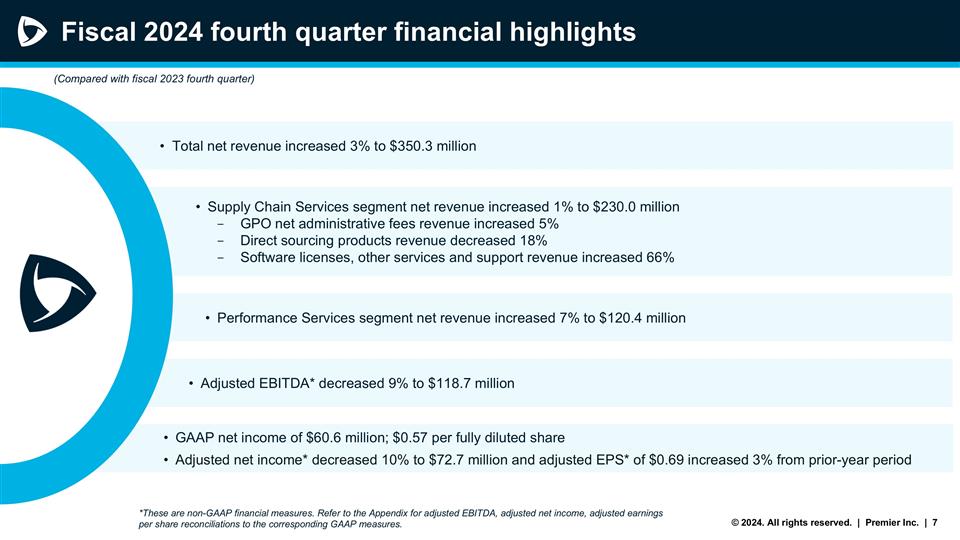
Fiscal 2024 fourth quarter financial highlights Adjusted EBITDA* decreased 9% to $118.7 million Performance Services segment net revenue increased 7% to $120.4 million GAAP net income of $60.6 million; $0.57 per fully diluted share Adjusted net income* decreased 10% to $72.7 million and adjusted EPS* of $0.69 increased 3% from prior-year period Supply Chain Services segment net revenue increased 1% to $230.0 million GPO net administrative fees revenue increased 5% Direct sourcing products revenue decreased 18% Software licenses, other services and support revenue increased 66% *These are non-GAAP financial measures. Refer to the Appendix for adjusted EBITDA, adjusted net income, adjusted earnings per share reconciliations to the corresponding GAAP measures. (Compared with fiscal 2023 fourth quarter) Total net revenue increased 3% to $350.3 million
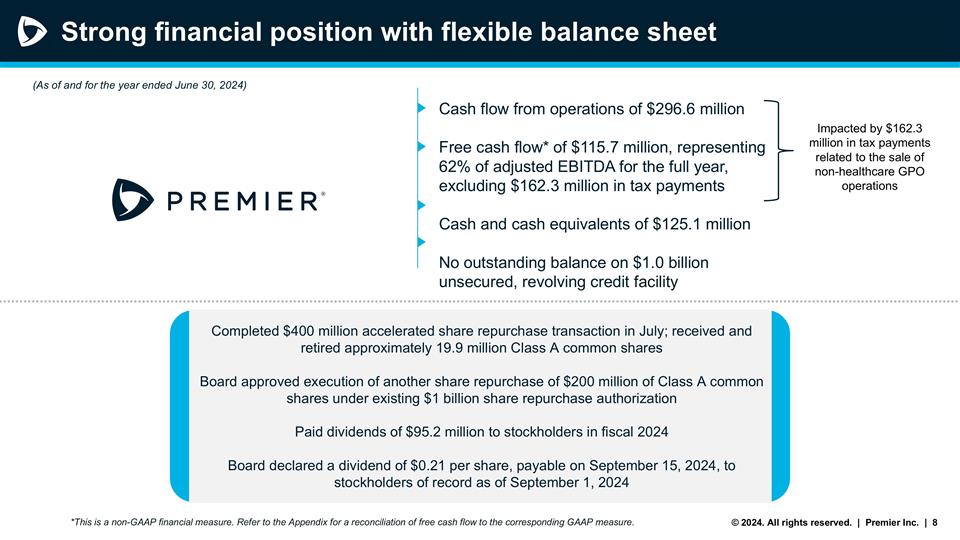
Strong financial position with flexible balance sheet Cash flow from operations of $296.6 million Free cash flow* of $115.7 million, representing 62% of adjusted EBITDA for the full year, excluding $162.3 million in tax payments Cash and cash equivalents of $125.1 million No outstanding balance on $1.0 billion unsecured, revolving credit facility *This is a non-GAAP financial measure. Refer to the Appendix for a reconciliation of free cash flow to the corresponding GAAP measure. (As of and for the year ended June 30, 2024) Completed $400 million accelerated share repurchase transaction in July; received and retired approximately 19.9 million Class A common shares Board approved execution of another share repurchase of $200 million of Class A common shares under existing $1 billion share repurchase authorization Paid dividends of $95.2 million to stockholders in fiscal 2024 Board declared a dividend of $0.21 per share, payable on September 15, 2024, to stockholders of record as of September 1, 2024 Impacted by $162.3 million in tax payments related to the sale of non-healthcare GPO operations
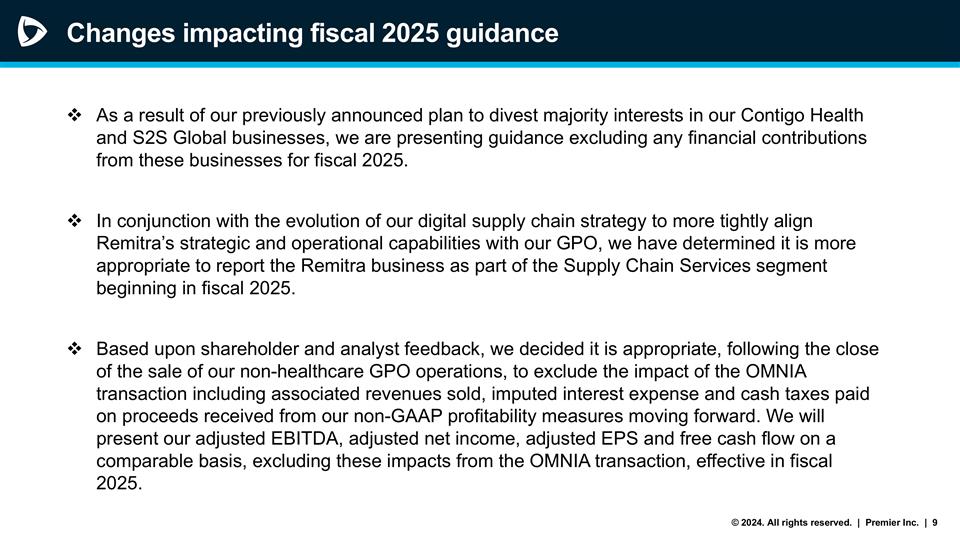
Changes impacting fiscal 2025 guidance As a result of our previously announced plan to divest majority interests in our Contigo Health and S2S Global businesses, we are presenting guidance excluding any financial contributions from these businesses for fiscal 2025. In conjunction with the evolution of our digital supply chain strategy to more tightly align Remitra’s strategic and operational capabilities with our GPO, we have determined it is more appropriate to report the Remitra business as part of the Supply Chain Services segment beginning in fiscal 2025. Based upon shareholder and analyst feedback, we decided it is appropriate, following the close of the sale of our non-healthcare GPO operations, to exclude the impact of the OMNIA transaction including associated revenues sold, imputed interest expense and cash taxes paid on proceeds received from our non-GAAP profitability measures moving forward. We will present our adjusted EBITDA, adjusted net income, adjusted EPS and free cash flow on a comparable basis, excluding these impacts from the OMNIA transaction, effective in fiscal 2025.
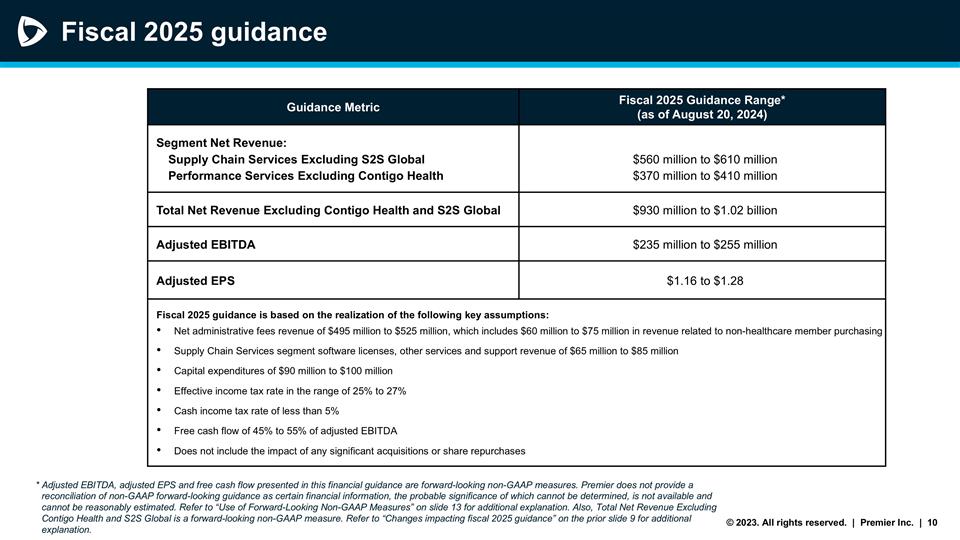
Fiscal 2025 guidance * Adjusted EBITDA, adjusted EPS and free cash flow presented in this financial guidance are forward-looking non-GAAP measures. Premier does not provide a reconciliation of non-GAAP forward-looking guidance as certain financial information, the probable significance of which cannot be determined, is not available and cannot be reasonably estimated. Refer to “Use of Forward-Looking Non-GAAP Measures” on slide 13 for additional explanation. Also, Total Net Revenue Excluding Contigo Health and S2S Global is a forward-looking non-GAAP measure. Refer to “Changes impacting fiscal 2025 guidance” on the prior slide 9 for additional explanation. Guidance Metric Fiscal 2025 Guidance Range* (as of August 20, 2024) Segment Net Revenue: Supply Chain Services Excluding S2S Global Performance Services Excluding Contigo Health $560 million to $610 million $370 million to $410 million Total Net Revenue Excluding Contigo Health and S2S Global $930 million to $1.02 billion Adjusted EBITDA $235 million to $255 million Adjusted EPS $1.16 to $1.28 Fiscal 2025 guidance is based on the realization of the following key assumptions: Net administrative fees revenue of $495 million to $525 million, which includes $60 million to $75 million in revenue related to non-healthcare member purchasing Supply Chain Services segment software licenses, other services and support revenue of $65 million to $85 million Capital expenditures of $90 million to $100 million Effective income tax rate in the range of 25% to 27% Cash income tax rate of less than 5% Free cash flow of 45% to 55% of adjusted EBITDA Does not include the impact of any significant acquisitions or share repurchases
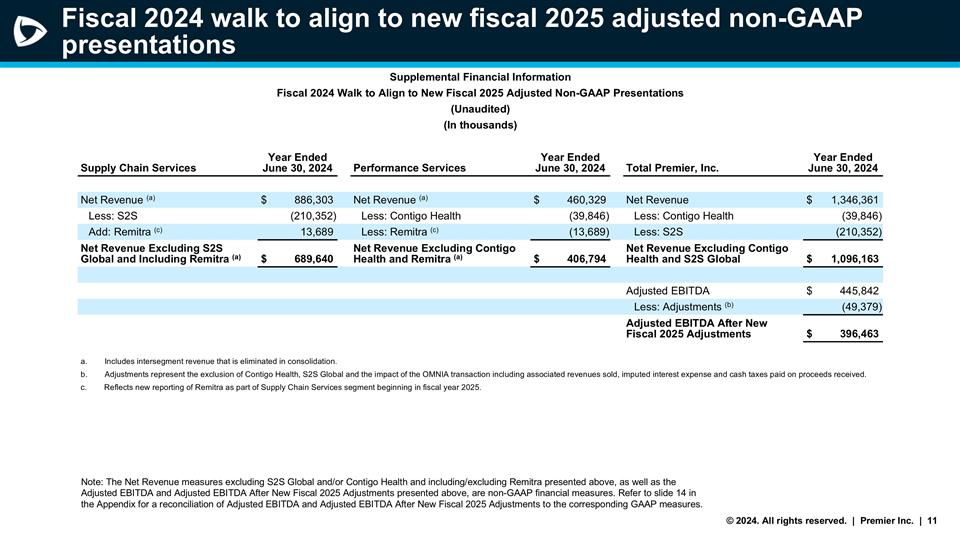
Fiscal 2024 walk to align to new fiscal 2025 adjusted non-GAAP presentations Supplemental Financial Information Fiscal 2024 Walk to Align to New Fiscal 2025 Adjusted Non-GAAP Presentations (Unaudited) (In thousands) Supply Chain Services Year Ended June 30, 2024 Performance Services Year Ended June 30, 2024 Total Premier, Inc. Year Ended June 30, 2024 Net Revenue (a) $886,303 Net Revenue (a) $460,329 Net Revenue $1,346,361 Less: S2S (210,352) Less: Contigo Health (39,846) Less: Contigo Health (39,846) Add: Remitra (c) 13,689 Less: Remitra (c) (13,689) Less: S2S (210,352) Net Revenue Excluding S2S Global and Including Remitra (a) $689,640 Net Revenue Excluding Contigo Health and Remitra (a) $406,794 Net Revenue Excluding Contigo Health and S2S Global $1,096,163 Adjusted EBITDA $445,842 Less: Adjustments (b) (49,379) Adjusted EBITDA After New Fiscal 2025 Adjustments $396,463 Includes intersegment revenue that is eliminated in consolidation. Adjustments represent the exclusion of Contigo Health, S2S Global and the impact of the OMNIA transaction including associated revenues sold, imputed interest expense and cash taxes paid on proceeds received. c. Reflects new reporting of Remitra as part of Supply Chain Services segment beginning in fiscal year 2025. Note: The Net Revenue measures excluding S2S Global and/or Contigo Health and including/excluding Remitra presented above, as well as the Adjusted EBITDA and Adjusted EBITDA After New Fiscal 2025 Adjustments presented above, are non-GAAP financial measures. Refer to slide 14 in the Appendix for a reconciliation of Adjusted EBITDA and Adjusted EBITDA After New Fiscal 2025 Adjustments to the corresponding GAAP measures.

Appendix
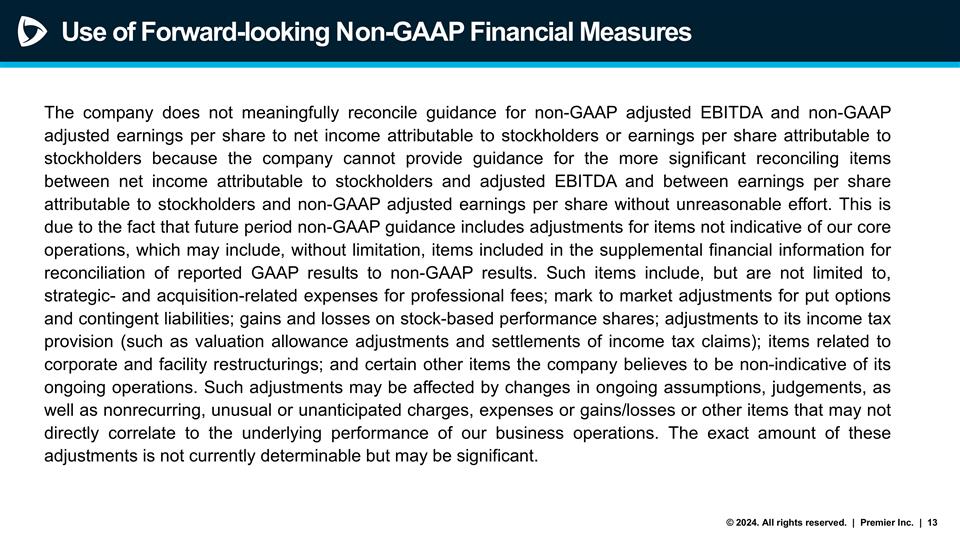
Use of Forward-looking Non-GAAP Financial Measures The company does not meaningfully reconcile guidance for non-GAAP adjusted EBITDA and non-GAAP adjusted earnings per share to net income attributable to stockholders or earnings per share attributable to stockholders because the company cannot provide guidance for the more significant reconciling items between net income attributable to stockholders and adjusted EBITDA and between earnings per share attributable to stockholders and non-GAAP adjusted earnings per share without unreasonable effort. This is due to the fact that future period non-GAAP guidance includes adjustments for items not indicative of our core operations, which may include, without limitation, items included in the supplemental financial information for reconciliation of reported GAAP results to non-GAAP results. Such items include, but are not limited to, strategic- and acquisition-related expenses for professional fees; mark to market adjustments for put options and contingent liabilities; gains and losses on stock-based performance shares; adjustments to its income tax provision (such as valuation allowance adjustments and settlements of income tax claims); items related to corporate and facility restructurings; and certain other items the company believes to be non-indicative of its ongoing operations. Such adjustments may be affected by changes in ongoing assumptions, judgements, as well as nonrecurring, unusual or unanticipated charges, expenses or gains/losses or other items that may not directly correlate to the underlying performance of our business operations. The exact amount of these adjustments is not currently determinable but may be significant.
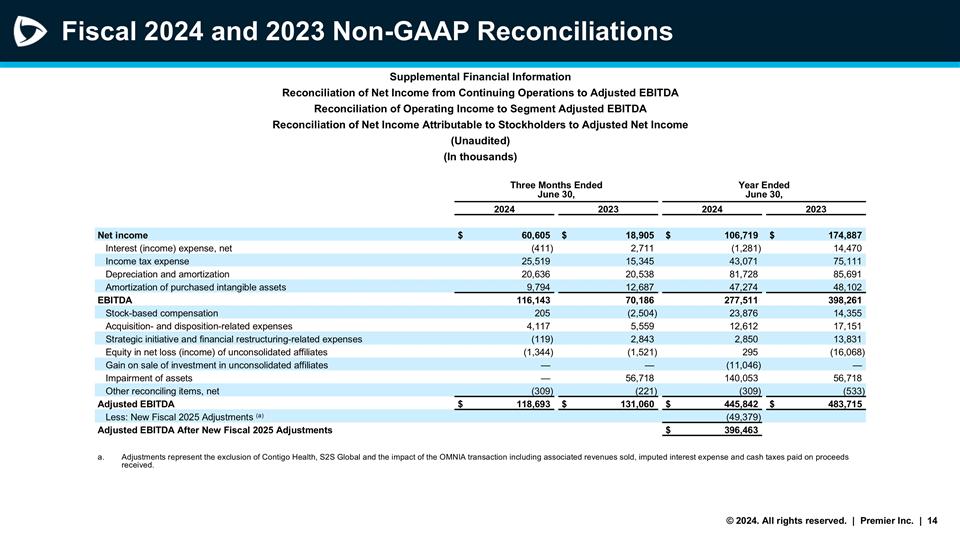
Fiscal 2024 and 2023 Non-GAAP Reconciliations Supplemental Financial Information Reconciliation of Net Income from Continuing Operations to Adjusted EBITDA Reconciliation of Operating Income to Segment Adjusted EBITDA Reconciliation of Net Income Attributable to Stockholders to Adjusted Net Income (Unaudited) (In thousands) Three Months Ended June 30, Year Ended June 30, 2024 2023 2024 2023 Net income $60,605 $18,905 $106,719 $174,887 Interest (income) expense, net (411) 2,711 (1,281) 14,470 Income tax expense 25,519 15,345 43,071 75,111 Depreciation and amortization 20,636 20,538 81,728 85,691 Amortization of purchased intangible assets 9,794 12,687 47,274 48,102 EBITDA 116,143 70,186 277,511 398,261 Stock-based compensation 205 (2,504) 23,876 14,355 Acquisition- and disposition-related expenses 4,117 5,559 12,612 17,151 Strategic initiative and financial restructuring-related expenses (119) 2,843 2,850 13,831 Equity in net loss (income) of unconsolidated affiliates (1,344) (1,521) 295 (16,068) Gain on sale of investment in unconsolidated affiliates — — (11,046) — Impairment of assets — 56,718 140,053 56,718 Other reconciling items, net (309) (221) (309) (533) Adjusted EBITDA $118,693 $131,060 $445,842 $483,715 Less: New Fiscal 2025 Adjustments (a) (49,379) Adjusted EBITDA After New Fiscal 2025 Adjustments $396,463 Adjustments represent the exclusion of Contigo Health, S2S Global and the impact of the OMNIA transaction including associated revenues sold, imputed interest expense and cash taxes paid on proceeds received.
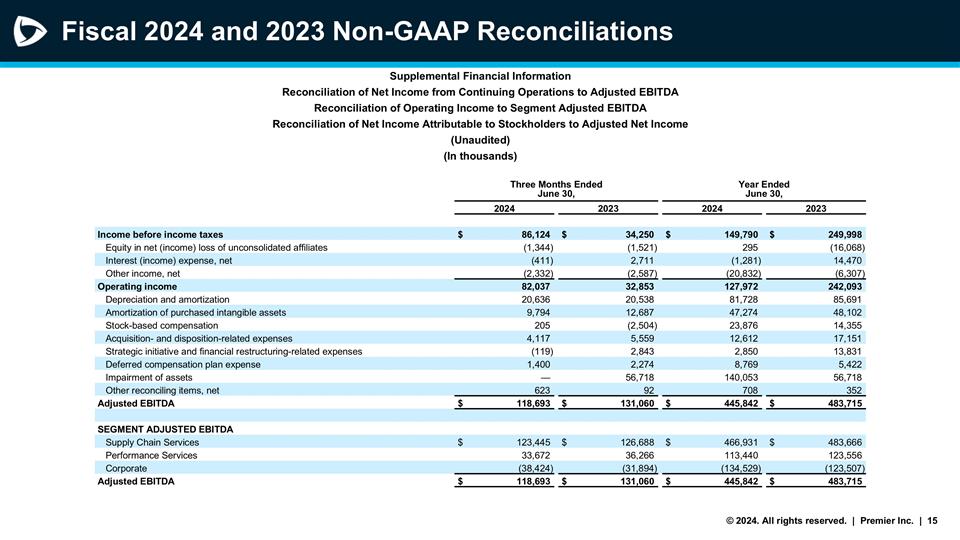
Fiscal 2024 and 2023 Non-GAAP Reconciliations Supplemental Financial Information Reconciliation of Net Income from Continuing Operations to Adjusted EBITDA Reconciliation of Operating Income to Segment Adjusted EBITDA Reconciliation of Net Income Attributable to Stockholders to Adjusted Net Income (Unaudited) (In thousands) Three Months Ended June 30, Year Ended June 30, 2024 2023 2024 2023 Income before income taxes $86,124 $34,250 $149,790 $249,998 Equity in net (income) loss of unconsolidated affiliates (1,344) (1,521) 295 (16,068) Interest (income) expense, net (411) 2,711 (1,281) 14,470 Other income, net (2,332) (2,587) (20,832) (6,307) Operating income 82,037 32,853 127,972 242,093 Depreciation and amortization 20,636 20,538 81,728 85,691 Amortization of purchased intangible assets 9,794 12,687 47,274 48,102 Stock-based compensation 205 (2,504) 23,876 14,355 Acquisition- and disposition-related expenses 4,117 5,559 12,612 17,151 Strategic initiative and financial restructuring-related expenses (119) 2,843 2,850 13,831 Deferred compensation plan expense 1,400 2,274 8,769 5,422 Impairment of assets — 56,718 140,053 56,718 Other reconciling items, net 623 92 708 352 Adjusted EBITDA $118,693 $131,060 $445,842 $483,715 SEGMENT ADJUSTED EBITDA Supply Chain Services $123,445 $126,688 $466,931 $483,666 Performance Services 33,672 36,266 113,440 123,556 Corporate (38,424) (31,894) (134,529) (123,507) Adjusted EBITDA $118,693 $131,060 $445,842 $483,715
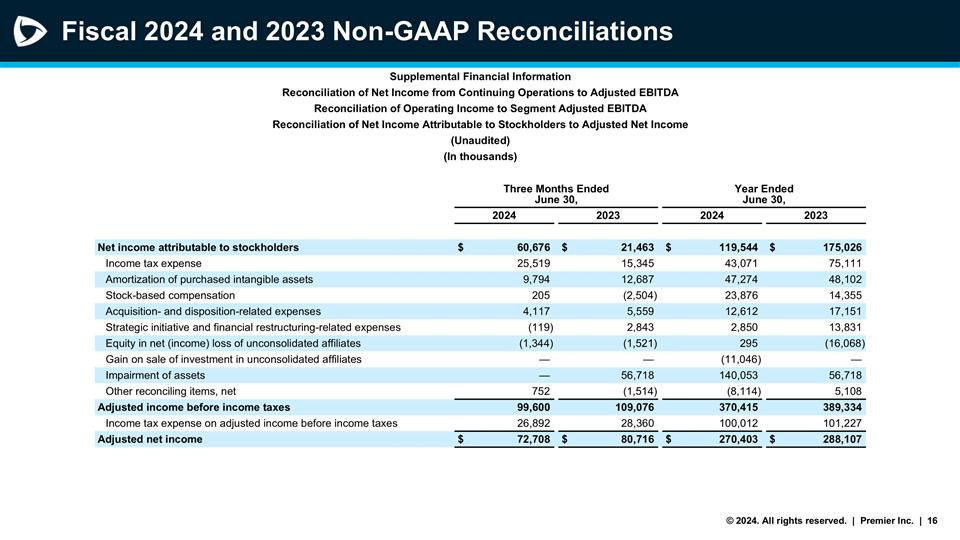
Fiscal 2024 and 2023 Non-GAAP Reconciliations Supplemental Financial Information Reconciliation of Net Income from Continuing Operations to Adjusted EBITDA Reconciliation of Operating Income to Segment Adjusted EBITDA Reconciliation of Net Income Attributable to Stockholders to Adjusted Net Income (Unaudited) (In thousands) Three Months Ended June 30, Year Ended June 30, 2024 2023 2024 2023 Net income attributable to stockholders $60,676 $21,463 $119,544 $175,026 Income tax expense 25,519 15,345 43,071 75,111 Amortization of purchased intangible assets 9,794 12,687 47,274 48,102 Stock-based compensation 205 (2,504) 23,876 14,355 Acquisition- and disposition-related expenses 4,117 5,559 12,612 17,151 Strategic initiative and financial restructuring-related expenses (119) 2,843 2,850 13,831 Equity in net (income) loss of unconsolidated affiliates (1,344) (1,521) 295 (16,068) Gain on sale of investment in unconsolidated affiliates — — (11,046) — Impairment of assets — 56,718 140,053 56,718 Other reconciling items, net 752 (1,514) (8,114) 5,108 Adjusted income before income taxes 99,600 109,076 370,415 389,334 Income tax expense on adjusted income before income taxes 26,892 28,360 100,012 101,227 Adjusted net income $72,708 $80,716 $270,403 $288,107
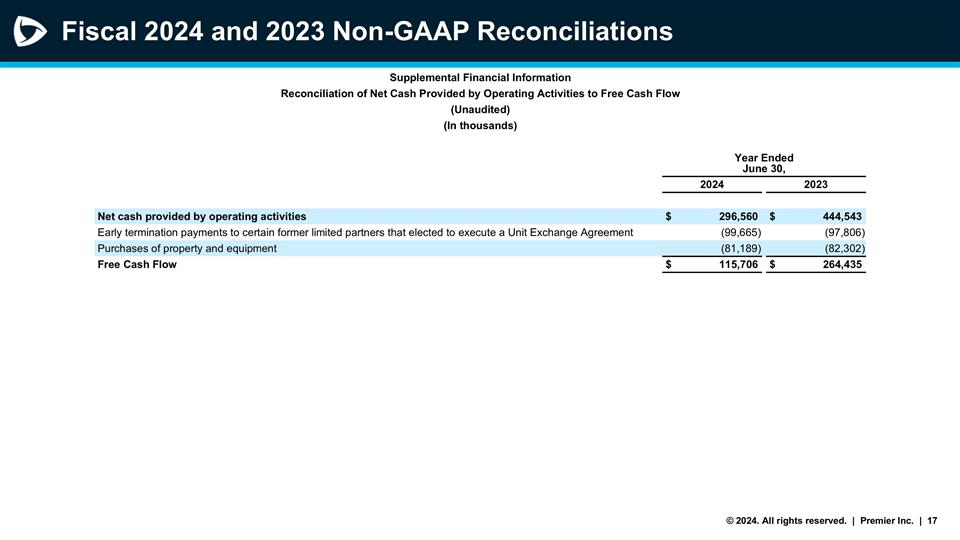
Fiscal 2024 and 2023 Non-GAAP Reconciliations Supplemental Financial Information Reconciliation of Net Cash Provided by Operating Activities to Free Cash Flow (Unaudited) (In thousands) Year Ended June 30, 2024 2023 Net cash provided by operating activities $296,560 $444,543 Early termination payments to certain former limited partners that elected to execute a Unit Exchange Agreement (99,665) (97,806) Purchases of property and equipment (81,189) (82,302) Free Cash Flow $115,706 $264,435
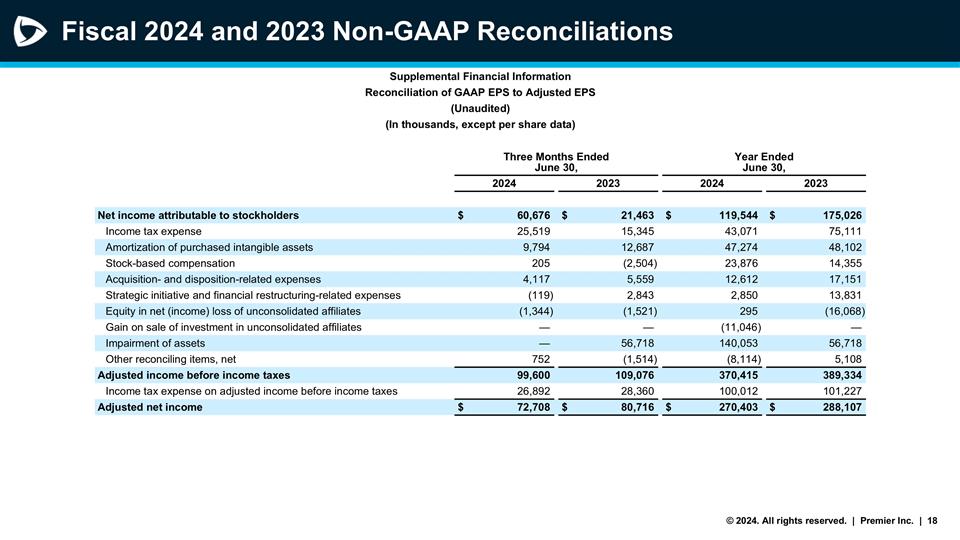
Fiscal 2024 and 2023 Non-GAAP Reconciliations Supplemental Financial Information Reconciliation of GAAP EPS to Adjusted EPS (Unaudited) (In thousands, except per share data) Three Months Ended June 30, Year Ended June 30, 2024 2023 2024 2023 Net income attributable to stockholders $60,676 $21,463 $119,544 $175,026 Income tax expense 25,519 15,345 43,071 75,111 Amortization of purchased intangible assets 9,794 12,687 47,274 48,102 Stock-based compensation 205 (2,504) 23,876 14,355 Acquisition- and disposition-related expenses 4,117 5,559 12,612 17,151 Strategic initiative and financial restructuring-related expenses (119) 2,843 2,850 13,831 Equity in net (income) loss of unconsolidated affiliates (1,344) (1,521) 295 (16,068) Gain on sale of investment in unconsolidated affiliates — — (11,046) — Impairment of assets — 56,718 140,053 56,718 Other reconciling items, net 752 (1,514) (8,114) 5,108 Adjusted income before income taxes 99,600 109,076 370,415 389,334 Income tax expense on adjusted income before income taxes 26,892 28,360 100,012 101,227 Adjusted net income $72,708 $80,716 $270,403 $288,107
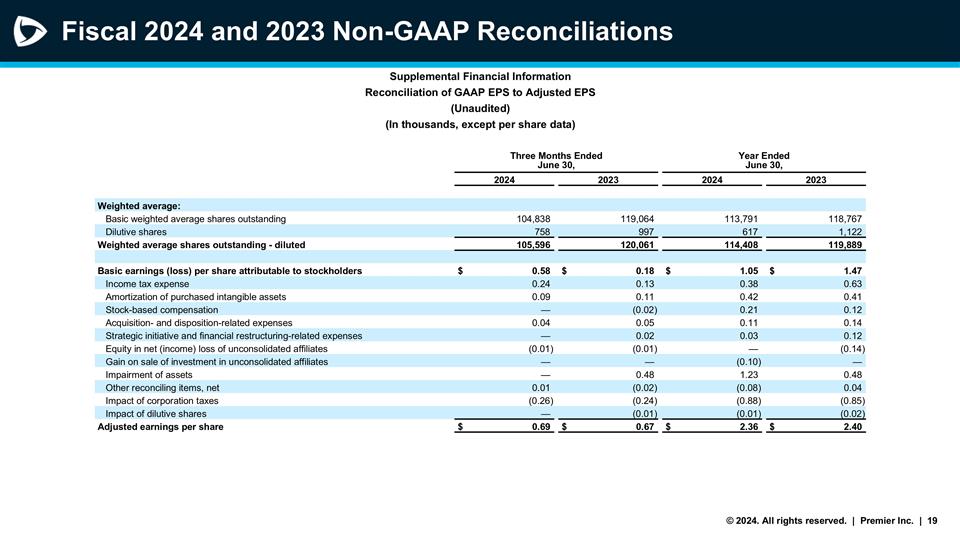
Fiscal 2024 and 2023 Non-GAAP Reconciliations Supplemental Financial Information Reconciliation of GAAP EPS to Adjusted EPS (Unaudited) (In thousands, except per share data) Three Months Ended June 30, Year Ended June 30, 2024 2023 2024 2023 Weighted average: Basic weighted average shares outstanding 104,838 119,064 113,791 118,767 Dilutive shares 758 997 617 1,122 Weighted average shares outstanding - diluted 105,596 120,061 114,408 119,889 Basic earnings (loss) per share attributable to stockholders $0.58 $0.18 $1.05 $1.47 Income tax expense 0.24 0.13 0.38 0.63 Amortization of purchased intangible assets 0.09 0.11 0.42 0.41 Stock-based compensation — (0.02) 0.21 0.12 Acquisition- and disposition-related expenses 0.04 0.05 0.11 0.14 Strategic initiative and financial restructuring-related expenses — 0.02 0.03 0.12 Equity in net (income) loss of unconsolidated affiliates (0.01) (0.01) — (0.14) Gain on sale of investment in unconsolidated affiliates — — (0.10) — Impairment of assets — 0.48 1.23 0.48 Other reconciling items, net 0.01 (0.02) (0.08) 0.04 Impact of corporation taxes (0.26) (0.24) (0.88) (0.85) Impact of dilutive shares — (0.01) (0.01) (0.02) Adjusted earnings per share $0.69 $0.67 $2.36 $2.40


