Exhibit (C)(5)
|
Preliminary Draft –
Confidential
The Conflicts Committee of the Board of Directors of Midcoast Holdings, L.L.C.
Discussion Materials January 26, 2016
Evercore
|
Preliminary Draft – Confidential These materials have been prepared by Evercore Group L.L.C. (“Evercore”) for the Conflicts Committee of the Board of Directors (the “Conflicts Committee”) of Midcoast Holdings, L.L.C., the general partner of Midcoast Energy Partners, L.P. (“MEP” or the “Partnership”), to whom such materials are directly addressed and delivered and may not be used or relied upon by any other party or for any purpose other than as specifically contemplated by a written agreement with Evercore. These materials are based on information provided by or on behalf of the Conflicts Committee, from public sources or otherwise reviewed by Evercore. Evercore assumes no responsibility for independent investigation or verification of such information and has relied on such information being complete and accurate in all material respects. To the extent such information includes estimates and forecasts of future financial performance prepared by or reviewed with the management of MEP and/or other potential transaction participants or obtained from public sources, Evercore has assumed that such estimates and forecasts have been reasonably prepared on bases reflecting the best currently available estimates and judgments of such management (or, with respect to estimates and forecasts obtained from public sources, represent reasonable estimates). No representation or warranty, express or implied, is made as to the accuracy or completeness of such information and nothing contained herein is, or shall be relied upon as, a representation, whether as to the past, the present or the future. These materials were designed for use by specific persons familiar with the business and affairs of MEP. These materials are not intended to provide the sole basis for evaluating, and should not be considered a recommendation with respect to, any transaction or other matter. These materials have been developed by and are proprietary to Evercore and were prepared exclusively for the benefit and internal use of the Conflicts Committee. These materials were compiled on a confidential basis for the sole use of the Conflicts Committee and not with a view to public disclosure or filing thereof under state or federal securities laws, and may not be reproduced, disseminated, quoted or referred to, in whole or in part, without the prior written consent of Evercore. These materials do not constitute an offer or solicitation to sell or purchase any securities and are not a commitment by Evercore or any of its affiliates to provide or arrange any financing for any transaction or to purchase any security in connection therewith. Evercore assumes no obligation to update or otherwise revise these materials. These materials may not reflect information known to other professionals in other business areas of Evercore and its affiliates. Evercore and its affiliates do not provide legal, accounting, tax or regulatory advice. Accordingly, any statements contained herein as to tax matters were neither written nor intended by Evercore or its affiliates to be used and cannot be used by any taxpayer for the purpose of avoiding tax penalties that may be imposed on such taxpayer. Each person should seek legal, accounting, tax and regulatory advice based on his, her or its particular circumstances from independent advisors regarding the impact of the transactions or matters described herein.
|
Preliminary Draft –
Confidential
Table of Contents
Section
Executive Summary I
Midcoast Situation Analysis II Midcoast Valuation III Summary of Sale Process IV
Appendix A. Weighted Average Cost of Capital Analysis B. Midcoast Financial Projections C. Tax Input to Unitholders D. Midcoast Peer Group Trading Comparison
|

Preliminary Draft –
Confidential
I. Executive Summary
|
Preliminary Draft – Confidential Executive Summary Introduction Evercore Group L.L.C. (“Evercore”) is pleased to provide the materials herein to the Conflicts Committee of the Board of Directors (the “Conflicts Committee”) of Midcoast Holdings, L.L.C. (“Partnership GP”), the general partner of Midcoast Energy Partners, L.P. (“MEP”, “Midcoast” or the “Partnership”) regarding the proposed merger of the Partnership with a wholly owned subsidiary of Enbridge Energy Company, Inc., which in turn is a wholly owned subsidiary of Enbridge Inc. (“ENB”) (the “Proposed Transaction” or “Project Leather”) As part of the Proposed Transaction, ENB has proposed to acquire for cash each publicly-owned common unit of MEP for an amount equal to $8.00 per unit (the “Proposed Consideration”) • The Proposed Consideration represents a 8.0% discount to MEP’s closing unit price of $8.70 as of January 25, 2017 • The Proposed Consideration represents a 6.9% premium to MEP’s30-day volume weighted-average unit price of $7.48 as of January 25, 2017 The Proposed Transaction is subject to the negotiation and approval of the definitive merger agreement (the “Merger Agreement”) and approval by Partnership GP’s board of directors, the board of directors of the general partner of Enbridge Energy Partners, L.P. (“EEP”), the Conflicts Committee and a majority of MEP’s unitholders • As currently contemplated, MEP management expects the Board of Directors of Midcoast Holdings, L.L.C. to declare a quarterly cash distribution on all of its outstanding common and subordinated units for the quarter ending December 31, 2016 in conjunction with the Proposed Transaction • EEP’s subordinated units will be converted into common units one business day after such distribution payment in February 2017, which will result in EEP holding 53% of MEP’s common units and give EEP the ability to approve the Proposed Transaction by written consent 1
|
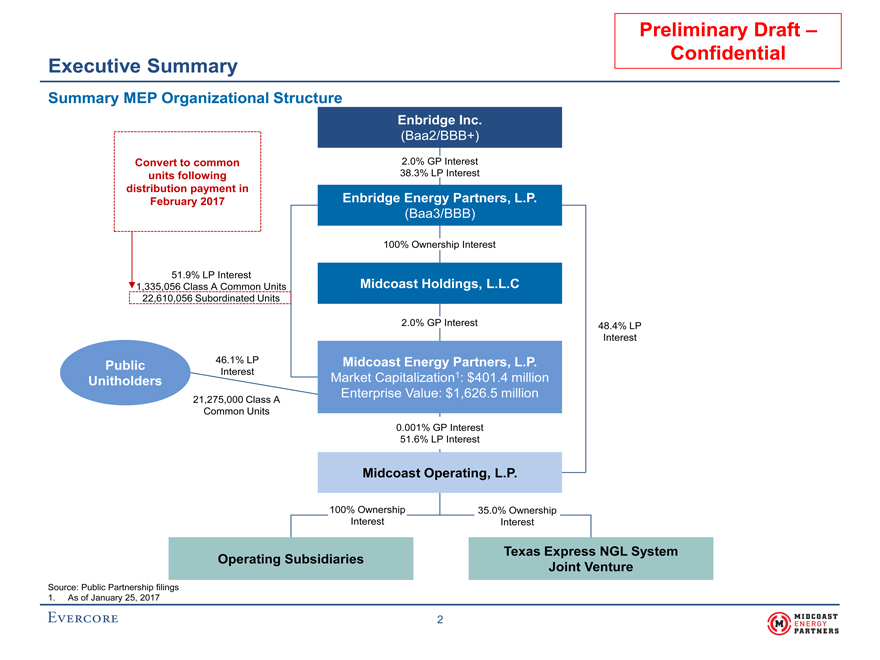
Preliminary Draft – Confidential Executive Summary Summary MEP Organizational Structure Enbridge Inc. (Baa2/BBB+) Convert to common 2.0% GP Interest units following 38.3% LP Interest distribution payment in February 2017 Enbridge Energy Partners, L.P. (Baa3/BBB) 100% Ownership Interest 51.9% LP Interest 1,335,056 Class A Common Units Midcoast Holdings, L.L.C 22,610,056 Subordinated Units 2.0% GP Interest 48.4% LP Interest Public 46.1% LP Midcoast Energy Partners, L.P. Interest Market Capitalization1: $401.4 million Unitholders Enterprise Value: $1,626.5 million 21,275,000 Class A Common Units 0.001% GP Interest 51.6% LP Interest Midcoast Operating, L.P. 100% Ownership 35.0% Ownership Interest Interest Texas Express NGL System Operating Subsidiaries Joint Venture Source: Public Partnership filings 1. As of January 25, 2017 2
|
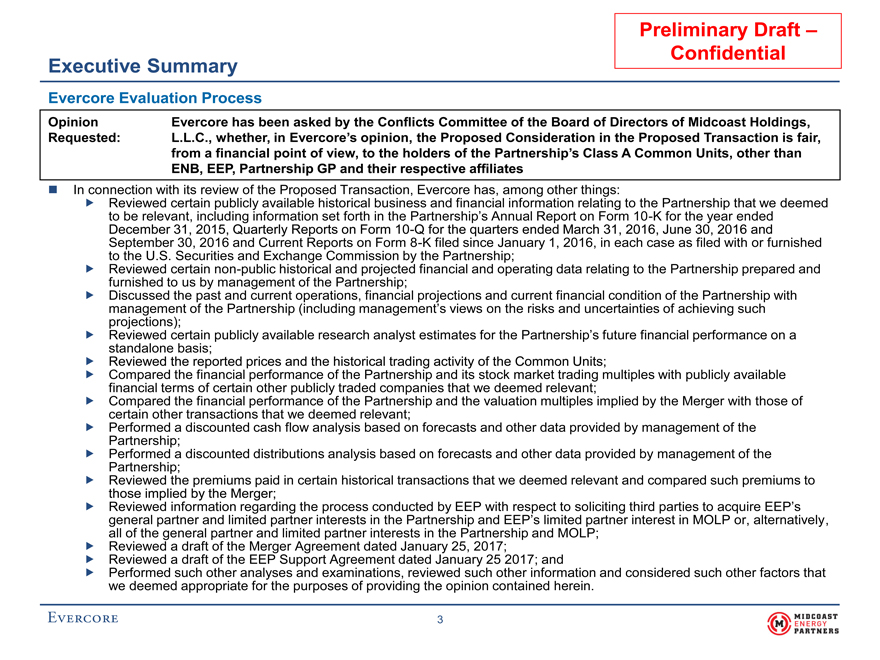
Preliminary Draft – Confidential Executive Summary Evercore Evaluation Process Opinion Evercore has been asked by the Conflicts Committee of the Board of Directors of Midcoast Holdings, Requested: L.L.C., whether, in Evercore’s opinion, the Proposed Consideration in the Proposed Transaction is fair, from a financial point of view, to the holders of the Partnership’s Class A Common Units, other than ENB, EEP, Partnership GP and their respective affiliates In connection with its review of the Proposed Transaction, Evercore has, among other things: Reviewed certain publicly available historical business and financial information relating to the Partnership that we deemed to be relevant, including information set forth in the Partnership’s Annual Report on Form10-K for the year ended December 31, 2015, Quarterly Reports on Form10-Q for the quarters ended March 31, 2016, June 30, 2016 and September 30, 2016 and Current Reports on Form8-K filed since January 1, 2016, in each case as filed with or furnished to the U.S. Securities and Exchange Commission by the Partnership; Reviewed certainnon-public historical and projected financial and operating data relating to the Partnership prepared and furnished to us by management of the Partnership; Discussed the past and current operations, financial projections and current financial condition of the Partnership with management of the Partnership (including management’s views on the risks and uncertainties of achieving such projections); Reviewed certain publicly available research analyst estimates for the Partnership’s future financial performance on a standalone basis; Reviewed the reported prices and the historical trading activity of the Common Units; Compared the financial performance of the Partnership and its stock market trading multiples with publicly available financial terms of certain other publicly traded companies that we deemed relevant; Compared the financial performance of the Partnership and the valuation multiples implied by the Merger with those of certain other transactions that we deemed relevant; Performed a discounted cash flow analysis based on forecasts and other data provided by management of the Partnership; Performed a discounted distributions analysis based on forecasts and other data provided by management of the Partnership; Reviewed the premiums paid in certain historical transactions that we deemed relevant and compared such premiums to those implied by the Merger; Reviewed information regarding the process conducted by EEP with respect to soliciting third parties to acquire EEP’s general partner and limited partner interests in the Partnership and EEP’s limited partner interest in MOLP or, alternatively, all of the general partner and limited partner interests in the Partnership and MOLP; Reviewed a draft of the Merger Agreement dated January 25, 2017; Reviewed a draft of the EEP Support Agreement dated January 25 2017; and Performed such other analyses and examinations, reviewed such other information and considered such other factors that we deemed appropriate for the purposes of providing the opinion contained herein. 3
|
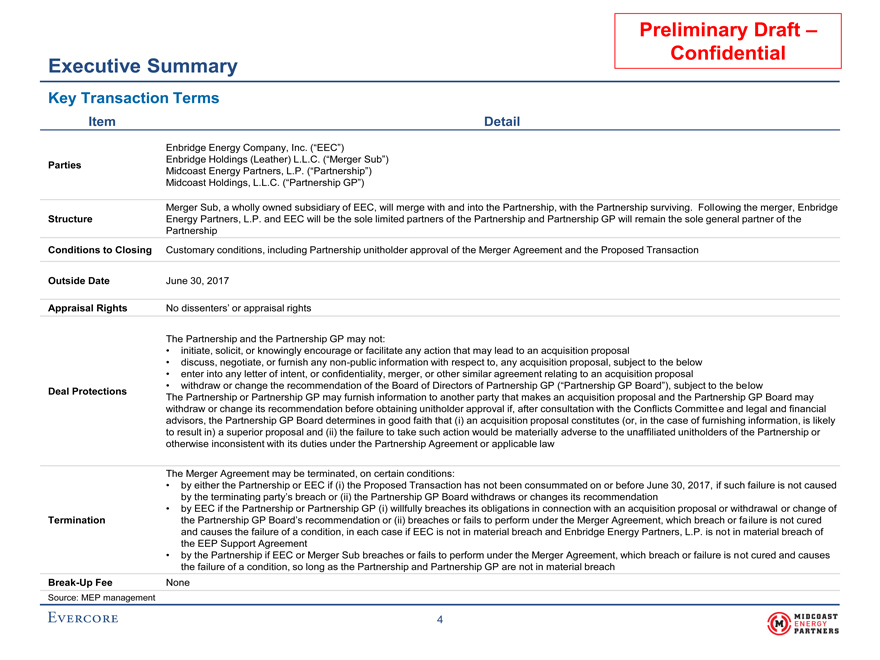
Confidential Executive Summary Key Transaction Terms Item Detail Enbridge Energy Company, Inc. (“EEC”) Enbridge Holdings (Leather) L.L.C. (“Merger Sub”) Parties Midcoast Energy Partners, L.P. (“Partnership”) Midcoast Holdings, L.L.C. (“Partnership GP”) Merger Sub, a wholly owned subsidiary of EEC, will merge with and into the Partnership, with the Partnership surviving. Following the merger, Enbridge Structure Energy Partners, L.P. and EEC will be the sole limited partners of the Partnership and Partnership GP will remain the sole general partner of the Partnership Conditions to Closing Customary conditions, including Partnership unitholder approval of the Merger Agreement and the Proposed Transaction Outside Date June 30, 2017 Appraisal Rights No dissenters’ or appraisal rights The Partnership and the Partnership GP may not: • initiate, solicit, or knowingly encourage or facilitate any action that may lead to an acquisition proposal • discuss, negotiate, or furnish anynon-public information with respect to, any acquisition proposal, subject to the below • enter into any letter of intent, or confidentiality, merger, or other similar agreement relating to an acquisition proposal • withdraw or change the recommendation of the Board of Directors of Partnership GP (“Partnership GP Board”), subject to the below Deal Protections The Partnership or Partnership GP may furnish information to another party that makes an acquisition proposal and the Partnership GP Board may withdraw or change its recommendation before obtaining unitholder approval if, after consultation with the Conflicts Committee and legal and financial advisors, the Partnership GP Board determines in good faith that (i) an acquisition proposal constitutes (or, in the case of furnishing information, is likely to result in) a superior proposal and (ii) the failure to take such action would be materially adverse to the unaffiliated unitholders of the Partnership or otherwise inconsistent with its duties under the Partnership Agreement or applicable law The Merger Agreement may be terminated, on certain conditions: • by either the Partnership or EEC if (i) the Proposed Transaction has not been consummated on or before June 30, 2017, if such failure is not caused by the terminating party’s breach or (ii) the Partnership GP Board withdraws or changes its recommendation • by EEC if the Partnership or Partnership GP (i) willfully breaches its obligations in connection with an acquisition proposal or withdrawal or change of Termination the Partnership GP Board’s recommendation or (ii) breaches or fails to perform under the Merger Agreement, which breach or failure is not cured and causes the failure of a condition, in each case if EEC is not in material breach and Enbridge Energy Partners, L.P. is not in material breach of the EEP Support Agreement • by the Partnership if EEC or Merger Sub breaches or fails to perform under the Merger Agreement, which breach or failure is not cured and causes the failure of a condition, so long as the Partnership and Partnership GP are not in material breachBreak-Up Fee None Source: MEP management 4
|
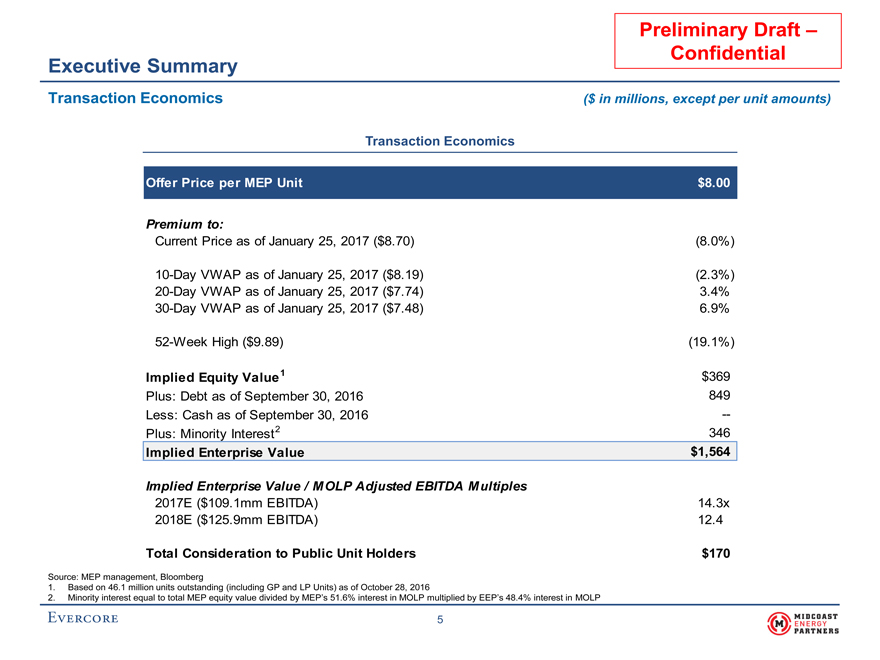
Preliminary Draft – Confidential Executive Summary Transaction Economics ($ in millions, except per unit amounts) Transaction Economics Offer Price per MEP Unit $8.00 Premium to: Current Price as of January 25, 2017 ($8.70) (8.0%)10-Day VWAP as of January 25, 2017 ($8.19) (2.3%)20-Day VWAP as of January 25, 2017 ($7.74) 3.4%30-Day VWAP as of January 25, 2017 ($7.48) 6.9%52-Week High ($9.89) (19.1%) Implied Equity Value1 $369 Plus: Debt as of September 30, 2016 849 Less: Cash as of September 30, 2016 --Plus: Minority Interest2 346 Implied Enterprise Value $1,564 Implied Enterprise Value / MOLP Adjusted EBITDA Multiples 2017E ($109.1mm EBITDA) 14.3x 2018E ($125.9mm EBITDA) 12.4 Total Consideration to Public Unit Holders $170 Source: MEP management, Bloomberg 1. Based on 46.1 million units outstanding (including GP and LP Units) as of October 28, 2016 2. Minority interest equal to total MEP equity value divided by MEP’s 51.6% interest in MOLP multiplied by EEP’s 48.4% interest in MOLP 5
|
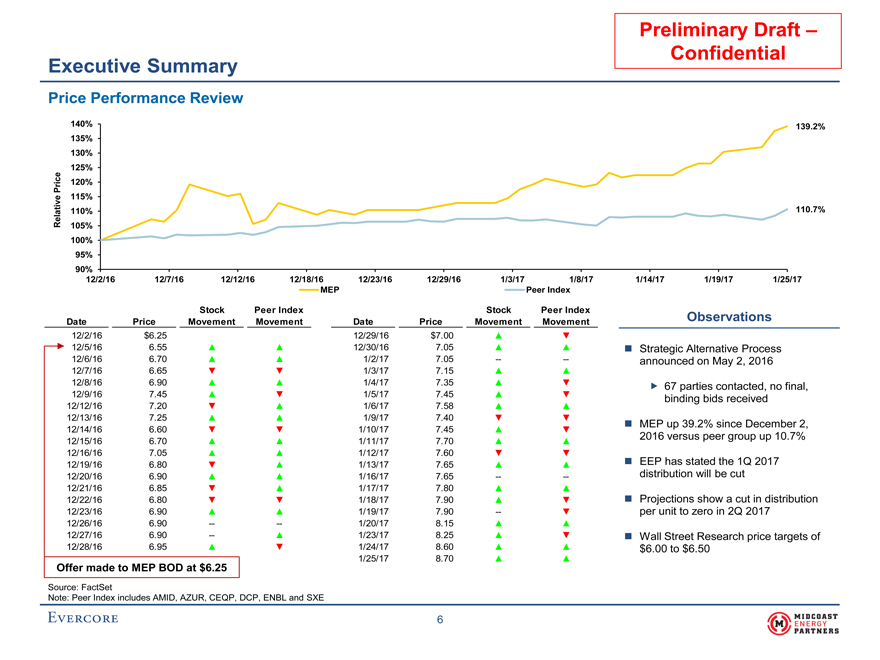
Preliminary Draft – Confidential Executive Summary Price Performance Review 140% 139.2% 135% 130% 125% Price 120% 115% Relative 110% 110.7% 105% 100% 95% 90% 12/2/16 12/7/16 12/12/16 12/18/16 12/23/16 12/29/16 1/3/17 1/8/17 1/14/17 1/19/17 1/25/17 MEP Peer Index Stock Peer Index Stock Peer Index Date Price Movement Movement Date Price Movement Movement Observations 12/2/16 $6.25 12/29/16 $7.00 12/5/16 6.55 12/30/16 7.05 Strategic Alternative Process 12/6/16 6.70 1/2/17 7.05 -- -- announced on May 2, 2016 12/7/16 6.65 1/3/17 7.15 12/8/16 6.90 1/4/17 7.35 67 parties contacted, no final, 12/9/16 7.45 1/5/17 7.45 binding bids received 12/12/16 7.20 1/6/17 7.58 12/13/16 7.25 1/9/17 7.40 MEP up 39.2% since December 2, 12/14/16 6.60 1/10/17 7.45 2016 versus peer group up 10.7% 12/15/16 6.70 1/11/17 7.70 12/16/16 7.05 1/12/17 7.60 EEP has stated the 12/19/16 6.80 1/13/17 7.65 1Q 2017 12/20/16 6.90 1/16/17 7.65 -- -- distribution will be cut 12/21/16 6.85 1/17/17 7.80 12/22/16 6.80 1/18/17 7.90 Projections show a cut in distribution 12/23/16 6.90 1/19/17 7.90 -- per unit to zero in 2Q 2017 12/26/16 6.90 -- -- 1/20/17 8.15 12/27/16 6.90 -- 1/23/17 8.25 Wall Street Research price targets of 12/28/16 6.95 1/24/17 8.60 $6.00 to $6.50 Offer made to MEP BOD at $6.25 1/25/17 8.70 Source: FactSet Note: Peer Index includes AMID, AZUR, CEQP, DCP, ENBL and SXE 6
|
Preliminary Draft –
Confidential
II. Midcoast Situation Analysis
|
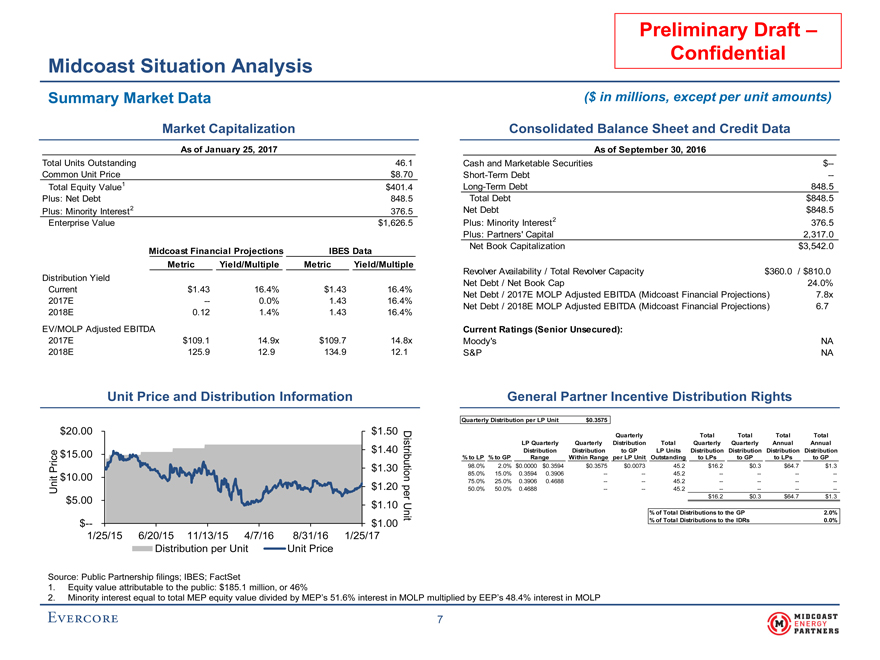
Preliminary Draft – Confidential Midcoast Situation Analysis Summary Market Data ($ in millions, except per unit amounts) Market Capitalization Consolidated Balance Sheet and Credit Data As of January 25, 2017 As of September 30, 2016 Total Units Outstanding 46.1 Cash and Marketable Securities $-- Common Unit Price $8.70 Short-Term Debt --Total Equity Value1 $401.4 Long-Term Debt 848.5 Plus: Net Debt 848.5 Total Debt $848.5 Plus: Minority Interest2 376.5 Net Debt $848.5 Enterprise Value $1,626.5 Plus: Minority Interest2 376.5 Plus: Partners’ Capital 2,317.0 Net Book Capitalization $3,542.0 Midcoast Financial Projections IBES Data Metric Yield/Multiple Metric Yield/Multiple Revolver Availability / Total Revolver Capacity $360.0 / $810.0 Distribution Yield Net Debt / Net Book Cap 24.0% Current $1.43 16.4% $1.43 16.4% Net Debt / 2017E MOLP Adjusted EBITDA (Midcoast Financial Projections) 7.8x 2017E -- 0.0% 1.43 16.4% Net Debt / 2018E MOLP Adjusted EBITDA (Midcoast Financial Projections) 6.7 2018E 0.12 1.4% 1.43 16.4% EV/MOLP Adjusted EBITDA Current Ratings (Senior Unsecured): 2017E $109.1 14.9x $109.7 14.8x Moody’s NA 2018E 125.9 12.9 134.9 12.1 S&P NA Unit Price and Distribution Information General Partner Incentive Distribution Rights Quarterly Distribution per LP Unit $0.3575 $20.00 $1.50 Quarterly Total Total Total Total LP Quarterly Quarterly Distribution Total Quarterly Quarterly Annual Annual $15.00 $1.40 Distribution Distribution to GP LP Units Distribution Distribution Distribution Distribution % to LP % to GP Range Within Range per LP Unit Outstanding to LPs to GP to LPs to GP Price $1.30 98.0% 2.0% $0.0000 $0.3594 $0.3575 $0.0073 45.2 $16.2 $0.3 $64.7 $1.3 $10.00 Distribution 85.0% 15.0% 0.3594 0.3906 -- -- 45.2 -- -- -- -- 75.0% 25.0% 0.3906 0.4688 -- -- 45.2 -- -- -- --Unit $1.20 pe 50.0% 50.0% 0.4688 -- -- 45.2 -- -- ----r $16.2 $0.3 $64.7 $1.3 $5.00 $1.10 Uni % of Total Distributions to the GP 2.0% $-- $1.00 t % of Total Distributions to the IDRs 0.0% 1/25/15 6/20/15 11/13/15 4/7/16 8/31/16 1/25/17 Distribution per Unit Unit Price Source: Public Partnership filings; IBES; FactSet 1. Equity value attributable to the public: $185.1 million, or 46% 2. Minority interest equal to total MEP equity value divided by MEP’s 51.6% interest in MOLP multiplied by EEP’s 48.4% interest in MOLP 7
|
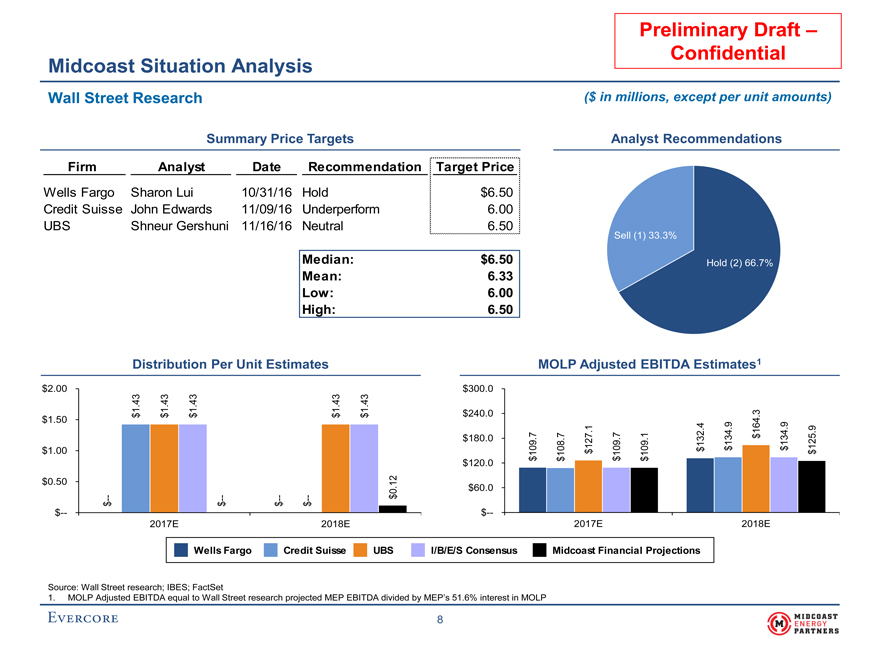
Preliminary Draft – Confidential Midcoast Situation Analysis Wall Street Research ($ in millions, except per unit amounts) Summary Price Targets Analyst Recommendations Firm Analyst Date Recommendation Target Price Wells Fargo Sharon Lui 10/31/16 Hold $6.50 Credit Suisse John Edwards 11/09/16 Underperform 6.00 UBS Shneur Gershuni 11/16/16 Neutral 6.50 Sell (1) 33.3% Median: $6.50 Hold (2) 66.7% Mean: 6.33 Low: 6.00 High: 6.50 Distribution Per Unit Estimates MOLP Adjusted EBITDA Estimates1 $2.00 $300.0 1.43 1.43 1.43 1.43 1.43 $ $ $ $ $ $240.0 $1.50 164.3 $180.0 127.1 132.4 134.9 $ 134.9 125.9 $1.00 $ $ $ 109.7 108.7 $ 109.7 109.1 $ $120.0 $ $ $ $ $0.50 0.12 $60.0 -- -- -- -- $ $ $ $ $ $-- $-- 2017E 2018E 2017E 2018E Wells Fargo Credit Suisse UBS I/B/E/S Consensus Midcoast Financial Projections Source: Wall Street research; IBES; FactSet 1. MOLP Adjusted EBITDA equal to Wall Street research projected MEP EBITDA divided by MEP’s 51.6% interest in MOLP 8
|
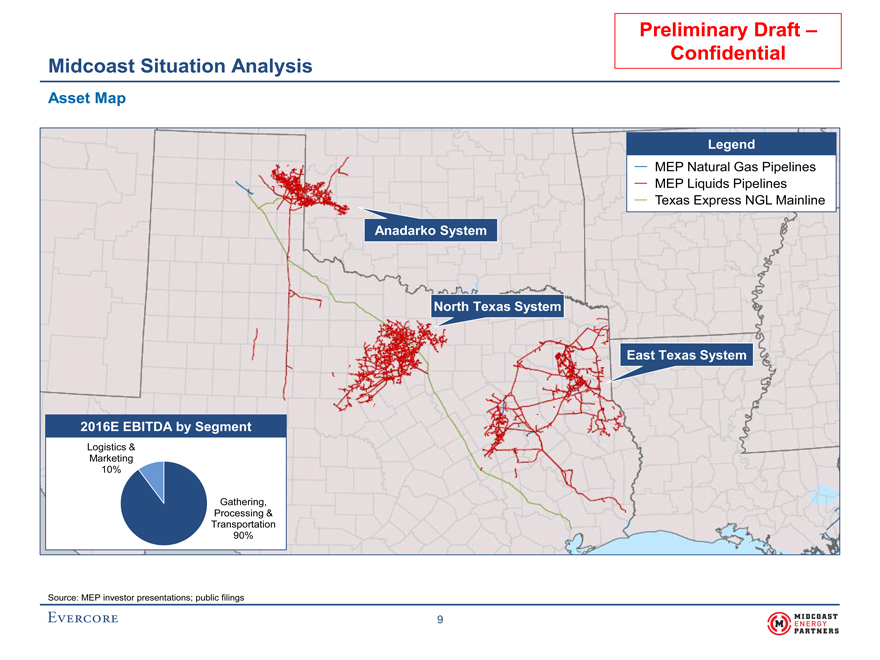
Preliminary Draft – Confidential Midcoast Situation Analysis Asset Map Legend MEP Natural Gas Pipelines MEP Liquids Pipelines Texas Express NGL Mainline Anadarko System North Texas System East Texas System 2016E EBITDA by Segment Logistics & Marketing 10% Gathering, Processing & Transportation 90% Source: MEP investor presentations; public filings 9
|
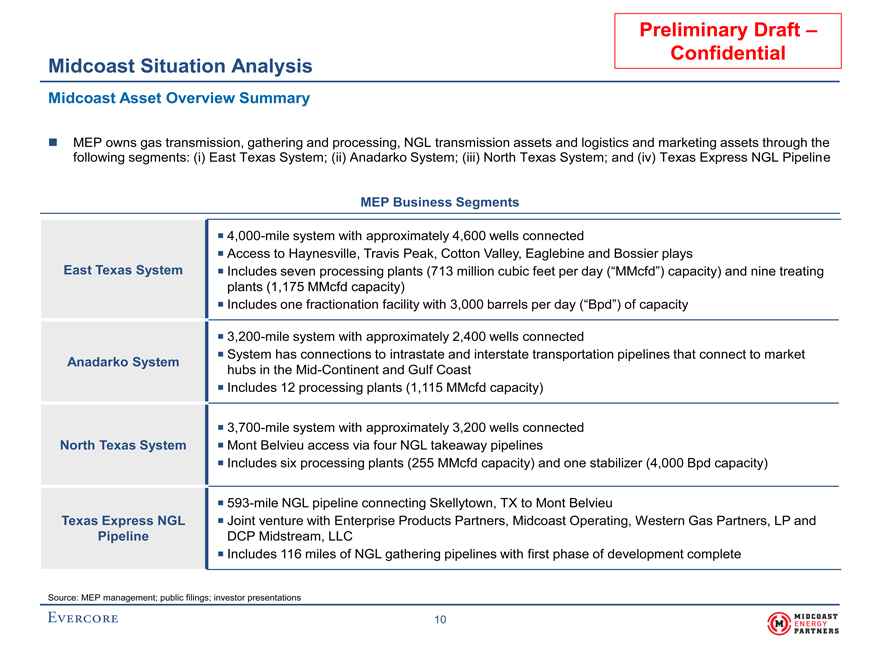
Preliminary Draft – Confidential Midcoast Situation Analysis Midcoast Asset Overview Summary MEP owns gas transmission, gathering and processing, NGL transmission assets and logistics and marketing assets through the following segments: (i) East Texas System; (ii) Anadarko System; (iii) North Texas System; and (iv) Texas Express NGL Pipeline MEP Business Segments 4,000-mile system with approximately 4,600 wells connected Access to Haynesville, Travis Peak, Cotton Valley, Eaglebine and Bossier plays East Texas System Includes seven processing plants (713 million cubic feet per day (“MMcfd”) capacity) and nine treating plants (1,175 MMcfd capacity) Includes one fractionation facility with 3,000 barrels per day (“Bpd”) of capacity3,200-mile system with approximately 2,400 wells connected System has connections to intrastate and interstate transportation pipelines that connect to market Anadarko System hubs in theMid-Continent and Gulf Coast Includes 12 processing plants (1,115 MMcfd capacity)3,700-mile system with approximately 3,200 wells connected North Texas System Mont Belvieu access via four NGL takeaway pipelines Includes six processing plants (255 MMcfd capacity) and one stabilizer (4,000 Bpd capacity)593-mile NGL pipeline connecting Skellytown, TX to Mont Belvieu Texas Express NGL Joint venture with Enterprise Products Partners, Midcoast Operating, Western Gas Partners, LP and Pipeline DCP Midstream, LLC Includes 116 miles of NGL gathering pipelines with first phase of development complete Source: MEP management; public filings; investor presentations 10
|
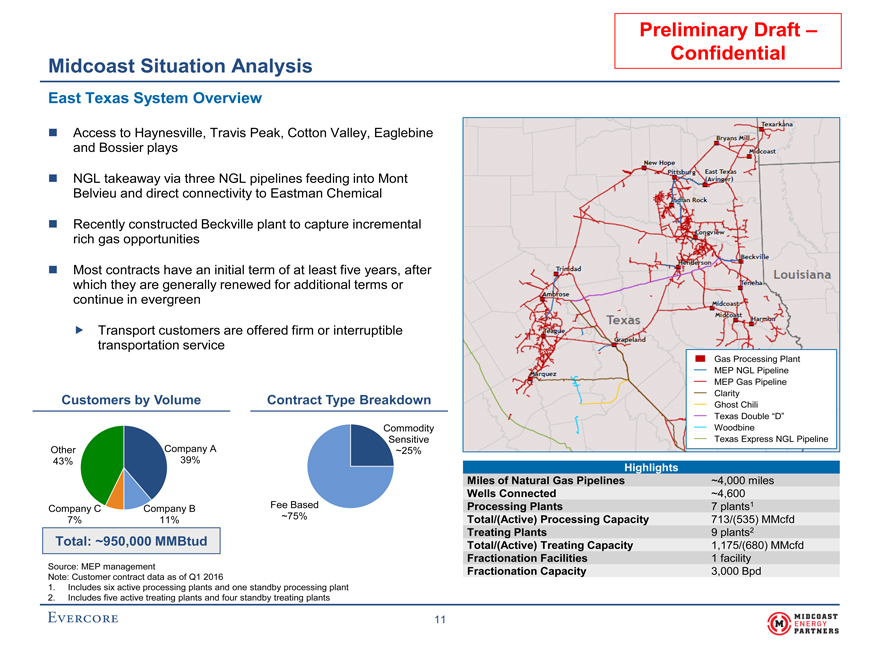
Preliminary Draft – Confidential Midcoast Situation Analysis East Texas System Overview Access to Haynesville, Travis Peak, Cotton Valley, Eaglebine and Bossier plays NGL takeaway via three NGL pipelines feeding into Mont Belvieu and direct connectivity to Eastman Chemical Recently constructed Beckville plant to capture incremental rich gas opportunities Most contracts have an initial term of at least five years, after which they are generally renewed for additional terms or continue in evergreen Transport customers are offered firm or interruptible transportation service Gas Processing Plant MEP NGL Pipeline MEP Gas Pipeline Clarity Customers by Volume Contract Type Breakdown Ghost Chili Texas Double “D” Commodity Woodbine Sensitive Texas Express NGL Pipeline Other Company A ~25% 43% 39% Highlights Miles of Natural Gas Pipelines ~4,000 miles Wells Connected ~4,600 Company C Company B Fee Based Processing Plants 7 plants1 7% 11% ~75% Total/(Active) Processing Capacity 713/(535) MMcfd Treating Plants 9 plants2 Total: ~950,000 MMBtud Total/(Active) Treating Capacity 1,175/(680) MMcfd Source: MEP management Fractionation Facilities 1 facility Fractionation Capacity 3,000 Bpd Note: Customer contract data as of Q1 2016 1. Includes six active processing plants and one standby processing plant 2. Includes five active treating plants and four standby treating plants 11
|
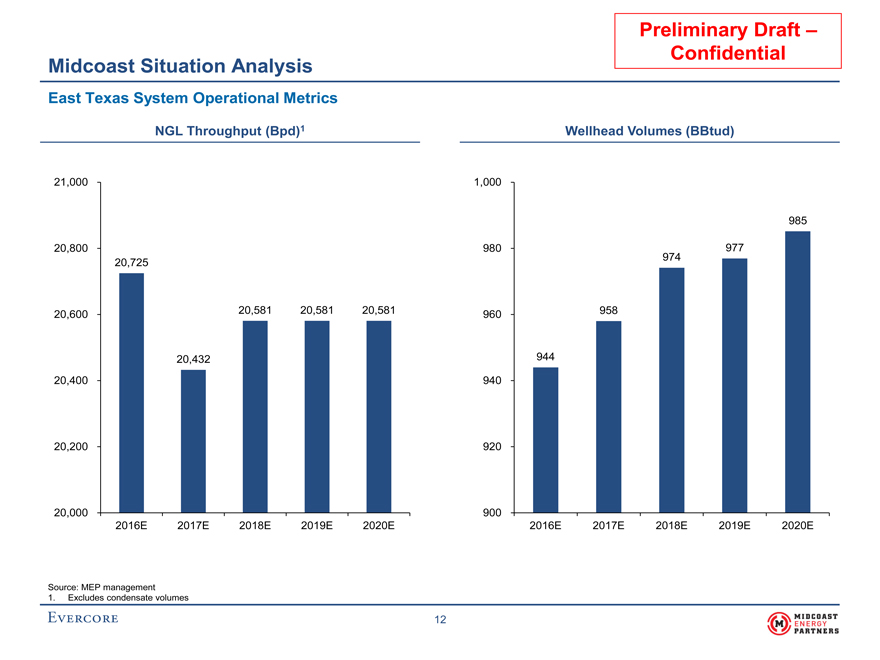
Preliminary Draft – Confidential Midcoast Situation Analysis East Texas System Operational Metrics NGL Throughput (Bpd)1 Wellhead Volumes (BBtud) 21,000 1,000 985 20,800 980 974 977 20,725 20,600 20,581 20,581 20,581 960 958 20,432 944 20,400 940 20,200 920 20,000 900 2016E 2017E 2018E 2019E 2020E 2016E 2017E 2018E 2019E 2020E Source: MEP management 1. Excludes condensate volumes
12
|
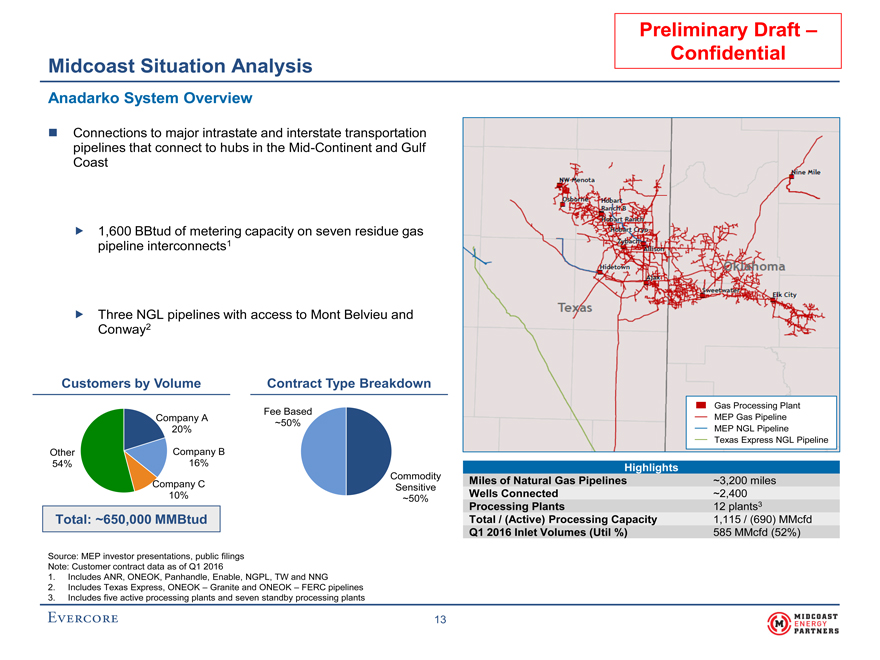
Preliminary Draft – Confidential Midcoast Situation Analysis Anadarko System Overview Connections to major intrastate and interstate transportation pipelines that connect to hubs in theMid-Continent and Gulf Coast 1,600 BBtud of metering capacity on seven residue gas pipeline interconnects1 Three NGL pipelines with access to Mont Belvieu and Conway2 Customers by Volume Contract Type Breakdown Gas Processing Plant Fee Based Company A MEP Gas Pipeline ~50% 20% MEP NGL Pipeline Texas Express NGL Pipeline Other Company B 54% 16% Highlights Company C Commodity Miles of Natural Gas Pipelines ~3,200 miles Sensitive 10% Wells Connected ~2,400 ~50% Processing Plants 12 plants3 Total: ~650,000 MMBtud Total / (Active) Processing Capacity 1,115 / (690) MMcfd Q1 2016 Inlet Volumes (Util %) 585 MMcfd (52%) Source: MEP investor presentations, public filings Note: Customer contract data as of Q1 2016 1. Includes ANR, ONEOK, Panhandle, Enable, NGPL, TW and NNG 2. Includes Texas Express, ONEOK – Granite and ONEOK – FERC pipelines 3. Includes five active processing plants and seven standby processing plants 13
|
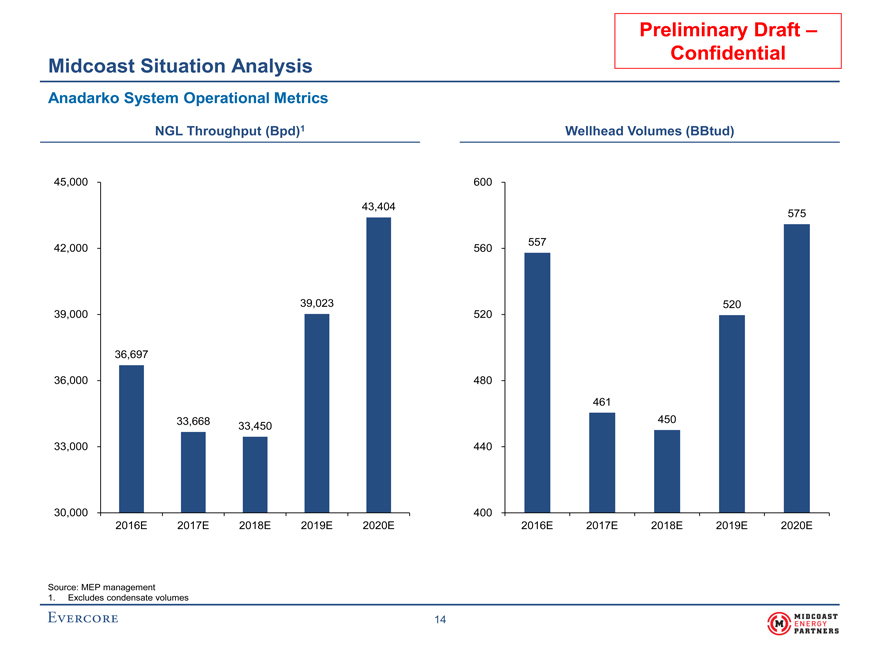
Preliminary Draft – Confidential Midcoast Situation Analysis Anadarko System Operational Metrics NGL Throughput (Bpd)1 Wellhead Volumes (BBtud) 45,000 600 43,404 575 557 42,000 560 39,023 520 39,000 520 36,697 36,000 480 461 33,668 450 33,450 33,000 440 30,000 400 2016E 2017E 2018E 2019E 2020E 2016E 2017E 2018E 2019E 2020E Source: MEP management 1. Excludes condensate volumes 14
|
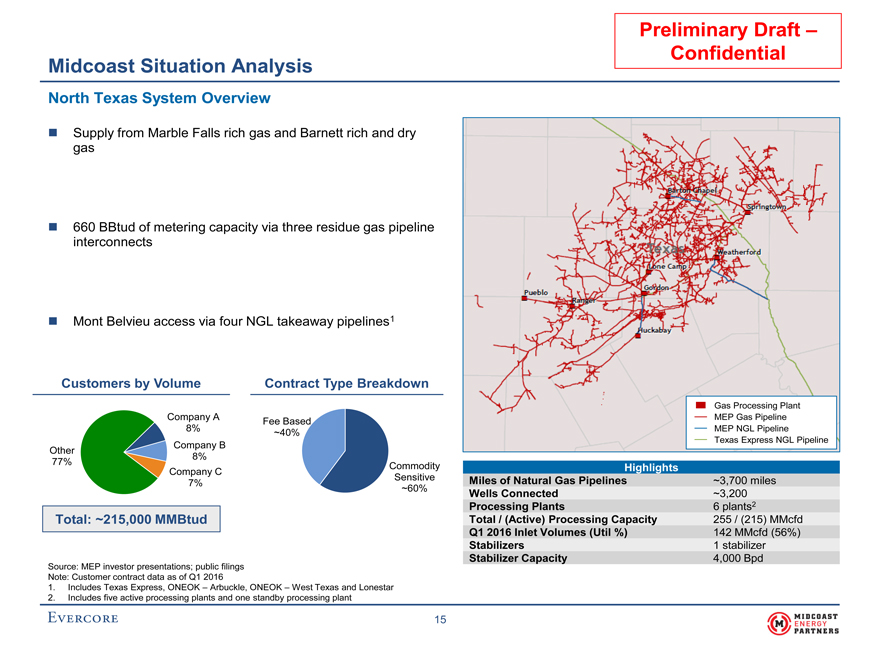
Confidential Midcoast Situation Analysis North Texas System Overview Supply from Marble Falls rich gas and Barnett rich and dry gas 660 BBtud of metering capacity via three residue gas pipeline interconnects Mont Belvieu access via four NGL takeaway pipelines1 Customers by Volume Contract Type Breakdown Gas Processing Plant Company A Fee Based MEP Gas Pipeline 8% ~40% MEP NGL Pipeline Texas Express NGL Pipeline Company B Other 8% 77% Commodity Company C Highlights Sensitive Miles of Natural Gas Pipelines ~3,700 miles 7% ~60% Wells Connected ~3,200 Processing Plants 6 plants2 Total: ~215,000 MMBtud Total / (Active) Processing Capacity 255 / (215) MMcfd Q1 2016 Inlet Volumes (Util %) 142 MMcfd (56%) Stabilizers 1 stabilizer Source: MEP investor presentations; public filings Stabilizer Capacity 4,000 Bpd Note: Customer contract data as of Q1 2016 1. Includes Texas Express, ONEOK – Arbuckle, ONEOK – West Texas and Lonestar 2. Includes five active processing plants and one standby processing plant 15
|
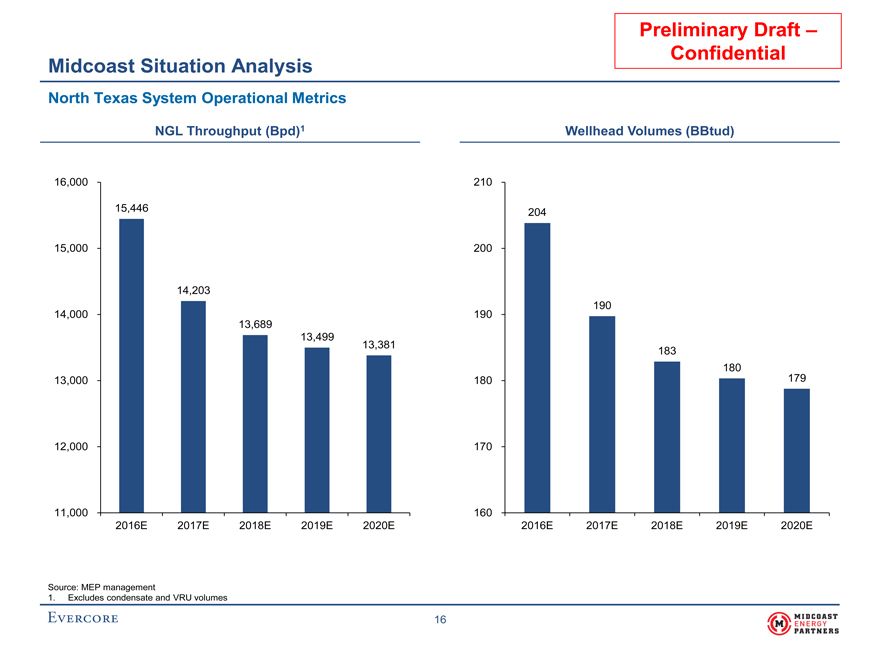
Preliminary Draft – Confidential Midcoast Situation Analysis North Texas System Operational Metrics NGL Throughput (Bpd)1 Wellhead Volumes (BBtud) 16,000 210 15,446 204 15,000 200 14,203 190 14,000 190 13,689 13,499 13,381 183 180 13,000 180 179 12,000 170 11,000 160 2016E 2017E 2018E 2019E 2020E 2016E 2017E 2018E 2019E 2020E Source: MEP management 1. Excludes condensate and VRU volumes 16
|
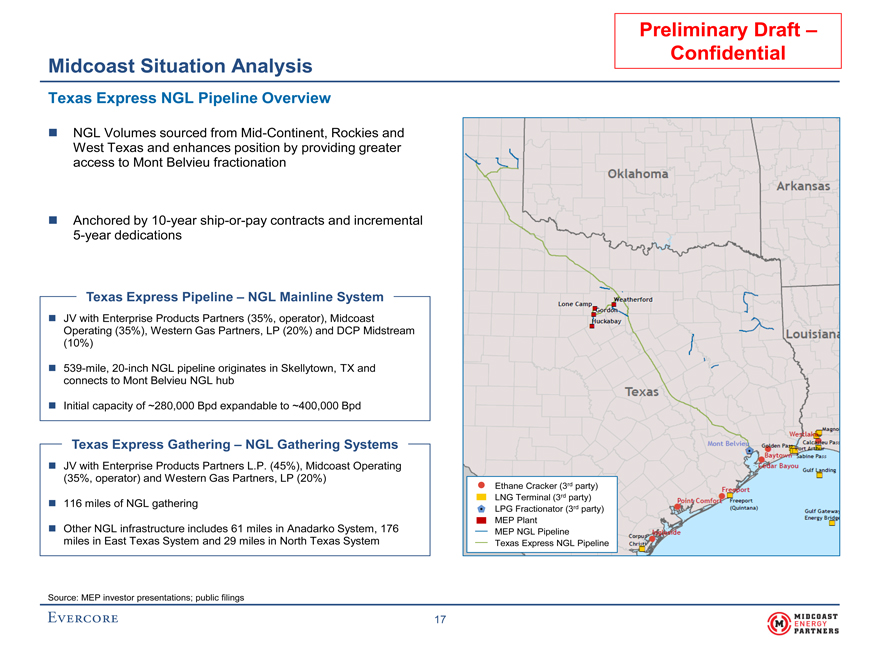
Preliminary Draft – Confidential Midcoast Situation Analysis Texas Express NGL Pipeline Overview NGL Volumes sourced fromMid-Continent, Rockies and West Texas and enhances position by providing greater access to Mont Belvieu fractionation Anchored by10-yearship-or-pay contracts and incremental5-year dedications Texas Express Pipeline – NGL Mainline System JV with Enterprise Products Partners (35%, operator), Midcoast Operating (35%), Western Gas Partners, LP (20%) and DCP Midstream(10%) 539-mile,20-inch NGL pipeline originates in Skellytown, TX and connects to Mont Belvieu NGL hub Initial capacity of ~280,000 Bpd expandable to ~400,000 Bpd Texas Express Gathering – NGL Gathering Systems JV with Enterprise Products Partners L.P. (45%), Midcoast Operating (35%, operator) and Western Gas Partners, LP (20%) Ethane Cracker (3rd party) 116 miles of NGL gathering LNG Terminal (3rd party) LPG Fractionator (3rd party) includes 61 miles in Anadarko System, 176 MEP Plant Other NGL infrastructure MEP NGL Pipeline miles in East Texas System and 29 miles in North Texas System Texas Express NGL Pipeline Source: MEP investor presentations; public filings 17
|
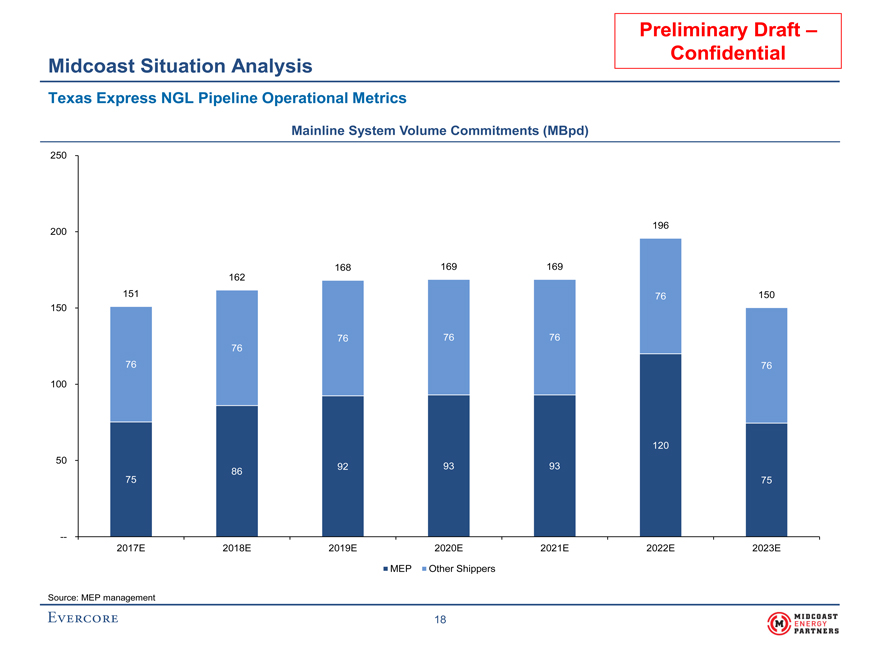
Preliminary Draft – Confidential Midcoast Situation Analysis Texas Express NGL Pipeline Operational Metrics Mainline System Volume Commitments (MBpd) 250 196 200 168 169 169 162 151 76 150 150 76 76 76 76 76 76 100 120 50 92 93 93 75 86 75 -- 2017E 2018E 2019E 2020E 2021E 2022E 2023E MEP Other Shippers Source: MEP management
18
|
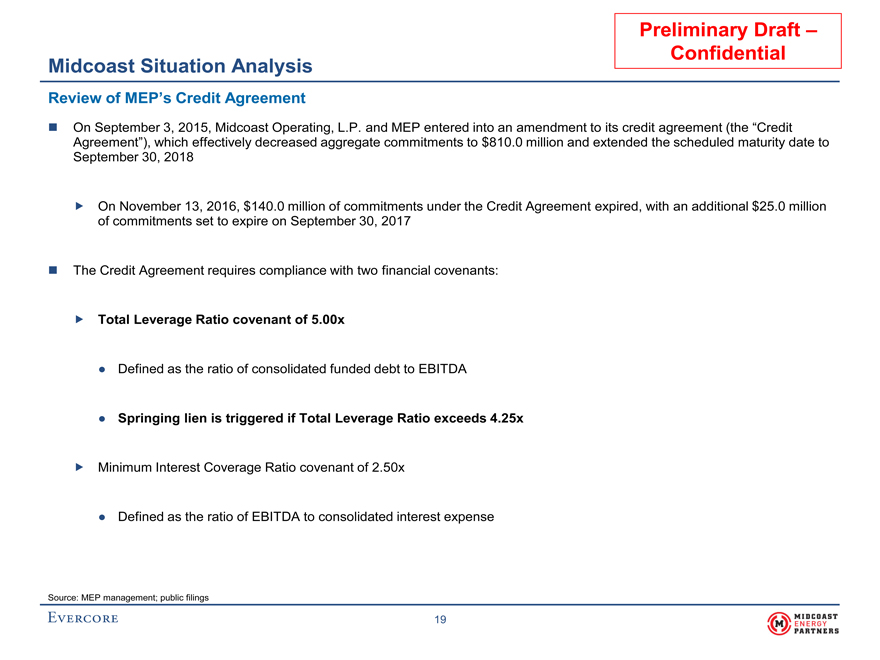
Preliminary Draft – Confidential Midcoast Situation Analysis Review of MEP’s Credit Agreement On September 3, 2015, Midcoast Operating, L.P. and MEP entered into an amendment to its credit agreement (the “Credit Agreement”), which effectively decreased aggregate commitments to $810.0 million and extended the scheduled maturity date to September 30, 2018 On November 13, 2016, $140.0 million of commitments under the Credit Agreement expired, with an additional $25.0 million of commitments set to expire on September 30, 2017 The Credit Agreement requires compliance with two financial covenants: Total Leverage Ratio covenant of 5.00x • Defined as the ratio of consolidated funded debt to EBITDA • Springing lien is triggered if Total Leverage Ratio exceeds 4.25x Minimum Interest Coverage Ratio covenant of 2.50x • Defined as the ratio of EBITDA to consolidated interest expense Source: MEP management; public filings
19
|
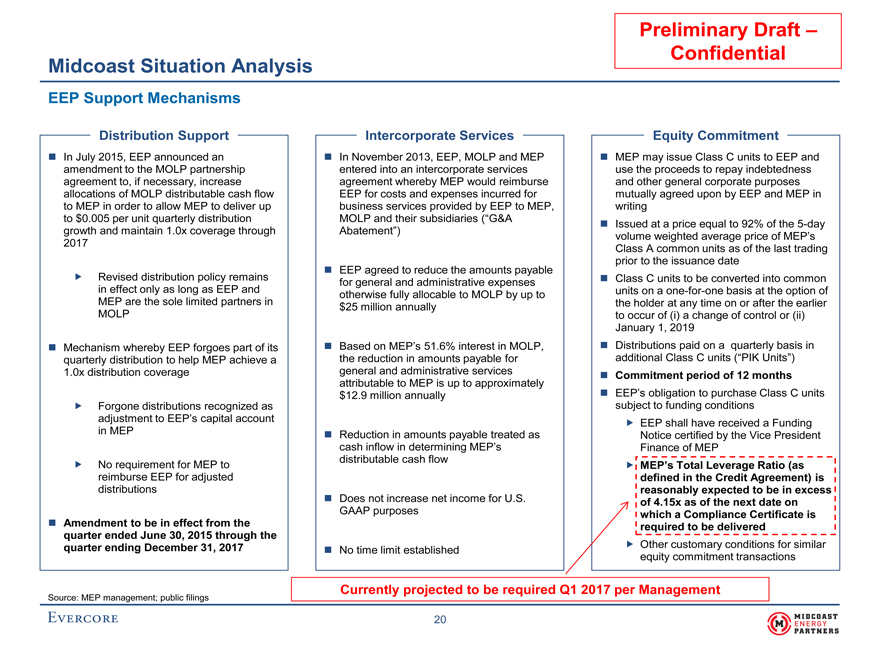
Confidential Midcoast Situation Analysis EEP Support Mechanisms Distribution Support Intercorporate Services Equity Commitment In July 2015, EEP announced an In November 2013, EEP, MOLP and MEP MEP may issue Class C units to EEP and amendment to the MOLP partnership entered into an intercorporate services use the proceeds to repay indebtedness agreement to, if necessary, increase agreement whereby MEP would reimburse and other general corporate purposes allocations of MOLP distributable cash flow EEP for costs and expenses incurred for mutually agreed upon by EEP and MEP in to MEP in order to allow MEP to deliver up business services provided by EEP to MEP, writing to $0.005 per unit quarterly distribution MOLP and their subsidiaries (“G&A Issued at a price equal to 92% of the5-day growth and maintain 1.0x coverage through Abatement”) volume weighted average price of MEP’s 2017 Class A common units as of the last trading EEP agreed to reduce the amounts payable prior to the issuance date Revised distribution policy remains Class C units to be converted into common for general and administrative expenses in effect only as long as EEP and units on aone-for-one basis at the option of otherwise fully allocable to MOLP by up to MEP are the sole limited partners in the holder at any time on or after the earlier $25 million annually MOLP to occur of (i) a change of control or (ii) January 1, 2019 Mechanism whereby EEP forgoes part of its Based on MEP’s 51.6% interest in MOLP, Distributions paid on a quarterly basis in quarterly distribution to help MEP achieve a the reduction in amounts payable for additional Class C units (“PIK Units”) 1.0x distribution coverage general and administrative services Commitment period of 12 months attributable to MEP is up to approximately EEP’s obligation to purchase Class C units $12.9 million annually subject to funding conditions Forgone distributions recognized as adjustment to EEP’s capital account EEP shall have received a Funding in MEP Reduction in amounts payable treated as Notice certified by the Vice President cash inflow in determining MEP’s Finance of MEP distributable cash flow No requirement for MEP to MEP’s Total Leverage Ratio (as reimburse EEP for adjusted defined in the Credit Agreement) is distributions Does not increase net income for U.S. reasonably expected to be in excess of 4.15x as of the next date on GAAP purposes which a Compliance Certificate is Amendment to be in effect from the required to be delivered quarter ended June 30, 2015 through the Other customary conditions for similar quarter ending December 31, 2017 No time limit established equity commitment transactions Currently projected to be required Q1 2017 per Management Source: MEP management; public filings
20
|
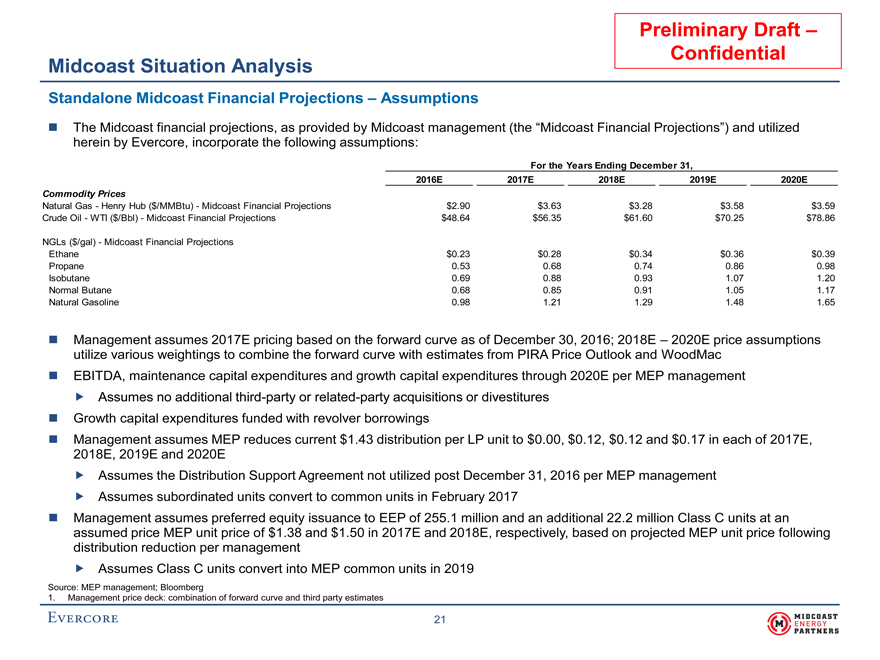
Preliminary Draft – Confidential Midcoast Situation Analysis Standalone Midcoast Financial Projections – Assumptions The Midcoast financial projections, as provided by Midcoast management (the “Midcoast Financial Projections”) and utilized herein by Evercore, incorporate the following assumptions: For the Years Ending December 31, 2016E 2017E 2018E 2019E 2020E Commodity Prices Natural Gas - Henry Hub ($/MMBtu) - Midcoast Financial Projections $2.90 $3.63 $3.28 $3.58 $3.59 Crude Oil - WTI ($/Bbl) - Midcoast Financial Projections $48.64 $56.35 $61.60 $70.25 $78.86 NGLs ($/gal) - Midcoast Financial Projections Ethane $0.23 $0.28 $0.34 $0.36 $0.39 Propane 0.53 0.68 0.74 0.86 0.98 Isobutane 0.69 0.88 0.93 1.07 1.20 Normal Butane 0.68 0.85 0.91 1.05 1.17 Natural Gasoline 0.98 1.21 1.29 1.48 1.65 Management assumes 2017E pricing based on the forward curve as of December 30, 2016; 2018E – 2020E price assumptions utilize various weightings to combine the forward curve with estimates from PIRA Price Outlook and WoodMac EBITDA, maintenance capital expenditures and growth capital expenditures through 2020E per MEP management Assumes no additional third-party or related-party acquisitions or divestitures Growth capital expenditures funded with revolver borrowings Management assumes MEP reduces current $1.43 distribution per LP unit to $0.00, $0.12, $0.12 and $0.17 in each of 2017E, 2018E, 2019E and 2020E Assumes the Distribution Support Agreement not utilized post December 31, 2016 per MEP management Assumes subordinated units convert to common units in February 2017 Management assumes preferred equity issuance to EEP of 255.1 million and an additional 22.2 million Class C units at an assumed price MEP unit price of $1.38 and $1.50 in 2017E and 2018E, respectively, based on projected MEP unit price following distribution reduction per management Assumes Class C units convert into MEP common units in 2019 Source: MEP management; Bloomberg 1. Management price deck: combination of forward curve and third party estimates
21
|
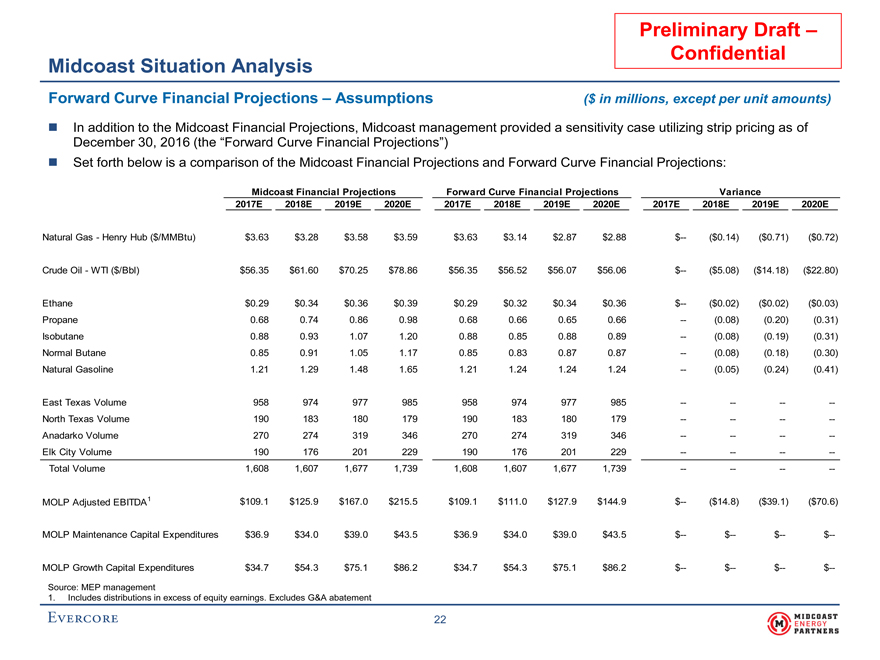
Preliminary Draft – Confidential Midcoast Situation Analysis Forward Curve Financial Projections – Assumptions ($ in millions, except per unit amounts) In addition to the Midcoast Financial Projections, Midcoast management provided a sensitivity case utilizing strip pricing as of December 30, 2016 (the “Forward Curve Financial Projections”) Set forth below is a comparison of the Midcoast Financial Projections and Forward Curve Financial Projections: Midcoast Financial Projections Forward Curve Financial Projections Variance 2017E 2018E 2019E 2020E 2017E 2018E 2019E 2020E 2017E 2018E 2019E 2020E Natural Gas - Henry Hub ($/MMBtu) $3.63 $3.28 $3.58 $3.59 $3.63 $3.14 $2.87 $2.88 $-- ($0.14) ($0.71) ($0.72) Crude Oil - WTI ($/Bbl) $56.35 $61.60 $70.25 $78.86 $56.35 $56.52 $56.07 $56.06 $-- ($5.08) ($14.18) ($22.80) Ethane $0.29 $0.34 $0.36 $0.39 $0.29 $0.32 $0.34 $0.36 $-- ($0.02) ($0.02) ($0.03) Propane 0.68 0.74 0.86 0.98 0.68 0.66 0.65 0.66 -- (0.08) (0.20) (0.31) Isobutane 0.88 0.93 1.07 1.20 0.88 0.85 0.88 0.89 -- (0.08) (0.19) (0.31) Normal Butane 0.85 0.91 1.05 1.17 0.85 0.83 0.87 0.87 -- (0.08) (0.18) (0.30) Natural Gasoline 1.21 1.29 1.48 1.65 1.21 1.24 1.24 1.24 -- (0.05) (0.24) (0.41) East Texas Volume 958 974 977 985 958 974 977 985 -- -- -- --North Texas Volume 190 183 180 179 190 183 180 179 -- -- -- --Anadarko Volume 270 274 319 346 270 274 319 346 -- -- ----Elk City Volume 190 176 201 229 190 176 201 229 -- -- -- --Total Volume 1,608 1,607 1,677 1,739 1,608 1,607 1,677 1,739 -- -- -- -- MOLP Adjusted EBITDA1 $109.1 $125.9 $167.0 $215.5 $109.1 $111.0 $127.9 $144.9 $-- ($14.8) ($39.1) ($70.6) MOLP Maintenance Capital Expenditures $36.9 $34.0 $39.0 $43.5 $36.9 $34.0 $39.0 $43.5 $-- $-- $-- $-- MOLP Growth Capital Expenditures $34.7 $54.3 $75.1 $86.2 $34.7 $54.3 $75.1 $86.2 $-- $-- $-- $-- Source: MEP management 1. Includes distributions in excess of equity earnings. Excludes G&A abatement
22
|
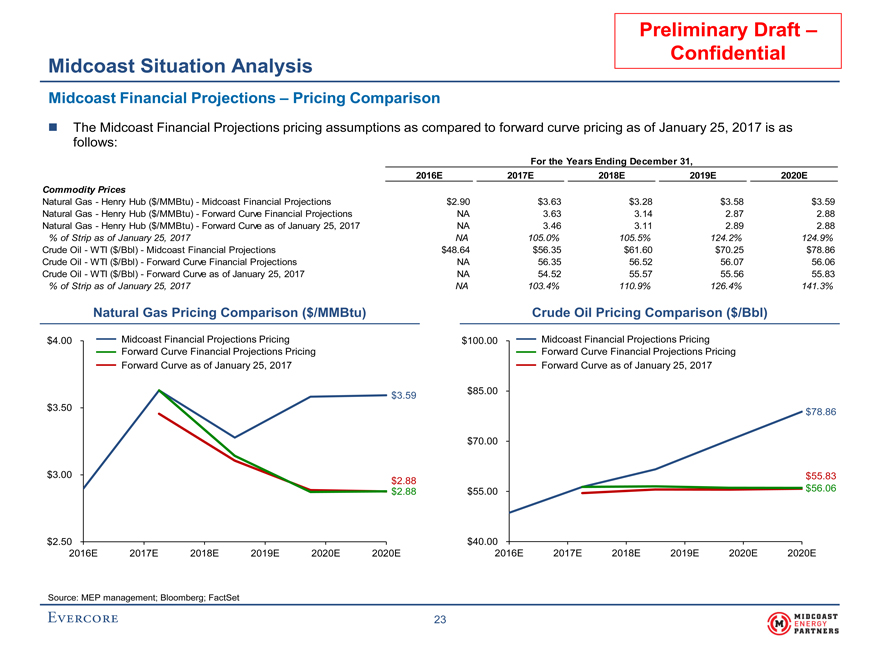
Preliminary Draft – Confidential Midcoast Situation Analysis Midcoast Financial Projections – Pricing Comparison The Midcoast Financial Projections pricing assumptions as compared to forward curve pricing as of January 25, 2017 is as follows: For the Years Ending December 31, 2016E 2017E 2018E 2019E 2020E Commodity Prices Natural Gas - Henry Hub ($/MMBtu) - Midcoast Financial Projections $2.90 $3.63 $3.28 $3.58 $3.59 Natural Gas - Henry Hub ($/MMBtu) - Forward Curve Financial Projections NA 3.63 3.14 2.87 2.88 Natural Gas - Henry Hub ($/MMBtu) - Forward Curve as of January 25, 2017 NA 3.46 3.11 2.89 2.88 % of Strip as of January 25, 2017 NA 105.0% 105.5% 124.2% 124.9% Crude Oil - WTI ($/Bbl) - Midcoast Financial Projections $48.64 $56.35 $61.60 $70.25 $78.86 Crude Oil - WTI ($/Bbl) - Forward Curve Financial Projections NA 56.35 56.52 56.07 56.06 Crude Oil - WTI ($/Bbl) - Forward Curve as of January 25, 2017 NA 54.52 55.57 55.56 55.83 % of Strip as of January 25, 2017 NA 103.4% 110.9% 126.4% 141.3% Natural Gas Pricing Comparison ($/MMBtu) Crude Oil Pricing Comparison ($/Bbl) $4.00 Midcoast Financial Projections Pricing $100.00 Midcoast Financial Projections Pricing Forward Curve Financial Projections Pricing Forward Curve Financial Projections Pricing Forward Curve as of January 25, 2017 Forward Curve as of January 25, 2017 $85.00 $3.59 $3.50 $78.86 $70.00 $3.00 $55.83 $2.88 $2.88 $55.00 $56.06 $2.50 $40.00 2016E 2017E 2018E 2019E 2020E 2020E 2016E 2017E 2018E 2019E 2020E 2020E Source: MEP management; Bloomberg; FactSet
23
|
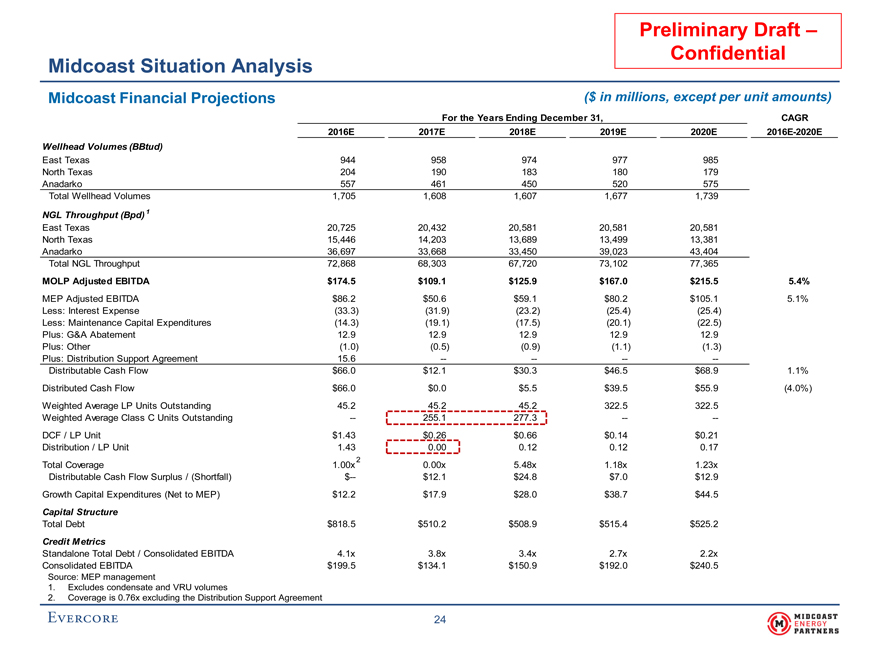
Preliminary Draft – Confidential Midcoast Situation Analysis Midcoast Financial Projections ($ in millions, except per unit amounts) For the Years Ending December 31, CAGR 2016E 2017E 2018E 2019E 2020E 2016E-2020E Wellhead Volumes (BBtud) East Texas 944 958 974 977 985 North Texas 204 190 183 180 179 Anadarko 557 461 450 520 575 Total Wellhead Volumes 1,705 1,608 1,607 1,677 1,739 NGL Throughput (Bpd) 1 East Texas 20,725 20,432 20,581 20,581 20,581 North Texas 15,446 14,203 13,689 13,499 13,381 Anadarko 36,697 33,668 33,450 39,023 43,404 Total NGL Throughput 72,868 68,303 67,720 73,102 77,365 MOLP Adjusted EBITDA $174.5 $109.1 $125.9 $167.0 $215.5 5.4% MEP Adjusted EBITDA $86.2 $50.6 $59.1 $80.2 $105.1 5.1% Less: Interest Expense (33.3) (31.9) (23.2) (25.4) (25.4) Less: Maintenance Capital Expenditures (14.3) (19.1) (17.5) (20.1) (22.5) Plus: G&A Abatement 12.9 12.9 12.9 12.9 12.9 Plus: Other (1.0) (0.5) (0.9) (1.1) (1.3) Plus: Distribution Support Agreement 15.6 -- -- -- --Distributable Cash Flow $66.0 $12.1 $30.3 $46.5 $68.9 1.1% Distributed Cash Flow $66.0 $0.0 $5.5 $39.5 $55.9 (4.0%) Weighted Average LP Units Outstanding 45.2 45.2 45.2 322.5 322.5 Weighted Average Class C Units Outstanding -- 255.1 277.3 ----DCF / LP Unit $1.43 $0.26 $0.66 $0.14 $0.21 Distribution / LP Unit 1.43 0.00 0.12 0.12 0.17 2 Total Coverage 1.00x 0.00x 5.48x 1.18x 1.23x Distributable Cash Flow Surplus / (Shortfall) $-- $12.1 $24.8 $7.0 $12.9 Growth Capital Expenditures (Net to MEP) $12.2 $17.9 $28.0 $38.7 $44.5 Capital Structure Total Debt $818.5 $510.2 $508.9 $515.4 $525.2 Credit Metrics Standalone Total Debt / Consolidated EBITDA 4.1x 3.8x 3.4x 2.7x 2.2x Consolidated EBITDA $199.5 $134.1 $150.9 $192.0 $240.5 Source: MEP management 1. Excludes condensate and VRU volumes 2. Coverage is 0.76x excluding the Distribution Support Agreement
24
|
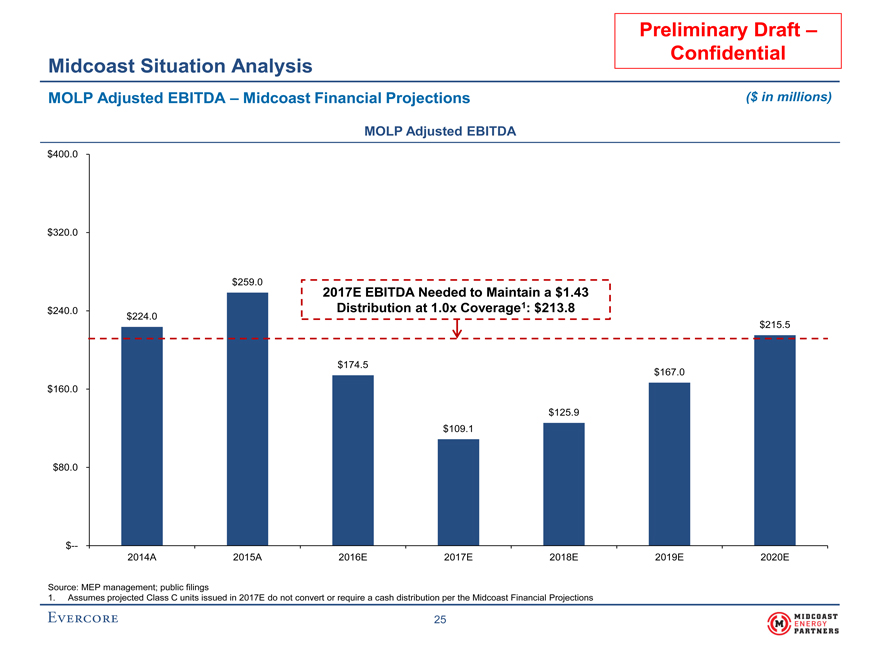
Preliminary Draft – Confidential Midcoast Situation Analysis MOLP Adjusted EBITDA – Midcoast Financial Projections ($ in millions) MOLP Adjusted EBITDA $400.0 $320.0 $259.0 2017E EBITDA Needed to Maintain a $1.43 Distribution at 1.0x Coverage1: $213.8 $240.0 $224.0 $215.5 $174.5 $167.0 $160.0 $125.9 $109.1 $80.0 $-- 2014A 2015A 2016E 2017E 2018E 2019E 2020E Source: MEP management; public filings 1. Assumes projected Class C units issued in 2017E do not convert or require a cash distribution per the Midcoast Financial Projections
25
|
Preliminary Draft –
Confidential
III. Midcoast Valuation
|
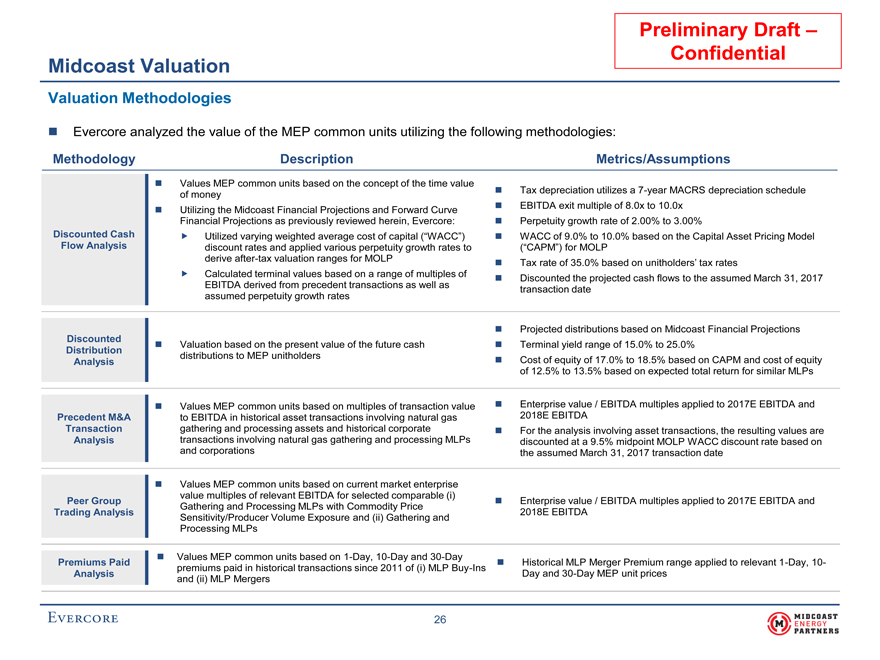
Preliminary Draft – Confidential Midcoast Valuation Valuation Methodologies Evercore analyzed the value of the MEP common units utilizing the following methodologies: Methodology Description Metrics/Assumptions Values MEP common units based on the concept of the time value Tax depreciation utilizes a7-year MACRS depreciation schedule of money EBITDA exit multiple of 8.0x to 10.0x Utilizing the Midcoast Financial Projections and Forward Curve Financial Projections as previously reviewed herein, Evercore: Perpetuity growth rate of 2.00% to 3.00% Discounted Cash Utilized varying weighted average cost of capital (“WACC”) WACC of 9.0% to 10.0% based on the Capital Asset Pricing Model Flow Analysis discount rates and applied various perpetuity growth rates to (“CAPM”) for MOLP deriveafter-tax valuation ranges for MOLP Tax rate of 35.0% based on unitholders’ tax rates Calculated terminal values based on a range of multiples of Discounted the projected cash flows to the assumed March 31, 2017 EBITDA derived from precedent transactions as well as transaction date assumed perpetuity growth rates Projected distributions based on Midcoast Financial Projections Discounted Valuation based on the present value of the future cash Terminal yield range of 15.0% to 25.0% Distribution distributions to MEP unitholders Analysis Cost of equity of 17.0% to 18.5% based on CAPM and cost of equity of 12.5% to 13.5% based on expected total return for similar MLPs Values MEP common units based on multiples of transaction value Enterprise value / EBITDA multiples applied to 2017E EBITDA and Precedent M&A to EBITDA in historical asset transactions involving natural gas 2018E EBITDA Transaction gathering and processing assets and historical corporate For the analysis involving asset transactions, the resulting values are Analysis transactions involving natural gas gathering and processing MLPs discounted at a 9.5% midpoint MOLP WACC discount rate based on and corporations the assumed March 31, 2017 transaction date Values MEP common units based on current market enterprise value multiples of relevant EBITDA for selected comparable (i) Peer Group Enterprise value / EBITDA multiples applied to 2017E EBITDA and Gathering and Processing MLPs with Commodity Price Trading Analysis 2018E EBITDA Sensitivity/Producer Volume Exposure and (ii) Gathering and Processing MLPs Values MEP common units based on1-Day,10-Day and30-Day Premiums Paid Historical MLP Merger Premium range applied to relevant1-Day,10-premiums paid in historical transactions since 2011 of (i) MLPBuy-Ins Analysis Day and30-Day MEP unit prices and (ii) MLP Mergers
26
|
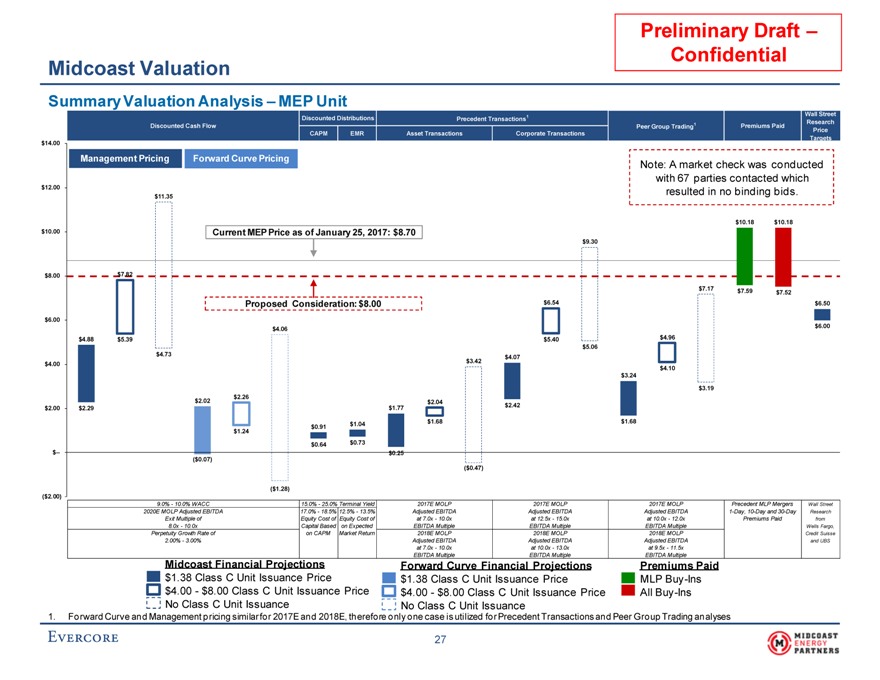
Preliminary Draft – Confidential Midcoast Valuation Summary Valuation Analysis – MEP Unit Wall Street Discounted Distributions Precedent Transactions1 1 Research Discounted Cash Flow Peer Group Trading Premiums Paid Price CAPM EMR Asset Transactions Corporate Transactions $14.00 Targets Management Pricing Forward Curve Pricing Note: A market check was conducted with 67 parties contacted which $12.00 resulted in no binding bids. $11.35 $10.18 $10.18 $10.00 Current MEP Price as of January 25, 2017: $8.70 $9.30 $8.00 $7.82 $7.17 $7.59 $7.52 Proposed Consideration: $8.00 $6.54 $6.50 $6.00 $6.00 $4.06 $4.88 $5.39 $5.40 $4.96 $5.06 $4.73 $4.07 $3.42 $4.00 $4.10 $3.24 $3.19 $2.26 $2.02 $2.04 $1.77 $2.42 $2.00 $2.29 $0.91 $1.04 $1.68 $1.68 $1.24 $0.64 $0.73 $-- $0.25 ($0.07) ($0.47) ($1.28) ($2.00) 9.0% - 10.0% WACC 15.0% - 25.0% Terminal Yield 2017E MOLP 2017E MOLP 2017E MOLP Precedent MLP Mergers Wall Street 2020E MOLP Adjusted EBITDA 17.0% - 18.5% 12.5% - 13.5% Adjusted EBITDA Adjusted EBITDA Adjusted EBITDA1-Day,10-Day and30-Day Research Exit Multiple of Equity Cost of Equity Cost of at 7.0x - 10.0x at 12.5x - 15.0x at 10.0x - 12.0x Premiums Paid from 8.0x - 10.0x Capital Based on Expected EBITDA Multiple EBITDA Multiple EBITDA Multiple Wells Fargo, Perpetuity Growth Rate of on CAPM Market Return 2018E MOLP 2018E MOLP 2018E MOLP Credit Suisse 2.00% - 3.00% Adjusted EBITDA Adjusted EBITDA Adjusted EBITDA and UBS at 7.0x - 10.0x at 10.0x - 12.0x at 9.5x - 11.5x Midcoast Financial Projections EBITDA Multiple EBITDA Multiple EBITDA Multiple Forward Curve Financial Projections Premiums Paid $1.38 Class C Unit Issuance Price $1.38 Class C Unit Issuance Price MLPBuy-Ins $4.00 - $8.00 Class C Unit Issuance Price $4.00 - $8.00 Class C Unit Issuance Price AllBuy-Ins No Class C Unit Issuance No Class C Unit Issuance 1. Forward Curve and Management pricing similar for 2017E and 2018E, therefore only one case is utilized for Precedent Transactions and Peer Group Trading analyses
27
|
Preliminary Draft – Confidential Midcoast Valuation Discounted Cash Flow Analysis – Assumptions Evercore utilized a Discounted Cash Flow (“DCF”) Analysis based on the following assumptions: Merger effective date of March 31, 2017 EBITDA and capital expenditures through December 31, 2020E per the Midcoast Financial Projections and Forward Curve Financial Projections A 35.0% tax rate Tax depreciation forecast based on a fulltax-basisstep-up and a7-year MACRS depreciation schedule Midpoint discount rate of 9.5% utilizing a weighted average cost of capital based on CAPM Terminal value based on both: (i) a 8.0x to 10.0x EBITDA exit multiple and (ii) a 2.0% to 3.0% perpetuity growth rate • Tax depreciation is set equal to maintenance capital expenditures in perpetuity
28
|
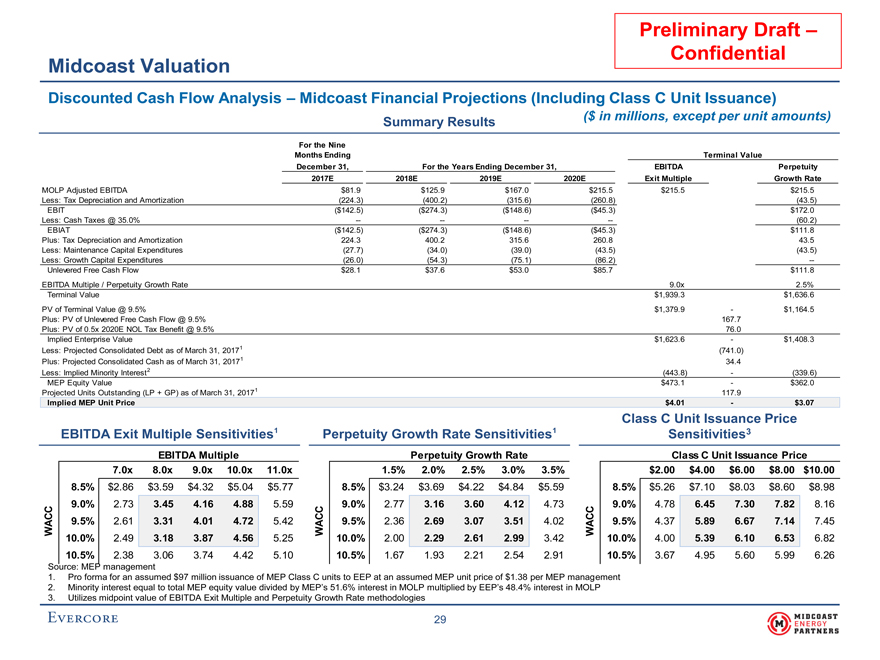
Preliminary Draft – Confidential Midcoast Valuation Discounted Cash Flow Analysis – Midcoast Financial Projections (Including Class C Unit Issuance) ($ in millions, except per unit amounts) Summary Results For the Nine Months Ending Terminal Value December 31, For the Years Ending December 31, EBITDA Perpetuity 2017E 2018E 2019E 2020E Exit Multiple Growth Rate MOLP Adjusted EBITDA $81.9 $125.9 $167.0 $215.5 $215.5 $215.5 Less: Tax Depreciation and Amortization (224.3) (400.2) (315.6) (260.8) (43.5) EBIT ($142.5) ($274.3) ($148.6) ($45.3) $172.0 Less: Cash Taxes @ 35.0% -- -- -- -- (60.2) EBIAT ($142.5) ($274.3) ($148.6) ($45.3) $111.8 Plus: Tax Depreciation and Amortization 224.3 400.2 315.6 260.8 43.5 Less: Maintenance Capital Expenditures (27.7) (34.0) (39.0) (43.5) (43.5) Less: Growth Capital Expenditures (26.0) (54.3) (75.1) (86.2) --Unlevered Free Cash Flow $28.1 $37.6 $53.0 $85.7 $111.8 EBITDA Multiple / Perpetuity Growth Rate 9.0x 2.5% Terminal Value $1,939.3 $1,636.6 PV of Terminal Value @ 9.5% $1,379.9 - $1,164.5 Plus: PV of Unlevered Free Cash Flow @ 9.5% 167.7 Plus: PV of 0.5x 2020E NOL Tax Benefit @ 9.5% 76.0 Implied Enterprise Value $1,623.6 - $1,408.3 Less: Projected Consolidated Debt as of March 31, 20171 (741.0) Plus: Projected Consolidated Cash as of March 31, 20171 34.4 Less: Implied Minority Interest2 (443.8) - (339.6) MEP Equity Value $473.1 - $362.0 Projected Units Outstanding (LP + GP) as of March 31, 20171 117.9 Implied MEP Unit Price $4.01 - $3.07 Class C Unit Issuance Price EBITDA Exit Multiple Sensitivities1 Perpetuity Growth Rate Sensitivities1 Sensitivities3 EBITDA Multiple Perpetuity Growth Rate Class C Unit Issuance Price $4.0 7.0x 8.0x 9.0x 10.0x 11.0x $3.1 1.5% 2.0% 2.5% 3.0% 3.5% $3.5 $2.00 $4.00 $6.00 $8.00 $10.00 8.5% $2.86 $3.59 $4.32 $5.04 $5.77 8.5% $3.24 $3.69 $4.22 $4.84 $5.59 8.5% $5.26 $7.10 $8.03 $8.60 $8.98 9.0% 2.73 3.45 4.16 4.88 5.59 9.0% 2.77 3.16 3.60 4.12 4.73 9.0% 4.78 6.45 7.30 7.82 8.16 C C C C C C A 9.5% 2.61 3.31 4.01 4.72 5.42 A 9.5% 2.36 2.69 3.07 3.51 4.02 A 9.5% 4.37 5.89 6.67 7.14 7.45 W W W 10.0% 2.49 3.18 3.87 4.56 5.25 10.0% 2.00 2.29 2.61 2.99 3.42 10.0% 4.00 5.39 6.10 6.53 6.82 10.5% 2.38 3.06 3.74 4.42 5.10 10.5% 1.67 1.93 2.21 2.54 2.91 10.5% 3.67 4.95 5.60 5.99 6.26 Source: MEP management 1. Pro forma for an assumed $97 million issuance of MEP Class C units to EEP at an assumed MEP unit price of $1.38 per MEP management 2. Minority interest equal to total MEP equity value divided by MEP’s 51.6% interest in MOLP multiplied by EEP’s 48.4% interest in MOLP 3. Utilizes midpoint value of EBITDA Exit Multiple and Perpetuity Growth Rate methodologies
29
|
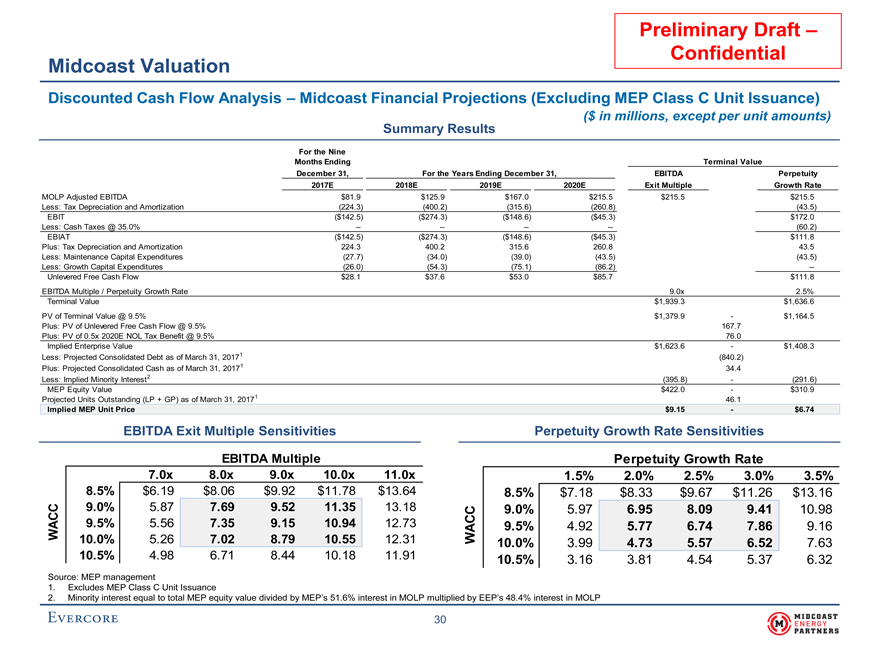
Preliminary Draft – Confidential Midcoast Valuation Discounted Cash Flow Analysis – Midcoast Financial Projections (Excluding MEP Class C Unit Issuance) ($ in millions, except per unit amounts) Summary Results For the Nine Months Ending Terminal Value December 31, For the Years Ending December 31, EBITDA Perpetuity 2017E 2018E 2019E 2020E Exit Multiple Growth Rate MOLP Adjusted EBITDA $81.9 $125.9 $167.0 $215.5 $215.5 $215.5 Less: Tax Depreciation and Amortization (224.3) (400.2) (315.6) (260.8) (43.5) EBIT ($142.5) ($274.3) ($148.6) ($45.3) $172.0 Less: Cash Taxes @ 35.0% -- -- -- -- (60.2) EBIAT ($142.5) ($274.3) ($148.6) ($45.3) $111.8 Plus: Tax Depreciation and Amortization 224.3 400.2 315.6 260.8 43.5 Less: Maintenance Capital Expenditures (27.7) (34.0) (39.0) (43.5) (43.5) Less: Growth Capital Expenditures (26.0) (54.3) (75.1) (86.2) --Unlevered Free Cash Flow $28.1 $37.6 $53.0 $85.7 $111.8 EBITDA Multiple / Perpetuity Growth Rate 9.0x 2.5% Terminal Value $1,939.3 $1,636.6 PV of Terminal Value @ 9.5% $1,379.9 - $1,164.5 Plus: PV of Unlevered Free Cash Flow @ 9.5% 167.7 Plus: PV of 0.5x 2020E NOL Tax Benefit @ 9.5% 76.0 Implied Enterprise Value $1,623.6 - $1,408.3 Less: Projected Consolidated Debt as of March 31, 20171 (840.2) Plus: Projected Consolidated Cash as of March 31, 20171 34.4 Less: Implied Minority Interest2 (395.8) - (291.6) MEP Equity Value $422.0 - $310.9 Projected Units Outstanding (LP + GP) as of March 31, 20171 46.1 Implied MEP Unit Price $9.15 - $6.74 EBITDA Exit Multiple Sensitivities Perpetuity Growth Rate Sensitivities EBITDA Multiple Perpetuity Growth Rate $9.1 7.0x 8.0x 9.0x 10.0x 11.0x $6.7 1.5% 2.0% 2.5% 3.0% 3.5% 8.5% $6.19 $8.06 $9.92 $11.78 $13.64 8.5% $7.18 $8.33 $9.67 $11.26 $13.16 9.0% 5.87 7.69 9.52 11.35 13.18 9.0% 5.97 6.95 8.09 9.41 10.98 WACC 9.5% 5.56 7.35 9.15 10.94 12.73 9.5% 4.92 5.77 6.74 7.86 9.16 10.0% 5.26 7.02 8.79 10.55 12.31 WACC 10.0% 3.99 4.73 5.57 6.52 7.63 10.5% 4.98 6.71 8.44 10.18 11.91 10.5% 3.16 3.81 4.54 5.37 6.32 Source: MEP management 1. Excludes MEP Class C Unit Issuance 2. Minority interest equal to total MEP equity value divided by MEP’s 51.6% interest in MOLP multiplied by EEP’s 48.4% interest in MOLP
30
|
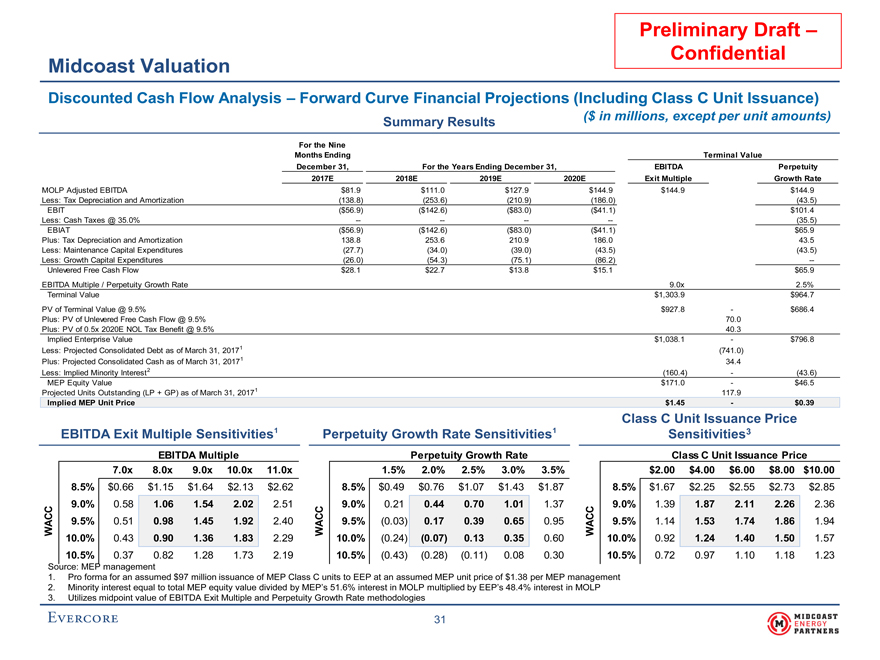
Preliminary Draft – Confidential Midcoast Valuation Discounted Cash Flow Analysis – Forward Curve Financial Projections (Including Class C Unit Issuance) ($ in millions, except per unit amounts) Summary Results For the Nine Months Ending Terminal Value December 31, For the Years Ending December 31, EBITDA Perpetuity 2017E 2018E 2019E 2020E Exit Multiple Growth Rate MOLP Adjusted EBITDA $81.9 $111.0 $127.9 $144.9 $144.9 $144.9 Less: Tax Depreciation and Amortization (138.8) (253.6) (210.9) (186.0) (43.5) EBIT ($56.9) ($142.6) ($83.0) ($41.1) $101.4 Less: Cash Taxes @ 35.0% -- -- -- -- (35.5) EBIAT ($56.9) ($142.6) ($83.0) ($41.1) $65.9 Plus: Tax Depreciation and Amortization 138.8 253.6 210.9 186.0 43.5 Less: Maintenance Capital Expenditures (27.7) (34.0) (39.0) (43.5) (43.5) Less: Growth Capital Expenditures (26.0) (54.3) (75.1) (86.2) --Unlevered Free Cash Flow $28.1 $22.7 $13.8 $15.1 $65.9 EBITDA Multiple / Perpetuity Growth Rate 9.0x 2.5% Terminal Value $1,303.9 $964.7 PV of Terminal Value @ 9.5% $927.8 - $686.4 Plus: PV of Unlevered Free Cash Flow @ 9.5% 70.0 Plus: PV of 0.5x 2020E NOL Tax Benefit @ 9.5% 40.3 Implied Enterprise Value $1,038.1 - $796.8 Less: Projected Consolidated Debt as of March 31, 20171 (741.0) Plus: Projected Consolidated Cash as of March 31, 20171 34.4 Less: Implied Minority Interest2 (160.4) - (43.6) MEP Equity Value $171.0 - $46.5 Projected Units Outstanding (LP + GP) as of March 31, 20171 117.9 Implied MEP Unit Price $1.45 - $0.39 Class C Unit Issuance Price EBITDA Exit Multiple Sensitivities1 Perpetuity Growth Rate Sensitivities1 Sensitivities3 EBITDA Multiple Perpetuity Growth Rate Class C Unit Issuance Price $1.5 7.0x 8.0x 9.0x 10.0x 11.0x $0.4 1.5% 2.0% 2.5% 3.0% 3.5% $0.9 $2.00 $4.00 $6.00 $8.00 $10.00 8.5% $0.66 $1.15 $1.64 $2.13 $2.62 8.5% $0.49 $0.76 $1.07 $1.43 $1.87 8.5% $1.67 $2.25 $2.55 $2.73 $2.85 9.0% 0.58 1.06 1.54 2.02 2.51 9.0% 0.21 0.44 0.70 1.01 1.37 9.0% 1.39 1.87 2.11 2.26 2.36 C C C C C C A 9.5% 0.51 0.98 1.45 1.92 2.40 A 9.5% (0.03) 0.17 0.39 0.65 0.95 A 9.5% 1.14 1.53 1.74 1.86 1.94 W W W 10.0% 0.43 0.90 1.36 1.83 2.29 10.0% (0.24) (0.07) 0.13 0.35 0.60 10.0% 0.92 1.24 1.40 1.50 1.57 10.5% 0.37 0.82 1.28 1.73 2.19 10.5% (0.43) (0.28) (0.11) 0.08 0.30 10.5% 0.72 0.97 1.10 1.18 1.23 Source: MEP management 1. Pro forma for an assumed $97 million issuance of MEP Class C units to EEP at an assumed MEP unit price of $1.38 per MEP management 2. Minority interest equal to total MEP equity value divided by MEP’s 51.6% interest in MOLP multiplied by EEP’s 48.4% interest in MOLP 3. Utilizes midpoint value of EBITDA Exit Multiple and Perpetuity Growth Rate methodologies
31
|
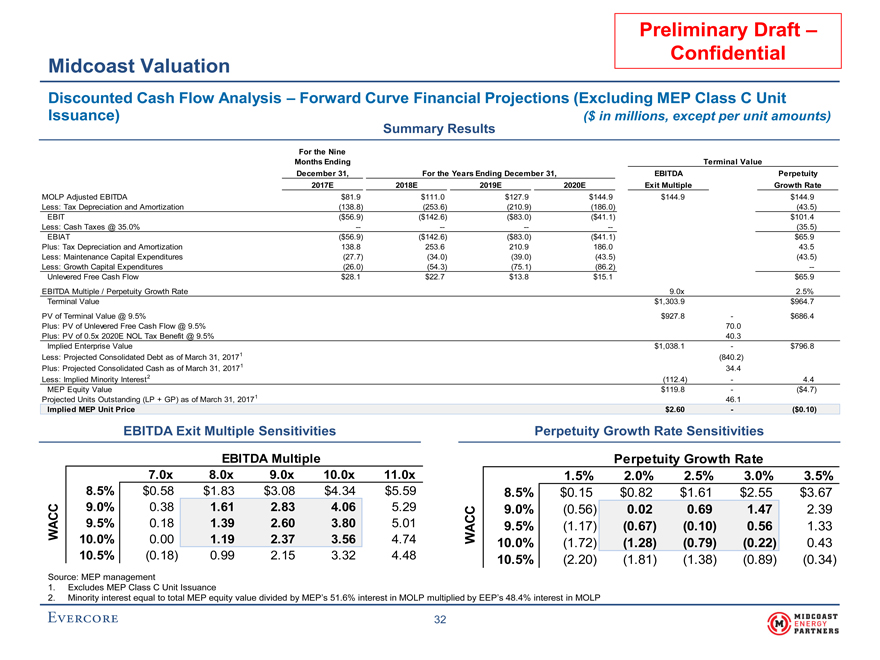
Preliminary Draft – Confidential Midcoast Valuation Discounted Cash Flow Analysis – Forward Curve Financial Projections (Excluding MEP Class C Unit Issuance) ($ in millions, except per unit amounts) Summary Results For the Nine Months Ending Terminal Value December 31, For the Years Ending December 31, EBITDA Perpetuity 2017E 2018E 2019E 2020E Exit Multiple Growth Rate MOLP Adjusted EBITDA $81.9 $111.0 $127.9 $144.9 $144.9 $144.9 Less: Tax Depreciation and Amortization (138.8) (253.6) (210.9) (186.0) (43.5) EBIT ($56.9) ($142.6) ($83.0) ($41.1) $101.4 Less: Cash Taxes @ 35.0% -- -- -- -- (35.5) EBIAT ($56.9) ($142.6) ($83.0) ($41.1) $65.9 Plus: Tax Depreciation and Amortization 138.8 253.6 210.9 186.0 43.5 Less: Maintenance Capital Expenditures (27.7) (34.0) (39.0) (43.5) (43.5) Less: Growth Capital Expenditures (26.0) (54.3) (75.1) (86.2) --Unlevered Free Cash Flow $28.1 $22.7 $13.8 $15.1 $65.9 EBITDA Multiple / Perpetuity Growth Rate 9.0x 2.5% Terminal Value $1,303.9 $964.7 PV of Terminal Value @ 9.5% $927.8 - $686.4 Plus: PV of Unlevered Free Cash Flow @ 9.5% 70.0 Plus: PV of 0.5x 2020E NOL Tax Benefit @ 9.5% 40.3 Implied Enterprise Value $1,038.1 - $796.8 Less: Projected Consolidated Debt as of March 31, 20171 (840.2) Plus: Projected Consolidated Cash as of March 31, 20171 34.4 Less: Implied Minority Interest2 (112.4) - 4.4 MEP Equity Value $119.8 - ($4.7) Projected Units Outstanding (LP + GP) as of March 31, 20171 46.1 Implied MEP Unit Price $2.60 - ($0.10) EBITDA Exit Multiple Sensitivities Perpetuity Growth Rate Sensitivities EBITDA Multiple Perpetuity Growth Rate $2.6 7.0x 8.0x 9.0x 10.0x 11.0x ($0.1) 1.5% 2.0% 2.5% 3.0% 3.5% 8.5% $0.58 $1.83 $3.08 $4.34 $5.59 8.5% $0.15 $0.82 $1.61 $2.55 $3.67 9.0% 0.38 1.61 2.83 4.06 5.29 9.0% (0.56) 0.02 0.69 1.47 2.39 WACC 9.5% 0.18 1.39 2.60 3.80 5.01 9.5% (1.17) (0.67) (0.10) 0.56 1.33 10.0% 0.00 1.19 2.37 3.56 4.74 WACC 10.0% (1.72) (1.28) (0.79) (0.22) 0.43 10.5% (0.18) 0.99 2.15 3.32 4.48 10.5% (2.20) (1.81) (1.38) (0.89) (0.34) Source: MEP management 1. Excludes MEP Class C Unit Issuance 2. Minority interest equal to total MEP equity value divided by MEP’s 51.6% interest in MOLP multiplied by EEP’s 48.4% interest in MOLP
32
|
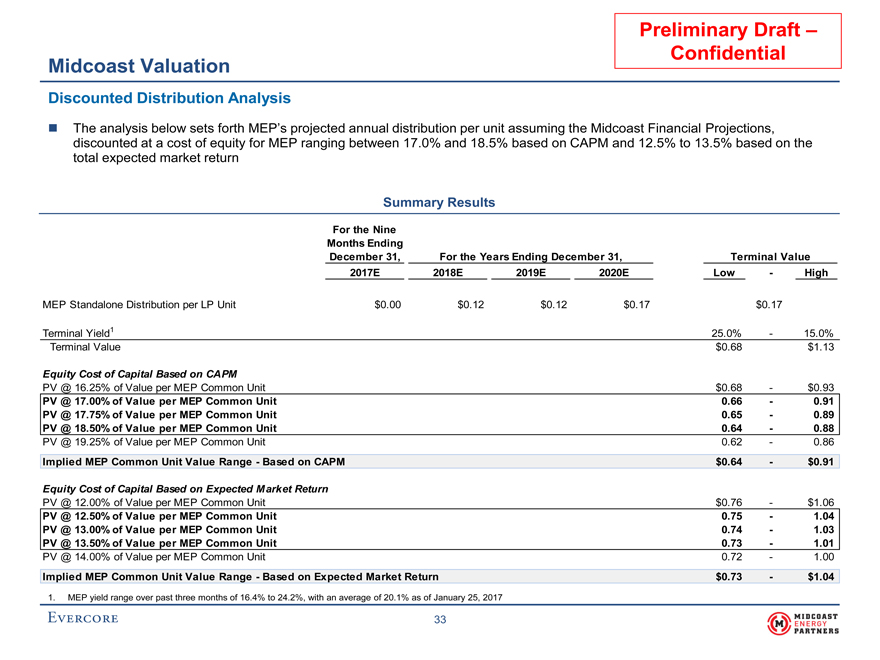
Preliminary Draft – Confidential Midcoast Valuation Discounted Distribution Analysis The analysis below sets forth MEP’s projected annual distribution per unit assuming the Midcoast Financial Projections, discounted at a cost of equity for MEP ranging between 17.0% and 18.5% based on CAPM and 12.5% to 13.5% based on the total expected market return Summary Results For the Nine Months Ending December 31, For the Years Ending December 31, Terminal Value 2017E 2018E 2019E 2020E Low - High MEP Standalone Distribution per LP Unit $0.00 $0.12 $0.12 $0.17 $0.17 Terminal Yield1 25.0% - 15.0% Terminal Value $0.68 $1.13 Equity Cost of Capital Based on CAPM PV @ 16.25% of Value per MEP Common Unit $0.68 - $0.93 PV @ 17.00% of Value per MEP Common Unit 0.66 - 0.91 PV @ 17.75% of Value per MEP Common Unit 0.65 - 0.89 PV @ 18.50% of Value per MEP Common Unit 0.64 - 0.88 PV @ 19.25% of Value per MEP Common Unit 0.62 - 0.86 Implied MEP Common Unit Value Range - Based on CAPM $0.64 - $0.91 Equity Cost of Capital Based on Expected Market Return PV @ 12.00% of Value per MEP Common Unit $0.76 - $1.06 PV @ 12.50% of Value per MEP Common Unit 0.75 - 1.04 PV @ 13.00% of Value per MEP Common Unit 0.74 - 1.03 PV @ 13.50% of Value per MEP Common Unit 0.73 - 1.01 PV @ 14.00% of Value per MEP Common Unit 0.72 - 1.00 Implied MEP Common Unit Value Range - Based on Expected Market Return $0.73 - $1.04 1. MEP yield range over past three months of 16.4% to 24.2%, with an average of 20.1% as of January 25, 2017
33
|
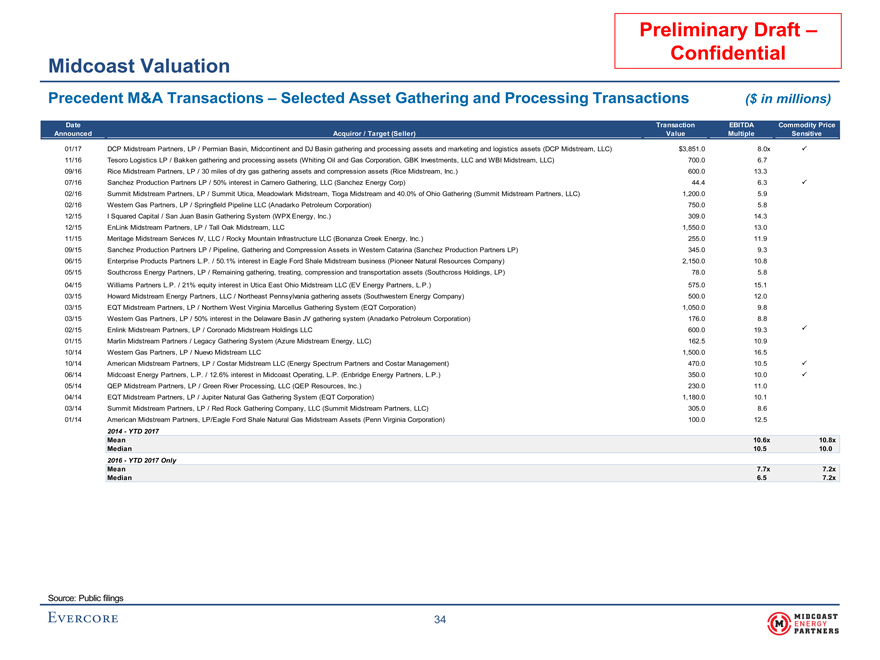
Preliminary Draft – Confidential Midcoast Valuation Precedent M&A Transactions – Selected Asset Gathering and Processing Transactions ($ in millions) Date Transaction EBITDA Commodity Price Announced Acquiror / Target (Seller) Value Multiple Sensitive 01/17 DCP Midstream Partners, LP / Permian Basin, Midcontinent and DJ Basin gathering and processing assets and marketing and logistics assets (DCP Midstream, LLC) $3,851.0 8.0x P 11/16 Tesoro Logistics LP / Bakken gathering and processing assets (Whiting Oil and Gas Corporation, GBK Investments, LLC and WBI Midstream, LLC) 700.0 6.7 09/16 Rice Midstream Partners, LP / 30 miles of dry gas gathering assets and compression assets (Rice Midstream, Inc.) 600.0 13.3 07/16 Sanchez Production Partners LP / 50% interest in Carnero Gathering, LLC (Sanchez Energy Corp) 44.4 6.3 P 02/16 Summit Midstream Partners, LP / Summit Utica, Meadowlark Midstream, Tioga Midstream and 40.0% of Ohio Gathering (Summit Midstream Partners, LLC) 1,200.0 5.9 02/16 Western Gas Partners, LP / Springfield Pipeline LLC (Anadarko Petroleum Corporation) 750.0 5.8 12/15 I Squared Capital / San Juan Basin Gathering System (WPX Energy, Inc.) 309.0 14.3 12/15 EnLink Midstream Partners, LP / Tall Oak Midstream, LLC 1,550.0 13.0 11/15 Meritage Midstream Services IV, LLC / Rocky Mountain Infrastructure LLC (Bonanza Creek Energy, Inc.) 255.0 11.9 09/15 Sanchez Production Partners LP / Pipeline, Gathering and Compression Assets in Western Catarina (Sanchez Production Partners LP) 345.0 9.3 06/15 Enterprise Products Partners L.P. / 50.1% interest in Eagle Ford Shale Midstream business (Pioneer Natural Resources Company) 2,150.0 10.8 05/15 Southcross Energy Partners, LP / Remaining gathering, treating, compression and transportation assets (Southcross Holdings, LP) 78.0 5.8 04/15 Williams Partners L.P. / 21% equity interest in Utica East Ohio Midstream LLC (EV Energy Partners, L.P.) 575.0 15.1 03/15 Howard Midstream Energy Partners, LLC / Northeast Pennsylvania gathering assets (Southwestern Energy Company) 500.0 12.0 03/15 EQT Midstream Partners, LP / Northern West Virginia Marcellus Gathering System (EQT Corporation) 1,050.0 9.8 03/15 Western Gas Partners, LP / 50% interest in the Delaware Basin JV gathering system (Anadarko Petroleum Corporation) 176.0 8.8 02/15 Enlink Midstream Partners, LP / Coronado Midstream Holdings LLC 600.0 19.3 P 01/15 Marlin Midstream Partners / Legacy Gathering System (Azure Midstream Energy, LLC) 162.5 10.9 10/14 Western Gas Partners, LP / Nuevo Midstream LLC 1,500.0 16.5 10/14 American Midstream Partners, LP / Costar Midstream LLC (Energy Spectrum Partners and Costar Management) 470.0 10.5 P 06/14 Midcoast Energy Partners, L.P. / 12.6% interest in Midcoast Operating, L.P. (Enbridge Energy Partners, L.P.) 350.0 10.0 P 05/14 QEP Midstream Partners, LP / Green River Processing, LLC (QEP Resources, Inc.) 230.0 11.0 04/14 EQT Midstream Partners, LP / Jupiter Natural Gas Gathering System (EQT Corporation) 1,180.0 10.1 03/14 Summit Midstream Partners, LP / Red Rock Gathering Company, LLC (Summit Midstream Partners, LLC) 305.0 8.6 01/14 American Midstream Partners, LP/Eagle Ford Shale Natural Gas Midstream Assets (Penn Virginia Corporation) 100.0 12.5 2014 - YTD 2017 Mean 10.6x 10.8x Median 10.5 10.0 2016 - YTD 2017 Only Mean 7.7x 7.2x Median 6.5 7.2x Source: Public filings
34
|
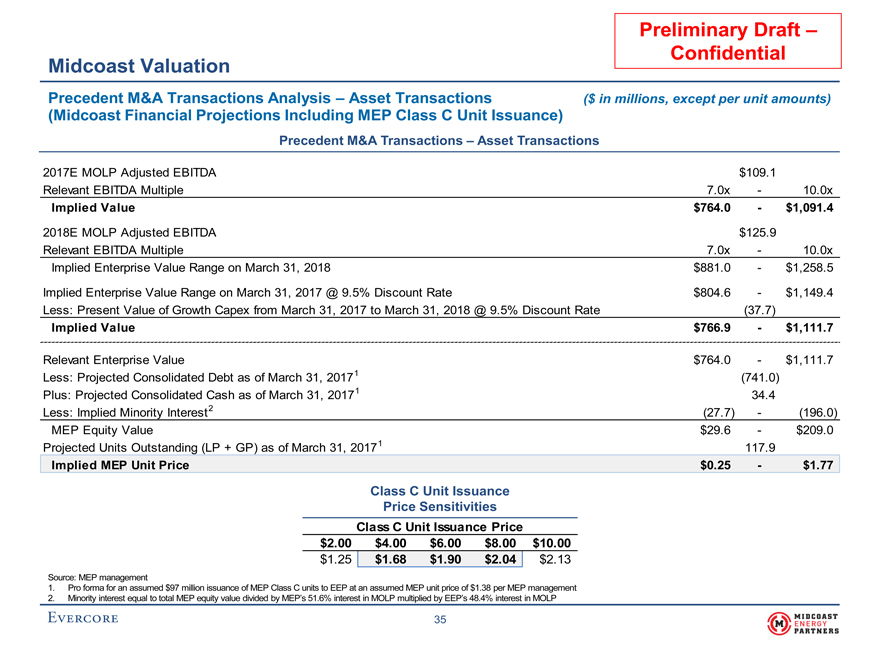
Preliminary Draft – Confidential Midcoast Valuation Precedent M&A Transactions Analysis – Asset Transactions ($ in millions, except per unit amounts) (Midcoast Financial Projections Including MEP Class C Unit Issuance) Precedent M&A Transactions – Asset Transactions 2017E MOLP Adjusted EBITDA $109.1 Relevant EBITDA Multiple 7.0x - 10.0x Implied Value $764.0 - $1,091.4 2018E MOLP Adjusted EBITDA $125.9 Relevant EBITDA Multiple 7.0x - 10.0x Implied Enterprise Value Range on March 31, 2018 $881.0 - $1,258.5 Implied Enterprise Value Range on March 31, 2017 @ 9.5% Discount Rate $804.6 - $1,149.4 Less: Present Value of Growth Capex from March 31, 2017 to March 31, 2018 @ 9.5% Discount Rate (37.7) Implied Value $766.9 - $1,111.7 Relevant Enterprise Value $764.0 - $1,111.7 Less: Projected Consolidated Debt as of March 31, 20171 (741.0) Plus: Projected Consolidated Cash as of March 31, 20171 34.4 Less: Implied Minority Interest2 (27.7) - (196.0) MEP Equity Value $29.6 - $209.0 Projected Units Outstanding (LP + GP) as of March 31, 20171 117.9 Implied MEP Unit Price $0.25 - $1.77 Class C Unit Issuance Price Sensitivities Class C Unit Issuance Price $2.00 $4.00 $6.00 $8.00 $10.00 $1.25 $1.68 $1.90 $2.04 $2.13 Source: MEP management 1. Pro forma for an assumed $97 million issuance of MEP Class C units to EEP at an assumed MEP unit price of $1.38 per MEP management 2. Minority interest equal to total MEP equity value divided by MEP’s 51.6% interest in MOLP multiplied by EEP’s 48.4% interest in MOLP
35
|
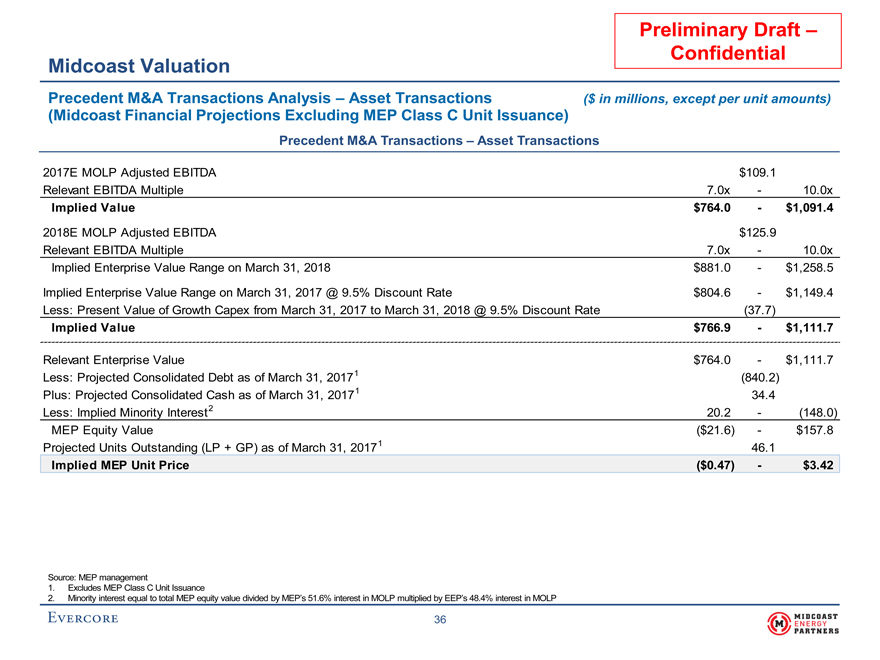
Preliminary Draft – Confidential Midcoast Valuation Precedent M&A Transactions Analysis – Asset Transactions ($ in millions, except per unit amounts) (Midcoast Financial Projections Excluding MEP Class C Unit Issuance) Precedent M&A Transactions – Asset Transactions 2017E MOLP Adjusted EBITDA $109.1 Relevant EBITDA Multiple 7.0x - 10.0x Implied Value $764.0 - $1,091.4 2018E MOLP Adjusted EBITDA $125.9 Relevant EBITDA Multiple 7.0x - 10.0x Implied Enterprise Value Range on March 31, 2018 $881.0 - $1,258.5 Implied Enterprise Value Range on March 31, 2017 @ 9.5% Discount Rate $804.6 - $1,149.4 Less: Present Value of Growth Capex from March 31, 2017 to March 31, 2018 @ 9.5% Discount Rate (37.7) Implied Value $766.9 - $1,111.7 Relevant Enterprise Value $764.0 - $1,111.7 Less: Projected Consolidated Debt as of March 31, 20171 (840.2) Plus: Projected Consolidated Cash as of March 31, 20171 34.4 Less: Implied Minority Interest2 20.2 - (148.0) MEP Equity Value ($21.6) - $157.8 Projected Units Outstanding (LP + GP) as of March 31, 20171 46.1 Implied MEP Unit Price ($0.47) - $3.42 Source: MEP management 1. Excludes MEP Class C Unit Issuance 2. Minority interest equal to total MEP equity value divided by MEP’s 51.6% interest in MOLP multiplied by EEP’s 48.4% interest in MOLP
36
|
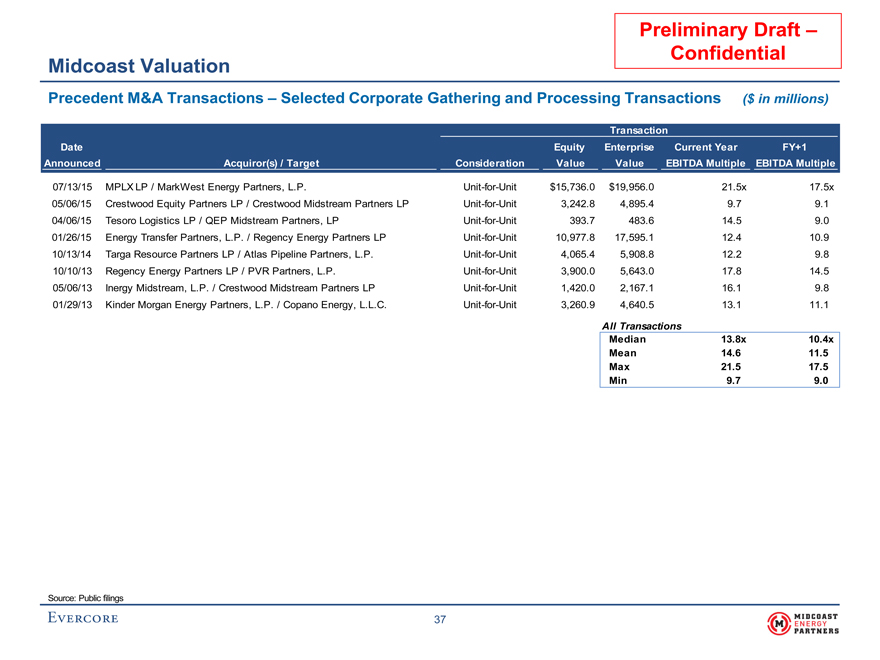
Preliminary Draft – Confidential Midcoast Valuation Precedent M&A Transactions – Selected Corporate Gathering and Processing Transactions ($ in millions) Transaction Date Equity Enterprise Current Year FY+1 Announced Acquiror(s) / Target Consideration Value Value EBITDA Multiple EBITDA Multiple 07/13/15 MPLX LP / MarkWest Energy Partners, L.P.Unit-for-Unit $15,736.0 $19,956.0 21.5x 17.5x 05/06/15 Crestwood Equity Partners LP / Crestwood Midstream Partners LPUnit-for-Unit 3,242.8 4,895.4 9.7 9.1 04/06/15 Tesoro Logistics LP / QEP Midstream Partners, LPUnit-for-Unit 393.7 483.6 14.5 9.0 01/26/15 Energy Transfer Partners, L.P. / Regency Energy Partners LPUnit-for-Unit 10,977.8 17,595.1 12.4 10.9 10/13/14 Targa Resource Partners LP / Atlas Pipeline Partners, L.P.Unit-for-Unit 4,065.4 5,908.8 12.2 9.8 10/10/13 Regency Energy Partners LP / PVR Partners, L.P.Unit-for-Unit 3,900.0 5,643.0 17.8 14.5 05/06/13 Inergy Midstream, L.P. / Crestwood Midstream Partners LPUnit-for-Unit 1,420.0 2,167.1 16.1 9.8 01/29/13 Kinder Morgan Energy Partners, L.P. / Copano Energy, L.L.C.Unit-for-Unit 3,260.9 4,640.5 13.1 11.1 All Transactions Median 13.8x 10.4x Mean 14.6 11.5 Max 21.5 17.5 Min 9.7 9.0 Source: Public filings
37
|
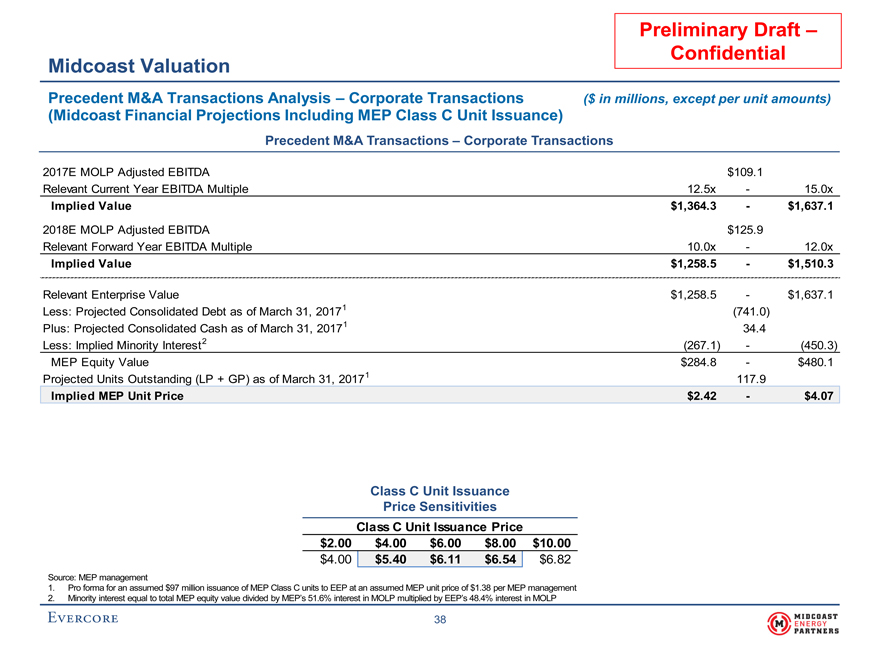
Preliminary Draft – Confidential Midcoast Valuation Precedent M&A Transactions Analysis – Corporate Transactions ($ in millions, except per unit amounts) (Midcoast Financial Projections Including MEP Class C Unit Issuance) Precedent M&A Transactions – Corporate Transactions 2017E MOLP Adjusted EBITDA $109.1 Relevant Current Year EBITDA Multiple 12.5x - 15.0x Implied Value $1,364.3 - $1,637.1 2018E MOLP Adjusted EBITDA $125.9 Relevant Forward Year EBITDA Multiple 10.0x - 12.0x Implied Value $1,258.5 - $1,510.3 Relevant Enterprise Value $1,258.5 - $1,637.1 Less: Projected Consolidated Debt as of March 31, 20171 (741.0) Plus: Projected Consolidated Cash as of March 31, 20171 34.4 Less: Implied Minority Interest2 (267.1) - (450.3) MEP Equity Value $284.8 - $480.1 Projected Units Outstanding (LP + GP) as of March 31, 20171 117.9 Implied MEP Unit Price $2.42 - $4.07 Class C Unit Issuance Price Sensitivities Class C Unit Issuance Price $2.00 $4.00 $6.00 $8.00 $10.00 $4.00 $5.40 $6.11 $6.54 $6.82 Source: MEP management 1. Pro forma for an assumed $97 million issuance of MEP Class C units to EEP at an assumed MEP unit price of $1.38 per MEP management 2. Minority interest equal to total MEP equity value divided by MEP’s 51.6% interest in MOLP multiplied by EEP’s 48.4% interest in MOLP
38
|
Confidential
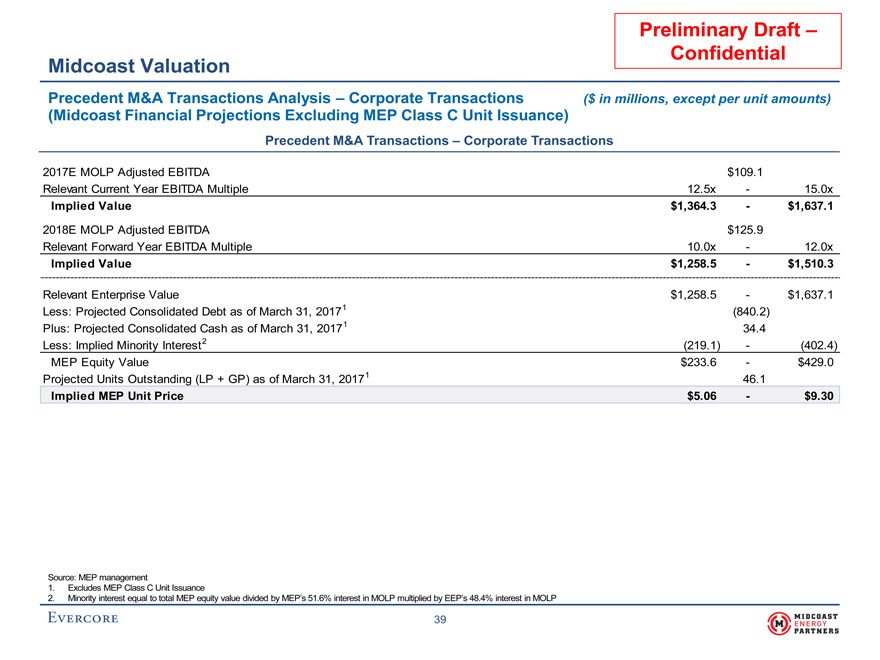
Midcoast Valuation Precedent M&A Transactions Analysis – Corporate Transactions ($ in millions, except per unit amounts) (Midcoast Financial Projections Excluding MEP Class C Unit Issuance) Precedent M&A Transactions – Corporate Transactions 2017E MOLP Adjusted EBITDA $109.1 Relevant Current Year EBITDA Multiple 12.5x - 15.0x Implied Value $1,364.3 - $1,637.1 2018E MOLP Adjusted EBITDA $125.9 Relevant Forward Year EBITDA Multiple 10.0x - 12.0x Implied Value $1,258.5 - $1,510.3 Relevant Enterprise Value $1,258.5 - $1,637.1 Less: Projected Consolidated Debt as of March 31, 20171 (840.2) Plus: Projected Consolidated Cash as of March 31, 20171 34.4 Less: Implied Minority Interest2 (219.1) - (402.4) MEP Equity Value $233.6 - $429.0 Projected Units Outstanding (LP + GP) as of March 31, 20171 46.1 Implied MEP Unit Price $5.06 - $9.30 Source: MEP management 1. Excludes MEP Class C Unit Issuance 2. Minority interest equal to total MEP equity value divided by MEP’s 51.6% interest in MOLP multiplied by EEP’s 48.4% interest in MOLP
39
|
Confidential
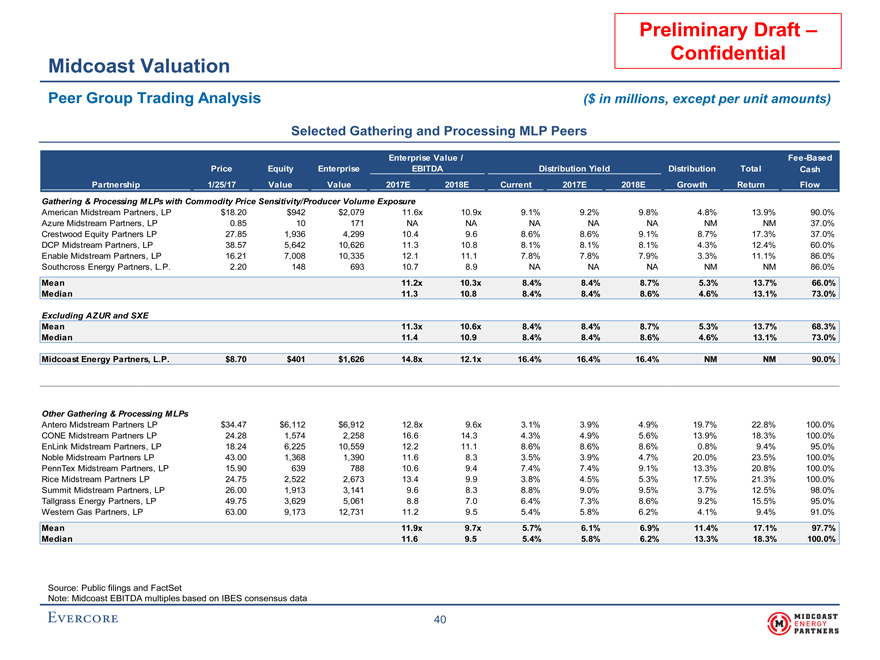
Midcoast Valuation Peer Group Trading Analysis ($ in millions, except per unit amounts) Selected Gathering and Processing MLP Peers Enterprise Value /Fee-Based Price Equity Enterprise EBITDA Distribution Yield Distribution Total Cash Partnership 1/25/17 Value Value 2017E 2018E Current 2017E 2018E Growth Return Flow Gathering & Processing MLPs with Commodity Price Sensitivity/Producer Volume Exposure American Midstream Partners, LP $18.20 $942 $2,079 11.6x 10.9x 9.1% 9.2% 9.8% 4.8% 13.9% 90.0% Azure Midstream Partners, LP 0.85 10 171 NA NA NA NA NA NM NM 37.0% Crestwood Equity Partners LP 27.85 1,936 4,299 10.4 9.6 8.6% 8.6% 9.1% 8.7% 17.3% 37.0% DCP Midstream Partners, LP 38.57 5,642 10,626 11.3 10.8 8.1% 8.1% 8.1% 4.3% 12.4% 60.0% Enable Midstream Partners, LP 16.21 7,008 10,335 12.1 11.1 7.8% 7.8% 7.9% 3.3% 11.1% 86.0% Southcross Energy Partners, L.P. 2.20 148 693 10.7 8.9 NA NA NA NM NM 86.0% Mean 11.2x 10.3x 8.4% 8.4% 8.7% 5.3% 13.7% 66.0% Median 11.3 10.8 8.4% 8.4% 8.6% 4.6% 13.1% 73.0% Excluding AZUR and SXE Mean 11.3x 10.6x 8.4% 8.4% 8.7% 5.3% 13.7% 68.3% Median 11.4 10.9 8.4% 8.4% 8.6% 4.6% 13.1% 73.0% Midcoast Energy Partners, L.P. $8.70 $401 $1,626 14.8x 12.1x 16.4% 16.4% 16.4% NM NM 90.0% Other Gathering & Processing MLPs Antero Midstream Partners LP $34.47 $6,112 $6,912 12.8x 9.6x 3.1% 3.9% 4.9% 19.7% 22.8% 100.0% CONE Midstream Partners LP 24.28 1,574 2,258 16.6 14.3 4.3% 4.9% 5.6% 13.9% 18.3% 100.0% EnLink Midstream Partners, LP 18.24 6,225 10,559 12.2 11.1 8.6% 8.6% 8.6% 0.8% 9.4% 95.0% Noble Midstream Partners LP 43.00 1,368 1,390 11.6 8.3 3.5% 3.9% 4.7% 20.0% 23.5% 100.0% PennTex Midstream Partners, LP 15.90 639 788 10.6 9.4 7.4% 7.4% 9.1% 13.3% 20.8% 100.0% Rice Midstream Partners LP 24.75 2,522 2,673 13.4 9.9 3.8% 4.5% 5.3% 17.5% 21.3% 100.0% Summit Midstream Partners, LP 26.00 1,913 3,141 9.6 8.3 8.8% 9.0% 9.5% 3.7% 12.5% 98.0% Tallgrass Energy Partners, LP 49.75 3,629 5,061 8.8 7.0 6.4% 7.3% 8.6% 9.2% 15.5% 95.0% Western Gas Partners, LP 63.00 9,173 12,731 11.2 9.5 5.4% 5.8% 6.2% 4.1% 9.4% 91.0% Mean 11.9x 9.7x 5.7% 6.1% 6.9% 11.4% 17.1% 97.7% Median 11.6 9.5 5.4% 5.8% 6.2% 13.3% 18.3% 100.0% Source: Public filings and FactSet Note: Midcoast EBITDA multiples based on IBES consensus data
40
|
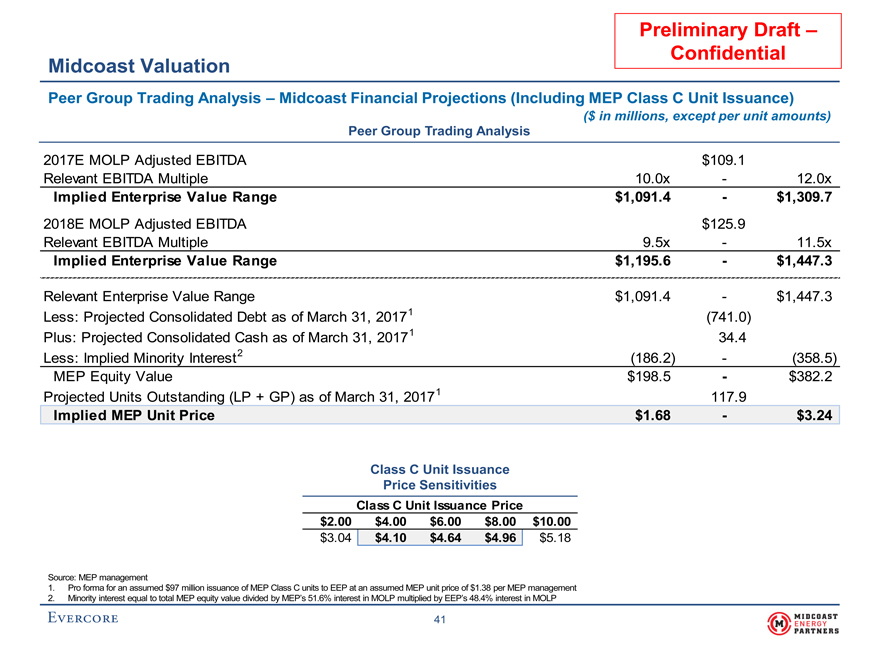
Confidential Midcoast Valuation Peer Group Trading Analysis – Midcoast Financial Projections (Including MEP Class C Unit Issuance) ($ in millions, except per unit amounts) Peer Group Trading Analysis 2017E MOLP Adjusted EBITDA $109.1 Relevant EBITDA Multiple 10.0x - 12.0x Implied Enterprise Value Range $1,091.4 - $1,309.7 2018E MOLP Adjusted EBITDA $125.9 Relevant EBITDA Multiple 9.5x - 11.5x Implied Enterprise Value Range $1,195.6 - $1,447.3 Relevant Enterprise Value Range $1,091.4 - $1,447.3 Less: Projected Consolidated Debt as of March 31, 20171 (741.0) Plus: Projected Consolidated Cash as of March 31, 20171 34.4 Less: Implied Minority Interest2 (186.2) - (358.5) MEP Equity Value $198.5 - $382.2 Projected Units Outstanding (LP + GP) as of March 31, 20171 117.9 Implied MEP Unit Price $1.68 - $3.24 Class C Unit Issuance Price Sensitivities Class C Unit Issuance Price $2.00 $4.00 $6.00 $8.00 $10.00 $3.04 $4.10 $4.64 $4.96 $5.18 Source: MEP management 1. Pro forma for an assumed $97 million issuance of MEP Class C units to EEP at an assumed MEP unit price of $1.38 per MEP management 2. Minority interest equal to total MEP equity value divided by MEP’s 51.6% interest in MOLP multiplied by EEP’s 48.4% interest in MOLP
41
|
Confidential
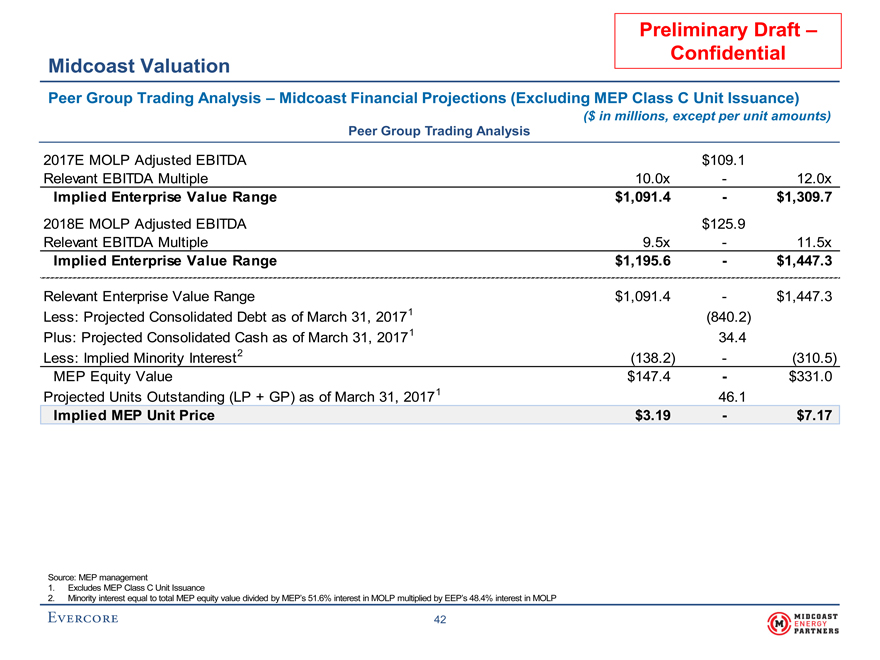
Midcoast Valuation Peer Group Trading Analysis – Midcoast Financial Projections (Excluding MEP Class C Unit Issuance) ($ in millions, except per unit amounts) Peer Group Trading Analysis 2017E MOLP Adjusted EBITDA $109.1 Relevant EBITDA Multiple 10.0x - 12.0x Implied Enterprise Value Range $1,091.4 - $1,309.7 2018E MOLP Adjusted EBITDA $125.9 Relevant EBITDA Multiple 9.5x - 11.5x Implied Enterprise Value Range $1,195.6 - $1,447.3 Relevant Enterprise Value Range $1,091.4 - $1,447.3 Less: Projected Consolidated Debt as of March 31, 20171 (840.2) Plus: Projected Consolidated Cash as of March 31, 20171 34.4 Less: Implied Minority Interest2 (138.2) - (310.5) MEP Equity Value $147.4 - $331.0 Projected Units Outstanding (LP + GP) as of March 31, 20171 46.1 Implied MEP Unit Price $3.19 - $7.17 Source: MEP management 1. Excludes MEP Class C Unit Issuance 2. Minority interest equal to total MEP equity value divided by MEP’s 51.6% interest in MOLP multiplied by EEP’s 48.4% interest in MOLP
42
|
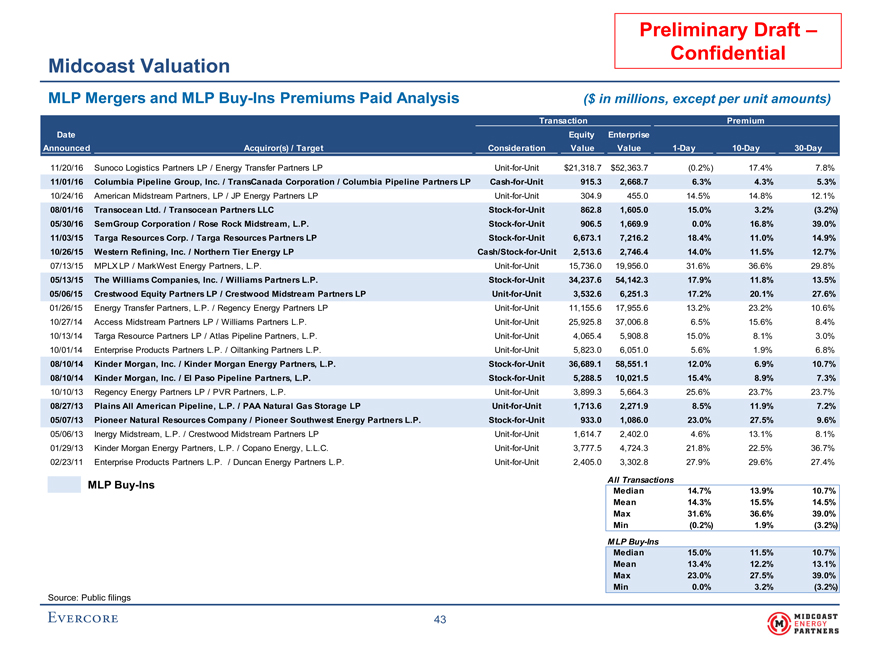
Confidential Midcoast Valuation MLP Mergers and MLPBuy-Ins Premiums Paid Analysis ($ in millions, except per unit amounts) Transaction Premium Date Equity Enterprise Announced Acquiror(s) / Target Consideration Value Value1-Day10-Day30-Day 11/20/16 Sunoco Logistics Partners LP / Energy Transfer Partners LPUnit-for-Unit $21,318.7 $52,363.7 (0.2%) 17.4% 7.8% 11/01/16 Columbia Pipeline Group, Inc. / TransCanada Corporation / Columbia Pipeline Partners LPCash-for-Unit 915.3 2,668.7 6.3% 4.3% 5.3% 10/24/16 American Midstream Partners, LP / JP Energy Partners LPUnit-for-Unit 304.9 455.0 14.5% 14.8% 12.1% 08/01/16 Transocean Ltd. / Transocean Partners LLCStock-for-Unit 862.8 1,605.0 15.0% 3.2% (3.2%) 05/30/16 SemGroup Corporation / Rose Rock Midstream, L.P.Stock-for-Unit 906.5 1,669.9 0.0% 16.8% 39.0% 11/03/15 Targa Resources Corp. / Targa Resources Partners LPStock-for-Unit 6,673.1 7,216.2 18.4% 11.0% 14.9% 10/26/15 Western Refining, Inc. / Northern Tier Energy LPCash/Stock-for-Unit 2,513.6 2,746.4 14.0% 11.5% 12.7% 07/13/15 MPLX LP / MarkWest Energy Partners, L.P.Unit-for-Unit 15,736.0 19,956.0 31.6% 36.6% 29.8% 05/13/15 The Williams Companies, Inc. / Williams Partners L.P.Stock-for-Unit 34,237.6 54,142.3 17.9% 11.8% 13.5% 05/06/15 Crestwood Equity Partners LP / Crestwood Midstream Partners LPUnit-for-Unit 3,532.6 6,251.3 17.2% 20.1% 27.6% 01/26/15 Energy Transfer Partners, L.P. / Regency Energy Partners LPUnit-for-Unit 11,155.6 17,955.6 13.2% 23.2% 10.6% 10/27/14 Access Midstream Partners LP / Williams Partners L.P.Unit-for-Unit 25,925.8 37,006.8 6.5% 15.6% 8.4% 10/13/14 Targa Resource Partners LP / Atlas Pipeline Partners, L.P.Unit-for-Unit 4,065.4 5,908.8 15.0% 8.1% 3.0% 10/01/14 Enterprise Products Partners L.P. / Oiltanking Partners L.P.Unit-for-Unit 5,823.0 6,051.0 5.6% 1.9% 6.8% 08/10/14 Kinder Morgan, Inc. / Kinder Morgan Energy Partners, L.P.Stock-for-Unit 36,689.1 58,551.1 12.0% 6.9% 10.7% 08/10/14 Kinder Morgan, Inc. / El Paso Pipeline Partners, L.P.Stock-for-Unit 5,288.5 10,021.5 15.4% 8.9% 7.3% 10/10/13 Regency Energy Partners LP / PVR Partners, L.P.Unit-for-Unit 3,899.3 5,664.3 25.6% 23.7% 23.7% 08/27/13 Plains All American Pipeline, L.P. / PAA Natural Gas Storage LPUnit-for-Unit 1,713.6 2,271.9 8.5% 11.9% 7.2% 05/07/13 Pioneer Natural Resources Company / Pioneer Southwest Energy Partners L.P.Stock-for-Unit 933.0 1,086.0 23.0% 27.5% 9.6% 05/06/13 Inergy Midstream, L.P. / Crestwood Midstream Partners LPUnit-for-Unit 1,614.7 2,402.0 4.6% 13.1% 8.1% 01/29/13 Kinder Morgan Energy Partners, L.P. / Copano Energy, L.L.C.Unit-for-Unit 3,777.5 4,724.3 21.8% 22.5% 36.7% 02/23/11 Enterprise Products Partners L.P. / Duncan Energy Partners L.P.Unit-for-Unit 2,405.0 3,302.8 27.9% 29.6% 27.4% MLPBuy-Ins All Transactions Median 14.7% 13.9% 10.7% Mean 14.3% 15.5% 14.5% Max 31.6% 36.6% 39.0% Min (0.2%) 1.9% (3.2%) MLPBuy-Ins Median 15.0% 11.5% 10.7% Mean 13.4% 12.2% 13.1% Max 23.0% 27.5% 39.0% Min 0.0% 3.2% (3.2%) Source: Public filings
43
|
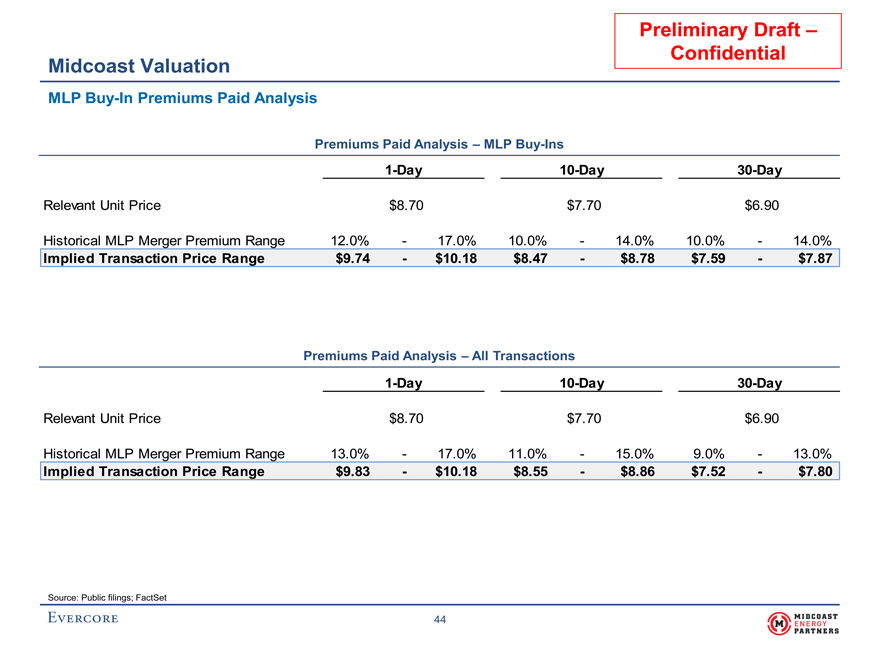
Confidential Midcoast Valuation MLPBuy-In Premiums Paid Analysis Premiums Paid Analysis – MLPBuy-Ins1-Day10-Day30-Day Relevant Unit Price $8.70 $7.70 $6.90 Historical MLP Merger Premium Range 12.0% - 17.0% 10.0% - 14.0% 10.0% - 14.0% Implied Transaction Price Range $9.74 - $10.18 $8.47 - $8.78 $7.59 - $7.87 Premiums Paid Analysis – All Transactions1-Day10-Day30-Day Relevant Unit Price $8.70 $7.70 $6.90 Historical MLP Merger Premium Range 13.0% - 17.0% 11.0% - 15.0% 9.0% - 13.0% Implied Transaction Price Range $9.83 - $10.18 $8.55 - $8.86 $7.52 - $7.80 Source: Public filings; FactSet
44
|
Preliminary Draft –
Confidential
IV. Summary of Sales Process
|
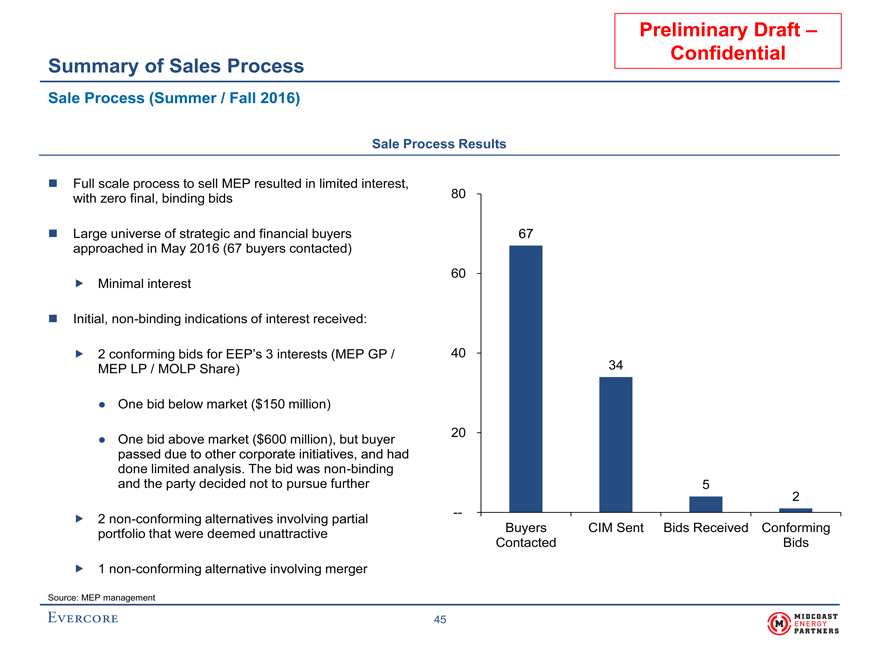
Confidential Summary of Sales Process Sale Process (Summer / Fall 2016) Sale Process Results Full scale process to sell MEP resulted in limited interest, with zero final, binding bids 80 Large universe of strategic and financial buyers 67 approached in May 2016 (67 buyers contacted) 60 Minimal interest Initial,non-binding indications of interest received: 2 conforming bids for EEP’s 3 interests (MEP GP / 40 MEP LP / MOLP Share) 34 • One bid below market ($150 million) 20 • One bid above market ($600 million), but buyer passed due to other corporate initiatives, and had done limited analysis. The bid wasnon-binding and the party decided not to pursue further 5 2 -- 2non-conforming alternatives involving partial Buyers CIM Sent Bids Received Conforming portfolio that were deemed unattractive Contacted Bids 1non-conforming alternative involving merger Source: MEP management
45
|
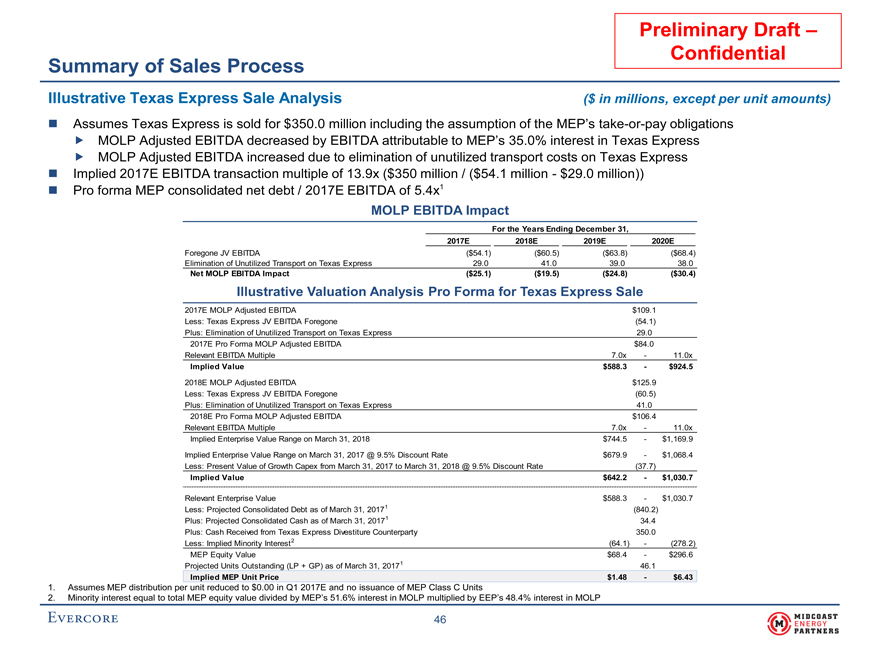
Confidential Summary of Sales Process Illustrative Texas Express Sale Analysis ($ in millions, except per unit amounts) Assumes Texas Express is sold for $350.0 million including the assumption of the MEP’stake-or-pay obligations MOLP Adjusted EBITDA decreased by EBITDA attributable to MEP’s 35.0% interest in Texas Express MOLP Adjusted EBITDA increased due to elimination of unutilized transport costs on Texas Express Implied 2017E EBITDA transaction multiple of 13.9x ($350 million / ($54.1 million - $29.0 million)) Pro forma MEP consolidated net debt / 2017E EBITDA of 5.4x1 MOLP EBITDA Impact For the Years Ending December 31, 2017E 2018E 2019E 2020E Foregone JV EBITDA ($54.1) ($60.5) ($63.8) ($68.4) Elimination of Unutilized Transport on Texas Express 29.0 41.0 39.0 38.0 Net MOLP EBITDA Impact ($25.1) ($19.5) ($24.8) ($30.4) Illustrative Valuation Analysis Pro Forma for Texas Express Sale 2017E MOLP Adjusted EBITDA $109.1 Less: Texas Express JV EBITDA Foregone (54.1) Plus: Elimination of Unutilized Transport on Texas Express 29.0 2017E Pro Forma MOLP Adjusted EBITDA $84.0 Relevant EBITDA Multiple 7.0x - 11.0x Implied Value $588.3 - $924.5 2018E MOLP Adjusted EBITDA $125.9 Less: Texas Express JV EBITDA Foregone (60.5) Plus: Elimination of Unutilized Transport on Texas Express 41.0 2018E Pro Forma MOLP Adjusted EBITDA $106.4 Relevant EBITDA Multiple 7.0x - 11.0x Implied Enterprise Value Range on March 31, 2018 $744.5 - $1,169.9 Implied Enterprise Value Range on March 31, 2017 @ 9.5% Discount Rate $679.9 - $1,068.4 Less: Present Value of Growth Capex from March 31, 2017 to March 31, 2018 @ 9.5% Discount Rate (37.7) Implied Value $642.2 - $1,030.7 Relevant Enterprise Value $588.3 - $1,030.7 Less: Projected Consolidated Debt as of March 31, 20171 (840.2) Plus: Projected Consolidated Cash as of March 31, 20171 34.4 Plus: Cash Received from Texas Express Divestiture Counterparty 350.0 Less: Implied Minority Interest2 (64.1) - (278.2) MEP Equity Value $68.4 - $296.6 Projected Units Outstanding (LP + GP) as of March 31, 20171 46.1 Implied MEP Unit Price $1.48 - $6.43 1. Assumes MEP distribution per unit reduced to $0.00 in Q1 2017E and no issuance of MEP Class C Units 2. Minority interest equal to total MEP equity value divided by MEP’s 51.6% interest in MOLP multiplied by EEP’s 48.4% interest in MOLP
46
|
Appendix
|
A. Weighted Average Cost of Capital Analysis
|
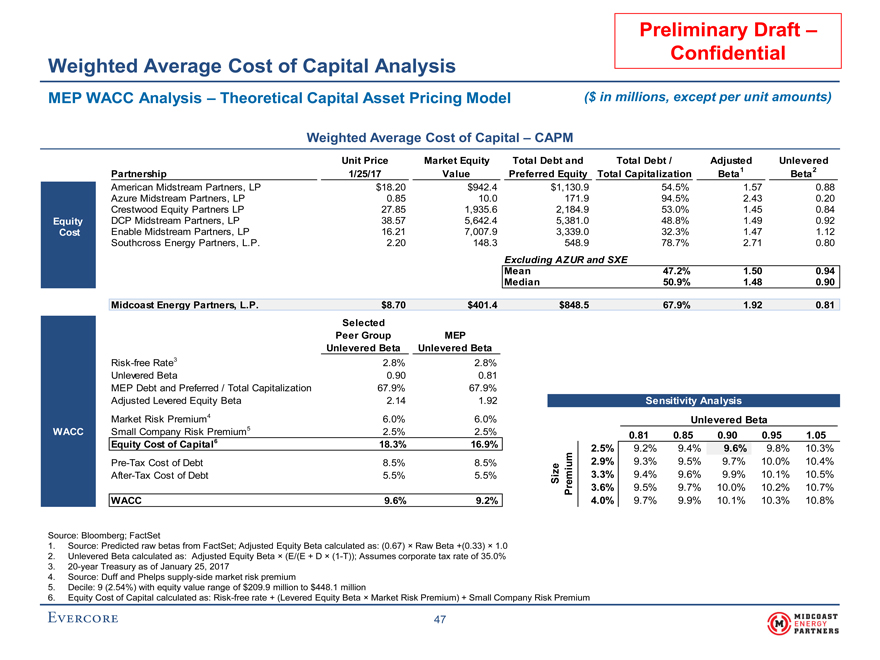
Weighted Average Cost of Capital Analysis MEP WACC Analysis – Theoretical Capital Asset Pricing Model ($ in millions, except per unit amounts) Weighted Average Cost of Capital – CAPM Unit Price Market Equity Total Debt and Total Debt / Adjusted Unlevered Partnership 1/25/17 Value Preferred Equity Total Capitalization Beta1 Beta2 American Midstream Partners, LP $18.20 $942.4 $1,130.9 54.5% 1.57 0.88 Azure Midstream Partners, LP 0.85 10.0 171.9 94.5% 2.43 0.20 Crestwood Equity Partners LP 27.85 1,935.6 2,184.9 53.0% 1.45 0.84 Equity DCP Midstream Partners, LP 38.57 5,642.4 5,381.0 48.8% 1.49 0.92 Cost Enable Midstream Partners, LP 16.21 7,007.9 3,339.0 32.3% 1.47 1.12 Southcross Energy Partners, L.P. 2.20 148.3 548.9 78.7% 2.71 0.80 Excluding AZUR and SXE Mean 47.2% 1.50 0.94 Median 50.9% 1.48 0.90 Midcoast Energy Partners, L.P. $8.70 $401.4 $848.5 67.9% 1.92 0.81 Selected Peer Group MEP Unlevered Beta Unlevered Beta Risk-free Rate3 2.8% 2.8% Unlevered Beta 0.90 0.81 MEP Debt and Preferred / Total Capitalization 67.9% 67.9% Adjusted Levered Equity Beta 2.14 1.92 Sensitivity Analysis Market Risk Premium4 6.0% 6.0% Unlevered Beta WACC Small Company Risk Premium5 2.5% 2.5% 9.6% 0.81 0.85 0.90 0.95 1.05 Equity Cost of Capital6 18.3% 16.9% 2.5% 9.2% 9.4% 9.6% 9.8% 10.3%Pre-Tax Cost of Debt 8.5% 8.5%ize 2.9% 9.3% 9.5% 9.7% 10.0% 10.4%After-Tax Cost of Debt 5.5% 5.5% S mium 3.3% 9.4% 9.6% 9.9% 10.1% 10.5% r e 3.6% 9.5% 9.7% 10.0% 10.2% 10.7% WACC 9.6% 9.2% P 4.0% 9.7% 9.9% 10.1% 10.3% 10.8% Source: Bloomberg; FactSet 1. Source: Predicted raw betas from FactSet; Adjusted Equity Beta calculated as: (0.67) × Raw Beta +(0.33) × 1.0 2. Unlevered Beta calculated as: Adjusted Equity Beta × (E/(E + D ×(1-T)); Assumes corporate tax rate of 35.0% 3.20-year Treasury as of January 25, 2017 4. Source: Duff and Phelps supply-side market risk premium 5. Decile: 9 (2.54%) with equity value range of $209.9 million to $448.1 million 6. Equity Cost of Capital calculated as: Risk-free rate + (Levered Equity Beta × Market Risk Premium) + Small Company Risk Premium
47
|
Confidential
Weighted Average Cost of Capital Analysis MEP WACC Analysis – Expected Market Return ($ in millions, except per unit amounts) Weighted Average Cost of Capital – Expected Market Return Total Unit Price Market Equity Distribution Equity Partnership 1/25/17 Value Current Yield Growth1 Return American Midstream Partners, LP $18.20 $942.4 9.1% 4.8% 13.9% Azure Midstream Partners, LP 0.85 10.0 NA NM 0.0% Crestwood Equity Partners LP 27.85 1,935.6 8.6% 8.7% 17.3% Total DCP Midstream Partners, LP 38.57 5,642.4 8.1% 4.3% 12.4% Return Enable Midstream Partners, LP 16.21 7,007.9 7.8% 3.3% 11.1% Southcross Energy Partners, L.P. 2.20 148.3 NA NM 0.0% Excluding AZUR and SXE Mean 13.7% Median 13.1% WACC Debt and Preferred / Total Capitalization 67.9% Market Required Equity Return 13.1% WACCPre-Tax Cost of Debt 8.5%After-Tax Cost of Debt 5.5% WACC 8.0% Source: Bloomberg; FactSet 1. Based on IBES3-year distribution estimates
48
|
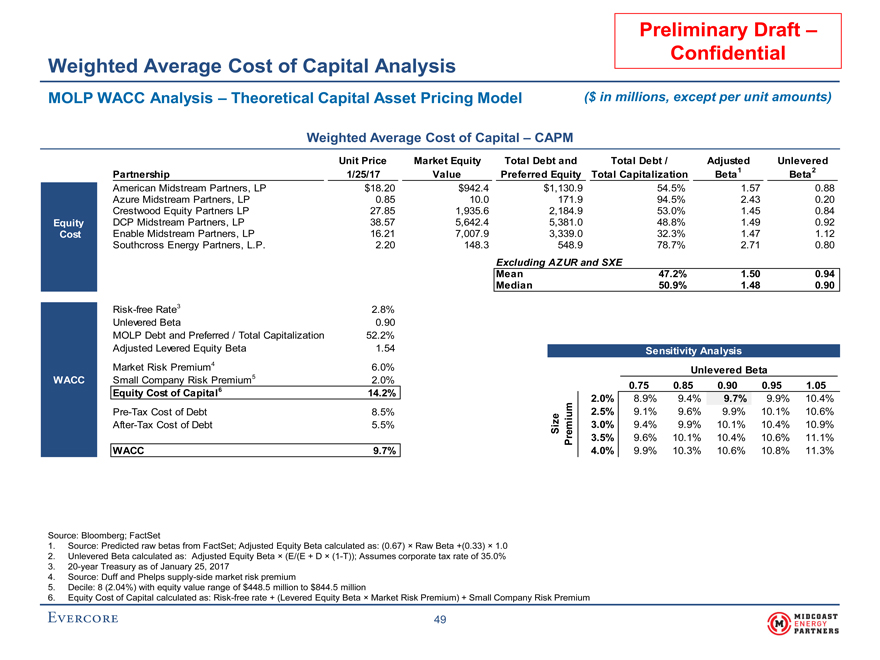
Weighted Average Cost of Capital Analysis MOLP WACC Analysis – Theoretical Capital Asset Pricing Model ($ in millions, except per unit amounts) Weighted Average Cost of Capital – CAPM Unit Price Market Equity Total Debt and Total Debt / Adjusted Unlevered Partnership 1/25/17 Value Preferred Equity Total Capitalization Beta1 Beta2 American Midstream Partners, LP $18.20 $942.4 $1,130.9 54.5% 1.57 0.88 Azure Midstream Partners, LP 0.85 10.0 171.9 94.5% 2.43 0.20 Crestwood Equity Partners LP 27.85 1,935.6 2,184.9 53.0% 1.45 0.84 Equity DCP Midstream Partners, LP 38.57 5,642.4 5,381.0 48.8% 1.49 0.92 Cost Enable Midstream Partners, LP 16.21 7,007.9 3,339.0 32.3% 1.47 1.12 Southcross Energy Partners, L.P. 2.20 148.3 548.9 78.7% 2.71 0.80 Excluding AZUR and SXE Mean 47.2% 1.50 0.94 Median 50.9% 1.48 0.90 Risk-free Rate3 2.8% Unlevered Beta 0.90 MOLP Debt and Preferred / Total Capitalization 52.2% Adjusted Levered Equity Beta 1.54 Sensitivity Analysis Market Risk Premium4 6.0% 5 Unlevered Beta WACC Small Company Risk Premium 2.0% 9.7% 0.75 0.85 0.90 0.95 1.05 Equity Cost of Capital6 14.2% 2.0% 8.9% 9.4% 9.7% 9.9% 10.4%Pre-Tax Cost of Debt 8.5%ize 2.5% 9.1% 9.6% 9.9% 10.1% 10.6%After-Tax Cost of Debt 5.5% S mium 3.0% 9.4% 9.9% 10.1% 10.4% 10.9% r e 3.5% 9.6% 10.1% 10.4% 10.6% 11.1% WACC 9.7% P 4.0% 9.9% 10.3% 10.6% 10.8% 11.3% Source: Bloomberg; FactSet 1. Source: Predicted raw betas from FactSet; Adjusted Equity Beta calculated as: (0.67) × Raw Beta +(0.33) × 1.0 2. Unlevered Beta calculated as: Adjusted Equity Beta × (E/(E + D ×(1-T)); Assumes corporate tax rate of 35.0% 3.20-year Treasury as of January 25, 2017 4. Source: Duff and Phelps supply-side market risk premium 5. Decile: 8 (2.04%) with equity value range of $448.5 million to $844.5 million 6. Equity Cost of Capital calculated as: Risk-free rate + (Levered Equity Beta × Market Risk Premium) + Small Company Risk Premium
49
|
B. Midcoast Financial Projections
|
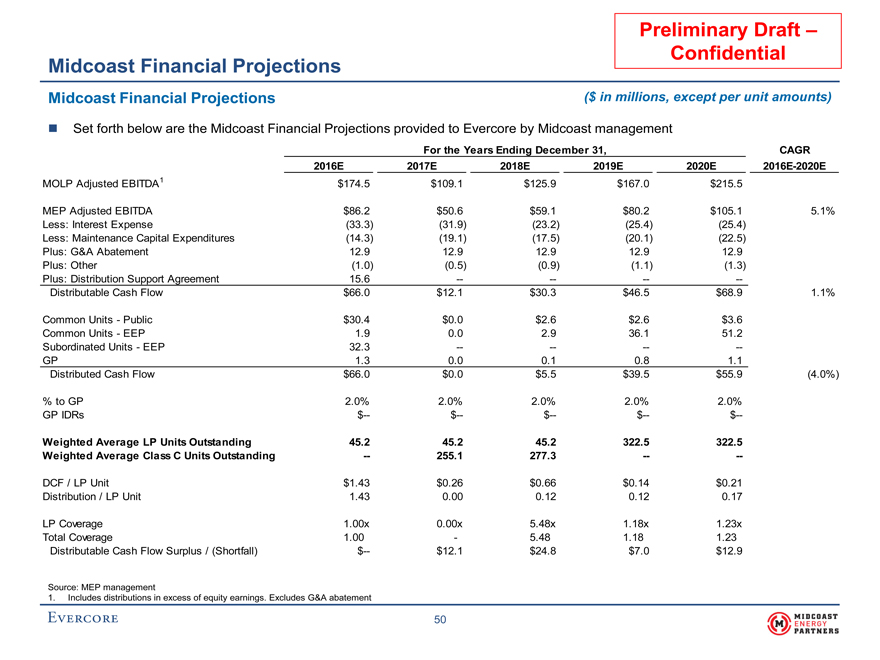
Confidential
Midcoast Financial Projections Midcoast Financial Projections ($ in millions, except per unit amounts) Set forth below are the Midcoast Financial Projections provided to Evercore by Midcoast management For the Years Ending December 31, CAGR 2016E 2017E 2018E 2019E 2020E 2016E-2020E MOLP Adjusted EBITDA1 $174.5 $109.1 $125.9 $167.0 $215.5 MEP Adjusted EBITDA $86.2 $50.6 $59.1 $80.2 $105.1 5.1% Less: Interest Expense (33.3) (31.9) (23.2) (25.4) (25.4) Less: Maintenance Capital Expenditures (14.3) (19.1) (17.5) (20.1) (22.5) Plus: G&A Abatement 12.9 12.9 12.9 12.9 12.9 Plus: Other (1.0) (0.5) (0.9) (1.1) (1.3) Plus: Distribution Support Agreement 15.6 -- -- -- --Distributable Cash Flow $66.0 $12.1 $30.3 $46.5 $68.9 1.1% Common Units - Public $30.4 $0.0 $2.6 $2.6 $3.6 Common Units - EEP 1.9 0.0 2.9 36.1 51.2 Subordinated Units - EEP 32.3 -- -- ----GP 1.3 0.0 0.1 0.8 1.1 Distributed Cash Flow $66.0 $0.0 $5.5 $39.5 $55.9 (4.0%) % to GP 2.0% 2.0% 2.0% 2.0% 2.0% GP IDRs $-- $-- $-- $-- $-- Weighted Average LP Units Outstanding 45.2 45.2 45.2 322.5 322.5 Weighted Average Class C Units Outstanding -- 255.1 277.3 -- -- DCF / LP Unit $1.43 $0.26 $0.66 $0.14 $0.21 Distribution / LP Unit 1.43 0.00 0.12 0.12 0.17 LP Coverage 1.00x 0.00x 5.48x 1.18x 1.23x Total Coverage 1.00 - 5.48 1.18 1.23 Distributable Cash Flow Surplus / (Shortfall) $-- $12.1 $24.8 $7.0 $12.9 Source: MEP management 1. Includes distributions in excess of equity earnings. Excludes G&A abatement
50
|
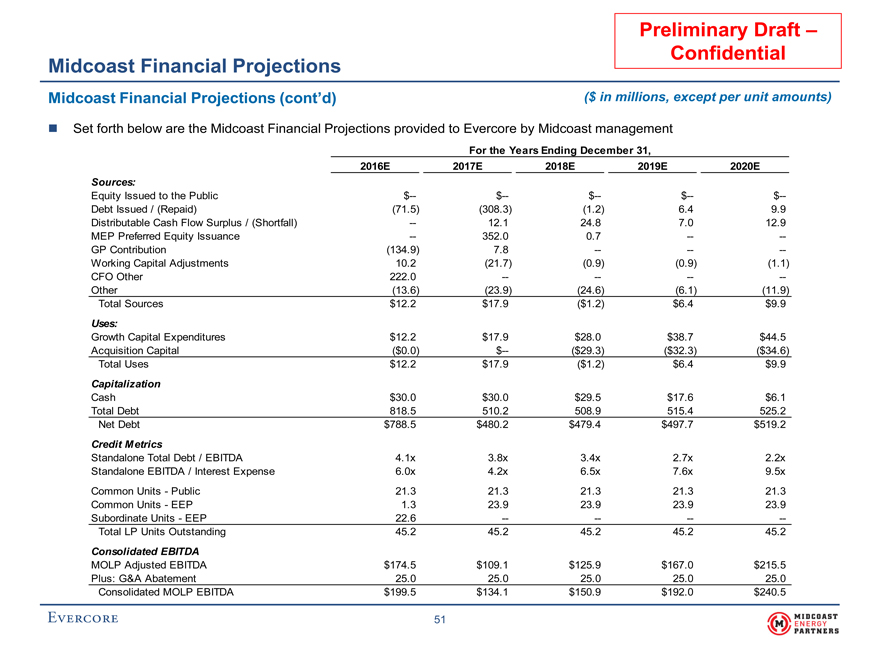
Midcoast Financial Projections Midcoast Financial Projections (cont’d) ($ in millions, except per unit amounts) Set forth below are the Midcoast Financial Projections provided to Evercore by Midcoast management For the Years Ending December 31, 2016E 2017E 2018E 2019E 2020E Sources: Equity Issued to the Public $-- $-- $-- $-- $--Debt Issued / (Repaid) (71.5) (308.3) (1.2) 6.4 9.9 Distributable Cash Flow Surplus / (Shortfall) -- 12.1 24.8 7.0 12.9 MEP Preferred Equity Issuance -- 352.0 0.7 ----GP Contribution (134.9) 7.8 -- -- --Working Capital Adjustments 10.2 (21.7) (0.9) (0.9) (1.1) CFO Other 222.0 -- -- -- --Other (13.6) (23.9) (24.6) (6.1) (11.9) Total Sources $12.2 $17.9 ($1.2) $6.4 $9.9 Uses: Growth Capital Expenditures $12.2 $17.9 $28.0 $38.7 $44.5 Acquisition Capital ($0.0) $-- ($29.3) ($32.3) ($34.6) Total Uses $12.2 $17.9 ($1.2) $6.4 $9.9 Capitalization Cash $30.0 $30.0 $29.5 $17.6 $6.1 Total Debt 818.5 510.2 508.9 515.4 525.2 Net Debt $788.5 $480.2 $479.4 $497.7 $519.2 Credit Metrics Standalone Total Debt / EBITDA 4.1x 3.8x 3.4x 2.7x 2.2x Standalone EBITDA / Interest Expense 6.0x 4.2x 6.5x 7.6x 9.5x Common Units - Public 21.3 21.3 21.3 21.3 21.3 Common Units - EEP 1.3 23.9 23.9 23.9 23.9 Subordinate Units - EEP 22.6 -- -- -- --Total LP Units Outstanding 45.2 45.2 45.2 45.2 45.2 Consolidated EBITDA MOLP Adjusted EBITDA $174.5 $109.1 $125.9 $167.0 $215.5 Plus: G&A Abatement 25.0 25.0 25.0 25.0 25.0 Consolidated MOLP EBITDA $199.5 $134.1 $150.9 $192.0 $240.5
51
|
C. Tax Input to Unitholders
|
Confidential Tax Input to Unitholders Potential Standalone Alternatives Evercore analyzed the estimated unitholder tax basis data as provided by MEP management and as calculated by PricewaterhouseCoopers Plc Utilizedpre-merger tax data for schedulesK-1 for MEP Analysis as of December 31, 2015 Utilized MEP unit price of $8.00 based on the Proposed Consideration
52
|
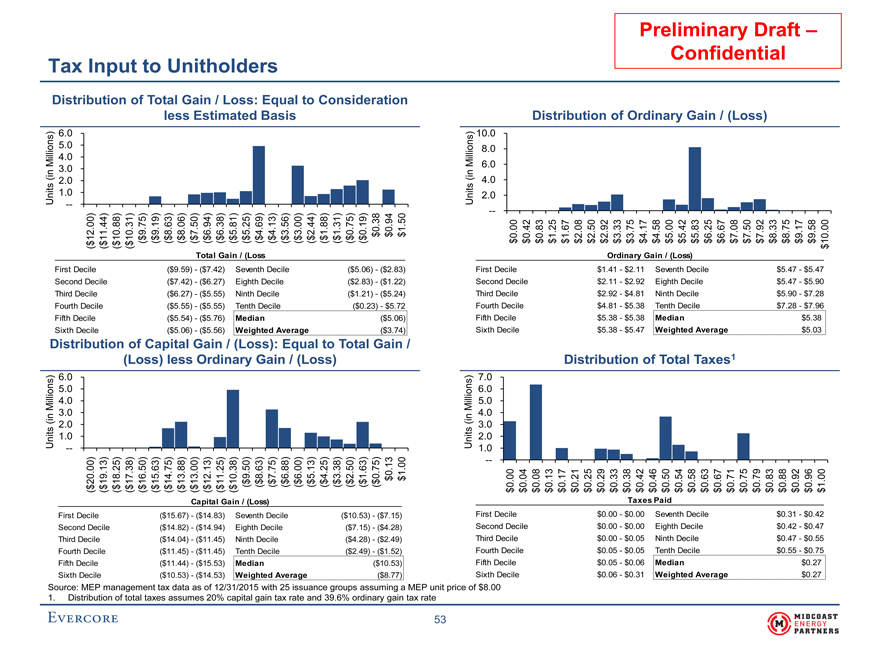
Confidential Tax Input to Unitholders Distribution of Total Gain / Loss: Equal to Consideration less Estimated Basis Distribution of Ordinary Gain / (Loss) s) 6.0 s) 10.0 ion 5.0 ion 8.0 ll Mi 4.0 Mi ll 6.0 (in 3.0 (in 2.0 4.0 Units 1.0 Units 2.0 ----. 00) 9.75) 9.19) 8.63) 8.06) 7.50) 6.94) 6.38) 5.81) 5.25) 4.69) 4.13) 3.56) 3.00) 2.44) 1.88) 1.31) 0.75) 0.19) 0.38 0.94 1.50 12 11.44) 10.88) 10.31) $ $ $ 0.00 0.42 0.83 1.25 1.67 2.08 2.50 2.92 3.33 3.75 4.17 4.58 5.00 5.42 5.83 6.25 6.67 7.08 7.50 7.92 8.33 8.75 9.17 9.58 ( $ $ $ $ $ $ $ $ $ $ $ ( $ $ ( $ $ $ $ $ 10.00 $ $ $ $ ( ( ( ( ( ( ( ( ( ( ( ( ( ( ( $ $ $ $ $ $ $ $ $ $ $ $ $ $ $ $ $ $ $ $ $ $ $ $ ( ( ( ( $ Total Gain / (Loss Ordinary Gain / (Loss) First Decile ($9.59) - ($7.42) Seventh Decile ($5.06) - ($2.83) First Decile $1.41 - $2.11 Seventh Decile $5.47 - $5.47 Second Decile ($7.42) - ($6.27) Eighth Decile ($2.83) - ($1.22) Second Decile $2.11 - $2.92 Eighth Decile $5.47 - $5.90 Third Decile ($6.27) - ($5.55) Ninth Decile ($1.21) - ($5.24) Third Decile $2.92 - $4.81 Ninth Decile $5.90 - $7.28 Fourth Decile ($5.55) - ($5.55) Tenth Decile ($0.23) - $5.72 Fourth Decile $4.81 - $5.38 Tenth Decile $7.28 - $7.96 Fifth Decile ($5.54) - ($5.76) Median ($5.06) Fifth Decile $5.38 - $5.38 Median $5.38 Sixth Decile ($5.06) - ($5.56) Weighted Average ($3.74) Sixth Decile $5.38 - $5.47 Weighted Average $5.03 Distribution of Capital Gain / (Loss): Equal to Total Gain / (Loss) less Ordinary Gain / (Loss) Distribution of Total Taxes1 s) 6.0 s) 7.0 lion 5.0 lion 6.0 Mi l 4.0 Mi l 5.0 n 3.0 n 4.0 (i 2.0(i 3.0 Units 1.0 Units 2.0 -- 1.0 00) -- . 9.50) 8.63) 7.75) 6.88) 6.00) 5.13) 4.25) 3.38) 2.50) 1.63) 0.75) 0.13 1.00 20 19.13) 18.25) 17.38) 16.50) 15.63) 14.75) 13.88) 13.00) 12.13) 11.25) 10.38) $ $ $ $ $ $ $ $ $ $ $ $ $ $ ( $ ( $ ( $ ( $ $ ( ( $ ( $ $ ( ( $ $ ( ( $ 0.00 0.04 0.08 0.13 0.17 0.21 0.25 0.29 0.33 0.38 0.42 0.46 0.50 0.54 0.58 0.63 0.67 0.71 0.75 0.79 0.83 0.88 0.92 0.96 1.00 ( ( ( ( ( ( ( ( ( ( ( ( $ $ $ $ $ $ $ $ $ $ $ $ $ $ $ $ $ $ $ $ $ $ $ $ $ Capital Gain / (Loss) Taxes Paid First Decile ($15.67) - ($14.83) Seventh Decile ($10.53) - ($7.15) First Decile $0.00 - $0.00 Seventh Decile $0.31 - $0.42 Second Decile ($14.82) - ($14.94) Eighth Decile ($7.15) - ($4.28) Second Decile $0.00 - $0.00 Eighth Decile $0.42 - $0.47 Third Decile ($14.04) - ($11.45) Ninth Decile ($4.28) - ($2.49) Third Decile $0.00 - $0.05 Ninth Decile $0.47 - $0.55 Fourth Decile ($11.45) - ($11.45) Tenth Decile ($2.49) - ($1.52) Fourth Decile $0.05 - $0.05 Tenth Decile $0.55 - $0.75 Fifth Decile ($11.44) - ($15.53) Median ($10.53) Fifth Decile $0.05 - $0.06 Median $0.27 Sixth Decile ($10.53) - ($14.53) Weighted Average ($8.77) Sixth Decile $0.06 - $0.31 Weighted Average $0.27 Source: MEP management tax data as of 12/31/2015 with 25 issuance groups assuming a MEP unit price of $8.00 1. Distribution of total taxes assumes 20% capital gain tax rate and 39.6% ordinary gain tax rate
53
|
D. Midcoast Peer Group Trading Comparison
|

Confidential
Midcoast Peer Group Trading Comparison Gathering & Processing MLPs with Commodity Price Sensitivity/Producer Volume Exposure (Individual) 180% 170% 169.2% 160% 150% Price 140% 139.2% Relative 130% 123.0% 120% 120.1% 112.0% 110% 101.9% 100% 90% 85.0% 80% 12/2/16 12/7/16 12/12/16 12/18/16 12/23/16 12/29/16 1/3/17 1/8/17 1/14/17 1/19/17 1/25/17 MEP AMID AZUR CEQP DCP ENBL SXE Source: FactSet 54
|
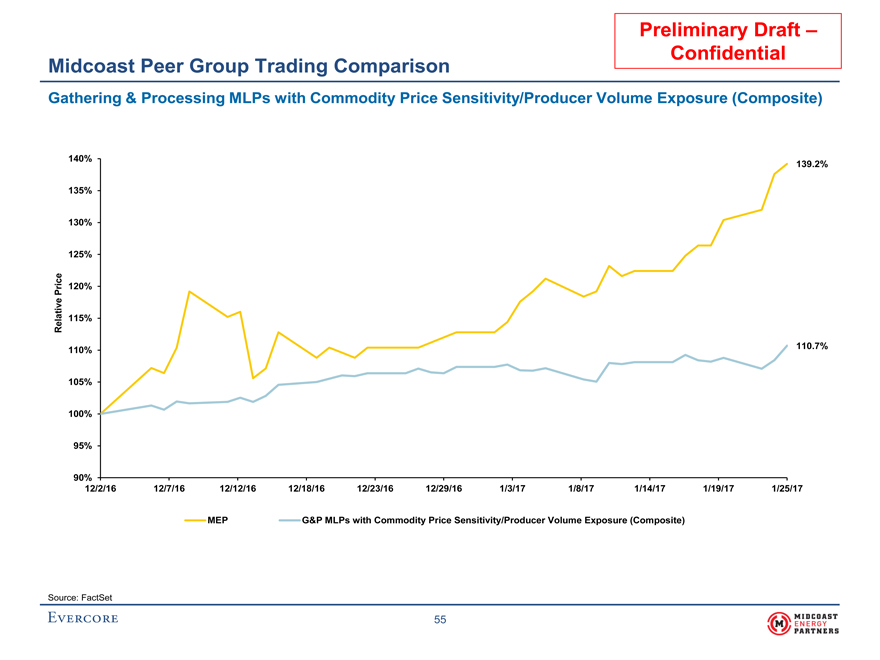
Confidential Midcoast Peer Group Trading Comparison Gathering & Processing MLPs with Commodity Price Sensitivity/Producer Volume Exposure (Composite) 140% 139.2% 135% 130% 125% Price 120% e Rela tiv 115% 110.7% 110% 105% 100% 95% 90% 12/2/16 12/7/16 12/12/16 12/18/16 12/23/16 12/29/16 1/3/17 1/8/17 1/14/17 1/19/17 1/25/17 MEP G&P MLPs with Commodity Price Sensitivity/Producer Volume Exposure (Composite) Source: FactSet 55
|
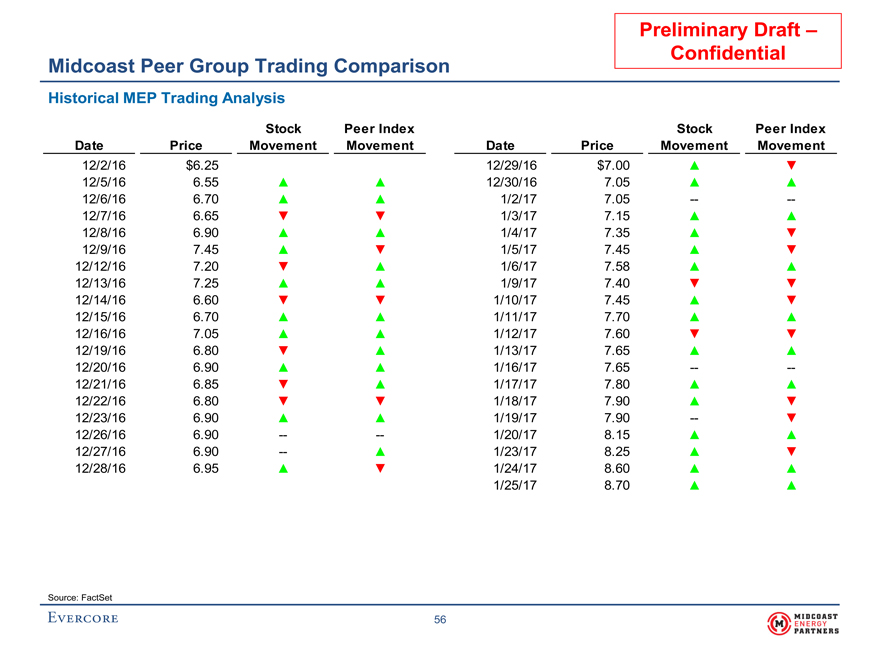
Confidential
Midcoast Peer Group Trading Comparison Historical MEP Trading Analysis Stock Peer Index Stock Peer Index Date Price Movement Movement Date Price Movement Movement 12/2/16 $6.25 12/29/16 $7.00 ? ? 12/5/16 6.55 ? ? 12/30/16 7.05 ? ? 12/6/16 6.70 ? ? 1/2/17 7.05 ----12/7/16 6.65 1/3/17 7.15 12/8/16 6.90 1/4/17 7.35 12/9/16 7.45 1/5/17 7.45 12/12/16 7.20 1/6/17 7.58 12/13/16 7.25 1/9/17 7.40 12/14/16 6.60 1/10/17 7.45 12/15/16 6.70 1/11/17 7.70 12/16/16 7.05 1/12/17 7.60 12/19/16 6.80 1/13/17 7.65 12/20/16 6.90 1/16/17 7.65 ----12/21/16 6.85 1/17/17 7.80 12/22/16 6.80 1/18/17 7.90 12/23/16 6.90 1/19/17 7.90 -- 12/26/16 6.90 -- -- 1/20/17 8.15 12/27/16 6.90 -- 1/23/17 8.25 12/28/16 6.95 1/24/17 8.60 1/25/17 8.70 Source: FactSet
56
|
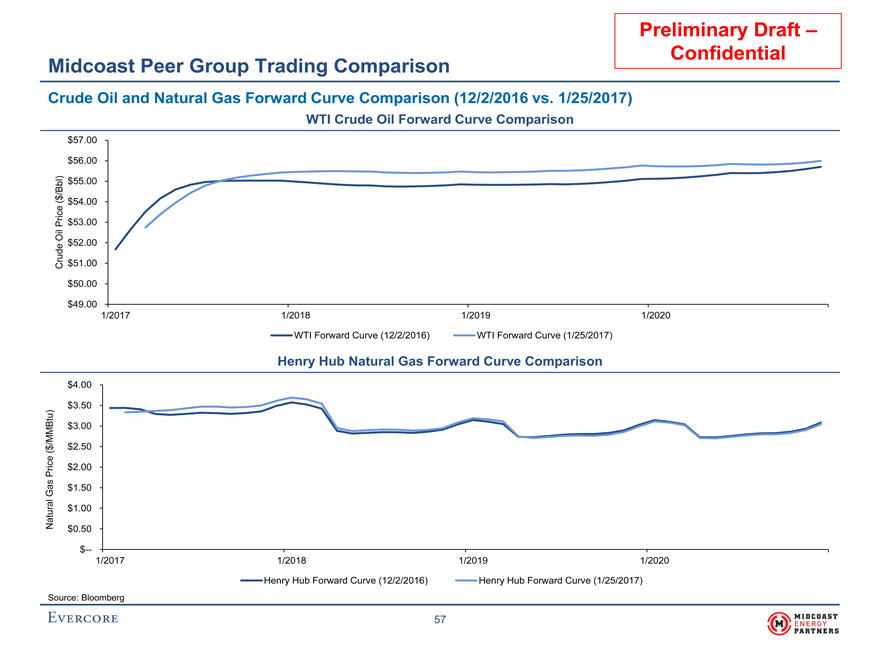
Confidential Midcoast Peer Group Trading Comparison Crude Oil and Natural Gas Forward Curve Comparison (12/2/2016 vs. 1/25/2017) WTI Crude Oil Forward Curve Comparison $57.00 $56.00 l ) $55.00 $ /Bb ( $54.00 c e Pri $53.00 Oil e $52.00 d Cru $51.00 $50.00 $49.00 1/2017 1/2018 1/2019 1/2020 WTI Forward Curve (12/2/2016) WTI Forward Curve (1/25/2017) Henry Hub Natural Gas Forward Curve Comparison $4.00 $3.50 u ) M Bt $3.00 /M ( $ $2.50 ce Pri $2.00 Gas $1.50 ral $1.00 Natu $0.50 $-- 1/2017 1/2018 1/2019 1/2020 Henry Hub Forward Curve (12/2/2016) Henry Hub Forward Curve (1/25/2017) Source: Bloomberg
57