
FY 2018 & 2019 Emerald unaudited historical income statement trending based on new reportable segments Exhibit 99.1
Unaudited Historical Income Statement Trending – 2018 & 2019 Unaudited Historical Income Statement Trending – 2018 & 2019 Consolidated 3 Commerce Reportable Segment 4 Design & Technology Reportable Segment 5 All Other and Corporate 6
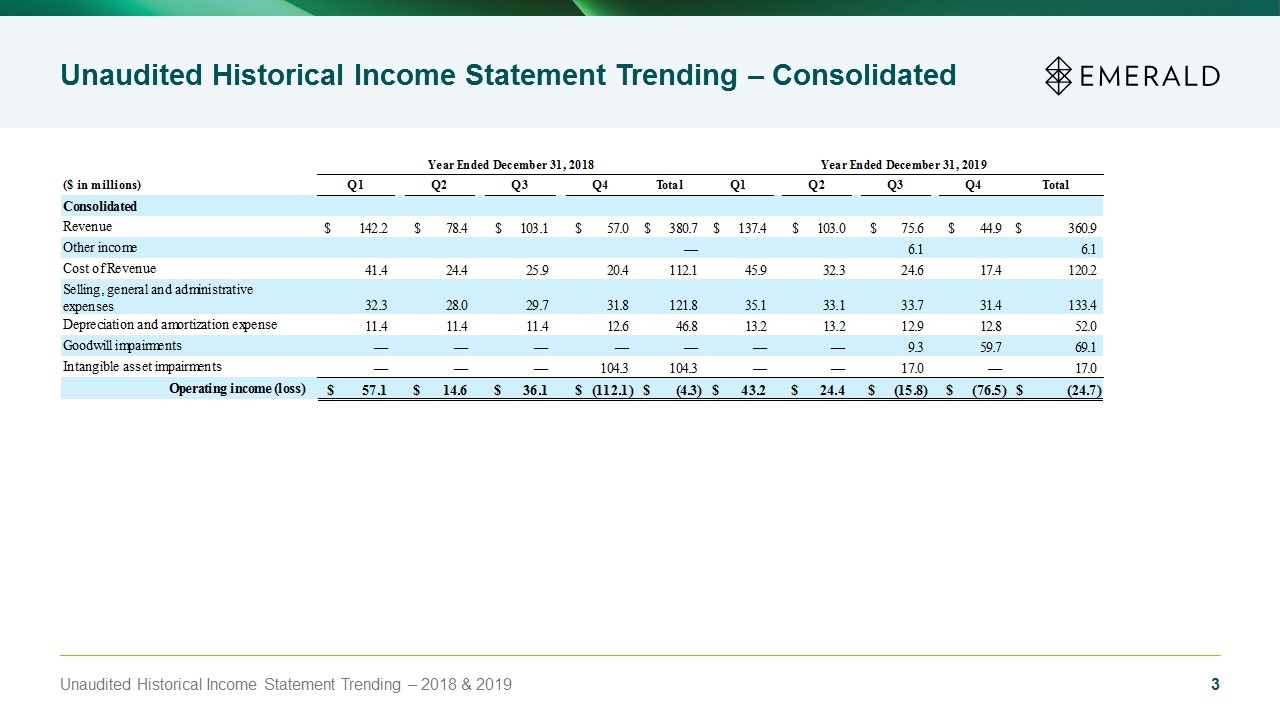
Unaudited Historical Income Statement Trending – Consolidated Unaudited Historical Income Statement Trending – 2018 & 2019 Unaudited Historical Income Statement Trending – Consolidated Year Ended December 31, 2018 Year Ended December 31, 2019 ($ in millions) Q1 Q2 Q3 Q4 Total Q1 Q2 Q3 Q4 Total Consolidated Revenue $142.2 $78.4 $103.1 $57.0 $137.4 $103.0 $75.6 $44.9 $360.9 Other income — 6.1 6.1 Cost of Revenue 41.4 24.4 25.9 20.4 112.1 45.9 32.3 24.6 17.4 120.2 Selling, general and administrative expenses 32.3 28.0 29.7 31.8 121.8 35.1 33.1 33.7 31.4 133.4 Depreciation and amortization expense 11.4 11.4 11.4 12.6 46.8 13.2 13.2 12.9 12.8 52.0 Goodwill impairments — — — — — — — 9.3 59.7 69.1 Intangible asset impairments— — — 104.3 104.3 — — 17.0 — 17.0 Operating income (loss) $57.1 $14.6 $36.1 $(112.1) $(4.3) $43.2 $24.4 $(15.8) $(76.5) $(24.7)
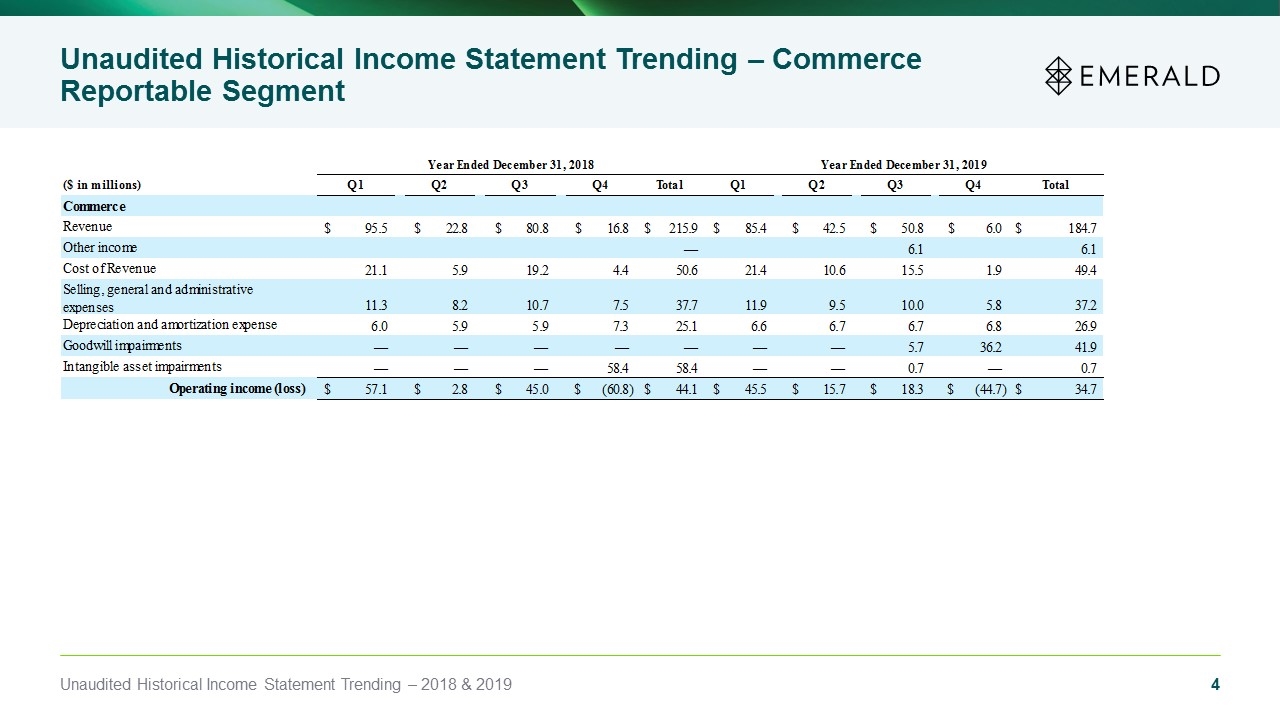
Unaudited Historical Income Statement Trending – Commerce Reportable Segment Unaudited Historical Income Statement Trending – Commerce Reportable Segment Unaudited Year Ended December 31, 2018 Year Ended December 31, 2019 ($ in millions) Q1 Q2 Q3 Q4 Total Q1 Q2 Q3 Q4 Total Commerce Revenue $95.5 $22.8 $80.8 $16.8 $215.9 $85.4 $42.5 $50.8 $6.0 $184.7 Other income — 6.1 6.1 Cost of Revenue 21.1 5.9 19.2 4.4 50.6 21.4 10.6 15.5 1.9 49.4 Selling, general and administrative expenses 11.3 8.2 10.7 7.5 37.7 11.9 9.5 10.0 5.8 37.2 Depreciation and amortization expense 6.0 5.9 5.9 7.3 25.1 6.6 6.7 6.7 6.8 26.9 Goodwill impairments — — — — — — — 5.7 36.2 41.9 Intangible asset impairments — — — 58.4 58.4 — — 0.7 — 0.7 Operating income (loss) $57.1 $2.8 $45.0 $(60.8) $44.1 $45.5 $15.7 $18.3 $(47.7) $34.7 Unaudited Historical Income Statement Trending – 2018 & 2019
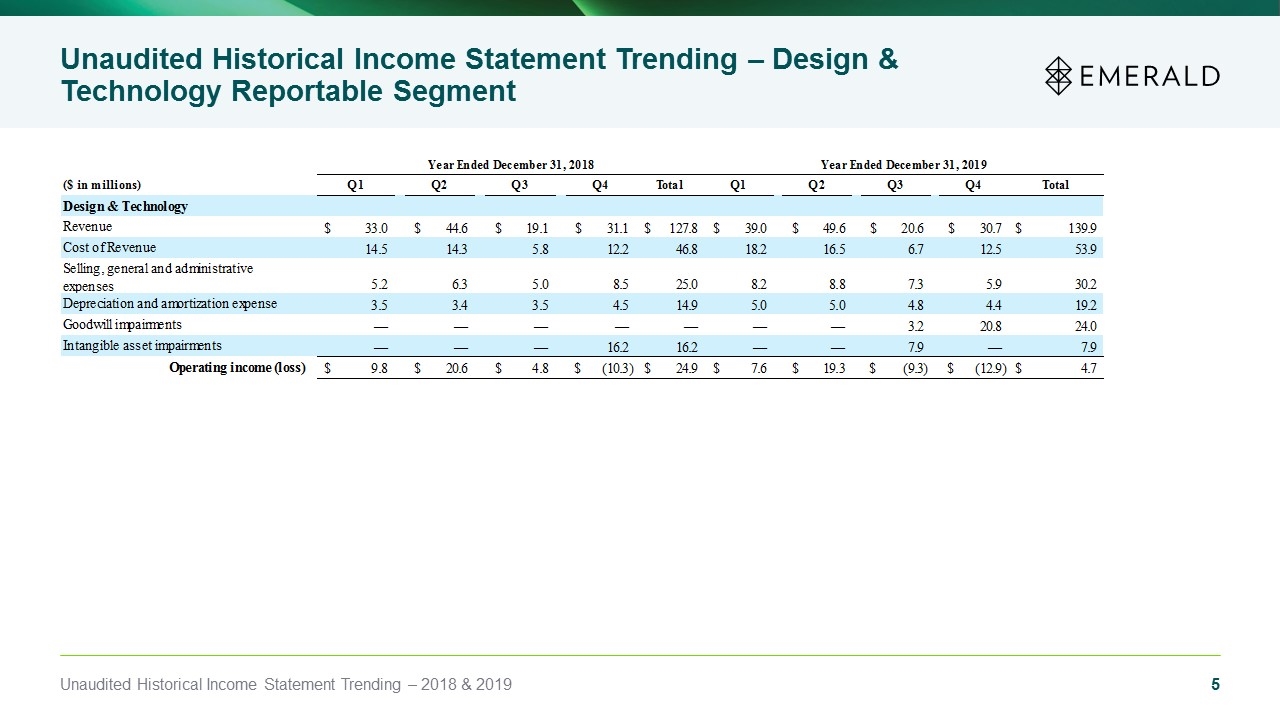
Unaudited Historical Income Statement Trending – Design & Technology Reportable Segment Unaudited Historical Income Statement Trending – 2018 & 2019 Unaudited Historical Income Statement Trending – Design & Technology Reportable Segment Year Ended December 31, 2018 Year Ended December 31, 2019 ($ in millions) Q1 Q2 Q3 Q4 Total Q1 Q2 Q3 Q4 Total Design & Technology Revenue $33.0 $44.6 $19.1 $31.1 $127.8 $39.0 $49.6 $20.6 $30.7 $139.9 Cost of Revenue 14.5 14.3 5.8 12.2 46.8 18.2 16.5 6.7 12.5 53.9 Selling, general and administrative expenses 5.2 6.3 5.0 8.5 25.0 8.2 8.8 7.3 5.9 30.2 Depreciation and amortization expense 3.5 3.4 3.5 4.5 14.9 5.0 5.0 4.8 4.4 19.2 Goodwill impairments — — — — — — — 3.2 20.8 24.0 Intangible asset impairments — — — 16.2 16.2 — — 7.9 — 7.9 Operating income (loss) $9.8 $20.6 $4.8 $(10.3) $24.9 $7.6 $19.3 $(9.3) $(12.9) $4.7
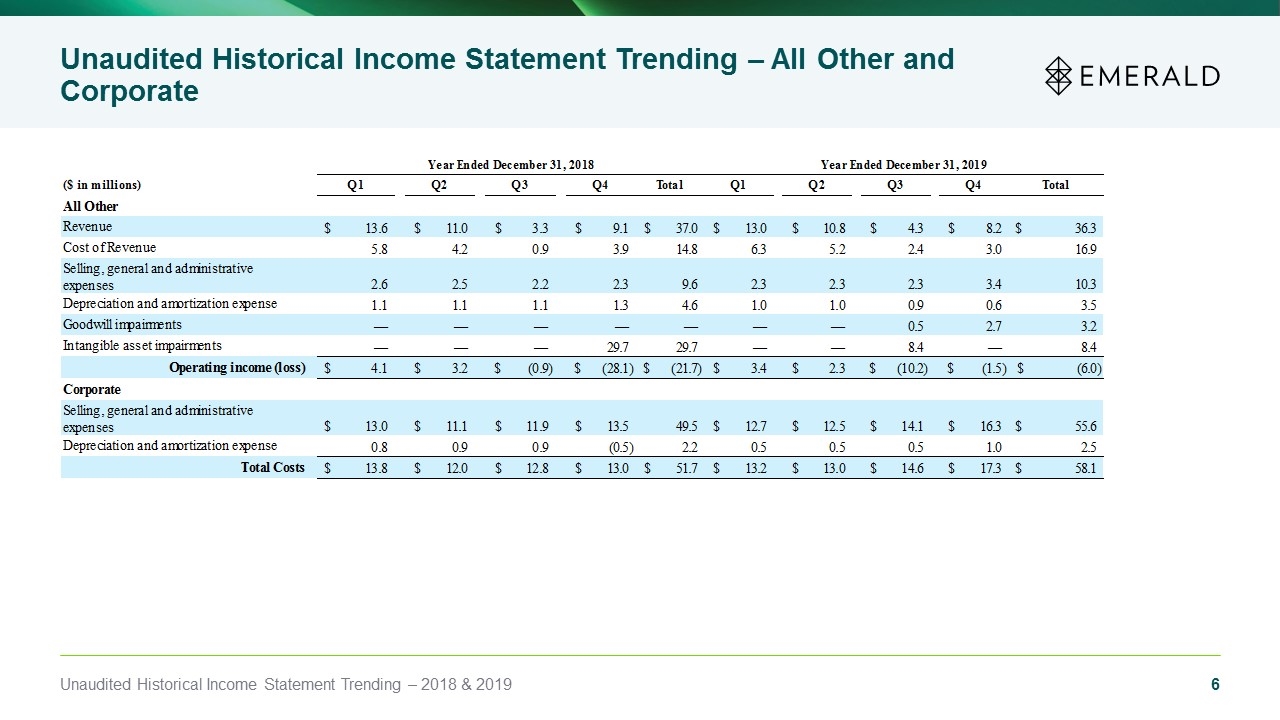
Unaudited Historical Income Statement Trending – All Other and Corporate Unaudited Historical Income Statement Trending – All Other and Corporate Year Ended December 31, 2018 Year Ended December 31, 2019 ($ in millions) Q1 Q2 Q3 Q4 Total Q1 Q2 Q3 Q4 Total All Other Revenue $13.6 $11.0 $3.3 $9.1 $37.0 $13.0 $10.8 $4.3 $8.2 $36.3 Cost of Revenue 5.8 4.2 0.9 3.9 14.8 6.3 5.2 2.4 3.0 16.9 Selling, general and administrative expenses 2.6 2.5 2.2 2.3 9.6 2.3 2.3 2.3 3.4 10.3 Depreciation and amortization expense 1.1 1.1 1.1 1.3 4.6 1.0 1.0 0.9 0.6 3.5 Goodwill impairments — — — — — — — 0.5 2.7 3.2 Intangible asset impairments — — — 29.7 29.7 — — 8.4 — 8.4 Operating income (loss) $4.1 $3.2 $(0.9) $(28.1) $(21.7) $3.4 $2.3 $(10.2) $(1.5) $(6.0) Corporate Selling, general and administrative expenses $13.0 $11.1 $11.9 $13.5 $49.5 $12.7 $12.5 $14.1 $16.3 $55.6 Depreciation and amortization expense 0.8 0.9 0.9 (0.5) 2.2 0.5 0.5 0.5 1.0 2.5 Total Costs $13.8 $12.0 $12.8 $13.0 $51.7 $13.2 $13.0 $14.6 $17.3 $58.1 Unaudited Historical Income Statement Trending – 2018 & 2019


