
Emerald Holding, Inc. March 2021 Exhibit 99.1
Notes Forward-Looking Statements This document contains certain forward-looking statements regarding Emerald Holding, Inc. (the “Company”), including, without limitation, the Company’s ability to recover proceeds under its current event cancellation insurance policy and the timing and amount of any such insurance recoveries. These statements are based on management’s current expectations as well as estimates and assumptions prepared by management that, although they are believed to be reasonable, are inherently uncertain. These statements involve risks and uncertainties outside of the Company’s control that may cause actual results to differ materially. In particular, statements regarding the potential continuing impact of the pandemic outbreak of COVID-19 on the Company’s business and the expected return to organic growth; outcome of the Company’s litigation against the insurers under the Company’s event cancellation insurance policies; projected recurring revenue from customer retention rates; and projected cost savings are each forward-looking statements. See “Risk Factors” and “Cautionary Note Regarding Forward-Looking Statements” in the Company’s most recently filed periodic reports on Form 10-K and Form 10-Q and subsequent filings. The Company undertakes no obligation to update or revise any of the forward-looking statements contained herein, whether as a result of new information, future events or otherwise, or with respect to ongoing insurance recovery amounts. 2
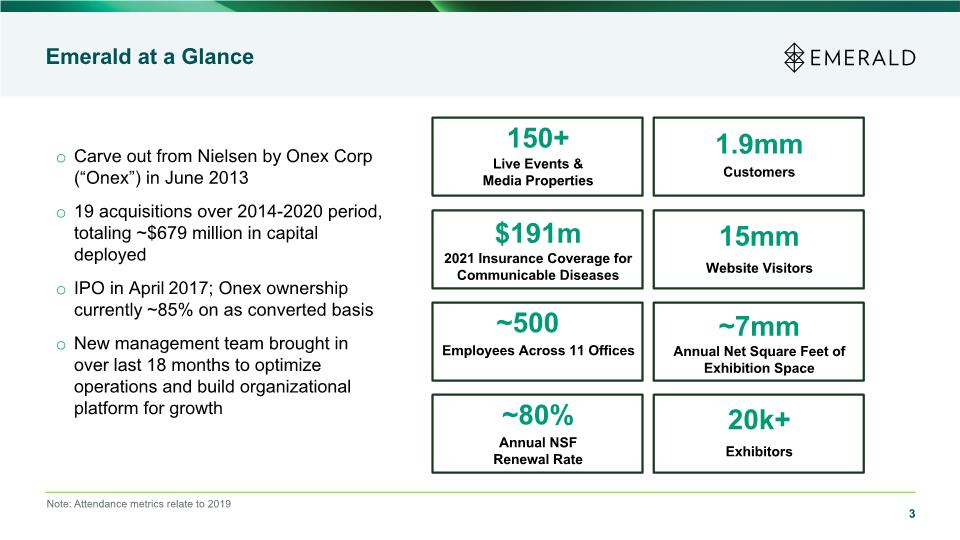
Carve out from Nielsen by Onex Corp (“Onex”) in June 2013 19 acquisitions over 2014-2020 period, totaling ~$679 million in capital deployed IPO in April 2017; Onex ownership currently ~85% on as converted basis New management team brought in over last 18 months to optimize operations and build organizational platform for growth Emerald at a Glance 150+ 1.9mm $191m 15mm Live Events & Media Properties Customers 2021 Insurance Coverage for Communicable Diseases Website Visitors Employees Across 11 Offices ~500 Annual NSF Renewal Rate ~80% ~7mm Annual Net Square Feet of Exhibition Space 20k+ Exhibitors 3 Note: Attendance metrics relate to 2019
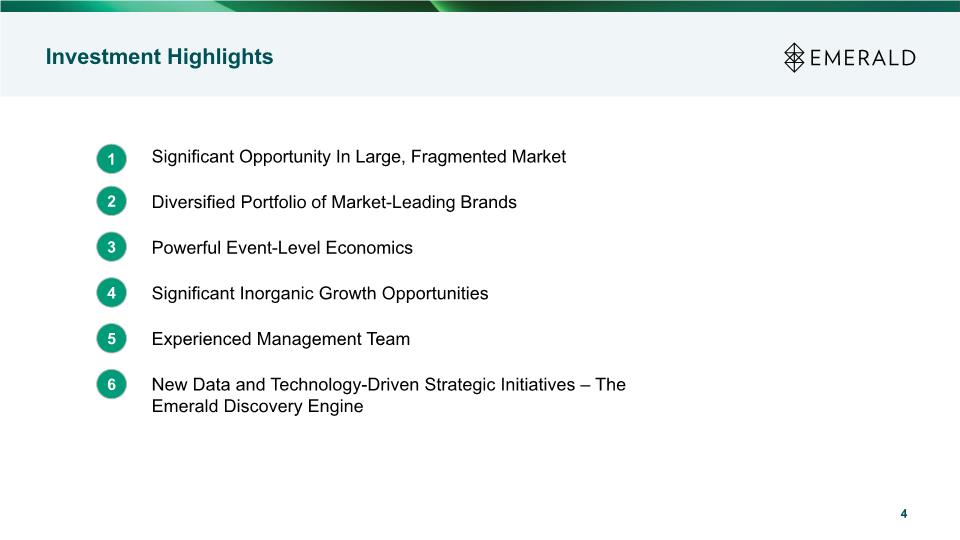
4 Investment Highlights Significant Opportunity In Large, Fragmented Market Diversified Portfolio of Market-Leading Brands Powerful Event-Level Economics Significant Inorganic Growth Opportunities Experienced Management Team New Data and Technology-Driven Strategic Initiatives – The Emerald Discovery Engine 1 2 3 4 5 6
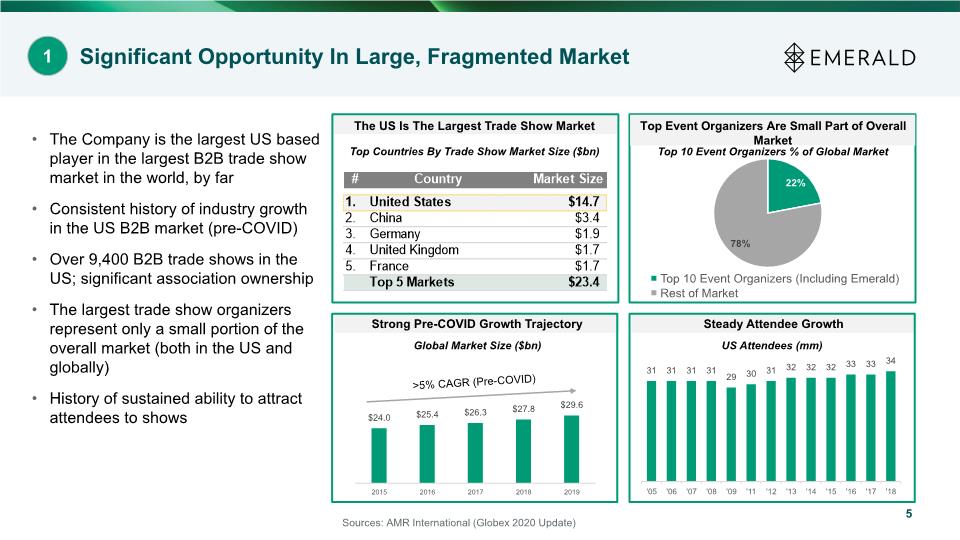
Steady Attendee Growth Strong Pre-COVID Growth Trajectory The US Is The Largest Trade Show Market 5 Significant Opportunity In Large, Fragmented Market Sources: AMR International (Globex 2020 Update) The Company is the largest US based player in the largest B2B trade show market in the world, by far Consistent history of industry growth in the US B2B market (pre-COVID) Over 9,400 B2B trade shows in the US; significant association ownership The largest trade show organizers represent only a small portion of the overall market (both in the US and globally) History of sustained ability to attract attendees to shows >5% CAGR (Pre-COVID) Global Market Size ($bn) Top Countries By Trade Show Market Size ($bn) US Attendees (mm) 1 Top 10 Event Organizers % of Global Market Top Event Organizers Are Small Part of Overall Market
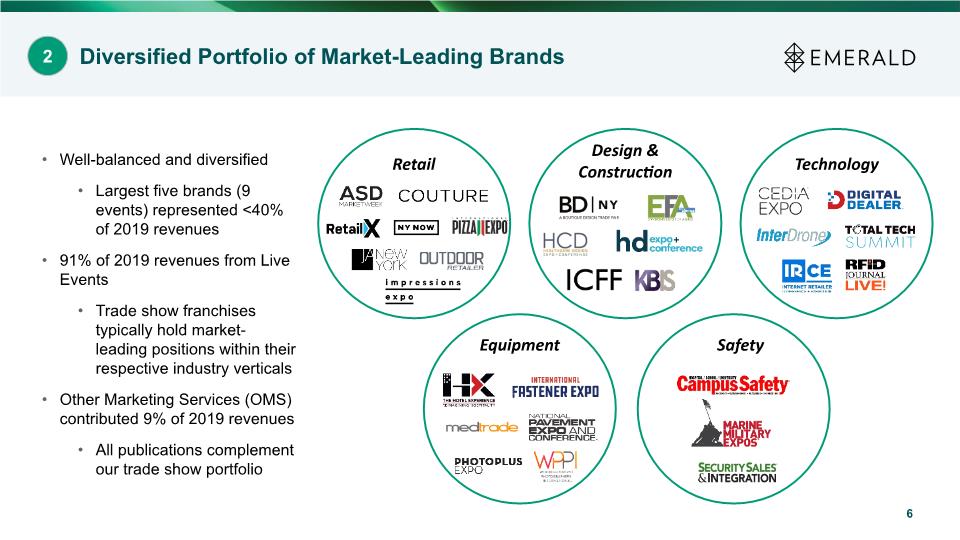
6 Well-balanced and diversified Largest five brands (9 events) represented <40% of 2019 revenues 91% of 2019 revenues from Live Events Trade show franchises typically hold market-leading positions within their respective industry verticals Other Marketing Services (OMS) contributed 9% of 2019 revenues All publications complement our trade show portfolio Retail Design & Construction Technology Equipment Safety Diversified Portfolio of Market-Leading Brands 2
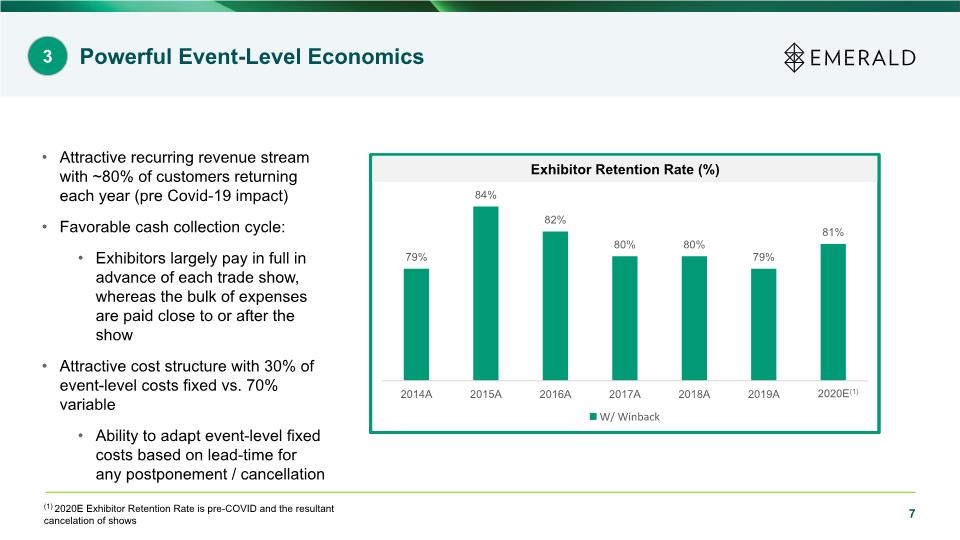
Attractive recurring revenue stream with ~80% of customers returning each year (pre Covid-19 impact) Favorable cash collection cycle: Exhibitors largely pay in full in advance of each trade show, whereas the bulk of expenses are paid close to or after the show Attractive cost structure with 30% of event-level costs fixed vs. 70% variable Ability to adapt event-level fixed costs based on lead-time for any postponement / cancellation 7 Powerful Event-Level Economics 3 Exhibitor Retention Rate (%) (1) 2020E Exhibitor Retention Rate is pre-COVID and the resultant cancelation of shows 2020E(1)
A large universe of independent trade shows still exists globally; the Top 15 independent shows in the US alone represent a >$250mm revenue opportunity Top 250 Events: 63.1mm total net square footage 3.2mm total attendees 187,336 total exhibiting companies Tangential revenue opportunities abundant in marketing services, digital media, exhibitor and attendee education, etc. Management team with significant experience in M&A execution and integration Recent capital raise/strong balance sheet present opportunity to take advantage of current market disruption and distressed assets 8 Source: TSNN Top Trade Show Lists Significant Inorganic Growth Opportunities 4
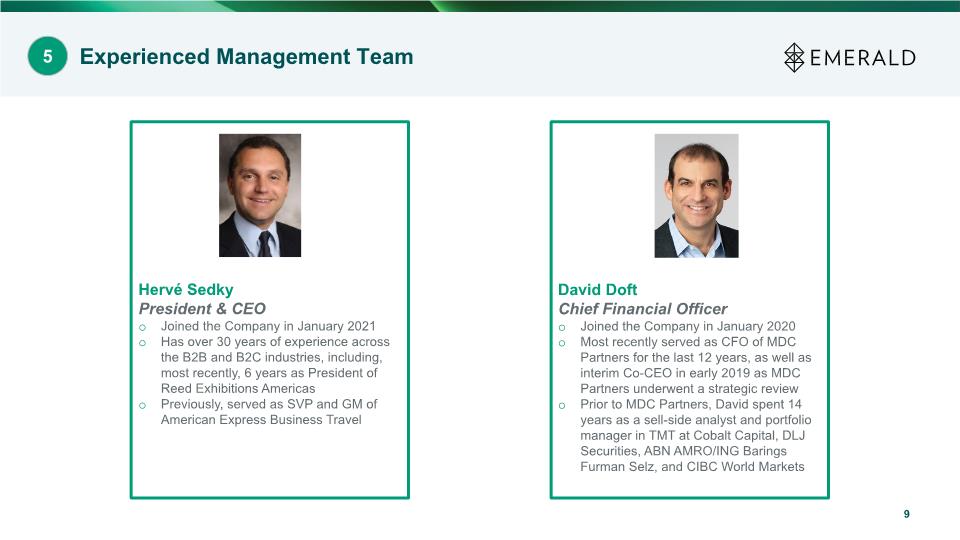
9 Experienced Management Team 5 Hervé Sedky President & CEO Joined the Company in January 2021 Has over 30 years of experience across the B2B and B2C industries, including, most recently, 6 years as President of Reed Exhibitions Americas Previously, served as SVP and GM of American Express Business Travel David Doft Chief Financial Officer Joined the Company in January 2020 Most recently served as CFO of MDC Partners for the last 12 years, as well as interim Co-CEO in early 2019 as MDC Partners underwent a strategic review Prior to MDC Partners, David spent 14 years as a sell-side analyst and portfolio manager in TMT at Cobalt Capital, DLJ Securities, ABN AMRO/ING Barings Furman Selz, and CIBC World Markets

New Data and Technology-Driven Strategic Initiatives – The Emerald Discovery Engine 6
11 Rethink Reframe Reconnect Rethink, Reframe, & Reconnect How to Bring People Together The new workforce and work styles require a new approach
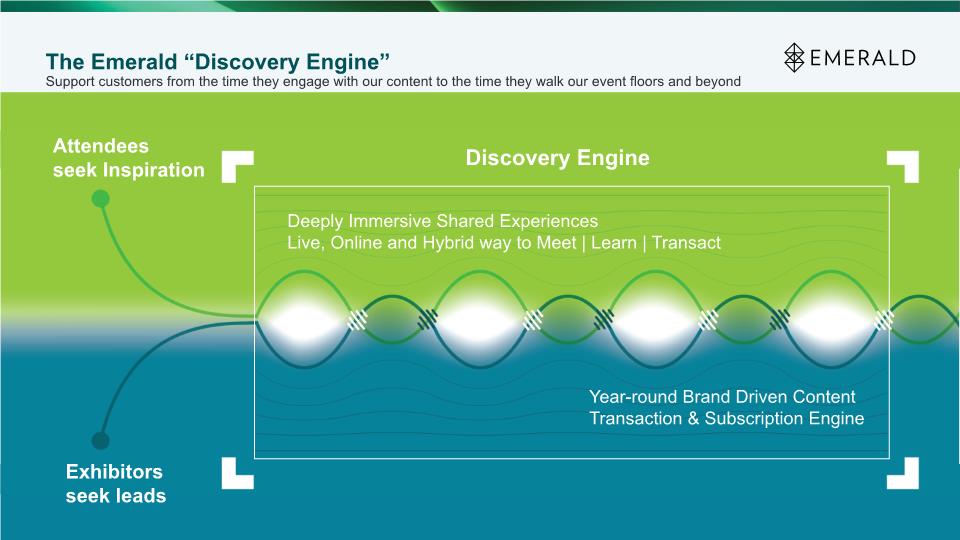
The Emerald “Discovery Engine” Support customers from the time they engage with our content to the time they walk our event floors and beyond Attendees seek Inspiration Exhibitors seek leads Discovery Engine Deeply Immersive Shared Experiences Live, Online and Hybrid way to Meet | Learn | Transact Year-round Brand Driven Content Transaction & Subscription Engine
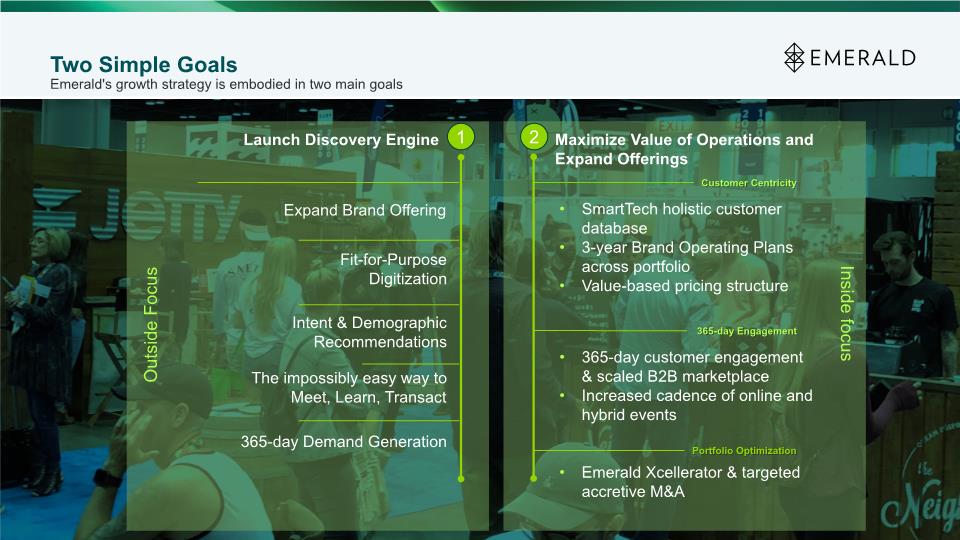
Two Simple Goals Emerald's growth strategy is embodied in two main goals Launch Discovery Engine Maximize Value of Operations and Expand Offerings Intent & Demographic Recommendations Fit-for-Purpose Digitization Expand Brand Offering The impossibly easy way to Meet, Learn, Transact 1 2 Inside focus Outside Focus 365-day Demand Generation 365-day customer engagement & scaled B2B marketplace Increased cadence of online and hybrid events Emerald Xcellerator & targeted accretive M&A 365-day Engagement Portfolio Optimization SmartTech holistic customer database 3-year Brand Operating Plans across portfolio Value-based pricing structure Customer Centricity
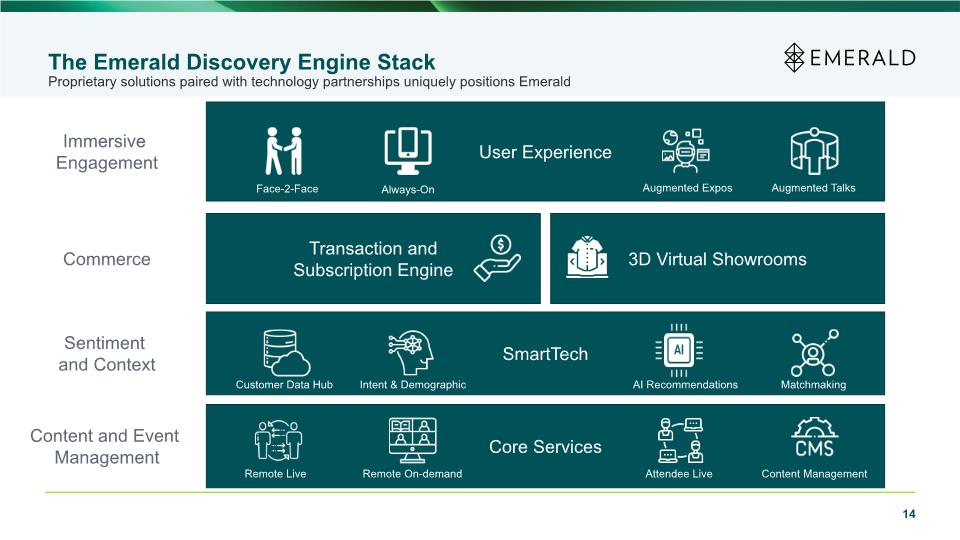
14 The Emerald Discovery Engine Stack Proprietary solutions paired with technology partnerships uniquely positions Emerald Transaction and Subscription Engine User Experience SmartTech 3D Virtual Showrooms Immersive Engagement Sentiment and Context Core Services Commerce Augmented Talks Augmented Expos Remote On-demand Remote Live Content Management Matchmaking Intent & Demographic AI Recommendations Customer Data Hub Face-2-Face Attendee Live Always-On Content and Event Management

Insurance Update
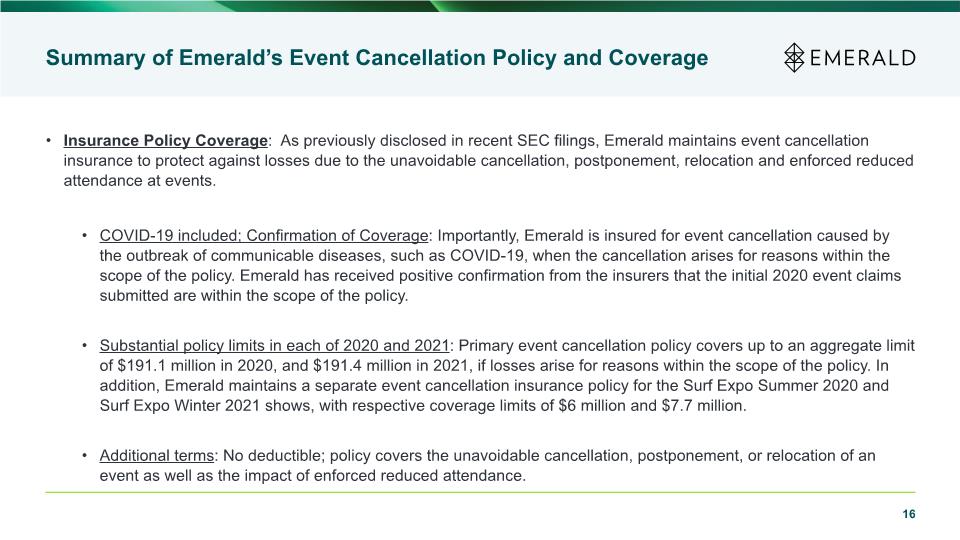
Summary of Emerald’s Event Cancellation Policy and Coverage Insurance Policy Coverage: As previously disclosed in recent SEC filings, Emerald maintains event cancellation insurance to protect against losses due to the unavoidable cancellation, postponement, relocation and enforced reduced attendance at events. COVID-19 included; Confirmation of Coverage: Importantly, Emerald is insured for event cancellation caused by the outbreak of communicable diseases, such as COVID-19, when the cancellation arises for reasons within the scope of the policy. Emerald has received positive confirmation from the insurers that the initial 2020 event claims submitted are within the scope of the policy. Substantial policy limits in each of 2020 and 2021: Primary event cancellation policy covers up to an aggregate limit of $191.1 million in 2020, and $191.4 million in 2021, if losses arise for reasons within the scope of the policy. In addition, Emerald maintains a separate event cancellation insurance policy for the Surf Expo Summer 2020 and Surf Expo Winter 2021 shows, with respective coverage limits of $6 million and $7.7 million. Additional terms: No deductible; policy covers the unavoidable cancellation, postponement, or relocation of an event as well as the impact of enforced reduced attendance. 16
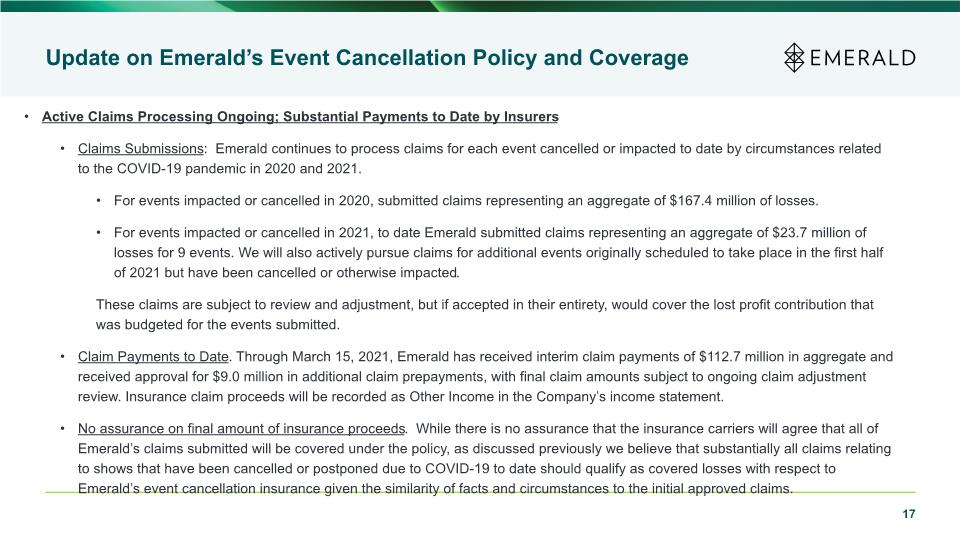
Update on Emerald’s Event Cancellation Policy and Coverage Active Claims Processing Ongoing; Substantial Payments to Date by Insurers Claims Submissions: Emerald continues to process claims for each event cancelled or impacted to date by circumstances related to the COVID-19 pandemic in 2020 and 2021. For events impacted or cancelled in 2020, submitted claims representing an aggregate of $167.4 million of losses. For events impacted or cancelled in 2021, to date Emerald submitted claims representing an aggregate of $23.7 million of losses for 9 events. We will also actively pursue claims for additional events originally scheduled to take place in the first half of 2021 but have been cancelled or otherwise impacted. These claims are subject to review and adjustment, but if accepted in their entirety, would cover the lost profit contribution that was budgeted for the events submitted. Claim Payments to Date. Through March 15, 2021, Emerald has received interim claim payments of $112.7 million in aggregate and received approval for $9.0 million in additional claim prepayments, with final claim amounts subject to ongoing claim adjustment review. Insurance claim proceeds will be recorded as Other Income in the Company’s income statement. No assurance on final amount of insurance proceeds. While there is no assurance that the insurance carriers will agree that all of Emerald’s claims submitted will be covered under the policy, as discussed previously we believe that substantially all claims relating to shows that have been cancelled or postponed due to COVID-19 to date should qualify as covered losses with respect to Emerald’s event cancellation insurance given the similarity of facts and circumstances to the initial approved claims. 17
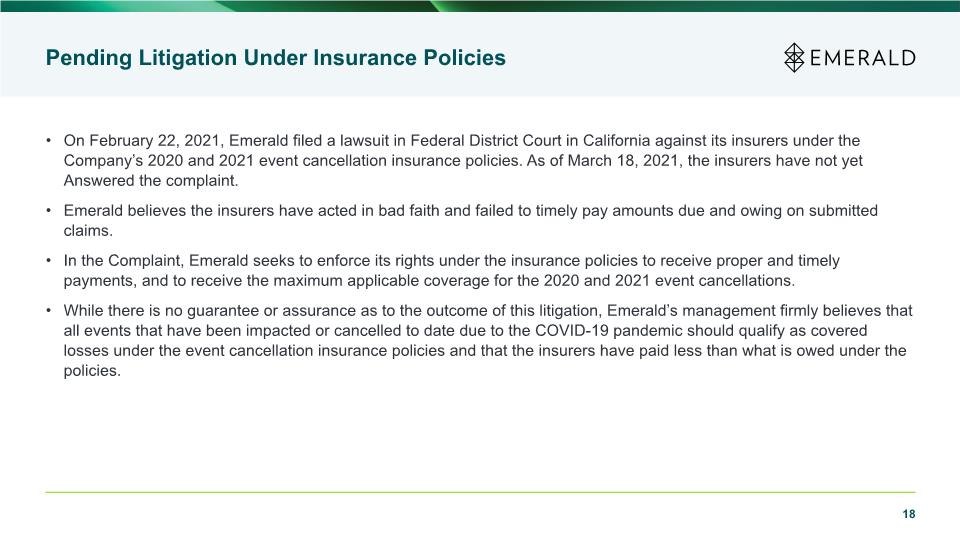
Pending Litigation Under Insurance Policies On February 22, 2021, Emerald filed a lawsuit in Federal District Court in California against its insurers under the Company’s 2020 and 2021 event cancellation insurance policies. As of March 18, 2021, the insurers have not yet Answered the complaint. Emerald believes the insurers have acted in bad faith and failed to timely pay amounts due and owing on submitted claims. In the Complaint, Emerald seeks to enforce its rights under the insurance policies to receive proper and timely payments, and to receive the maximum applicable coverage for the 2020 and 2021 event cancellations. While there is no guarantee or assurance as to the outcome of this litigation, Emerald’s management firmly believes that all events that have been impacted or cancelled to date due to the COVID-19 pandemic should qualify as covered losses under the event cancellation insurance policies and that the insurers have paid less than what is owed under the policies. 18
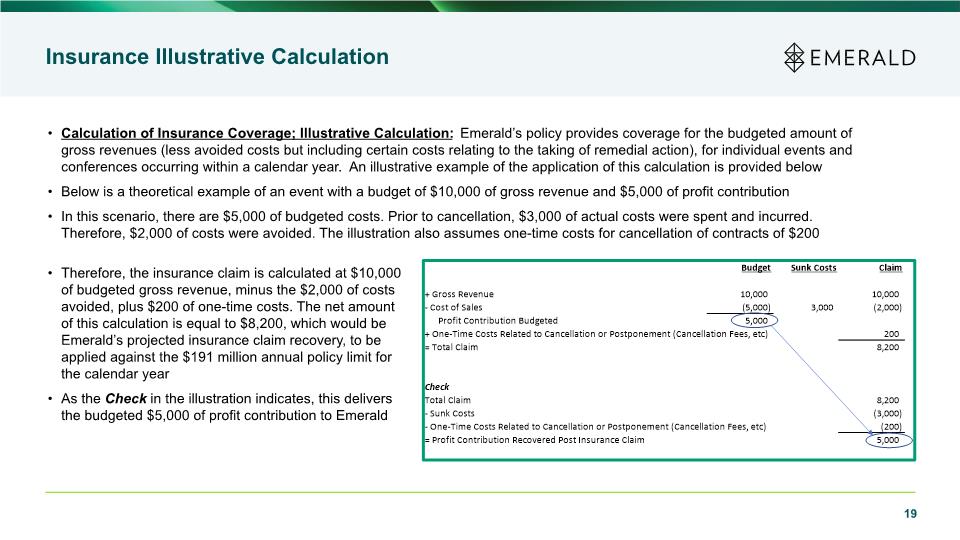
19 Insurance Illustrative Calculation Calculation of Insurance Coverage; Illustrative Calculation: Emerald’s policy provides coverage for the budgeted amount of gross revenues (less avoided costs but including certain costs relating to the taking of remedial action), for individual events and conferences occurring within a calendar year. An illustrative example of the application of this calculation is provided below Below is a theoretical example of an event with a budget of $10,000 of gross revenue and $5,000 of profit contribution In this scenario, there are $5,000 of budgeted costs. Prior to cancellation, $3,000 of actual costs were spent and incurred. Therefore, $2,000 of costs were avoided. The illustration also assumes one-time costs for cancellation of contracts of $200 Therefore, the insurance claim is calculated at $10,000 of budgeted gross revenue, minus the $2,000 of costs avoided, plus $200 of one-time costs. The net amount of this calculation is equal to $8,200, which would be Emerald’s projected insurance claim recovery, to be applied against the $191 million annual policy limit for the calendar year As the Check in the illustration indicates, this delivers the budgeted $5,000 of profit contribution to Emerald
Fourth Quarter and FY 2020 Financial Results
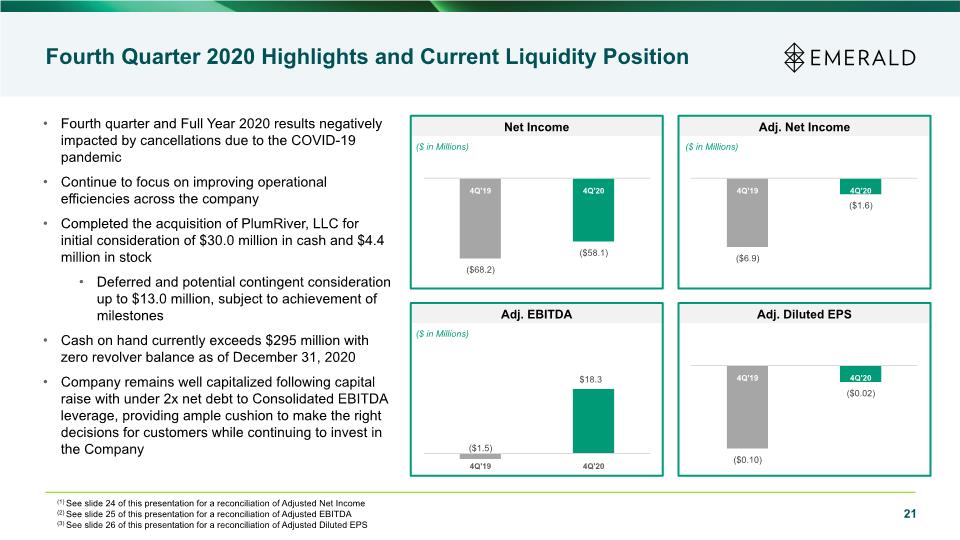
Fourth quarter and Full Year 2020 results negatively impacted by cancellations due to the COVID-19 pandemic Continue to focus on improving operational efficiencies across the company Completed the acquisition of PlumRiver, LLC for initial consideration of $30.0 million in cash and $4.4 million in stock Deferred and potential contingent consideration up to $13.0 million, subject to achievement of milestones Cash on hand currently exceeds $295 million with zero revolver balance as of December 31, 2020 Company remains well capitalized following capital raise with under 2x net debt to Consolidated EBITDA leverage, providing ample cushion to make the right decisions for customers while continuing to invest in the Company 21 Fourth Quarter 2020 Highlights and Current Liquidity Position Adj. EBITDA Adj. Diluted EPS Net Income Adj. Net Income ($ in Millions) ($ in Millions) ($ in Millions) (1) See slide 24 of this presentation for a reconciliation of Adjusted Net Income (2) See slide 25 of this presentation for a reconciliation of Adjusted EBITDA (3) See slide 26 of this presentation for a reconciliation of Adjusted Diluted EPS
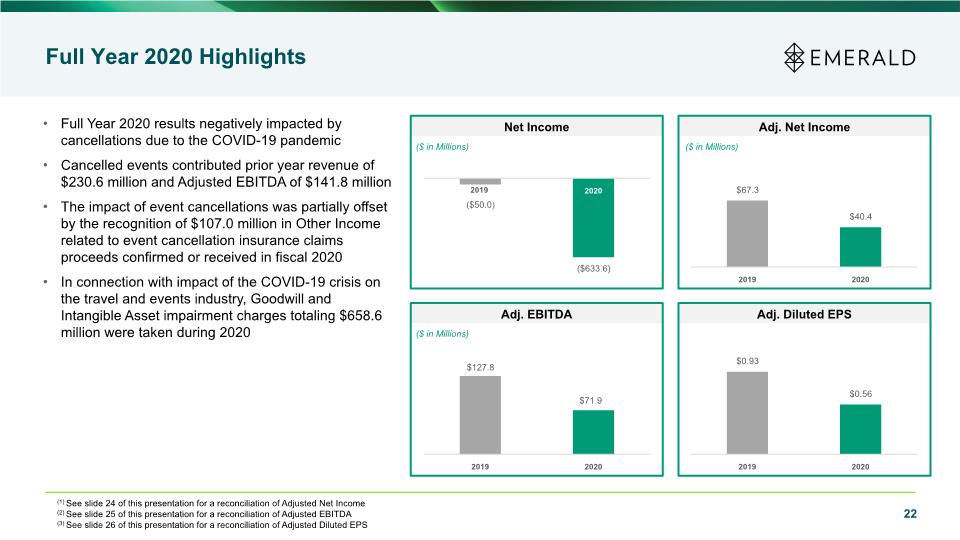
Full Year 2020 results negatively impacted by cancellations due to the COVID-19 pandemic Cancelled events contributed prior year revenue of $230.6 million and Adjusted EBITDA of $141.8 million The impact of event cancellations was partially offset by the recognition of $107.0 million in Other Income related to event cancellation insurance claims proceeds confirmed or received in fiscal 2020 In connection with impact of the COVID-19 crisis on the travel and events industry, Goodwill and Intangible Asset impairment charges totaling $658.6 million were taken during 2020 22 Full Year 2020 Highlights Adj. EBITDA Adj. Diluted EPS Net Income Adj. Net Income ($ in Millions) ($ in Millions) ($ in Millions) (1) See slide 24 of this presentation for a reconciliation of Adjusted Net Income (2) See slide 25 of this presentation for a reconciliation of Adjusted EBITDA (3) See slide 26 of this presentation for a reconciliation of Adjusted Diluted EPS 2019
Appendix
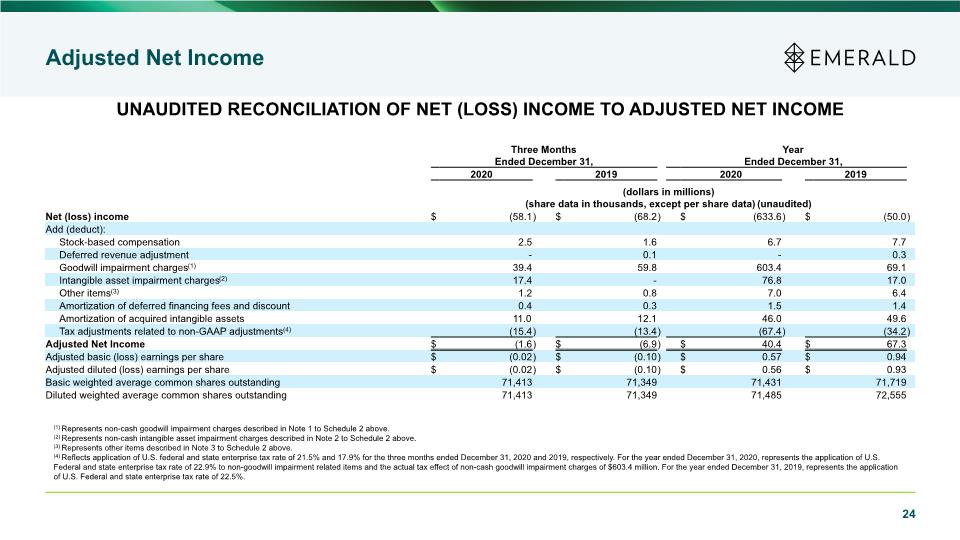
Adjusted Net Income 24 UNAUDITED RECONCILIATION OF NET (LOSS) INCOME TO ADJUSTED NET INCOME (1) Represents non-cash goodwill impairment charges described in Note 1 to Schedule 2 above. (2) Represents non-cash intangible asset impairment charges described in Note 2 to Schedule 2 above. (3) Represents other items described in Note 3 to Schedule 2 above. (4) Reflects application of U.S. federal and state enterprise tax rate of 21.5% and 17.9% for the three months ended December 31, 2020 and 2019, respectively. For the year ended December 31, 2020, represents the application of U.S. Federal and state enterprise tax rate of 22.9% to non-goodwill impairment related items and the actual tax effect of non-cash goodwill impairment charges of $603.4 million. For the year ended December 31, 2019, represents the application of U.S. Federal and state enterprise tax rate of 22.5%.
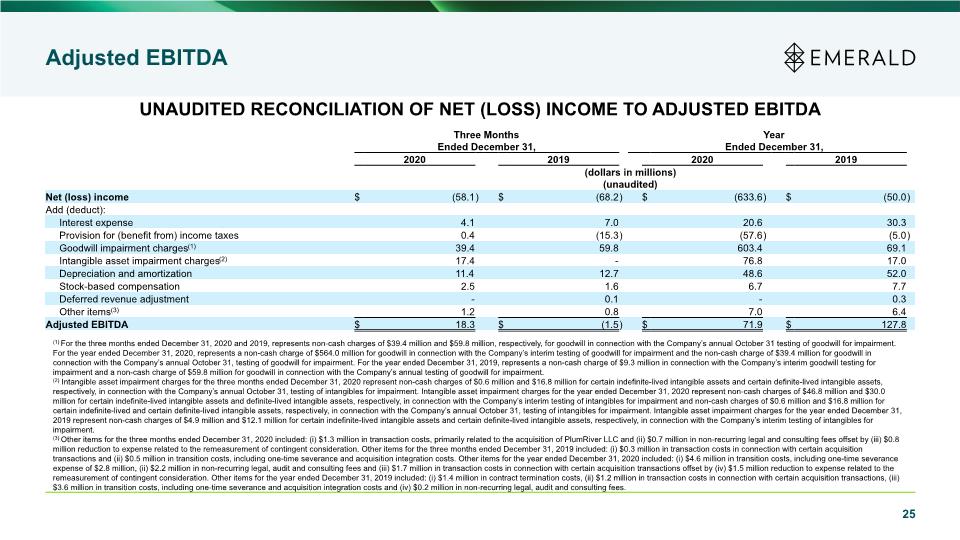
Adjusted EBITDA 25 UNAUDITED RECONCILIATION OF NET (LOSS) INCOME TO ADJUSTED EBITDA (1) For the three months ended December 31, 2020 and 2019, represents non-cash charges of $39.4 million and $59.8 million, respectively, for goodwill in connection with the Company’s annual October 31 testing of goodwill for impairment. For the year ended December 31, 2020, represents a non-cash charge of $564.0 million for goodwill in connection with the Company’s interim testing of goodwill for impairment and the non-cash charge of $39.4 million for goodwill in connection with the Company’s annual October 31, testing of goodwill for impairment. For the year ended December 31, 2019, represents a non-cash charge of $9.3 million in connection with the Company’s interim goodwill testing for impairment and a non-cash charge of $59.8 million for goodwill in connection with the Company’s annual testing of goodwill for impairment. (2) Intangible asset impairment charges for the three months ended December 31, 2020 represent non-cash charges of $0.6 million and $16.8 million for certain indefinite-lived intangible assets and certain definite-lived intangible assets, respectively, in connection with the Company’s annual October 31, testing of intangibles for impairment. Intangible asset impairment charges for the year ended December 31, 2020 represent non-cash charges of $46.8 million and $30.0 million for certain indefinite-lived intangible assets and definite-lived intangible assets, respectively, in connection with the Company’s interim testing of intangibles for impairment and non-cash charges of $0.6 million and $16.8 million for certain indefinite-lived and certain definite-lived intangible assets, respectively, in connection with the Company’s annual October 31, testing of intangibles for impairment. Intangible asset impairment charges for the year ended December 31, 2019 represent non-cash charges of $4.9 million and $12.1 million for certain indefinite-lived intangible assets and certain definite-lived intangible assets, respectively, in connection with the Company’s interim testing of intangibles for impairment. (3) Other items for the three months ended December 31, 2020 included: (i) $1.3 million in transaction costs, primarily related to the acquisition of PlumRiver LLC and (ii) $0.7 million in non-recurring legal and consulting fees offset by (iii) $0.8 million reduction to expense related to the remeasurement of contingent consideration. Other items for the three months ended December 31, 2019 included: (i) $0.3 million in transaction costs in connection with certain acquisition transactions and (ii) $0.5 million in transition costs, including one-time severance and acquisition integration costs. Other items for the year ended December 31, 2020 included: (i) $4.6 million in transition costs, including one-time severance expense of $2.8 million, (ii) $2.2 million in non-recurring legal, audit and consulting fees and (iii) $1.7 million in transaction costs in connection with certain acquisition transactions offset by (iv) $1.5 million reduction to expense related to the remeasurement of contingent consideration. Other items for the year ended December 31, 2019 included: (i) $1.4 million in contract termination costs, (ii) $1.2 million in transaction costs in connection with certain acquisition transactions, (iii) $3.6 million in transition costs, including one-time severance and acquisition integration costs and (iv) $0.2 million in non-recurring legal, audit and consulting fees.
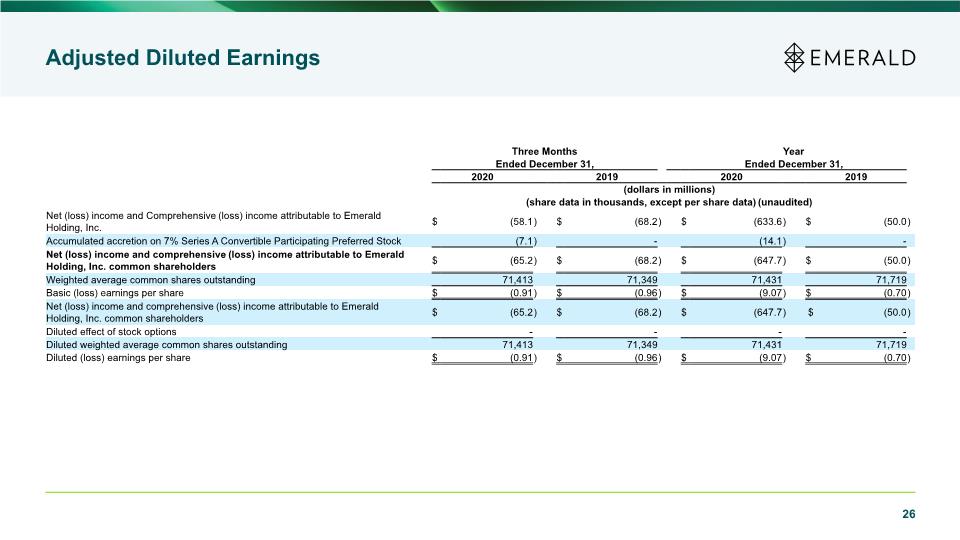
Adjusted Diluted Earnings 26


