 Quinpario Acquisition Corp. Investor Presentation Acquisition of Jason Incorporated March 18, 2014 Exhibit 99.1 |
 Disclaimer 2 Forward Looking Statements This presentation includes “forward looking statements” within the meaning of the “safe harbor” provisions of the United States Private Securities Litigation Reform Act of 1995. Forward-looking statements may be identified by the use of words such as “anticipate,” “believe,” “expect,” “estimate,” “plan,” “outlook,” and “project” and other similar expressions that predict or indicate future events or trends or that are not statements of historical matters. Such forward looking statements include projected financial information. Such forward looking statements with respect to revenues, earnings, performance, strategies, prospects and other aspects of the businesses of Quinpario Acquisition Corp. (“QPAC”), Jason Partners Holdings Inc. (“Jason”) and the combined company after completion of the proposed business combination are based on current expectations that are subject to risks and uncertainties. A number of factors could cause actual results or outcomes to differ materially from those indicated by such forward looking statements. These factors include, but are not limited to: (1) the occurrence of any event, change or other circumstances that could give rise to the termination of the Stock Purchase Agreement for the business combination (the “Purchase Agreement”); (2) the outcome of any legal proceedings that may be instituted against Jason or QPAC following announcement of the proposed business combination and transactions contemplated thereby; (3) the inability to complete the transactions contemplated by the proposed business combination due to the failure to obtain approval of the stockholders of QPAC, or other conditions to closing in the Purchase Agreement; (4) the ability to obtain or maintain the listing of the post-combination company’s common stock on NASDAQ following the business combination; (5) the risk that the proposed business combination disrupts current plans and operations as a result of the announcement and consummation of the transactions described herein; (6) the ability to recognize the anticipated benefits of the business combination, which may be affected by, among other things, competition, the ability to integrate the Jason and QPAC businesses, and the ability of the combined business to grow and manage growth profitably; (7) costs related to the business combination; (8) changes in applicable laws or regulations; (9) the possibility that Jason or QPAC may be adversely affected by other economic, business, and/or competitive factors; and (10) other risks and uncertainties indicated from time to time in the proxy statement, including those under “Risk Factors” therein, and other filings with the Securities and Exchange Commission (“SEC”) by QPAC. You are cautioned not to place undue reliance upon any forward-looking statements, which speak only as of the date made. QPAC and Jason undertake no obligation to update or revise the forward-looking statements, whether as a result of new information, future events or otherwise. Financial Presentations This presentation includes non-GAAP financial measures, including EBIT, EBITDA, Proforma EBITDA, EBIT Margin and EBITDA Margin. EBITDA is calculated as earnings before interest and taxes (“EBIT”) plus depreciation and amortization (“EBITDA”). In addition, Proforma EBITDA is calculated as EBITDA adjusted to give pro forma effect to (i) the proposed business combination with QPAC, (ii) the business combination’s related changes to the post-combination company’s capitalization structure and (iii) the estimated increase expenses of operating as a public company. EBIT Margin is defined as EBIT divided by total revenues. EBITDA Margin is defined as EBITDA divided by total revenues. Non-GAAP and Other Company Information Jason believes that these non-GAAP measures of financial results provide useful information to management and investors regarding certain financial and business trends relating to Jason’s financial condition and results of operations. Jason’s management uses these non-GAAP measures to compare Jason’s performance to that of prior periods for trend analyses, for purposes of determining management incentive compensation, and for budgeting and planning purposes. These measures are used in monthly financial reports prepared for management and Jason’s board of directors. Jason believes that the use of these non-GAAP financial measures provides an additional tool for investors to use in evaluating ongoing operating results and trends and in comparing Jason’s financial measures with other companies in the finishing, seating, acoustics or components business, many of which present similar non-GAAP financial measures to investors. Management of Jason does not consider these non-GAAP measures in isolation or as an alternative to financial measures determined in accordance with GAAP. We have not reconciled the non-GAAP forward looking information to their corresponding GAAP measures because we do not provide guidance for the various reconciling items such as stock-based compensation, provision for income taxes, depreciation and amortization, costs related to acquisitions, and foreign currency remeasurements and transactions gains and losses, as certain items that impact these measures are out of our control or cannot be reasonably predicted. You should review Jason’s audited financial statements, which will be presented in QPAC’s proxy statement to be filed with the SEC and delivered to QPAC’s stockholders, and not rely on any single financial measure to evaluate Jason’s business. Other companies may calculate EBITDA, Adjusted EBITDA and other non-GAAP measures differently, and therefore our EBITDA, Adjusted EBITDA and other non-GAAP measures and that of Jason may not be directly comparable to similarly titled measures of other companies. Additional Information Participants in the Solicitation QPAC and its directors and executive officers and other persons may be deemed to be participants in the solicitations of proxies from QPAC’s stockholders in respect of the proposed business combination. Information regarding QPAC’s directors and executive officers is available in its Annual Report on Form 10-K for the year ending December 31, 2013 filed with the SEC on March 7, 2014. Additional information regarding the participants in the proxy solicitation and a description of their direct and indirect interests, by security holdings or otherwise, will be contained in the proxy statement when it becomes available. The proposed business combination will be submitted to stockholders of QPAC for their consideration. Stockholders are urged to read the proxy statement regarding the proposed business combination when it becomes available because it will contain important information. Stockholders will be able to obtain a free copy of the proxy statement, as well as other filings containing information about QPAC, without charge, at the SEC’s Internet site (www.sec.gov). You will also be able to obtain these documents, free of charge, by accessing Quinpario’s website (http://www.quinpario.com). Copies of the proxy statement and the filings with the SEC that will be incorporated by reference in the proxy statement can also be obtained, without charge, by directing a request to Paul J. Berra III, Vice President, General Counsel and Secretary, 12935 N. Forty Drive, St. Louis, Missouri 63141. |
 Agenda • Summary • Jason Overview • Growth Opportunities • Financial Overview |
 Quinpario Acquisition Corp. to Acquire Jason Incorporated • On March 16, 2014, Quinpario Acquisition Corp. (“QPAC”) entered into a definitive agreement to acquire Jason Incorporated (“Jason”) 4 Entity to be listed on NASDAQ post business combination JPHI Holdings Inc. JPHI Holdings Inc. |
 Transaction Overview 5 Transaction • QPAC, through its newly formed acquisition sub, JPHI Holdings Inc., will acquire 100% of Jason • Transaction expected to close 2nd Quarter, 2014 Consideration • Transaction value of $538.65 million – 6.75x 2013 Actual Proforma EBITDA of $79.8 million – Includes cash for working capital, payment of transaction expenses, and assumes 50% of warrants repurchased at $0.75 per warrant Board & Management • Jeffry N. Quinn, founder of Quinpario, to serve as the chairman of the board of directors • David Westgate, Chief Executive Officer of Jason, to remain CEO and serve on the board of directors • Board to be constituted of members from incumbent QPAC board members, incumbent Jason board members and other qualified individuals • Existing Jason management to continue to run the business • Total estimated Transaction capital requirement of approximately $655 million • Acquisition funding sources assumes approximately $420 million of newly issued debt, $14 million of foreign rollover debt, $177 million of cash in trust at QPAC, $35 million of rollover equity from management and existing shareholders, and $8.5 million of cash to be left in Jason |
 (1) Debt at foreign subsidiaries (2) Assumes $177.075 million of cash in trust does not redeem (3) Estimated amount relating to sale of JV (4) Assumes 50% of the warrants are repurchased at $0.75 per share and cancelled (5) Ownership as of transaction close (6) Remainder of Quinpario promote to vest upon certain share price hurdles Capitalization and Ownership 6 Sr. Secured 1 st Lien Term Loan $300 Sr. Secured 2 nd Lien Term Loan 120 Rollover Debt 1 14 Revolver ($40M Facility) - QPAC Equity 2 177 Rollover Equity 35 Cash Left in the Business 3 9 Total Sources $655 Purchase Price $539 Warrant Adjustment 4 7 Fees and Cash for Working Capital 109 Total Uses $655 Pro Forma Capitalization at Closing Cash $80 1 st Lien Term Loan $300 2 nd Lien Term Loan 120 Rollover Debt 14 Total Debt $434 Equity Capitalization $212 Total Capitalization $646 2013A Proforma EBITDA $79.8 Net Cap / 2013A Proforma EBITDA 7.10x Net Debt / 2013A Proforma EBITDA 4.44x Sources Uses Post Transaction Share Cap: Shares % of Total QPAC Public Shareholders 17,250,000 74.8% Rollover Equity 3,441,720 14.9% Quinpario Private Placement Shares 1,150,000 5.0% Quinpario Sponsor Promote 6 1,226,667 5.3% TOTAL 23,068,386 100.0% Pro Forma Ownership 5 ($ in millions) |
 Investment Highlights 7 Market leader in niche highly engineered components Macro trends that support growth across all segments Diversified blue chip customer base Earnings growth opportunities from pricing, operational improvements and margin expansion Strong free cash flow generation Robust new product pipeline with a track record of innovation Proven acquisition platform to support future M&A activity Experienced management team with a track record of success |
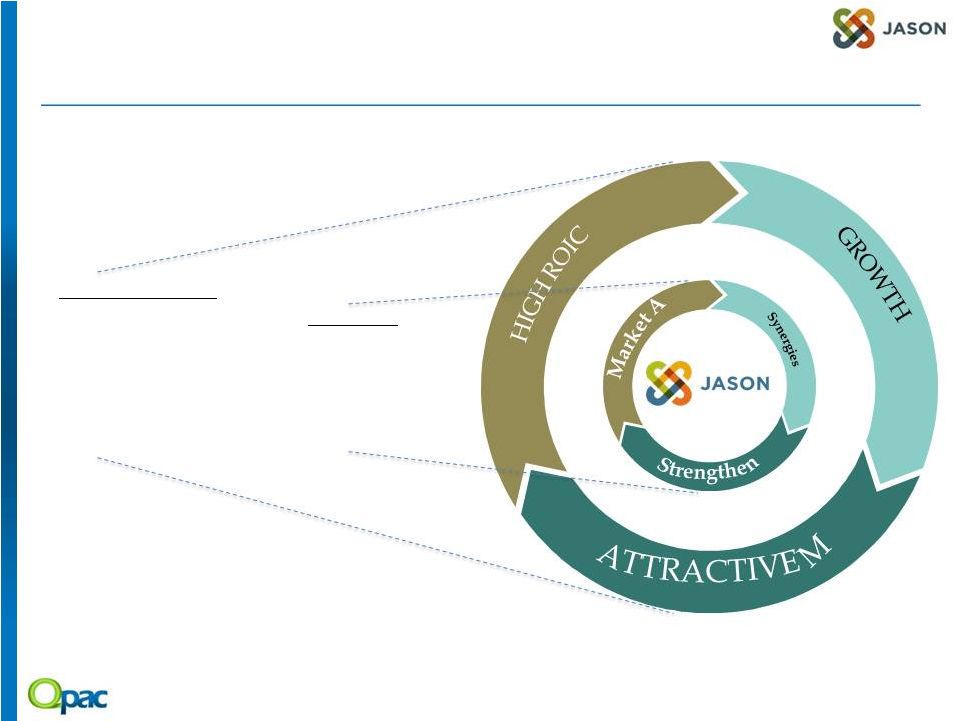
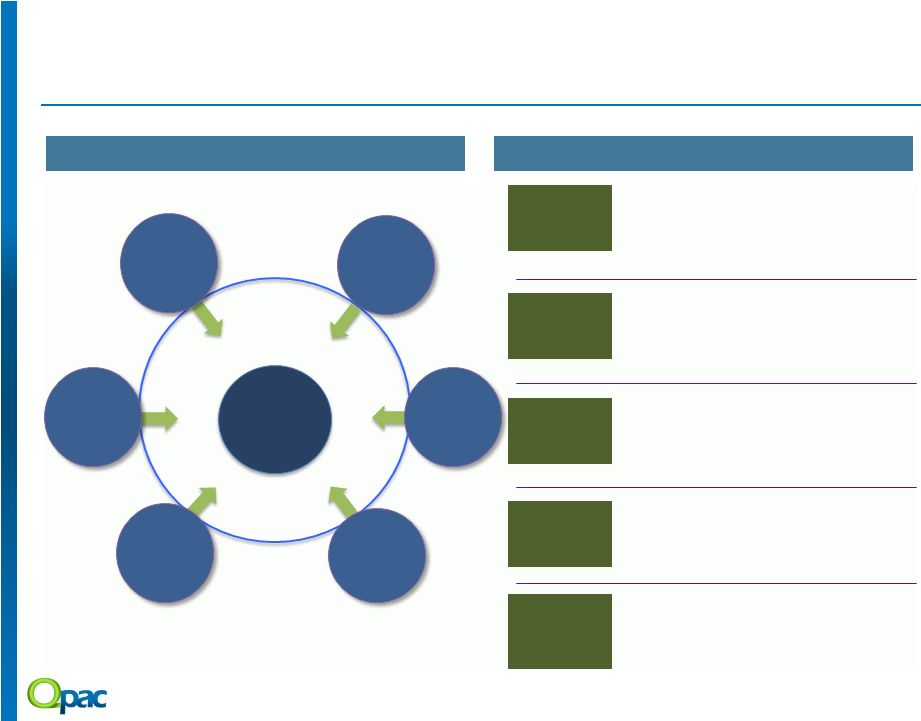 Quinpario’s Capabilities will Strengthen Jason 8 • Engage in synergistic bolt-on acquisitions to strengthen core business, with initial focus on Jason’s Finishing and Seating segments • Seek new platform acquisition opportunities that will generate excess returns for shareholders • Grow Jason’s business segments globally with a focus on new market access & increased market penetration, especially in Asia and Latin America • Further differentiate Jason’s key brands through insight-driven channel/product development • Capture operational synergies across businesses • Improve operating efficiency by instilling demand-driven lean processes • Leverage global sourcing spend to scale up performance and margins • Develop robust strategic planning process • Strengthen market & customer driven approach • Develop shareholder driven mentality based on long term success of the business Quinpario Partners Legal and Governance M&A Strategic Planning Shareholder Mindset Deep Analytics Business Operations Quinpario’s Capabilities • World-class public company board to assist growth and development of Jason • Align management incentives with shareholder value creation Quinpario’s Support to Jason Strategy Process Excellence Global Growth M&A Corporate Governance |
 • Summary • Jason Overview • Growth Opportunities • Financial Overview |
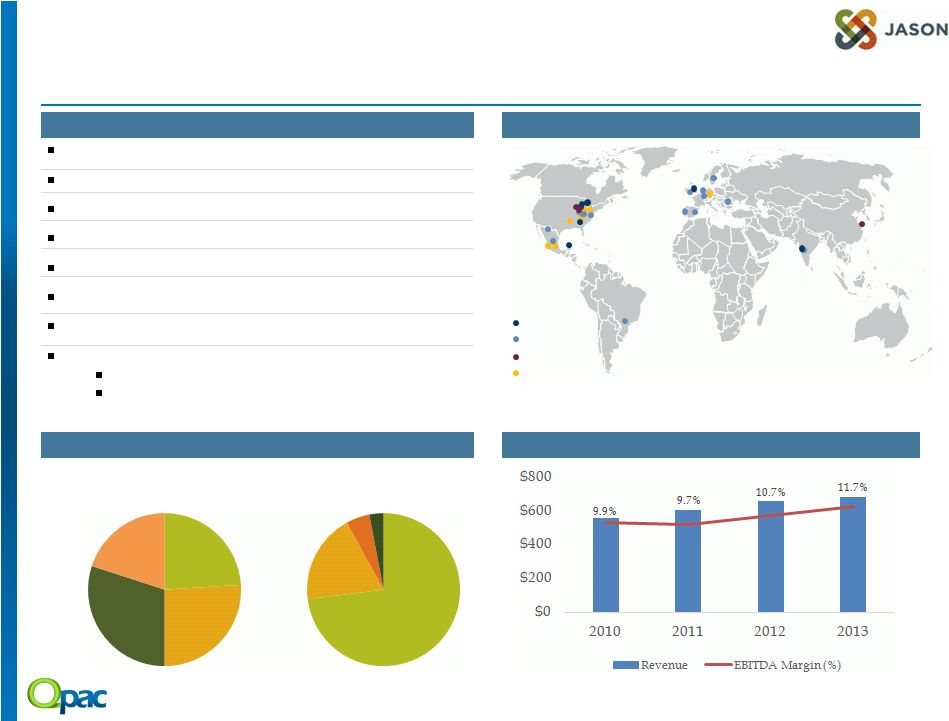 Employees: ~4,000 Headquarters: Milwaukee, WI 2013 Revenue: $680.8M 2013 EBITDA: $79.8M Founded: 1985 Manufacturing: 32 Sites in 11 Countries Square Feet of Manufacturing Space: ~2.5 Million Management: David Westgate, Chairman, President and CEO Steve Cripe, Chief Financial Officer Jason Business Overview 10 Financial Profile Business Mix (1) Key Company Facts Geographic Footprint Acoustics Components Finishing Seating Components 20% Acoustics 30% Finishing 26% Seating 24% US 73% EU 19% Mexico 5% ROW 3% _____________________ (1) Estimated 2013 mix |
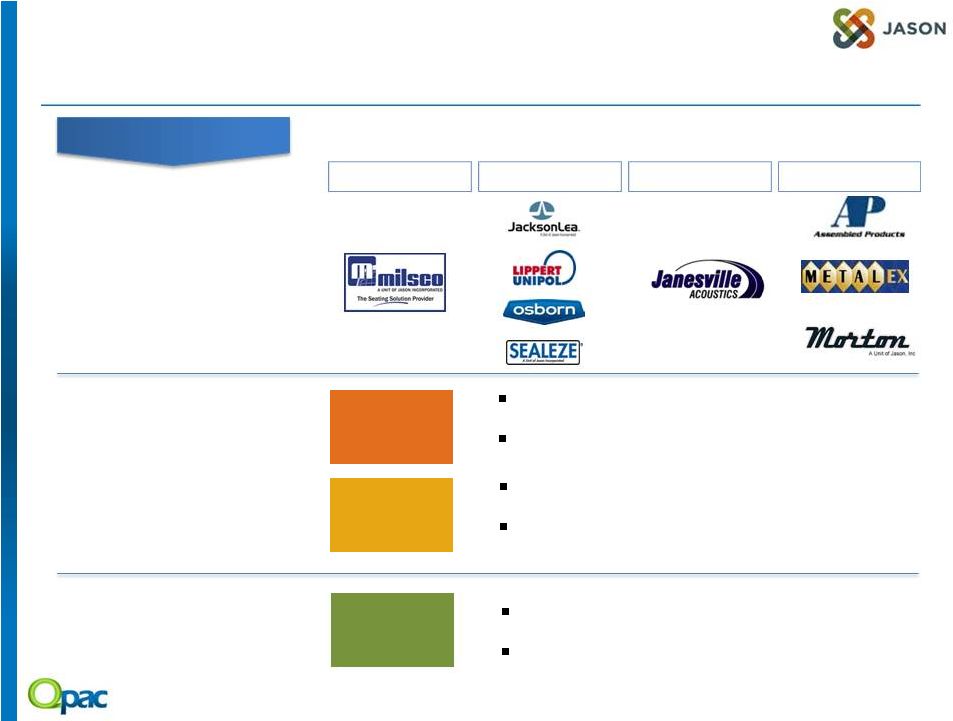
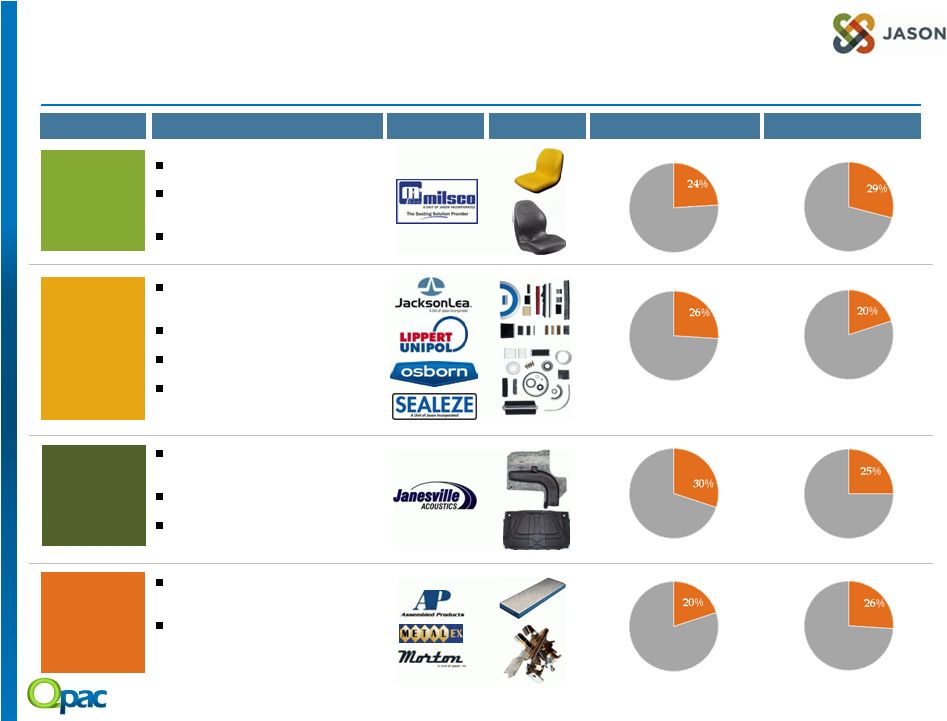 Segment Overview 11 Segment Leading commercial and industrial seat manufacturer Designs and manufactures a broad spectrum of seating systems for multiple vehicle platforms Differentiated patents and IP filings Key Highlights Brands Products % of 2013A Revenue % of 2013A EBITDA World’s largest producer of customized industrial brushes, buffs and buffing compounds 65% consumable, high recurring revenue Over 10,000 SKUs of industrial consumable products Used for surface finishing, preparation, metal removal, sealing, shielding and polishing Leading Provider of fiber-based acoustical products to the automotive industry Have product on 75% of the light vehicle platforms in North America Innovative solution provider with brand recognition Broad range of stamped, formed, expanded and perforated metal components and sub assemblies Products used in filter products, smart utility meters, railcars, generators and other industrial equipment Seating Finishing Acoustics Components |
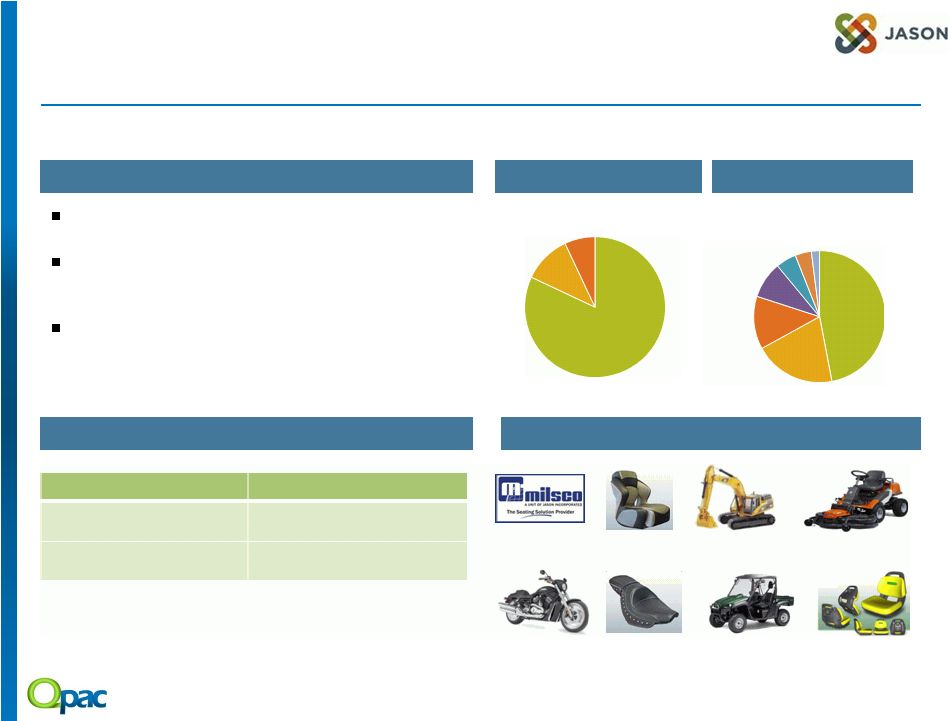 Seating Overview 12 Milsco brand maintains the #1 position in the global static seating market Primary product segments include Heavyweight Motorcycles, Turf Care, Heavy Industry and Powersports Next generation seating product development focus on turf care and industrial equipment seating products Seating’s high quality products and superior design capabilities have positioned it as the #1 provider of seats across a majority of its target end markets United States 82% Motorcycle Aftermarket 13% United States 82% _____________________ (1) Management estimates. Representative Products and Applications Overview Addressable Market (1) Revenue by Geography Revenue by End Product _____________________ Note: Based on 2012 revenue. Mexico 11% Europe 7% Turf Equipment 47% Motorcycle OEM 20% Lifts 9% Constr. & Ag. 5% Marine 4% Utility Vehicles 2% Market Size North America $450 M Global $2.5B |
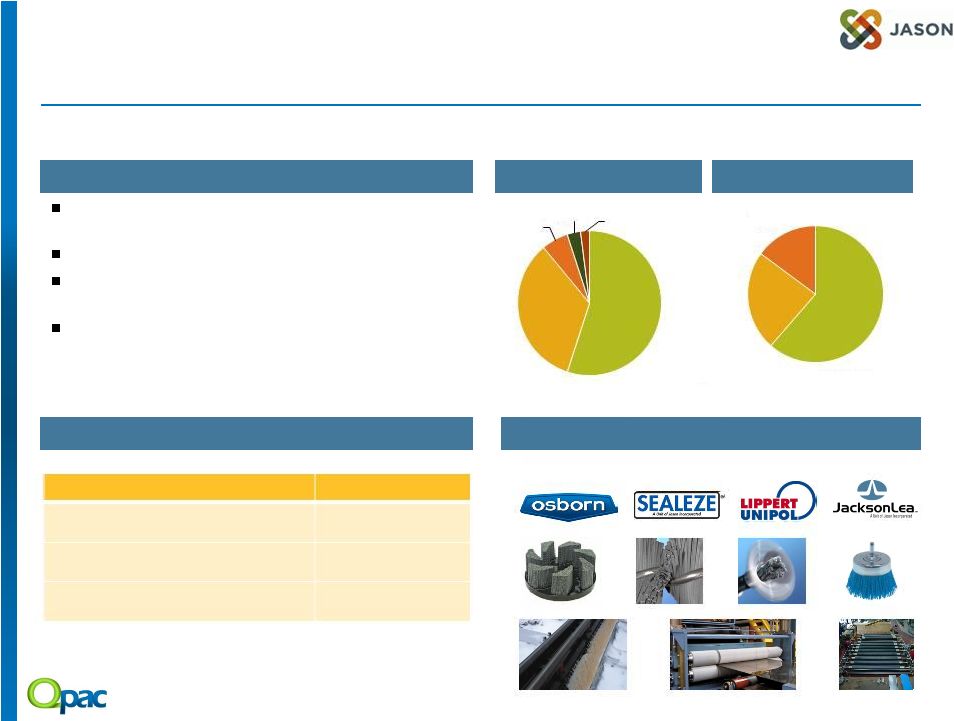 Finishing Overview 13 Manufacturing, distribution and sales facilities in 17 countries 65% of revenue from consumables #1 manufacturer of industrial and maintenance brushes, buffs and compounds in the world More than 30,000 customers worldwide; only business supplying global marketplace Europe 55% Finishing’s well-recognized brands maintain exceptional world-wide reputations for quality _____________________ (1) Management estimates. Representative Products and Applications Overview Addressable Market (1) Revenue by Geography Revenue by End Product _____________________ Note: Based on 2012 revenue. Industrial Compounds 23% Industrial Brushes 62% Europe 55% India 2% Mexico 3% South America 6% North America 34% Other 15% Industrial Brushes Buffs and Compounds Total Global Addressable Market Market Size $1,035 M $195 M $7 B |
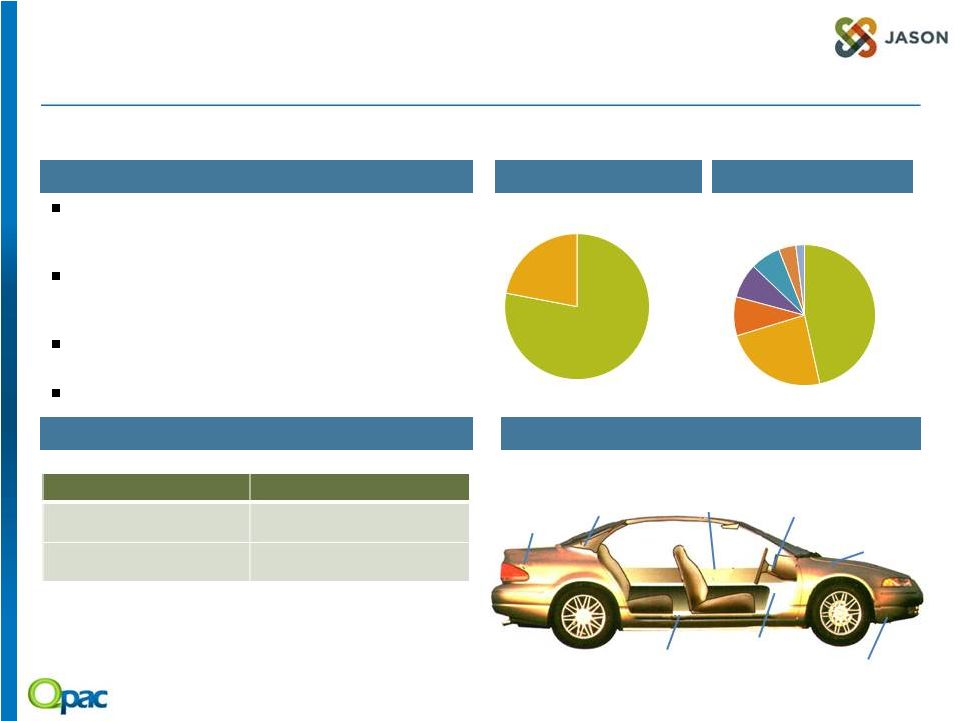 Acoustics Overview 14 Products are used in approximately 75% of light vehicles in North America today, including the majority of top platforms Acoustic products also sold to a wide range of other vehicles, including sport utility vehicles and light trucks Jason’s Acoustics Segment product content per vehicle increased by 34% between 2009-2012 Growth opportunity in Asia and Latin America Acoustics has developed extensive design and manufacturing expertise that allows it to provide custom acoustical solutions for each vehicle platform it serves Luggage Compartment Door Panels Dash Insulators Interior - Exterior Under Bonnet / Hoodliners Floor – Carpet Underlayment Hush Panels Wheelhouse / Cowl Package Tray Substrate _____________________ (1) Management estimates. Representative Products and Applications Overview Addressable Market (1) Revenue by Geography Revenue by End Product _____________________ Note: Based on 2012 revenue. Market Size North America $2 B Global $10 B Die Cut Insulation 47% Molded Insulation 24% Trunk Systems 9% Carpet Systems 8% IP Panels 7% Wheel Liners 4% Engine 2% North America 78% Europe 22% |
 Components Overview 15 Leading manufacturer of individual engineered solutions and expanded / perforated metal components #1 independent manufacturer of electric meter bases, rail safety products (anti-slip surface) and expanded metal products in North America Product categories are united by a common culture of maintaining industry leading engineering capabilities Jason Components has great long term customer partnerships due to its innovative design and manufacturing capabilities North America 100% _____________________ (1) Management estimates. Representative Products and Applications Overview Addressable Market (1) Revenue by Geography Revenue by End Product _____________________ Note: Based on 2012 revenue. Filtration 27% Electric Meters 25% Rail 21% Industrial 15% Small Engines 8% Power Equip. 2% OEM 2% Market Size North America $790 M Global $2B |
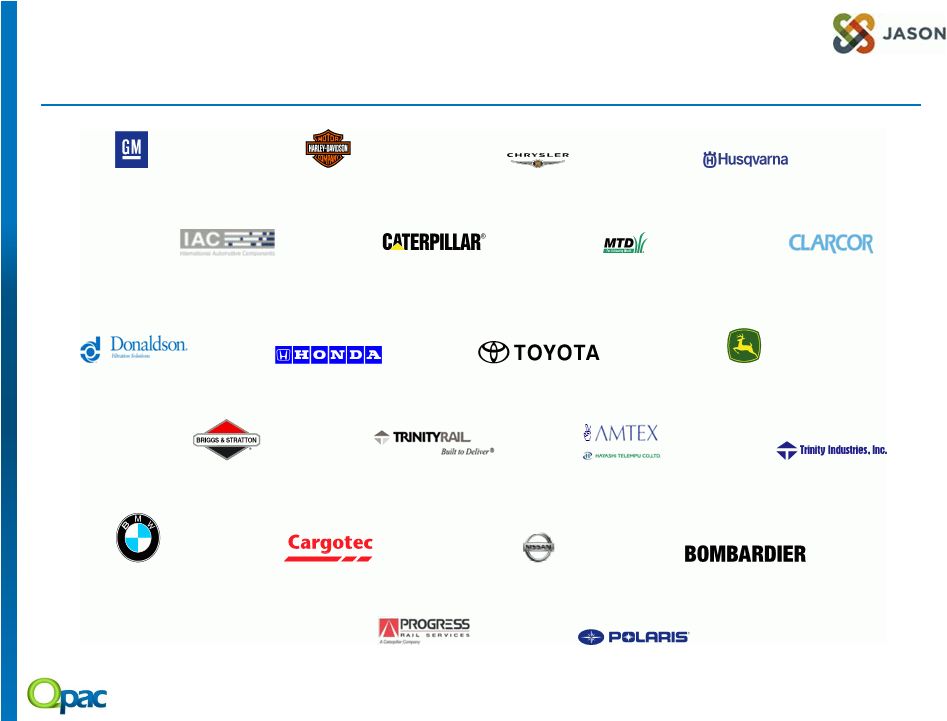 Long-Term Relationships with Blue Chip Customers 16 Customer Since 1934 80 Years Customer Since 1928 86 Years Customer Since 1968 46 Years Customer Since 1967 47 Years Customer Since 1990 24 years Customer Since 1988 26 Years Customer Since 1991 23 Years Customer Since 1990 24 years Customer Since 2011 2 Years Customer Since 2011 2 Years Customer Since 1993 21 Years Customer Since 2002 11 Years Customer Since 2008 5 Years Customer Since 2009 4 Years Customer Since 1984 30 Years Customer Since 1987 27 Years Customer Since 1986 28 Years Customer Since 1978 35 Years Customer Since 1975 39 Years Customer Since 1972 42 Years Customer Since 1975 39 Years Customer Since 1978 35 Years |
 A Leading Supplier of Highly Engineered Components 17 Established Industry Leader Scalable Business Model Diverse, Global Footprint Effective Management Philosophy Growing Presence in Emerging Markets Successful, Long-Tenured Management Team Strong Free Cash Flow Generation Proven Acquisition Platform Superior Design and Manufacturing Solutions |
 • Summary • Jason Overview • Growth Opportunities • Financial Overview |
 Strong Platform to Support Organic Growth Enhanced commercial approach to improve pricing and margin Share expertise and best practices across businesses by applying Jason Business System (JBS) Continued global expansion - Finishing in South Asia, Seating in Eastern Europe, Brazil Leverage the Company’s scalable platform to optimize its international presence Further Geographic Expansion Collaborative design and manufacture of customized products for Seating and Finishing Fast growing rail and heavy industries markets expected to account for >25% of new product revenues New Product Development 19 Strong industrial production and capacity utilization rates Jason’s market-leading brands to provide sustainable profitability Seating Finishing Acoustics Components Innovation and Global Expansion Operational and Commercial Improvements Growth Drivers Margin Expansion |
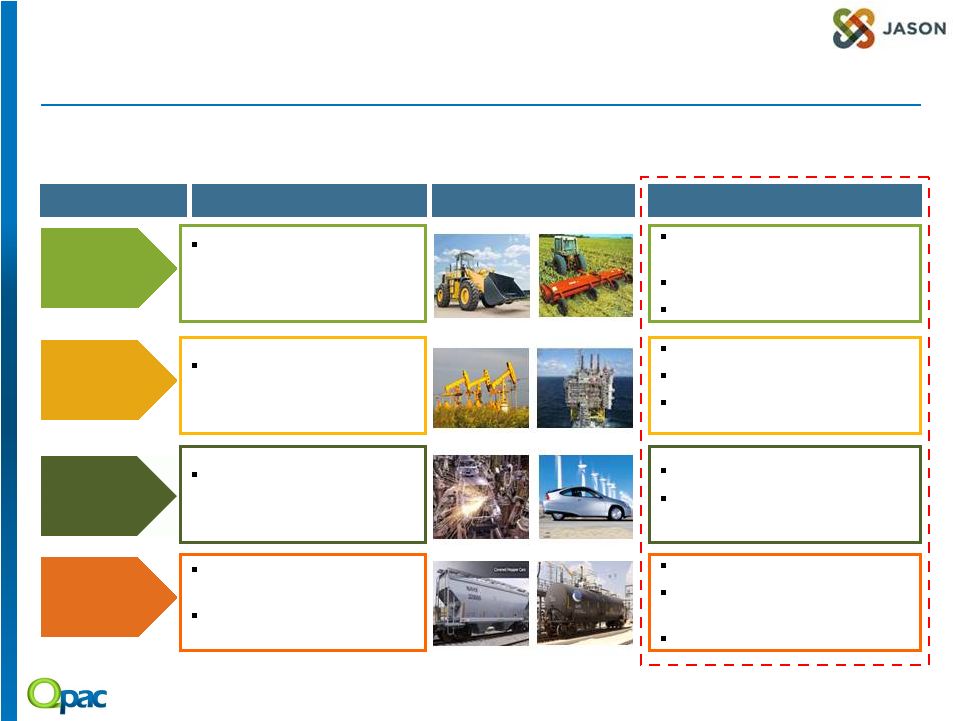 New Products to Contribute $40M-$60M (1) Annually in Growth 20 Oil & gas pipeline brushes High Temp Furnace Rolls Snow Protec – snow protection for heated railroad switches Agricultural and Construction Seating Commercial Turfcare Seating Heavy-Duty Motorcycle Seating Underbody panels Storage Bins (Glove Box, Map Pocket, Coin Tray) Landis + Gyr S4X Meter Generator Panel for Portable Generators Safety Platforms Jason has a robust new product pipeline; macro trends support several new product launches Finishing Seating Acoustics Components Segment Select New Product Pipeline New pipelines driven by Clean coal, deep water and hydraulic fracturing Growing global agriculture and construction equipment demand will spur need for next generating seating Shift towards lower weight, fuel efficient Hybrid and electric vehicles Continued demand for hopper cars Increased oil production driving tank car production Trends Attractive End Markets _____________________ (1) Management estimates. |
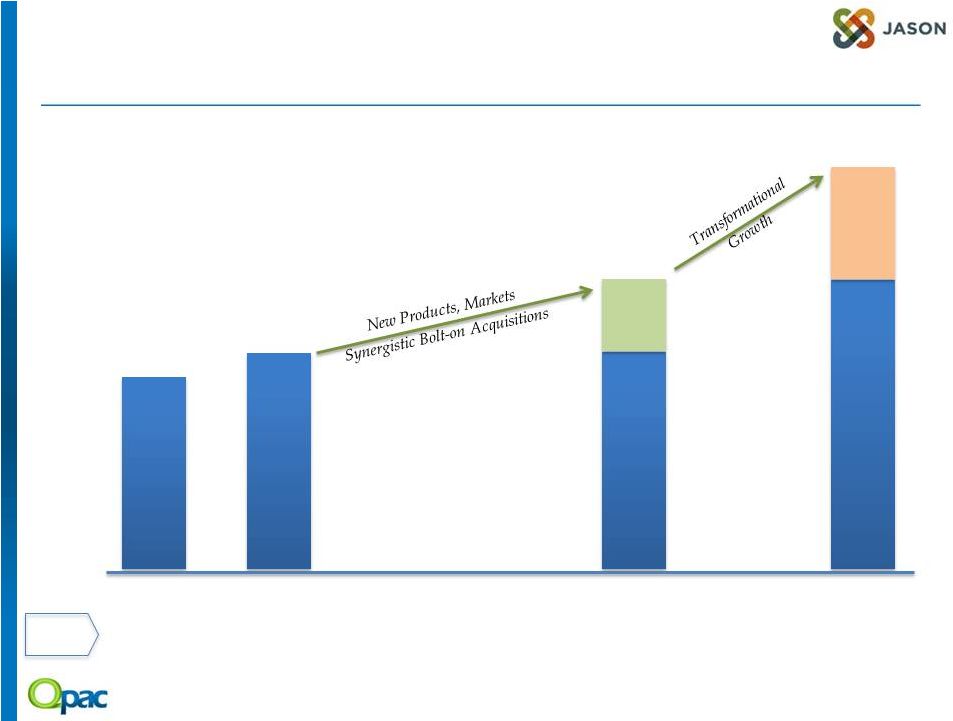
 • $250M-$500M revenue • Target businesses that will leverage Jason’s core competencies • A focus on generating above market returns • $25M-$250M of additional revenue • Strengthen core businesses Future M&A Activity to Drive Significant Shareholder Returns 21 BOLT-ON NEW PLATFORM BOLT-ON NEW PLATFORM |
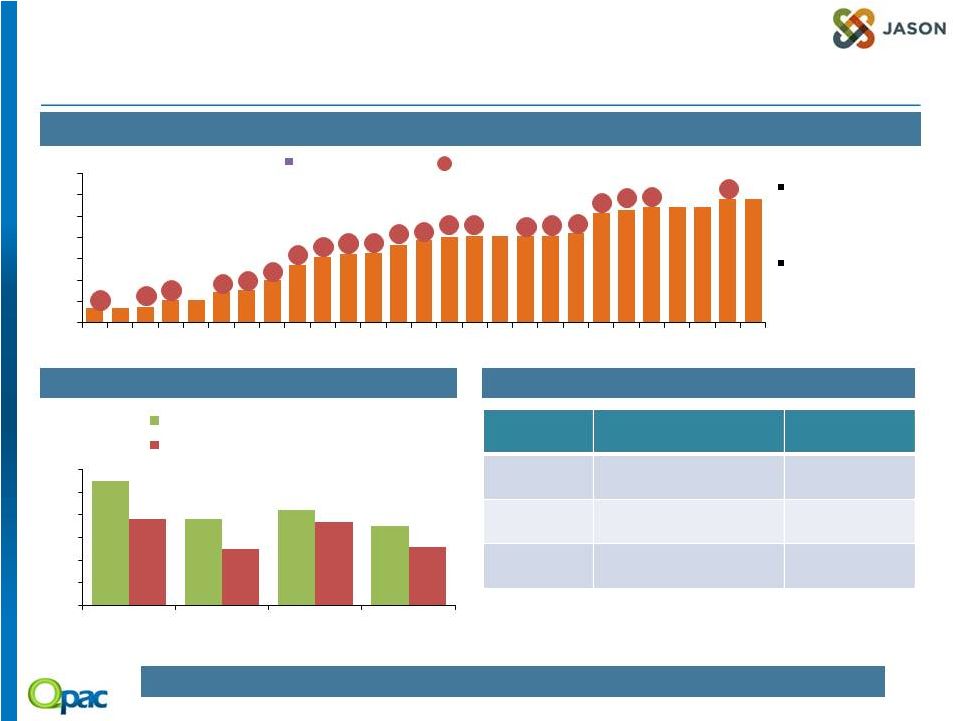 Demonstrated Track Record of Acquiring Businesses Since formation, Jason has acquired and integrated 40 businesses Successfully integrating acquisitions has been key to Jason’s Strategy Significant Growth Potential from M&A 45 Targets identified with over $1 Billion+ Revenue Cumulative Revenue (1) # Number of Acquisitions 3 1 2 2 3 2 1 1 2 2 2 3 4 2 1 1 2 2 2 1 1 ($ in millions) 22 Average Multiple Reduction of ~1.0x Current Pipeline Segment Rationale Estimated Revenue ($m) Seating Market Expansion, Product Line Expansion $50-$250 Finishing Product Line Expansion, Synergistic $85-$200 Components Market Expansion $35-$100 Jason would strongly consider adding a new platform in the right adjacent market _____________________ Note: 1. Excludes organic growth of acquired businesses. $0 $100 $200 $300 $400 $500 $600 $700 '86 '87 '88 '89 '90 '91 '92 '93 '94 '95 '96 '97 '98 '99 '00 '01 '02 '03 '04 '05 '06 '07 '08 '09 '10 '11 '12 5.5x 3.8x 4.2x 3.5x 3.8x 2.5x 3.7x 2.6x 0.0x 1.0x 2.0x 3.0x 4.0x 5.0x 6.0x Morton Michigan Seat Lippert-Unipol Arcor EBITDA Multiple at Acquisition EBITDA Multiple Post Integration |
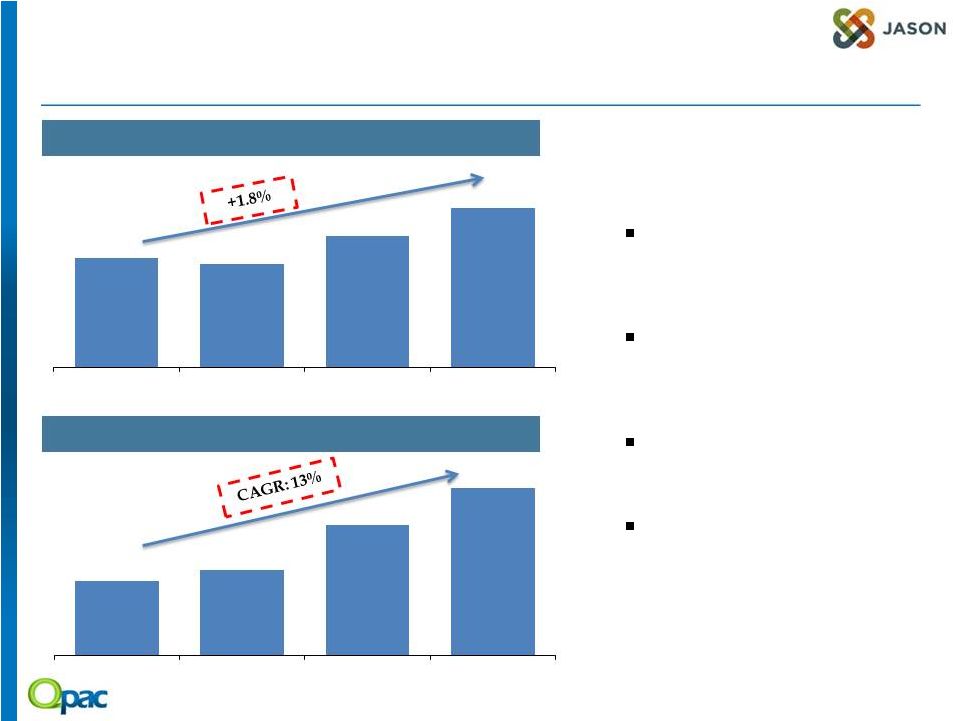
 Quinpario’s Vision: Jason - a Significant Growth Platform 23 EBITDA $79.8M 11.7% $91.6M 12.4% $150M 15% ~$200M ~15% Jason a $1 billion platform by 2017 2013 2015 2017 $681M $741M ~$1.0B ~1.25-1.50B 2017 1. Robust Businesses 2. Strong Pipeline of Products 3. Opportunities for Geographic Expansion 4. Significant Margin Expansion Potential 5. Demonstrated Integration Track Record |
 • Summary • Jason Overview • Growth Opportunities • Financial Overview |
 ($ in millions) 2011A 2012A 2013A 2014P 2015P Total Revenues 600.6 655.0 680.8 697.7 741.4 % Growth 7.6% 9.1% 3.9% 2.5% 6.3% Gross Profit 130.6 139.9 153.5 165.7 176.2 % Gross Margin 21.7% 21.4% 22.5% 23.7% 23.8% SG&A 96.3 99.1 110.0 114.2 116.8 % of Total Revenues 16.0% 15.1% 16.2% 16.4% 15.8% Adjusted EBITDA 58.0 70.4 79.8 82.8 91.6 % EBITDA Margin 9.7% 10.7% 11.7% 11.9% 12.4% Depreciation & Amortization 20.2 24.2 27.0 25.0 27.3 % of Total Revenues 3.4% 3.7% 4.0% 3.6% 3.7% Adjusted EBIT 37.8 46.2 52.8 57.8 64.3 % EBIT Margin 6.3% 7.1% 7.8% 8.3% 8.7% Capital Expenditures 16.3 17.8 19.1 23.2 24.3 % of Total Revenues 2.7% 2.7% 2.8% 3.3% 3.3% Jason Historical and Projected Financial Performance 25 _____________________ Source of historical financials: Audited financial statements of Jason Partners Holdings Inc. A reconciliation from non-GAAP measures to GAAP measures is included in the appendix hereto 2014P and 2015P EBITDA include $3M of estimated annual public company costs (half year for 2014) and exclude earnings from JV sold in Q1 2014 Historical Projections |
 A Focus on Margin Expansion to Drive Profitability 26 EBITDA (2010-2013) EBITDA Margins (2010-2013) ($ in millions) 80 Increased pricing and improved customer perception has lead to significant impact on gross margins within Acoustics Moving towards being the price leader in Finishing where Jason’s revenue is three times its largest competitor Further margin expansion expected as a result of higher- margin new product launches Productivity initiatives, Lean and Six Sigma projects will improve COGS by 5% over prior year 9.9% 9.7% 10.7% 11.7% 2010 2011 2012 2013 55 58 70 2010 2011 2012 2013 |
 Appendix |
 Jason Adjusted EBITDA Reconciliation 28 2011 2012 2013 ($ in millions) Net income $9.3 $14.7 $24.1 Tax provision 4.1 4.8 18.2 Interest expense 17.0 18.6 20.7 Depreciation and amortization 20.2 24.2 27.0 Loss on disposals of fixed assets - net 0.1 0.5 - EBITDA 50.7 62.8 90.0 Adjustments: Impairment of long-lived assets 1.3 0.5 - Restructuring 0.7 1.6 4.0 Advisory, legal, professional fees and special bonuses 0.9 1.0 6.1 Newcomerstown net fire costs (income) and related items 3.0 (1.4) (18.8) Adjustment for non-discrete fire costs - 1.4 (1.4) Multiemployer pension plan withdrawal expense (gain) - 3.4 (0.7) Purchase accounting impact of inventory write-up 0.4 - - Gain on claim settlement - - (0.5) Sponsor fees 1.0 1.1 1.1 Total adjustments 7.3 7.6 (10.2) Adjusted EBITDA $58.0 $70.4 $79.8 |
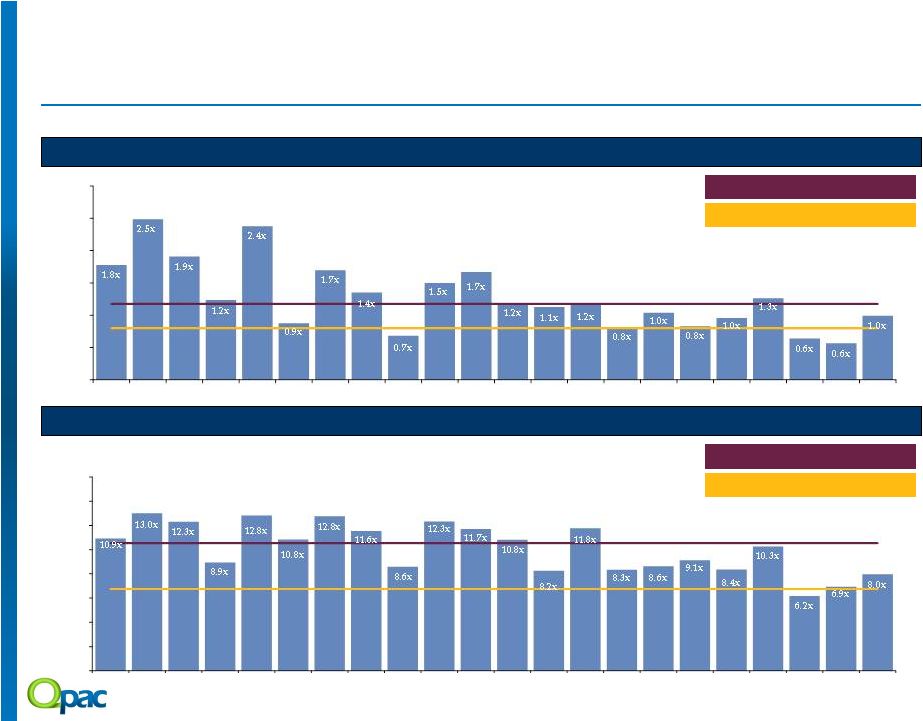 Valuation Summary 29 Selected Public Companies Trading Statistics •EV/CY2013 Revenue EV/CY2013 EBITDA EV/CY2013 Revenue Median: 1.2x EV/CY2013 EBITDA Median: 10.5x Target Purchase Multiple: 0.8x Target Purchase Multiple: 6.8x Source: S&P Capital IQ as of 3/7/2014, SEC filings, press releases, investor presentations, Thomson Estimates, Factset Research Systems and Wall Street research. 0.0x 0.5x 1.0x 1.5x 2.0x 2.5x 3.0x CSL RXN CR RBC B AIT NPO TRS GFF CIR AIMC DW BLT FSS PKOH SXI ROCK CMCO KAI HNH SHLO NNBR 0.0x 2.0x 4.0x 6.0x 8.0x 10.0x 12.0x 14.0x 16.0x CSL RXN CR RBC B AIT NPO TRS GFF CIR AIMC DW BLT FSS PKOH SXI ROCK CMCO KAI HNH SHLO NNBR |
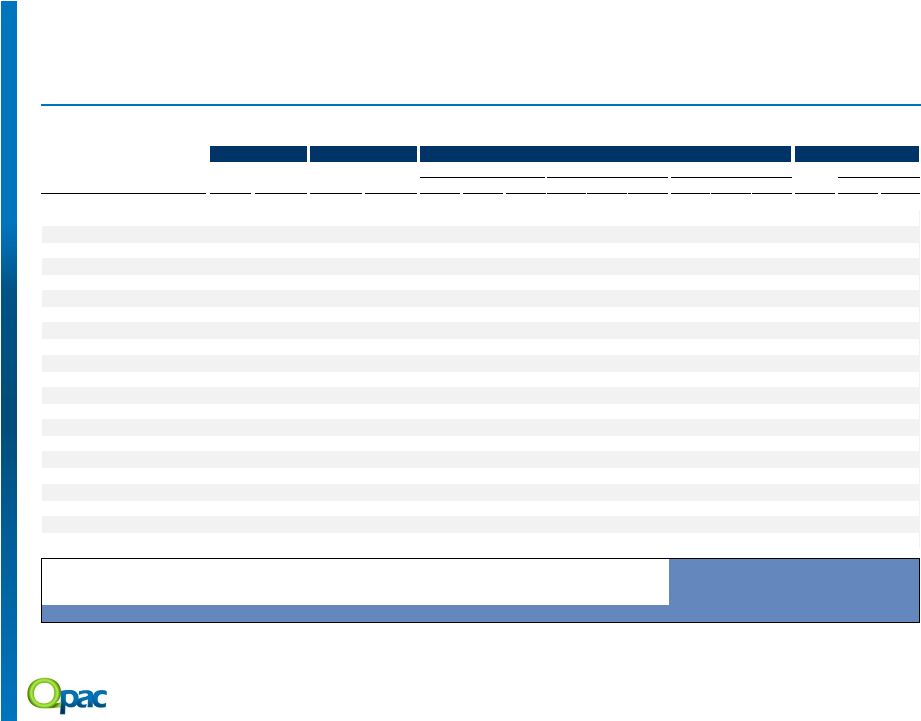  Valuation Summary 30 Selected Public Companies Trading Statistics (Detail) Stock Price Market Value Valuation Multiples Growth Data % Off Equity Enterprise EV / Rev EV / EBITDA P/E Growth PEG 3/7/14 LTM High Value Value (1) CY13 CY14 CY15 CY13 CY14 CY15 CY13 CY14 CY15 Rate CY14 CY15 Carlisle Companies $80.18 0% $5,228 $5,225 1.8x 1.7x 1.6x 10.9x 9.8x 9.0x 20.0x 20.0x 17.1x 12% 1.7x 1.4x Rexnord Corporation 30.82 0% 3,311 5,097 2.5x 2.3x 2.1x 13.0x 11.3x 10.5x 26.0x 19.0x 16.0x 23% 0.8x 0.7x Crane Co. 73.08 0% 4,340 4,955 1.9x 1.6x 1.5x 12.3x 9.6x 8.8x 17.6x 15.5x 13.9x 10% 1.6x 1.5x Regal Beloit Corporation 75.96 14% 3,456 3,825 1.2x 1.2x 1.1x 8.9x 8.5x 8.2x 17.9x 16.6x 14.3x 11% 1.5x 1.3x Barnes Group 38.54 6% 2,118 2,595 2.4x 2.1x 2.1x 12.8x 9.8x 9.0x 21.4x 16.9x 15.2x 10% 1.7x 1.5x Applied Industrial Technologies 51.66 4% 2,193 2,141 0.9x 0.8x 0.8x 10.8x 10.0x 8.5x 19.4x 17.5x 14.9x 12% 1.5x 1.2x EnPro Industries 73.23 8% 1,558 1,940 1.7x 1.6x 1.6x 12.8x 11.7x 10.6x N.M. 38.6x 32.0x 15% 2.6x 2.1x TriMas Corporation 34.85 17% 1,577 1,885 1.4x 1.3x 1.2x 11.6x 8.5x 7.7x 16.5x 15.8x 13.5x 14% 1.1x 1.0x Griffon Corporation 12.77 11% 656 1,294 0.7x 0.7x N.A. 8.6x 8.0x N.A. 42.6x 33.6x N.A. 11% 3.1x N.A. CIRCOR International 75.53 9% 1,339 1,286 1.5x 1.4x 1.3x 12.3x 10.9x 9.6x 23.7x 20.2x 16.9x 21% 1.0x 0.8x Altra Holdings 36.60 2% 990 1,206 1.7x 1.5x 1.4x 11.7x 9.6x 8.7x 22.4x 18.4x 15.7x 17% 1.1x 0.9x Drew Industries Incorporated 52.17 5% 1,253 1,187 1.2x 1.1x 1.0x 10.8x 9.6x 8.2x 25.3x 19.3x 15.5x 17% 1.2x 0.9x Blount International 12.62 14% 623 1,031 1.1x 1.1x 1.1x 8.2x 7.7x 7.2x 18.6x 15.2x 12.7x 13% 1.2x 1.0x Federal Signal Corp 14.74 7% 938 1,007 1.2x 1.1x 1.1x 11.8x 11.0x N.A. 16.9x 18.0x 15.8x 15% 1.2x 1.1x Park-Ohio Holdings 52.43 5% 648 982 0.8x 0.7x 0.7x 8.3x 7.0x N.A. 13.6x 11.2x 10.4x 13% 0.9x 0.8x Standex International Corporation 57.28 12% 731 730 1.0x 1.0x 0.9x 8.6x 7.8x N.A. 15.3x 13.5x N.A. 15% 0.9x N.A. Gibraltar Industries 18.47 4% 570 687 0.8x 0.8x 0.8x 9.1x 8.1x 7.2x 28.0x 22.0x 15.8x 8% 2.7x 2.0x Columbus McKinnon Corporation 26.05 8% 516 544 1.0x 0.9x 0.9x 8.4x 7.0x 6.2x 17.9x 14.6x 11.5x 16% 0.9x 0.7x Kadant Inc. 40.07 4% 447 435 1.3x 1.1x 1.0x 10.3x 8.0x 7.9x 19.7x 15.1x 13.0x 20% 0.8x 0.7x Handy & Harman 20.90 17% 271 418 0.6x N.A. N.A. 6.2x N.A. N.A. N.A. N.A. N.A. N.A. N.A. N.A. Shiloh Industries 17.48 31% 301 418 0.6x 0.5x N.A. 6.9x 5.8x N.A. 12.8x 10.7x N.A. 19% 0.6x N.A. NN Inc. 19.27 10% 336 370 1.0x 0.9x 0.9x 8.0x 7.1x 6.5x 18.6x 14.7x 13.3x 16% 0.9x 0.8x 3rd Quartile 1.7x 1.5x 1.5x 11.9x 9.9x 9.0x 23.4x 19.6x 15.9x 17% 1.6x 1.4x Mean 1.3x 1.2x 1.2x 10.1x 8.9x 8.4x 20.7x 18.4x 15.4x 15% 1.4x 1.1x Median 1.2x 1.1x 1.1x 10.5x 8.5x 8.4x 19.0x 16.9x 15.1x 15% 1.2x 1.0x 1st Quartile 0.9x 0.9x 0.9x 8.4x 7.8x 7.4x 17.1x 14.9x 13.2x 12% 0.9x 0.8x Source: S&P Capital IQ as of 3/7/2014, SEC filings, press releases, investor presentations, Thomson Estimates, Factset Research Systems and Wall Street research. 1) Enterprise value = market cap + net debt (including minority interest) + redeemable convertible preferred. ($ in millions, except per share data) |
  Valuation Summary 31 Selected Public Companies Operating Statistics (Detail) ($ in millions, except per share data) Revenue Revenue Growth Margin Analysis Gross Margin EBITDA Net Income CY13 CY14 CY15 CY13 CY14 CY15 CY13 CY14 CY15 CY13 CY14 CY15 CY13 CY14 CY15 Regal Beloit Corporation $3,096 $3,251 $3,393 (2%) 5% 4% 26% 28% 26% 14% 14% 14% 4% 6% 7% Carlisle Companies 2,943 3,148 3,370 3% 7% 7% 27% 28% 25% 16% 17% 17% 7% 8% 9% Crane Co. 2,595 3,038 3,210 1% 17% 6% 40% 42% 34% 16% 17% 18% 8% 9% 9% Applied Industrial Technologies 2,449 2,522 2,677 1% 3% 6% 28% 29% N.A. 8% 9% 9% 5% 5% 5% Rexnord Corporation 2,053 2,209 2,372 2% 8% 7% 40% 36% 37% 19% 20% 20% 1% 8% 8% Griffon Corporation 1,901 1,949 N.A. 4% 3% N.A. 24% 24% 23% 8% 8% N.A. 0% 1% N.A. TriMas Corporation 1,395 1,485 1,576 10% 6% 6% 32% 31% 28% 12% 15% 15% 5% 7% 7% Park-Ohio Holdings 1,218 1,366 1,445 7% 12% 6% 18% N.A. 19% 10% 10% N.A. 4% 4% 5% EnPro Industries 1,144 1,184 1,242 (3%) 4% 5% 34% 37% 34% 13% 14% 15% 2% 5% 5% Barnes Group 1,092 1,259 1,216 18% 15% (3%) 46% 38% 34% 19% 21% 24% 25% 10% 11% Drew Industries Incorporated 1,016 1,113 1,211 13% 10% 9% 26% 25% 21% 11% 11% 12% 5% 5% 6% Blount International 901 935 971 (3%) 4% 4% 29% 31% 29% 14% 14% 15% 4% 5% 5% CIRCOR International 858 889 956 1% 4% 7% 33% 35% 32% 12% 13% 14% 5% 8% 8% Federal Signal Corp 851 905 947 6% 6% 5% 27% 27% 24% 10% 10% N.A. 19% 5% 5% Gibraltar Industries 828 865 910 5% 5% 5% 22% 22% 20% 9% 10% 11% (1%) 3% 4% Altra Holdings 722 826 868 (1%) 14% 5% 34% 37% 31% 14% 15% 16% 6% 6% 7% Shiloh Industries 738 850 N.A. 23% 15% N.A. 14% 11% 11% 8% 8% N.A. 3% 3% N.A. Standex International Corporation 705 748 818 5% 6% 9% 37% 33% 33% 12% 13% N.A. 6% 7% N.A. Handy & Harman 655 N.A. N.A. 13% N.A. N.A. N.A. 28% N.A. 10% N.A. N.A. 6% N.A. N.A. Columbus McKinnon Corporation 567 595 631 (7%) 5% 6% 31% 31% 32% 11% 13% 14% 13% 6% 7% Kadant Inc. 344 412 423 4% 20% 3% 56% 56% 46% 12% 13% 13% 7% 7% 8% NN Inc. 374 398 416 1% 6% 4% 21% 22% 19% 12% 13% 14% 5% 6% N.A. 3rd Quartile 8% 13% 7% 36% 37% 34% 14% 15% 17% 7% 7% 8% Mean 5% 8% 5% 31% 31% 31% 12% 13% 15% 6% 6% 7% Median 3% 6% 6% 29% 29% 31% 12% 13% 14% 5% 6% 7% 1st Quartile 0% 4% 4% 25% 26% 22% 10% 10% 13% 4% 5% 5% Jason Incorporated $681 $698 $741 4% 2% 6% 22% 24% 24% 12% 12% 12% 1% 2% 3% Source: S&P Capital IQ as of 3/7/2014, SEC filings, press releases, investor presentations, Thomson Estimates, Factset Research Systems and Wall Street research. |