Filed by FS Investment Corporation III
pursuant to Rule 425 under the Securities Act of 1933
and deemed filed under Rule14a-6(b) of the Securities Exchange Act of 1934
Subject Company: FS Investment Corporation III
File No. of Related Registration Statement:333-232556
 | Q2 Fund commentary As of 6/30/2019 |
FS Investment Corporation III
Summary
| • | Equity and fixed income markets moved higher during the second quarter of 2019 despite looming trade tensions and signs of decelerating economic activity. |
| • | The Fed took an accommodative tone during the quarter, which supported the rally across major asset classes. High yield bonds and senior secured loans returned 2.6% and 1.6%, respectively, during the second quarter of 2019.1 |
| • | FS Investment Corporation III (FSIC III or the Fund) generated a shareholder return (without sales charge) of 1.6% for the quarter ended June 30, 2019.2 |
Market review
Equity and fixed income benchmarks moved higher during the second quarter of 2019, though trade tensions were a near-constant backdrop. When combined with a broad-based slowdown across many economic indicators, markets experienced periods of significant volatility during the quarter. The economic slowdown was most pronounced in the manufacturing sector, which has been on a gradual downtrend since August 2018 and finished the quarter near a three-year low, close to contraction territory.3 Consumer confidence also fell well below expectations during the quarter and reached its lowest level in nearly two years.4 Against this backdrop, the Fed quickly shifted from its emphasis on patience regarding any future rate moves toward an accommodative stance by the end of the quarter. The Fed’s accommodative turn supported risk assets, aslarge-cap stocks nearedall-time highs while bonds benefited from the move toward a lower-rate environment. The10-year U.S. Treasury yield fell nearly another 50 bps in Q2 and reached its lowest point since November 2016.5
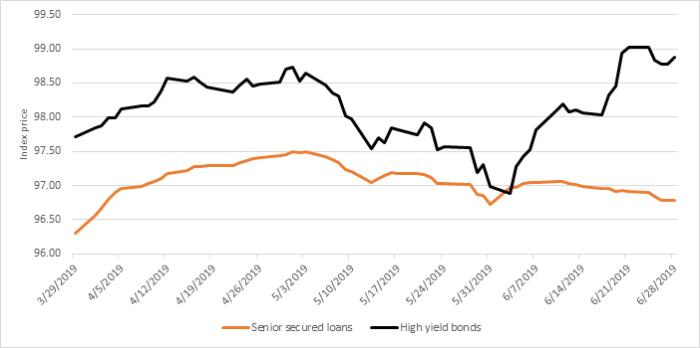
LEVERAGED CREDIT MARKETS MOVE HIGHER IN Q2 DESPITE VOLATILITY IN MAY1,2
Source: Bloomberg and Credit Suisse.
An investment in FSIC III involves substantial risks. For a summary of these important risk factors, please turn to page 5 or click here.
An investment in FSIC III involves a high degree of risk and may be considered speculative. Investors are advised to consider the investment objectives, risks, and charges and expenses of FSIC III carefully. Investors should read and carefully consider all information found in FSIC III’s reports filed with the U.S. Securities and Exchange Commission.
FSIC III is closed to new investors. This fund commentary is for informational purposes only and does not constitute an offer to sell nor a solicitation of an offer to buy the securities described herein.
This commentary is available for advisor use only in the state of Ohio.
High yield bonds returned 2.6% during the second quarter of 2019 benefiting from a Goldilocks environment defined by a dovish Fed,slow-but-positive economic growth and minimal inflation pressures. In fact, high yield bonds enjoyed their strongest start to the year through the first six months since 2009, returning 10.1%year-to-date.1 Despite a rise in outflows from high yield mutual funds and ETFs in May, high yield funds pulled in approximately $2.2 billion in June and $12.1 billionyear-to-date.6 Falling rate expectations and better-than-feared Q1 corporate profits helped fuel investor demand.
Loan prices faced many of the same technical headwinds in Q2 as they did throughout Q1 as investors continued their rotation away from low duration, floating rate assets. Bank loan mutual funds and ETFs experienced more than $9.9 billion in net outflows during the quarter, marking 33 consecutive weekly outflows dating back to November 2018.6 Despite the technical pressures, senior secured loans generated positive returns of 1.6% during the quarter driven by reduced supply and strong demand from CLOs, though they underperformed high yield bonds.1
FS Investments and KKR partnership overview Since announcing the partnership between FS Investments and KKR, we have focused on deriving the full benefits of the partnership in three key areas:
• We continued to selectively allocate capital during the quarter with a focus on senior secured debt, which represented 83% of the portfolio as of June 30, 2019 based on fair value, including assets held through the Fund’s total return swap.
• We continued to aggressively manage the Fund’s underperforming credits and are working closely with the management teams and financial sponsors of these companies to address their operational and liquidity needs.
• Finally, we have focused on generating consistent deal flow through a robust origination pipeline, as seen by the increased deal volume and capital deployment reported in the last four quarters. We believe it is critically important to have broad origination capabilities, especially within highly competitive markets like we have seen through 1H 2019. Within these types of environments, we continue to be selective in the deals that are reviewed and ultimately approved for investment.
These collective efforts are designed to increase the Fund’s allocations to direct originations, grow portfolio yield, reduce volatility in the Fund’s net asset value and otherwise help improve distribution coverage. | ||||||||||
Q2 2019 SHAREHOLDER
PERFORMANCE1,2 | Performance review FSIC III paid regular cash distributions of approximately $0.17 per share during the quarter, representing an annualized distribution rate of 9.09% based on the distribution reinvestment price of $7.70 per share as of June 30, 2019.7
The Fund’s net asset value declined modestly to $7.56 per share as of June 30, 2019 from $7.62 per share as of March 31, 2019. The decline in NAV was offset by distributions paid during the quarter as the Fund generated a shareholder-based total return (without sales charge) of 1.6%, matching senior secured loans’ quarterly returns and underperforming high yield bonds’ returns of 2.6% for the quarter.1,2 (Please see the performance disclosure below for a detailed description of the calculation of shareholder returns.) | |||||||||
FSIC III
|
|
1.6% |
| |||||||
Senior secured loans
| 1.6% | |||||||||
High yield bonds
| 2.6% | |||||||||
| The Fund’s quarterly NAV decline was driven by realized losses due to the combination of a restructuring in one of the Fund’s underperforming portfolio companies, which we have been monitoring for the past several quarters in an attempt to maximize value, and the sale of several broadly syndicated investments where we believed the downside risk outweighed the upside return potential. Net realized and unrealized depreciation was $2.7 million, or $0.01 per share during the quarter.
Investment activity Purchases totaled $306 million during the quarter, 73% of which was in senior secured debt. Subordinated debt represented 7% of new purchases during the quarter while asset-based finance investments represented 17%. Equity and other investments represented 3% of new purchases during the quarter.
More broadly across the portfolio, senior secured debt represented 83% of the fair value of the portfolio as of June 30, 2019, when including assets held through the Fund’s total return swap, compared to 85% the prior quarter. Subordinated debt investments represented 8% of the portfolio’s fair value as of June 30, 2019, compared to 5% the prior quarter. Asset based finance investments represented 6% while equity and other investments represented just 3% of the portfolio’s fair value atquarter-end.
Conclusion We continue to focus on aggressively managing underperforming credits within the portfolio. At the same time, we will seek to maximize the benefits of the Fund’s exemptive relief order toco-invest with KKR’s credit platform and access a growing investment pipeline focused on upper middle market companies. We believe the upper middle market offers a differentiated source of deal flow for FSIC III and attractive investment opportunities due to lower competition. We expect these combined efforts will help grow portfolio yield, reduce portfolio volatility and meet the Fund’s income and return objectives for investors over the long term.
During the quarter FSIC III entered into an agreement and plan of merger with FS Investment Corporation II (FSIC II), FS Investment Corporation IV (FSIC IV) and Corporate Capital Trust II (CCT II) and certain other parties to form the second-largest business development company by assets under management with approximately $9 billion in assets on a combined basis as of June 30, 2019. The mergers are part of a proposed three-step plan toward a liquidity event for all shareholders, including a potential recapitalization of the combined company through thepro-rata issuance of preferred stock representing approximately 20% of the combined company’s net asset value to all shareholders of the combined company followed by a listing of the combined company’s common shares on the New York Stock Exchange. No assurance can be made regarding the timing of the mergers, the recapitalization transaction or the listing, or that the mergers, the recapitalization transaction or the listing will occur at all. The mergers are expected to close in the fourth quarter of 2019, subject to approval by FSIC II, FSIC III, FSIC IV and CCT II shareholders and other customary closing conditions. Visitwww.fsproxy.com for more information. |
SHAREHOLDER RETURNS AS OF JUNE 30, 2019
(without sales charge), compounded monthly
| (with sales charge), compounded monthly
| |||||||||||||||
| YTD | 1 year | 3 year (annualized) | 5 year (annualized) | Since inception (annualized) | Cumulative total return since inception | Cumulative total return since inception | Inception date | |||||||||
3.9% | 2.6% | 6.6% | 5.4% | 5.4% | 31.7% | 18.6% | April 2, 2014 | |||||||||
Shareholder returns (without sales charge) are the total returns an investor received for the highlighted period taking into account all distributions paid during such period, compounded monthly. Except for the YTD,1-year and3-year periods, the calculation assumes that the investor purchased shares at FSIC III’s public offering price, excluding any selling commissions or dealer manager fees, at the beginning of the applicable period and reinvested all cash distributions pursuant to FSIC III’s distribution reinvestment plan (“DRP”). Since FSIC III closed its public offering to new investors investing through independent broker-dealers (the “IBD Channel”) in February 2016, and has since issued new shares to investors who invested through the IBD Channel only pursuant to its DRP, the calculation of FSIC III’s shareholder returns (without sales charge) for the YTD,1-year and3-year periods assumes that the investor purchased shares at the beginning of the period at a price based upon FSIC III’s DRP on such date. Shareholder returns (without sales charge) do not include selling commissions and dealer manager fees, which historically could total up to 10% of the public offering price. Had such selling commissions and dealer manager fees been included, the performance shown would be lower.
Shareholder return (with sales charge) is the total return an investor received since inception taking into account all distributions paid during such period, compounded monthly. The calculation assumes that the investor purchased shares at FSIC III’s public offering price (which includes the maximum historical selling commissions and dealer manager fees) at inception and reinvested all distributions pursuant to FSIC III’s DRP.
Valuation as of the end of each period shown above is the repurchase price pursuant to FSIC III’s share repurchase program on such date. Upon liquidation or repurchase, market conditions may cause the actual values to be more or less than the values shown.
Prior to February 2016, FSIC III’s public offering price was subject to a sales charge of up to 10% and offering expenses of up to 1.5% of the gross proceeds received in the Fund’s offering. Following February 2016, FSIC III only offered its shares at the institutional offering price, which was not subject to any sales charge, but was subject to offering expenses of up to 1.5% of the gross proceeds received in the Fund’s offering. FSIC III is closed to new investors. FSIC III’s total expenses as a percentage of average net assets attributable to common stock was 7.39% for the year ended December 31, 2018.
Note: All figures may be rounded. Returns shown are historical and are based on past performance. Past performance is not indicative of future results.
| 1 | Total returns are based on indices and represent income from regular interest and dividend payments and appreciation in market value with respect to the securities included in the indices. Indices used: high yield bonds – ICE BofAML U.S. High Yield Master II Index, which is designed to track the performance of U.S. dollar-denominated below investment grade corporate debt publicly issued in the U.S. domestic market; investment grade bonds – ICE BofAML U.S. Corporate Master Index, which tracks the performance of U.S. dollar-denominated investment grade corporate debt publicly issued in the U.S. domestic market; senior secured loans – Credit Suisse Leveraged Loan Index, which tracks the investable market of the U.S. dollar-denominated leveraged loan market;10-year U.S. Treasuries – ICE BofAML10-year U.S. Treasury Index, which measures the total return of the10-year U.S. Treasury note. This data is for illustrative purposes only and is not indicative of any investment. An investment cannot be made directly in an index. |
| 2 | Please see the table above for a description of how FSIC III’s shareholder returns (without sales charge) and shareholder return (with sales charge) are calculated. |
| 3 | Institute for Supply Management Manufacturing ISM,http://bit.ly/31UcDlm. |
| 4 | The Conference Board,http://bit.ly/32vCXCP. |
| 5 | Federal Reserve Bank of St. Louis,http://bit.ly/2J3ufoX. |
| 6 | Thomson Reuters Lipper. |
| 7 | The annualized distribution rate shown is expressed as a percentage equal to the projected annualized distribution amount per share (which is calculated by annualizing the distribution amount per share of $0.175 paid in the quarter ended June 30, 2019, without compounding), divided by FSIC III’s distribution reinvestment price per share of $7.70 as of June 30, 2019. The annualized distribution rate may be rounded. The payment of future distributions on FSIC III’s shares of common stock is subject to the discretion of FSIC III’s board of directors and applicable legal restrictions and, therefore, there can be no assurance as to the amount or timing of any such future distributions. For the quarter ended June 30, 2019, 100% of FSIC III’s distributions were funded through net investment income on a tax basis. No portion of FSIC III’s distributions during the quarter ended June 30, 2019 was funded through expense reimbursements from FSIC III’s sponsor. The determination of the tax attributes of FSIC III’s distributions is made annually at the end of FSIC III’s fiscal year, and a determination made on an interim basis may not be representative of the actual tax attributes of FSIC III’s distributions for a full year. The actual tax characteristics of distributions to shareholders are reported to shareholders annually on Form1099-DIV. |
RISK FACTORS
Investing in FSIC III may be considered speculative and involves a high level of risk, including the risk of a substantial loss of investment. The following are some of the risks an investment in FSIC III’s common stock involves; however, you should carefully consider all of the information found in Item 1A of our annual report on Form10-K entitled “Risk Factors” and included under the caption “Risk Factors” in the proxy statement relating to the potential merger transaction with FSIC II filed by the Fund with the U.S. Securities and Exchange Commission on August 13, 2019 (the SEC).
| • | Because there is no public trading market for shares of FSIC III’s common stock and FSIC III is not obligated to effectuate a liquidity event by a specified date, if at all, it is unlikely that you will be able to sell your shares. If you are able to sell your shares before FSIC III completes a liquidity event, it is likely that you will receive less than you paid for them. While FSIC III intends to conduct quarterly tender offers for its shares, only a limited number of shares will be eligible for repurchase and FSIC III may amend, suspend or terminate the share repurchase program at any time. |
| • | FSIC III invests in securities that are rated below investment grade by rating agencies or that would be rated below investment grade if they were rated. Below investment grade securities, which are often referred to as “junk,” have predominantly speculative characteristics with respect to the issuer’s capacity to pay interest and repay principal. They may also be difficult to value and illiquid. |
| • | FSIC III’s distributions may be funded from unlimited amounts of offering proceeds or borrowings, which may constitute a return of capital and reduce the amount of capital available to FSIC III for investment. Any capital returned to shareholders through distributions will be distributed after payment of fees and expenses. |
| • | An investment strategy focused primarily on privately held companies presents certain challenges, including the lack of available information about these companies. |
| • | Investing in middle market companies involves a number of significant risks, any one of which could have a material adverse effect on FSIC III’s operating results. |
| • | A lack of liquidity in certain of FSIC III’s investments may adversely affect its business. |
| • | FSIC III is subject to financial market risks, including changes in interest rates, which may have a substantial negative impact on its investments. |
| • | FSIC III has borrowed funds to make investments, which increases the volatility of its investments and may increase the risks of investing in its securities. |
| • | FSIC III’s previous distributions to shareholders were funded in significant part from the reimbursement of certain expenses, including through the waiver of certain investment advisory fees. |
| • | The merger transaction involving FSIC III and FSIC II, the recapitalization transaction of the combined company and the listing of shares of the combined company on the New York Stock Exchange may not be completed on the anticipated timeline or at all. |
Forward-Looking Statements
Statements included herein may constitute “forward-looking” statements as that term is defined in Section 27A of the Securities Act of 1933, as amended (the “Securities Act”), and Section 21E of the Securities Exchange Act of 1934, as amended by the Private Securities Litigation Reform Act of 1995, including statements with regard to future events or the future performance or operations of FSIC II, FSIC III, FSIC IV and CCT II (collectively, the “Funds”). Words such as “believes,” “expects,” “projects,” and “future” or similar expressions are intended to identify forward-looking statements. These forward-looking statements are subject to the inherent uncertainties in predicting future results and conditions. Certain factors could cause actual results to differ materially from those projected in these forward-looking statements. Factors that could cause actual results to differ materially include changes in the economy, risks associated with possible disruption to a Fund’s operations or the economy generally due to terrorism or natural disasters, future changes in laws or regulations and conditions in a Fund’s operating area, failure to obtain requisite shareholder approval for the Proposals (as defined below) set forth in the Proxy Statement (as defined below), failure to consummate the business combination transaction involving the Funds, uncertainties as to the timing of the consummation of the business combination transaction involving the Funds, unexpected costs, charges or expenses resulting from the business combination transaction involving the Funds, failure to realize the anticipated benefits of the business combination transaction involving the Funds, failure to consummate the recapitalization transaction and failure to list the common stock of the combined entity on a national securities exchange. Some of these factors are enumerated in the filings the Funds make with the SEC and are also be contained in the Proxy Statement. The inclusion of forward-looking statements should not be regarded as a representation that any plans, estimates or expectations will be achieved. Any forward-looking statements speak only as of the date of this communication. Except as required by federal securities laws, the Funds undertake no obligation to update or revise any forward-looking statements, whether as a result of new information, future events or otherwise. Readers are cautioned not to place undue reliance on any of these forward-looking statements.
Additional Information and Where to Find It
This communication relates to a proposed business combination involving the Funds, along with related proposals for which shareholder approval is being sought (collectively, the “Proposals”). In connection with the Proposals, the Funds have filed relevant materials with the SEC, including a registration statement onForm N-14 (FileNo. 333-232556) filed with the SEC on August 8, 2019, which includes a joint proxy statement of the Funds and a prospectus of FSIC II (the “Proxy Statement”). This communication does not constitute an offer to sell or the solicitation of an offer to buy any securities or a solicitation of any vote or approval. No offer of securities shall be made except by means of a prospectus meeting the requirements of Section 10 of the Securities Act. SHAREHOLDERS OF THE FUNDS ARE URGED TO READ ALL RELEVANT DOCUMENTS FILED WITH THE SEC, INCLUDING THE PROXY STATEMENT, AS WELL AS ANY AMENDMENTS OR SUPPLEMENTS THERETO, BECAUSE THEY WILL CONTAIN IMPORTANT INFORMATION ABOUT THE FUNDS, THE BUSINESS COMBINATION TRANSACTION INVOLVING THE FUNDS AND THE PROPOSALS. Investors and security holders are able to obtain the documents filed with the SEC free of charge at the SEC’s website,www.sec.gov, or from FSIC II’s website, CCT II’s website, FSIC III’s website or FSIC IV’s website, each at www.fsinvestments.com.
Participants in the Solicitation
The Funds and their respective directors and trustees, executive officers and certain other members of management and employees, including employees of FS/KKR Advisor, LLC, Franklin Square Holdings, L.P. (which does business as FS Investments), KKR Credit Advisors (US) LLC and their respective affiliates, may be deemed to be participants in the solicitation of proxies from the shareholders of the Funds in connection with the Proposals. Information regarding the persons who may, under the rules of the SEC, be considered participants in the solicitation of the Funds’ shareholders in connection with the Proposals will be contained in the Proxy Statement. This document may be obtained free of charge from the sources indicated above.
| FS Investment Solutions, LLC 201 Rouse Boulevard, Philadelphia, PA19112 www.fsinvestmentsolutions.com 877-628-8575 Member FINRA/SIPC | FC-IC3-Q22019 | |||
© 2019 FS Investments www.fsinvestments.com | MERGC XXXX |