|
Exhibit 99.1 
|
Colony Starwood
HOMES
March 2016
March 2016 Business Update
Forward-Looking Statements
This presentation may include “forward-looking statements” within the meaning of Section 27A of the Securities Act of 1933, as amended, and Section 21 E of the Securities Exchange Act of 1934, as amended. These forward-looking statements, which are based on current expectations, estimates and projections about the industry and markets in which Colony Starwood Homes (“CSH”) operates and beliefs of and assumptions made by Colony Starwood Homes’ management, involve uncertainties that could significantly affect the financial results of Colony Starwood Homes. Words such as “may,” “will,” “should,” “might,” “could,” “expects,” “anticipates,” “intends,” “plans,” “believes,” “seeks,” “estimates,” “potential,” “continue,” “predicts,” variations of such words, the negative of such words and similar expressions are intended to identify such forward-looking statements, which generally are not historical in nature. Such forward-looking statements include, but are not limited to, statements about the anticipated benefits of the recently closed business combination transaction involving Colony Starwood Homes, including future financial and operating results (such as core funds from operations, “Core FFO”), and Colony Starwood Homes’ plans, objectives, expectations and intentions. All statements that address operating performance, events or developments that we expect or anticipate will occur in the future—including statements relating to expected synergies, improved liquidity and balance sheet strength—are forward-looking statements. These statements are not guarantees of future performance and involve certain risks, uncertainties and assumptions that are difficult to predict. Although we believe the expectations reflected in any forward-looking statements are based on reasonable assumptions, we can give no assurance that our expectations will be attained and therefore, actual outcomes and results may differ materially from what is expressed or forecasted in such forward-looking statements. Some of the factors that may affect outcomes and results include, but are not limited to: (i) national, regional and local economic climates; (ii) changes in financial markets and interest rates, or to the business or financial condition of CSH or its business; (iii) changes in market demand for single family rental homes and competitive pricing; (iv) risks associated with acquisitions, including the integration of the CSH’s businesses, information systems, and operations; (v) maintenance of real estate investment trust (“REIT”) status; (vi) availability of financing and capital; (vii) risks associated with achieving expected revenue synergies or cost savings; and (viii) those additional risks and factors discussed in reports filed with the Securities and Exchange Commission (“SEC”) by Colony Starwood Homes from time to time, including those discussed under the heading “Risk Factors” in its most recently filed reports on Forms 10-K and 10-Q. Neither Colony Starwood Homes nor any other person assumes responsibility for the accuracy or completeness of any of these forward-looking statements. You should not rely upon forward-looking statements as predictions of future events. Theforward-looking statements speak only as of the date of this communication, and Colony Starwood Homes anticipates that subsequent events and developments will cause their views to change. However, Colony Starwood Homes undertakes no duty to update any forward-looking statements appearing in this presentation, nor to confirm its prior statements to actual results or revised expectations, and it does not intend to do so.
ColonyStarwood 2
HOMES
AGENDA
I. Platform Overview II. Cash Flow Profile III. Capital Strategy
IV. Technology Overview
Appendix
3
Platform Overview
4
Colony Starwood Homes: Business Update
Highlights
Portfolio
Operations
Capital Markets
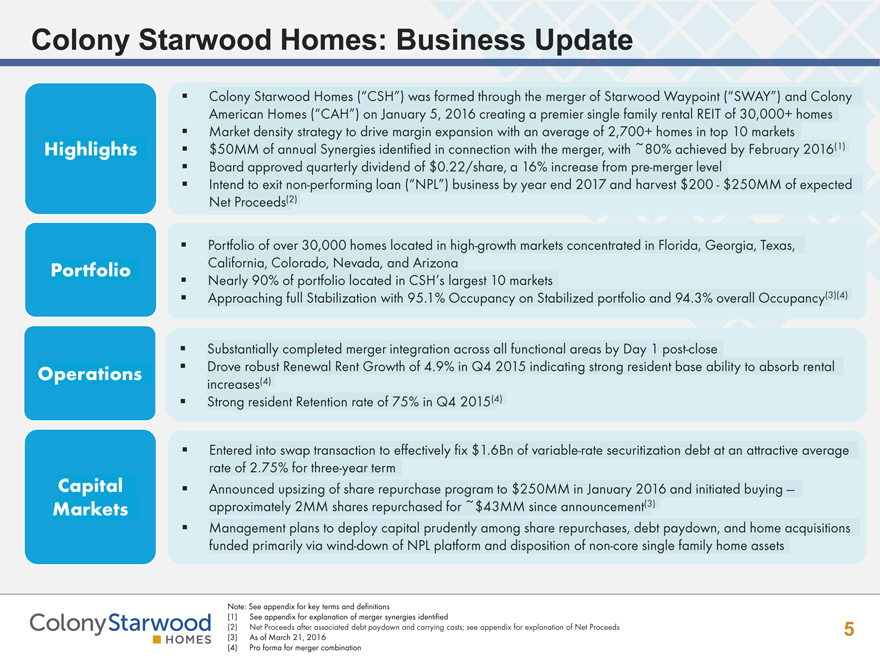
Colony Starwood Homes (“CSH”) was formed through the merger of Starwood Waypoint (“SWAY”) and Colony American Homes (“CAH”) on January 5, 2016 creating a premier single family rental REIT of 30,000+ homes
Market density strategy to drive margin expansion with an average of 2,700+ homes in top 10 markets
$50MM of annual Synergies identified in connection with the merger, with ~80% achieved by February 2016(1)
Board approved quarterly dividend of $0.22/share, a 16% increase from pre-merger level
Intend to exit non-performing loan (“NPL”) business by year end 2017 and harvest $200—$250MM of expected Net Proceeds(2)
Portfolio of over 30,000 homes located in high-growth markets concentrated in Florida, Georgia, Texas, California, Colorado, Nevada, and Arizona
Nearly 90% of portfolio located in CSH’s largest 10 markets
Approaching full Stabilization with 95.1% Occupancy on Stabilized portfolio and 94.3% overall Occupancy(3)(4)
Substantially completed merger integration across all functional areas by Day 1 post-close
Drove robust Renewal Rent Growth of 4.9% in Q4 2015 indicating strong resident base ability to absorb rental increases(4)
Strong resident Retention rate of 75% in Q4 2015(4)
Entered into swap transaction to effectively fix $1.6Bn of variable-rate securitization debt at an attractive average rate of 2.75% for three-year term
Announced upsizing of share repurchase program to $250MM in January 2016 and initiated buying — approximately 2MM shares repurchased for ~$43MM since announcement(3)
Management plans to deploy capital prudently among share repurchases, debt paydown, and home acquisitions funded primarily via wind-down of NPL platform and disposition of non-core single family home assets
Note: See appendix for key terms and definitions
(1) See appendix for explanation of merger synergies identified
(2) Net Proceeds after associated debt paydown and carrying costs; see appendix for explanation of Net Proceeds
(3) As of March 21, 2016
(4) Pro forma for merger combination
ColonyStarwood
HOMES
5
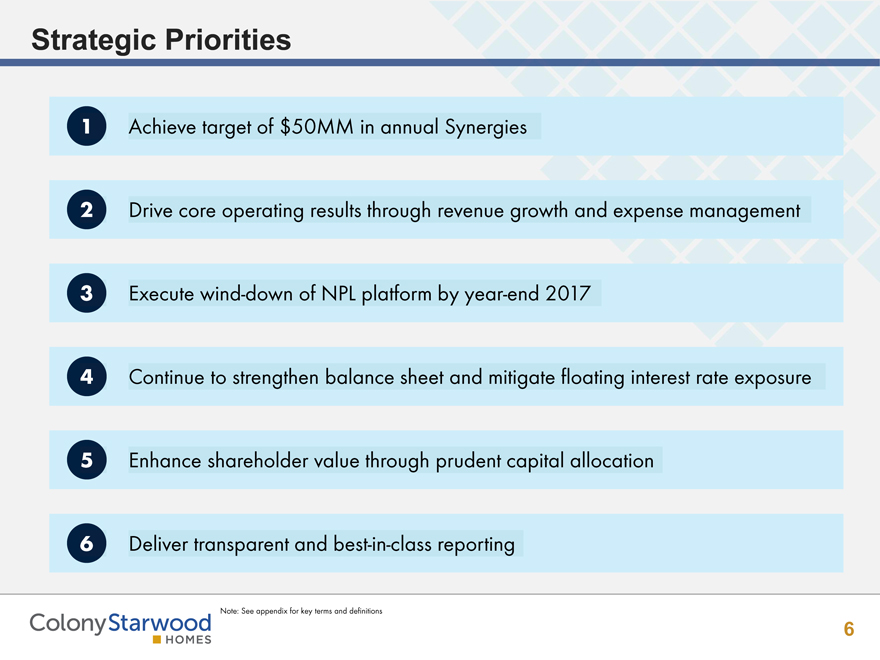
Strategic Priorities
1 Achieve target of $50MM in annual Synergies
2 Drive core operating results through revenue growth and expense management
3 Execute wind-down of NPL platform by year-end 2017
4 Continue to strengthen balance sheet and mitigate floating interest rate exposure
5 Enhance shareholder value through prudent capital allocation
6 Deliver transparent and best-in-class reporting
ColonyStarwood Note: See appendix for key terms and definitions
6
HOMES
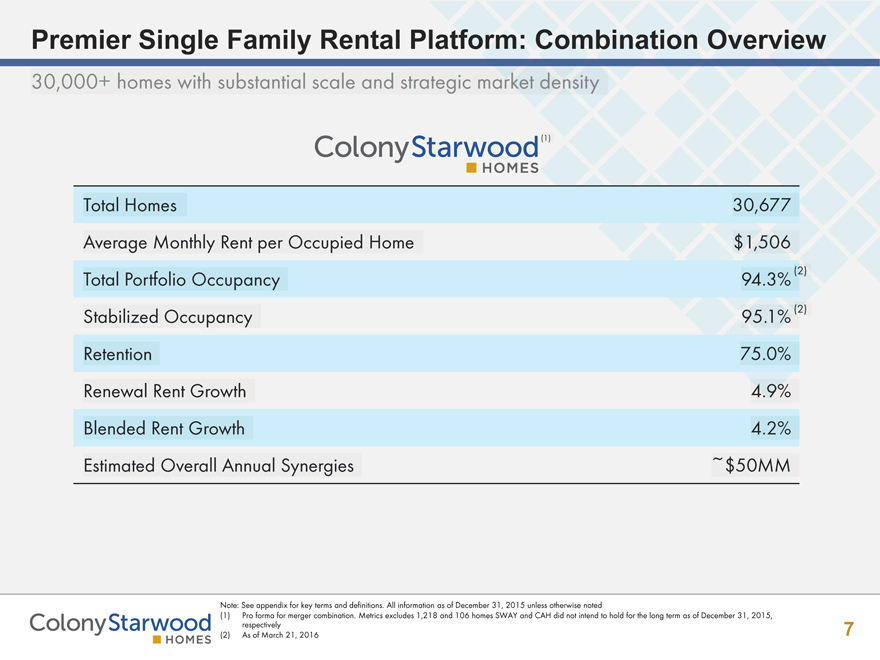
Premier Single Family Rental Platform: Combination Overview
30,000+ homes with substantial scale and strategic market density
Total Homes 30,677
Average Monthly Rent per Occupied Home $1,506
Total Portfolio Occupancy 94.3%(2)
Stabilized Occupancy 95.1%(2)
Retention 75.0%
Renewal Rent Growth 4.9%
Blended Rent Growth 4.2%
Estimated Overall Annual Synergies ~$50MM
ColonyStarwood
Note: See appendix for key terms and definitions. All information as of December 31, 2015 unless otherwise noted
(1) Pro forma for merger combination. Metrics excludes 1,218 and 106 homes SWAY and CAH did not intend to hold for the long term as of December 31, 2015, respectively
(2) As of March 21, 2016
7
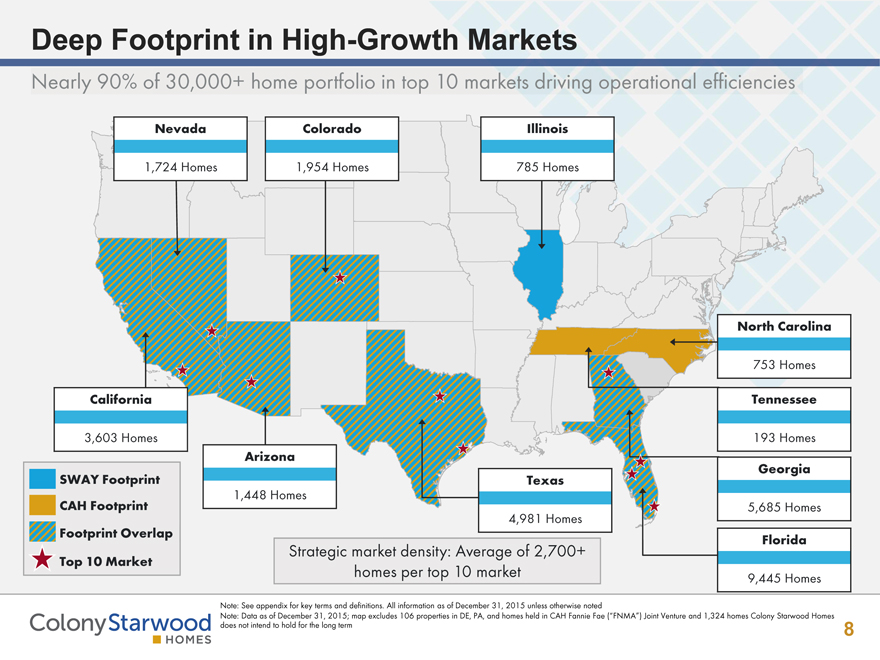
Deep Footprint in High-Growth Markets
Nearly 90% of 30,000+ home portfolio in top 10 markets driving operational efficiencies
Nevada Colorado Illinois
1,724 Homes 1,954 Homes 785 Homes
753 Homes North
California Tennessee
3,603 Homes 193 Homes
Arizona
ISWAY Footprint
ICAH Footprint
Footprint Overlap
1,448 Homes
Texas
4,981 Homes
Georgia
5,685 Homes
Florida
Top 10 Market
Strategic market density: Average of 2,700+
homes per top 10 market 9,445 Homes
Note: See appendix for key terms and definitions. All information as of December 31, 2015 unless otherwise noted
Note: Data as of December 31, 2015; map excludes 106 properties in DE, PA, and homes held in CAH Fannie Fae (“FNMA”) Joint Venture and 1,324 homes Colony Starwood Homes does not intend to hold for the long term
8
ColonyStarwood
HOMES
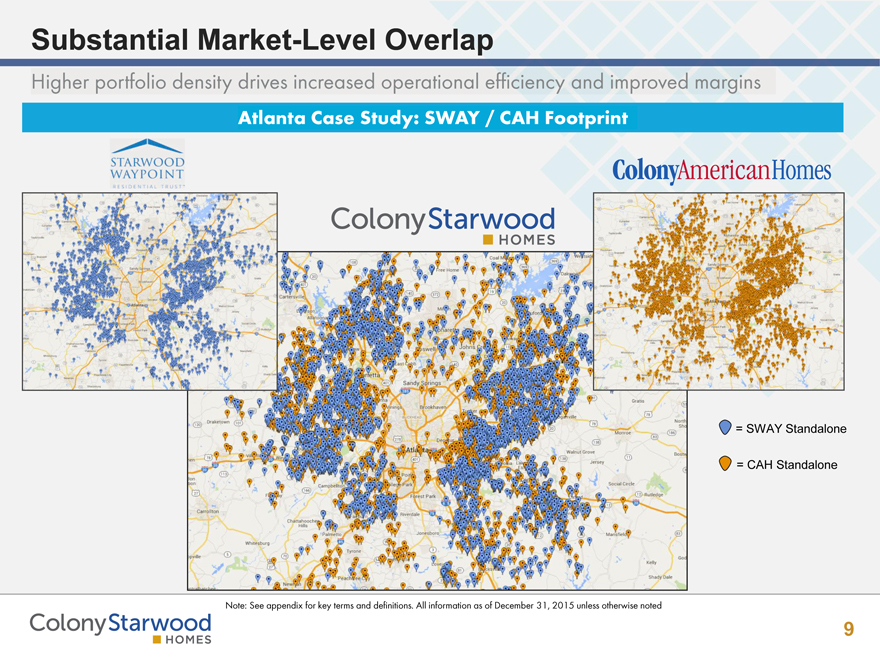
Substantial Market-Level Overlap
Higher portfolio density drives increased operational efficiency and improved margins
Atlanta Case Study: SWAY / CAH Footprint
Note: See appendix for key terms and definitions. All information as of December 31, 2015 unless otherwise noted
= SWAY Standalone
= CAH Standalone
9
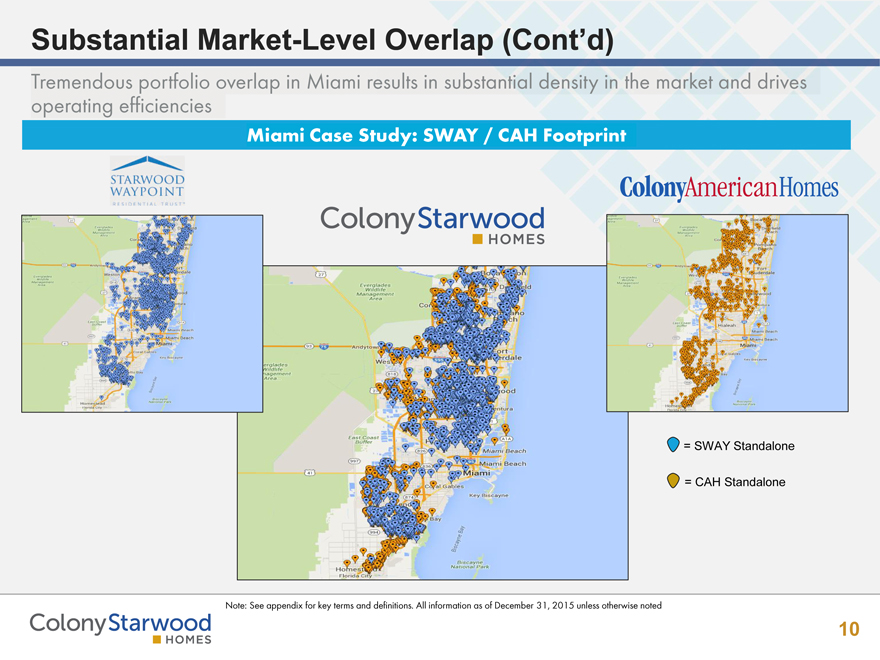
Substantial Market-Level Overlap (Cont’d)
Tremendous portfolio overlap in Miami results in substantial density in the market and drives operating efficiencies
Miami Case Study: SWAY / CAH Footprint
= SWAY Standalone
= CAH Standalone
Note: See appendix for key terms and definitions. All information as of December 31, 2015 unless otherwise noted
10
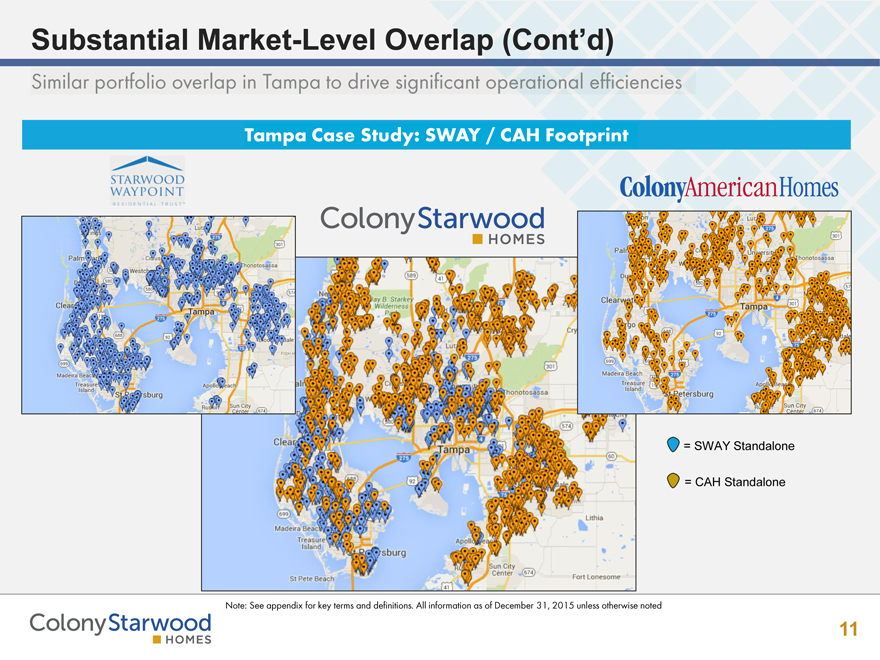
Substantial Market-Level Overlap (Cont’d)
Similar portfolio overlap in Tampa to drive significant operational efficiencies
Tampa Case Study: SWAY / CAH Footprint
= SWAY Standalone
= CAH Standalone
Note: See appendix for key terms and definitions. All information as of December 31, 2015 unless otherwise noted
ColonyStarwood
HOMES
11
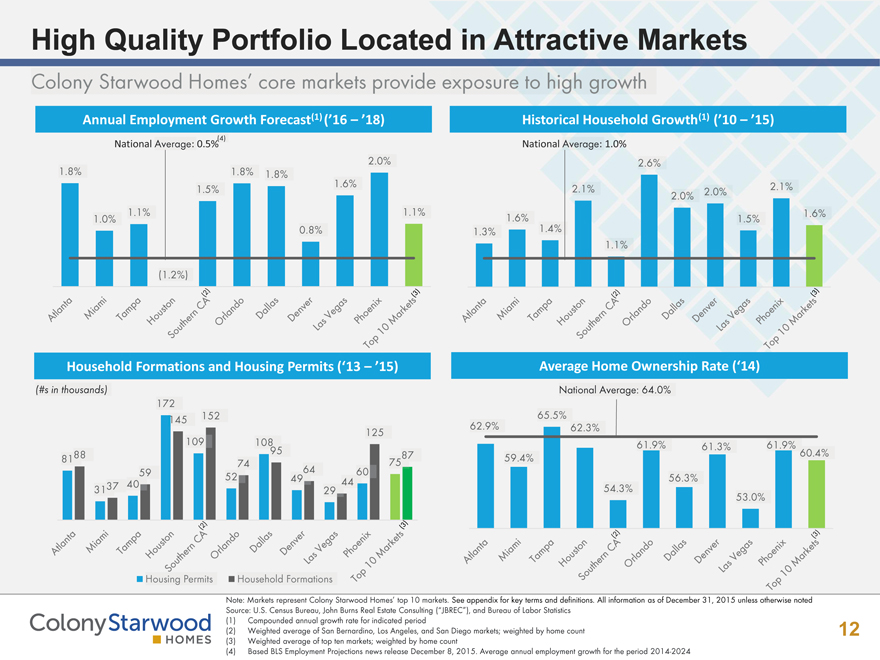
High Quality Portfolio Located in Attractive Markets
Colony Starwood Homes’ core markets provide exposure to high growth
Annual Employment Growth Forecast(1) (’16 – ’18)
National Average: 0.5% (4)
Historical Household Growth(1) (’10 – ’15)
National Average: 1.0%
1.8%
1.0%
1.1% (1.2%) 1.5% 1.8% 1.8% 0.8% 1.6% 2.0% 1.1%
Atlanta Miami Tampa Houston Southern CA(2) Orlando Dallas Denver Las Vegas Phoenix Top 10 Markets(3)
Household Formations and Housing Permits (‘13 – ’15)
(#s in thousands)
81 88 31 37 40 59 172 145 109 152 52 74 108 95 49 64 29 44 60 125 75 87
Atlanta Miami Tampa Houston Southern CA(2) Orlando Dallas Denver Las Vegas Phoenix Top 10 Markets(3)
Historical Household Growth(1) (’10 – ’15)
1.3% 1.6% 1.4% 2.1% 1.1% 2.6% 2.0% 2.0% 1.5% 2.1% 1.6%
Atlanta Miami Tampa Houston Southern CA (2) Orlanda Dallas Denver Las Vegas Phoenix Top 10 Markets (3)
Housing Permits
Household Formations
Average Home Ownership Rate (‘14)
National Average: 64.0%
62.9% 59.4% 65.5% 62.3% 54.3% 61.9% 56.3% 61.3% 53.0% 61.9% 60.4%
Atlanta Miami Tampa Houston Southern CA(2) Orlando Dallas Denver Las Vegas Phoenix Top 10 Markets(3)
Note: Markets represent Colony Starwood Homes’ top 10 markets. See appendix for key terms and definitions. All information as of December 31, 2015 unless otherwise noted
Source: U.S. Census Bureau, John Burns Real Estate Consulting (“JBREC”), and Bureau of Labor Statistics
(1) Compounded annual growth rate for indicated period
(2) Weighted average of San Bernardino, Los Angeles, and San Diego markets; weighted by home count
(3) Weighted average of top ten markets; weighted by home count
(4) Based BLS Employment Projections news release December 8, 2015. Average annual employment growth for the period 2014-2024
12
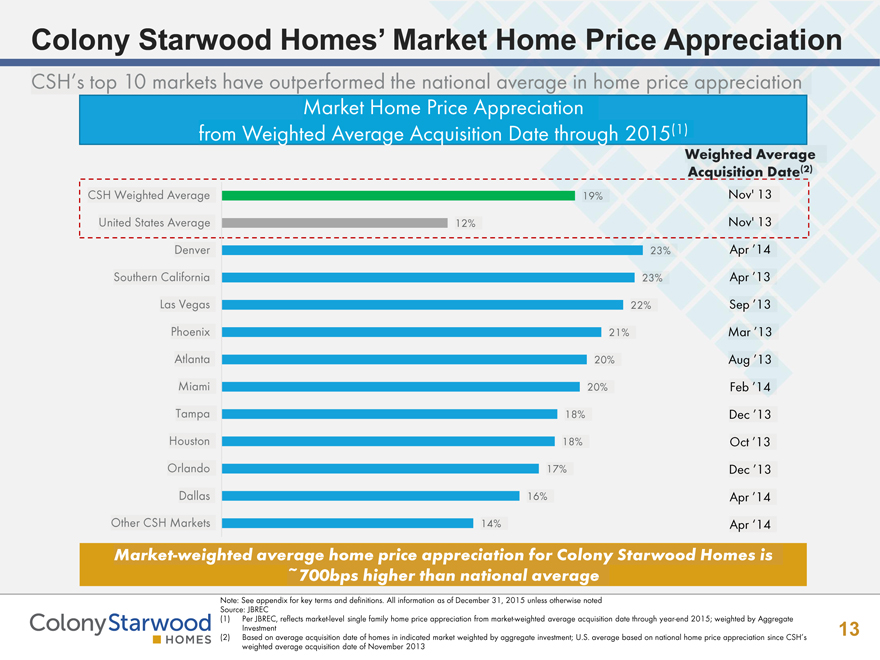
Colony Starwood Homes’ Market Home Price Appreciation
CSH’s top 10 markets have outperformed the national average in home price appreciation
Market Home Price Appreciation from Weighted Average Acquisition Date through 2015(1)
Weighted Average Acquisition Date(2)
CSH Weighted Average 19% Nov’ 13
United States Average 12% Nov’ 13
Denver
23% Apr 1 14
Southern California
Las Vegas
23%
22%
Apr’ 13
Sep’ 13
Phoenix
Atlanta
21% Mar’13
20% Aug’13
Miami
20%
Feb’14
Tampa Houston Orlando
Dallas
18% Dec’13
18% Oct’13
17% Dec’13
16% Apr’14
Other CSH Markets
14%
Apr’14
Market-weighted average home price appreciation for Colony Starwood Homes is
-700bps higher than national average
Note: See appendix for key terms and definitions. All information as of December 31, 2015 unless otherwise noted
Source: JBREC
(1) Per JBREC, reflects market-level single family home price appreciation from market-weighted average acquisition date through year-end 2015; weighted by Aggregate Investment
(2) Based on average acquisition date of homes in indicated market weighted by aggregate investment; U.S. average based on national home price appreciation since CSH’s weighted average acquisition date of November 2013
ColonyStarwood HOMES
13
Cash Flow Profile
14
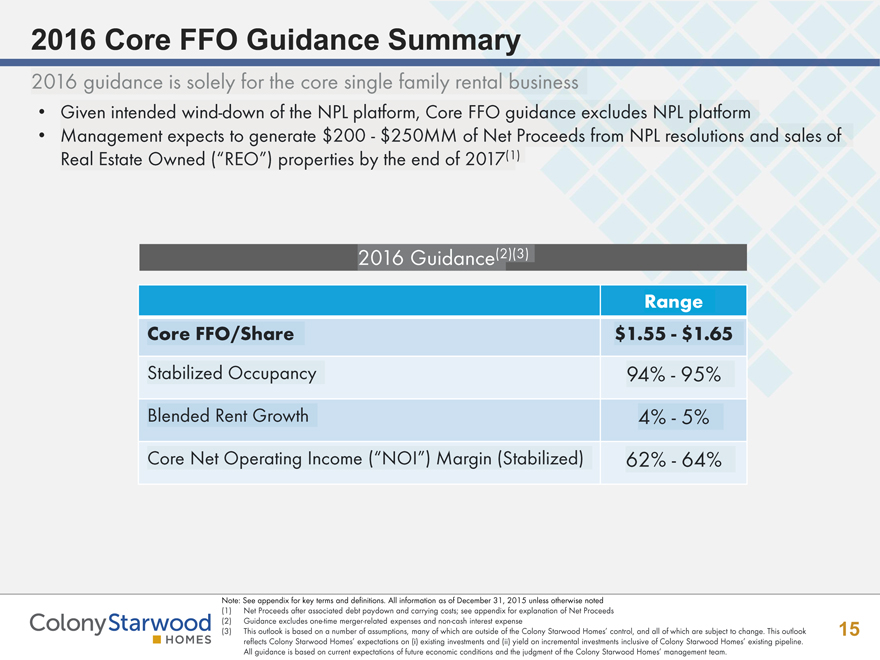
2016 Core FFO Guidance Summary
2016 guidance is solely for the core single family rental business
Given intended wind-down of the NPL platform, Core FFO guidance excludes NPL platform
Management expects to generate $200- $250MM of Net Proceeds from NPL resolutions and sales of
Real Estate Owned (“REO”) properties by the end of 2017(1)
2016 Guidance(2)(3)
Range
Core FFO/Share $1.55 - $1.65
Stabilized Occupancy 94% - 95%
Blended Rent Growth 4% - 5%
Core Net Operating Income (“NOI”) Margin (Stabilized) 62% - 64%
Note: See appendix for key terms and definitions. All information as of December 31, 2015 unless otherwise noted
(1) Net Proceeds after associated debt paydown and carrying costs; see appendix for explanation of Net Proceeds
(2) Guidance excludes one-time merger-related expenses and non-cash interest expense
(3) This outlook is based on a number of assumptions, many of which are outside of the Colony Starwood Homes’ control, and all of which are subject to change. This outlook reflects Colony Starwood Homes’ expectations on (i) existing investments and (ii) yield on incremental investments inclusive of Colony Starwood Homes’ existing pipeline. All guidance is based on current expectations of future economic conditions and the judgment of the Colony Starwood Homes’ management team.
ColonyStarwood
HOMES
15
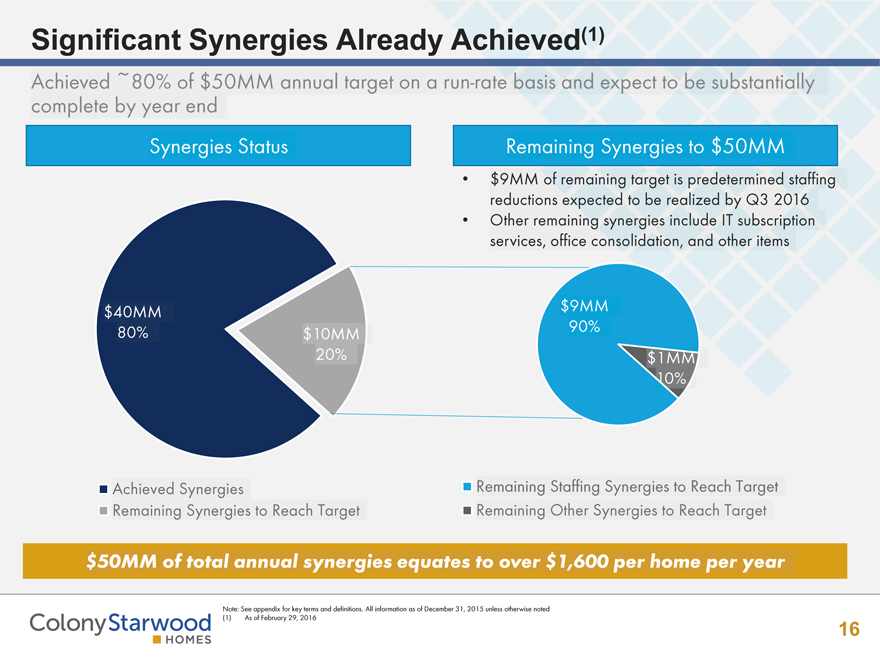
Significant Synergies Already Achieved(1)
Achieved ~80% of $50MM annual target on a run-rate basis and expect to be substantially complete by year end
Synergies Status
Remaining Synergies to $50MM
$9MM of remaining target is predetermined staffing reductions expected to be realized by Q3 2016
Other remaining synergies include IT subscription services, office consolidation, and other items
$40MM 80%
$10MM 20%
$9MM 90%
$1MM 10%
$50MM of total annual synergies equates to over $1,600 per home per year
Note: See appendix for key terms and definitions. All information as of December 31, 2015 unless otherwise noted
(1) As of February 29, 2016
Achieved Synergies
Remaining Staffing Synergies to Reach Target
Remaining Other Synergies to Reach Target
16
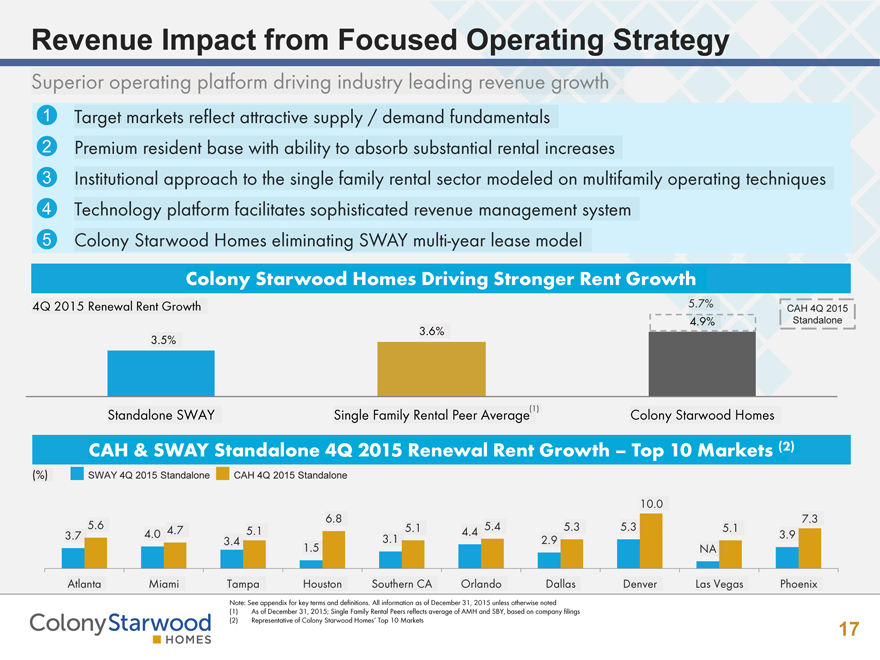
Revenue Impact from Focused Operating Strategy
Superior operating platform driving industry leading revenue growth
Target markets reflect attractive supply / demand fundamentals
Premium resident base with ability to absorb substantial rental increases
Institutional approach to the single family rental sector modeled on multifamily operating techniques
Technology platform facilitates sophisticated revenue management system
Colony Starwood Homes eliminating SWAY multi-year lease model
Colony Starwood Homes Driving Stronger Rent Growth
4Q 2015 Renewal Rent Growth
3.5% 3.6% 5.7% 4.9%
Standalone SWAY
Single Family Rental Peer Average(1)
Colony Starwood Homes
1
2
CAH & SWAY Standalone 4Q 2015 Renewal Rent Growth – Top 10 Markets (2)
3
(%) SWAY 4Q 2015 Standalone CAH 4Q 2015 Standalone
3.7 5.6 4.0 4.7 3.4 5.1 1.5 6.8 3.1 5.1 4.4 5.4 2.9 5.3 5.3 10.0 NA 5.1 3.9 7.3
4 Atlanta Miami Tampa Houston Southern CA Orlanda Dallas Denver Las Vegas Phoenix Top 10 Markets
Note: See appendix for key terms and definitions. All information as of December 31, 2015 unless otherwise noted
As of December 31, 2015; Single Family Rental Peers reflects average of AMH and SBY, based on company filings
Representative of Colony Starwood Homes’ Top 10 Markets
5
CAH 4Q 2015
Standalone
17
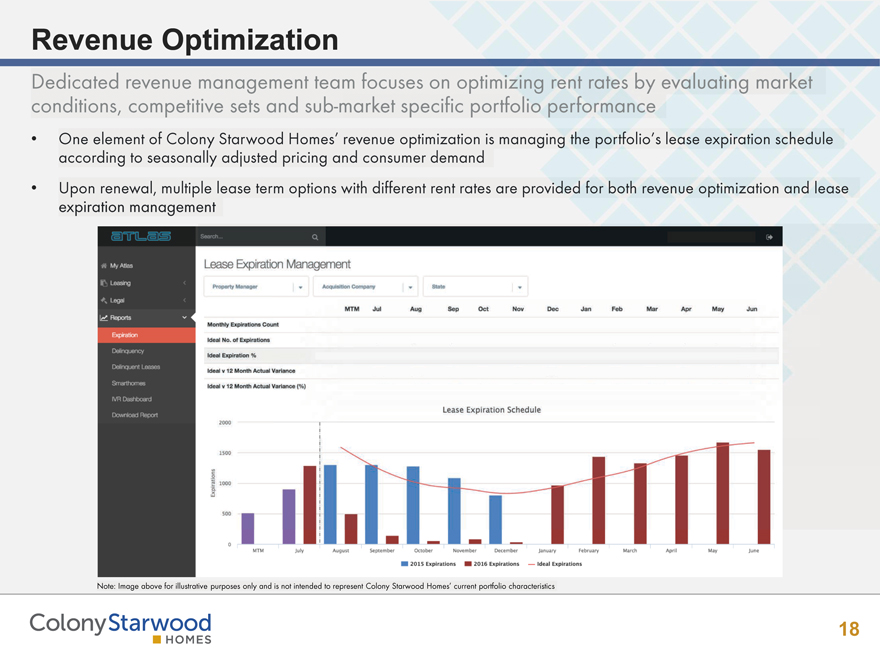
Revenue Optimization
Dedicated revenue management team focuses on optimizing rent rates by evaluating market conditions, competitive sets and sub-market specific portfolio performance
One element of Colony Starwood Homes’ revenue optimization is managing the portfolio’s lease expiration schedule according to seasonally adjusted pricing and consumer demand
Upon renewal, multiple lease term options with different rent rates are provided for both revenue optimization and lease expiration management
Lease Expiration Management
MTM Jul Aug Sep Oct Nov Dec Jan Feb Mar Apr May Jun
Monthly Expirations Count Ideal No. of Expirations Ideal Expiration %
Ideal v 12 Month Actual Variance
Ideal v 12 Month Actual Variance (%)
Lease Expiration Schedule
2000
1500
1000
500
MTM July August September October November December January February March April May June
2015
Expirations 2016 Expirations —Ideal Expirations
Note: Image above for illustrative purposes only and is not intended to represent Colony Starwood Homes’ current portfolio characteristics
ColonyStarwood 18
HOMES
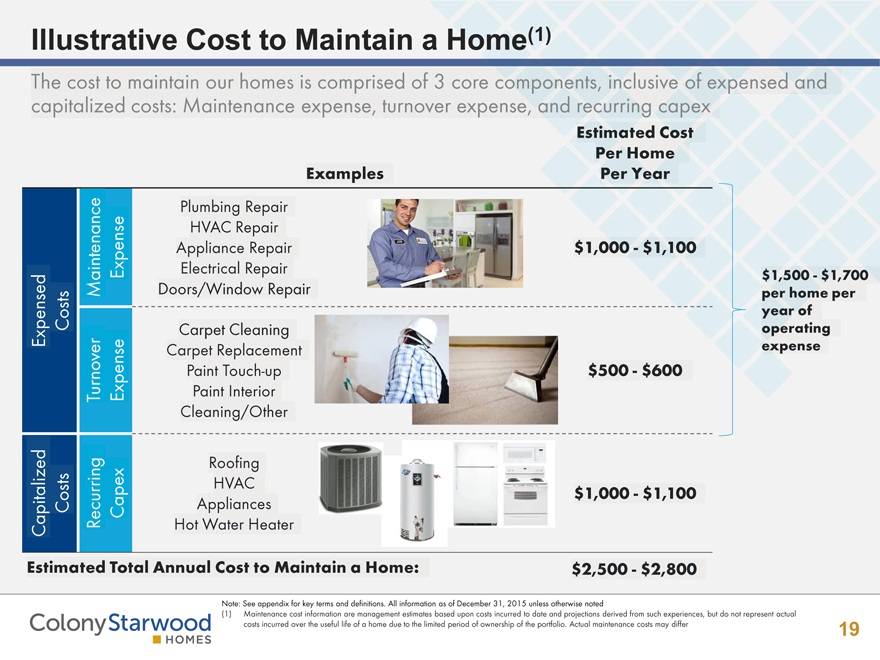
Illustrative Cost to Maintain a Home(1)
The cost to maintain our homes is comprised of 3 core components, inclusive of expensed and capitalized costs: Maintenance expense, turnover expense, and recurring capex
Examples Estimated Cost Per Home Per Year
Expensed Costs Maintenance Expense Plumbing Repair HVAC Repair Appliance Repair Electrical Repair Doors/Window Repair $1,000 - $1,100
Turnover Expense Carpet Cleaning Carpet Replacement
Paint Touch-up
Paint Interior Cleaning/Other $500 - $600
Capitalized Costs Recurring Capex Roofing HVAC
Appliances Hot Water Heater $1,000 - $1,100
Estimated Total Annual Cost to Maintain a Home:
ColonyStarwood
HOMES
Note: See appendix for key terms and definitions. All information as of December 31, 2015 unless otherwise noted
(1) Maintenance cost information are management estimates based upon costs incurred to date and projections derived from such experiences, but do not represent actual costs incurred over the useful life of a home due to the limited period of ownership of the portfolio. Actual maintenance costs may differ
19
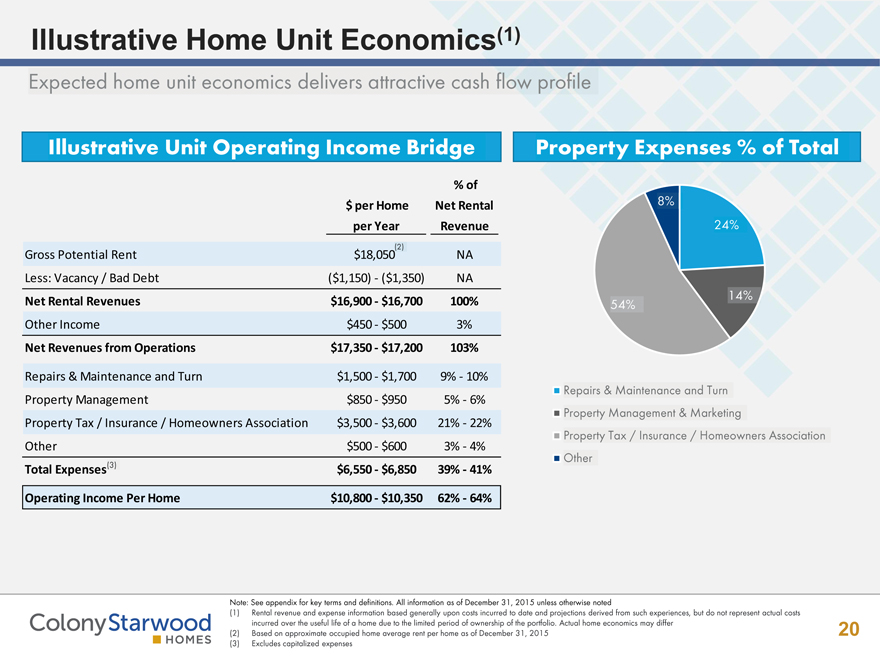
Illustrative Home Unit Economics(1)
Expected home unit economics delivers attractive cash flow profile
$ per Home
% of
Net Rental
per Year Revenue
Gross Potential Rent $18,050(2) NA
Less: Vacancy / Bad Debt ($1,150)—($1,350) NA
Net Rental Revenues $16,900—$16,700 100%
Other Income $450—$500 3%
Net Revenues from Operations $17,350—$17,200 103%
Repairs & Maintenance and Turn $1,500—$1,700 9%—10%
Property Management $850—$950 5%—6%
Property Tax / Insurance / Homeowners Association $3,500—$3,600 21%—22%
Other $500—$600 3%—4%
Total Expenses(3) $6,550—$6,850 39%—41%
Operating Income Per Home $10,800—$10,350 62%—64%
54% 8% 24% 14%
Repairs & Maintenance and Turn
Property Management & Marketing
Property Tax / Insurance / Homeowners Association
Other
Illustrative Unit Operating Income Bridge
Property Expenses % of Total
Note: See appendix for key terms and definitions. All information as of December 31, 2015 unless otherwise noted
(1) Rental revenue and expense information based generally upon costs incurred to date and projections derived from such experiences, but do not represent actual costs incurred over the useful life of a home due to the limited period of ownership of the portfolio. Actual home economics may differ
(2) Based on approximate occupied home average rent per home as of December 31, 2015
(3) Excludes capitalized expenses
20
Capital Strategy
21
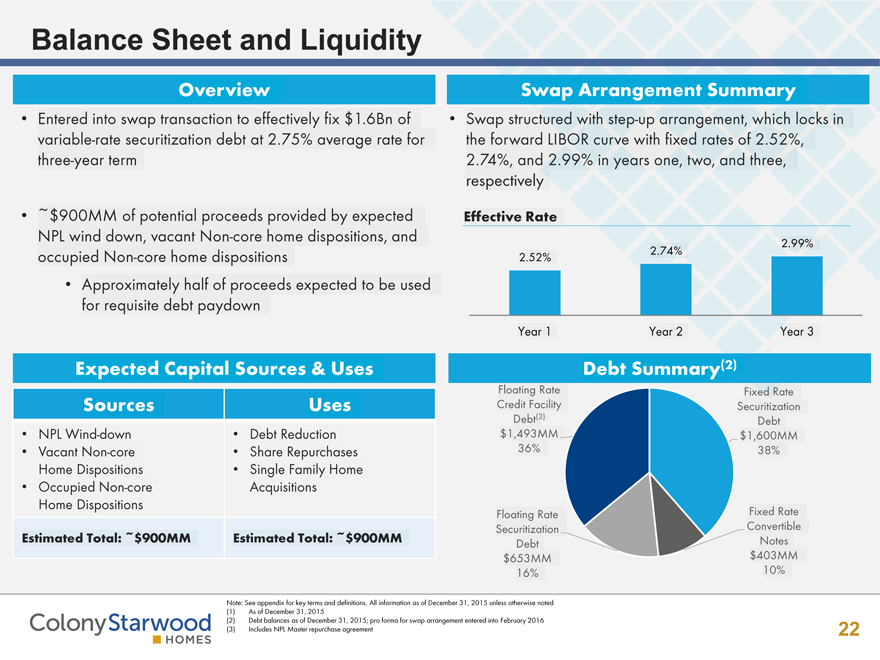
Balance Sheet and Liquidity
Entered into swap transaction to effectively fix $1.6Bn of variable-rate securitization debt at 2.75% average rate for three-year term
~$900MM of potential proceeds provided by expected NPL wind down, vacant Non-core home dispositions, and occupied Non-core home dispositions
Approximately half of proceeds expected to be used for requisite debt paydown
Swap structured with step-up arrangement, which locks in the forward LIBOR curve with fixed rates of 2.52%, 2.74%, and 2.99% in years one, two, and three, respectively
Effective Rate
2.52% 2.74% 2.99%
Year 1 Year 2 Year 3
Expected Capital Sources & Uses Swap Arrangement Summary
Sources Uses
NPL Wind-down
Vacant Non-core Home Dispositions
Occupied Non-core Home Dispositions Debt Reduction
Share Repurchases
Single Family Home Acquisitions
Estimated Total: ~$900MM Estimated Total: ~$900MM
Debt Summary(2)
Floating Rate Credit Facility Debt(3)
$1,493MM Overview
36%
Floating Rate Securitization Debt $653MM 16%
Fixed Rate Securitization Debt $1,600MM 38%
Fixed Rate Convertible Notes $403MM 10%
ColonyStarwood
HOMES
Note: See appendix for key terms and definitions. All information as of December 31, 2015 unless otherwise noted
(1) As of December 31, 2015
(2) Debt balances as of December 31, 2015; pro forma for swap arrangement entered into February 2016
(3) Includes NPL Master repurchase agreement
22
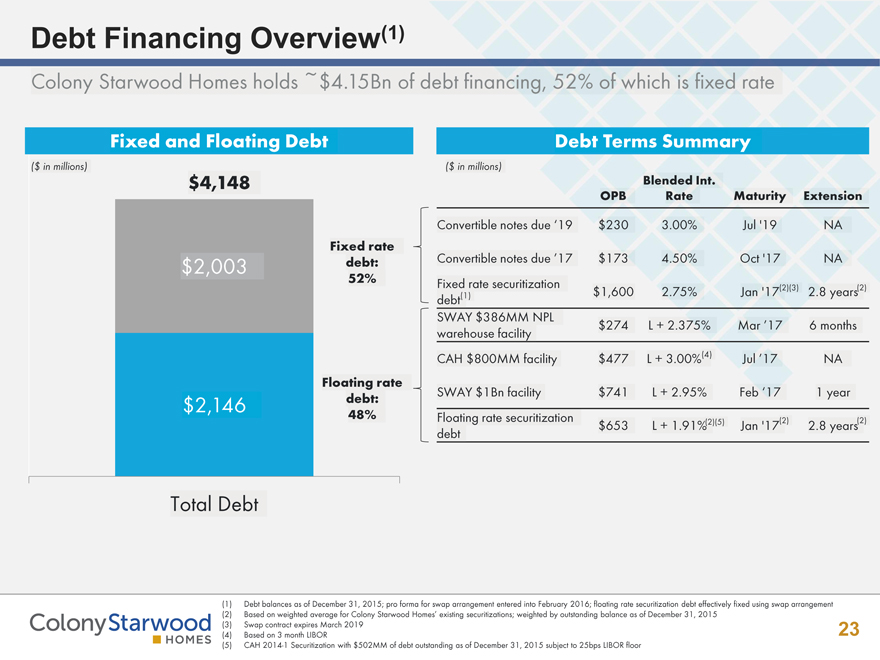
Debt Financing Overview(1)
Colony Starwood Homes holds ~$4.15Bn of debt financing, 52% of which is fixed rate
Fixed and Floating Debt
Fixed rate debt:
52%
Floating rate debt:
48%
($ in millions)
$4,148
$2,003
$2,146
OPB Blended Int. Rate Maturity Extension
Convertible notes due’19 $230 3.00% Jul’19 NA
Convertible notes due’17 $173 4.50% Oct’17 NA
Fixed rate securitization debt(1) $1,600 2.75% Jan’17 (2)(3) 2.8 years(2)
SWAY $386MM NPL warehouse facility $274 L + 2.375% Mar’17 6 months
CAH $800MM facility $477 L + 3.00%(4) Jul’17 NA
SWAY $1Bn facility $741 L + 2.95% Feb’17 1 year
Floating rate securitization debt $653 L + 1.91% Jan’17(2) 2.8 years(2)
Debt Terms Summary
(1) Debt balances as of December 31, 2015; pro forma for swap arrangement entered into February 2016; floating rate securitization debt effectively fixed using swap arrangement
(2) Based on weighted average for Colony Starwood Homes’ existing securitizations; weighted by outstanding balance as of December 31, 2015
(3) Swap contract expires March 2019
(4) Based on 3 month LIBOR
(5) CAH 2014-1 Securitization with $502MM of debt outstanding as of December 31, 2015 subject to 25bps LIBOR floor
Total Debt
ColonyStarwood
HOMES
23
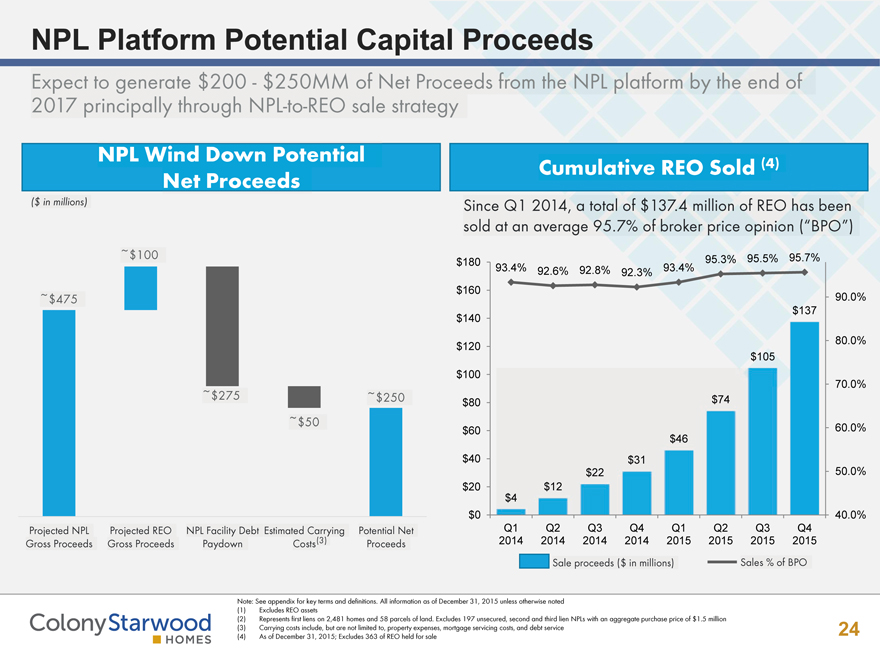
NPL Platform Potential Capital Proceeds
Expect to generate $200—$250MM of Net Proceeds from the NPL platform by the end of 2017 principally through NPL-to-REO sale strategy
NPL Wind Down Potential Net Proceeds
Cumulative REO Sold (4)
Since Q1 2014, a total of $137.4 million of REO has been sold at an average 95.7% of broker price opinion (“BPO”)
($ in millions)
~$475
~$100
~$275
~$50
~$250
Projected NPL Gross Proceeds
Projected REO Gross Proceeds
NPL Facility Debt Paydown
Estimated Carrying Costs(3)
Potential Net Proceeds
$180
$160
93.4% 92.6% 92.8% 92.3% 93.4%
95.3% 95.5% 95.7%
$137
90.0%
$120
$100
$80
$74
$105
80.0%
70.0%
$60 $140
$40
$20
$0
$4
Q1
2014
$12
Q2
2014
$22
Q3
2014
$31
Q4
2014
$46
Q1
2015
Q2
2015
Q3
2015
Q4
2015
60.0%
50.0%
40.0%
ColonyStarwood
HOMES
Note: See appendix for key terms and definitions. All information as of December 31, 2015 unless otherwise noted
(1) Excludes REO assets
(2) Represents first liens on 2,481 homes and 58 parcels of land. Excludes 197 unsecured, second and third lien NPLs with an aggregate purchase price of $1.5 million
(3) Carrying costs include, but are not limited to, property expenses, mortgage servicing costs, and debt service
(4) As of December 31, 2015; Excludes 363 of REO held for sale
24
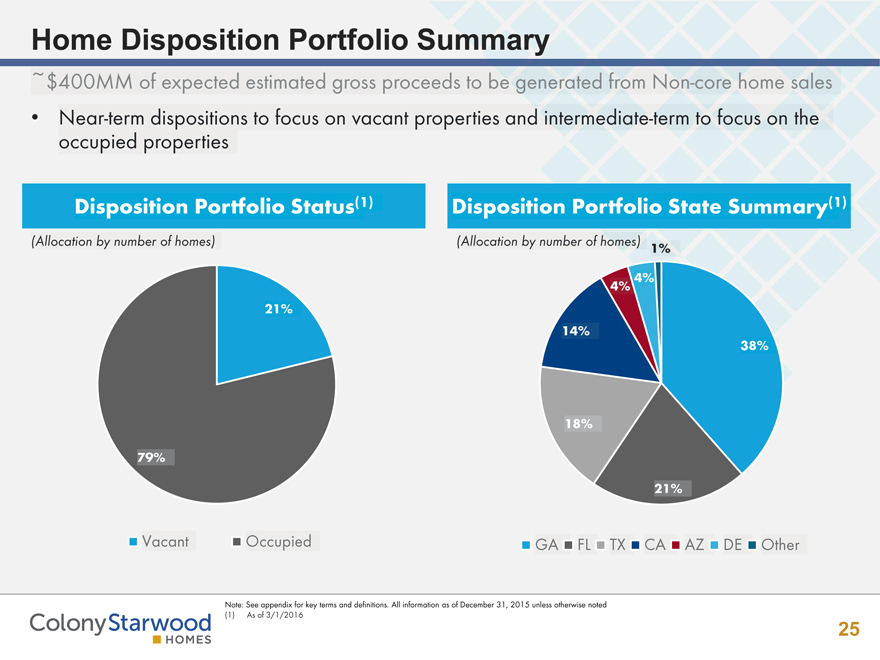
Home Disposition Portfolio Summary
~$400MM of expected estimated gross proceeds to be generated from Non-core home sales
Near-term dispositions to focus on vacant properties and intermediate-term to focus on the occupied properties
Disposition Portfolio Status(l) Disposition Portfolio State Summary(l)
(Allocation by number of homes)
(Allocation by number of homes)
21% 79%
Vacant Occupied GA FL TX CA AZ DE Other
14% 18% 4% 4% 38% 21%
ColonyStarwood
HOMES
Note: See appendix for key terms and definitions. All information as of December 31, 2015 unless otherwise noted
(1) As of 3/1/2016
25
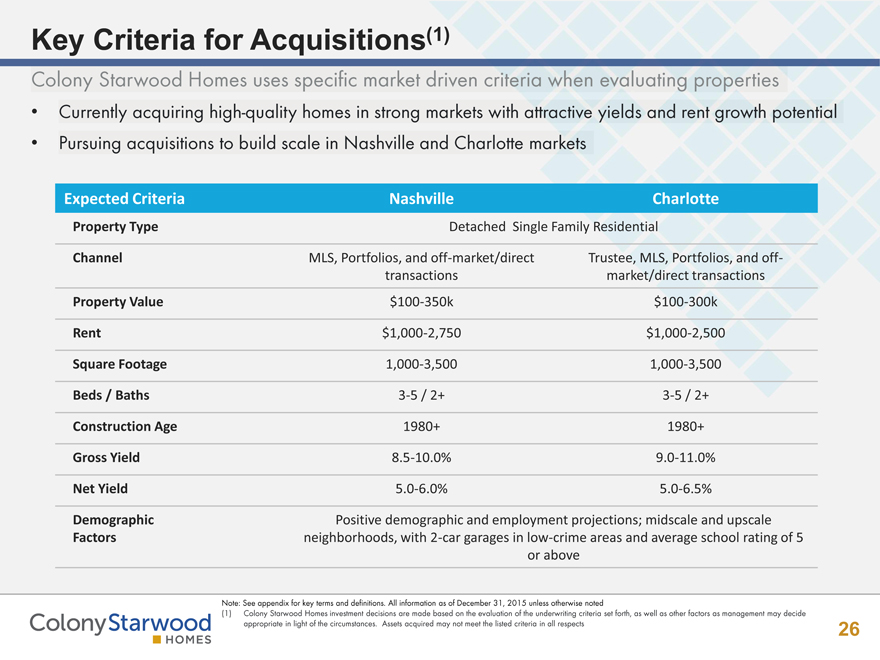
Key Criteria for Acquisitions(1)
Colony Starwood Homes uses specific market driven criteria when evaluating properties
Currently acquiring high-quality homes in strong markets with attractive yields and rent growth potential
Pursuing acquisitions to build scale in Nashville and Charlotte markets
Expected Criteria Nashville Charlotte
Property Type Detached Single Family Residential
Channel MLS, Portfolios, and off-market/direct transactions
Trustee, MLS, Portfolios, and off-market/direct transactions
Property Value $100-350k $100-300k
Rent $1,000-2,750 $1,000-2,500
Square Footage 1,000-3,500 1,000-3,500
Beds / Baths 3-5 / 2+ 3-5 / 2+ Construction Age 1980+ 1980+ Gross Yield 8.5-10.0% 9.0-11.0%
Net Yield 5.0-6.0% 5.0-6.5%
Demographic
Factors
Positive demographic and employment projections; midscale and upscale neighborhoods, with 2-car garages in low-crime areas and average school rating of 5 or above
ColonyStarwood
HOMES
Note: See appendix for key terms and definitions. All information as of December 31, 2015 unless otherwise noted
(1) Colony Starwood Homes investment decisions are made based on the evaluation of the underwriting criteria set forth, as well as other factors as management may decide appropriate in light of the circumstances. Assets acquired may not meet the listed criteria in all respects
26
Technology Overview
27
Atlas Technology Platform
Colony Starwood Homes’ technology platform, Atlas, is revolutionizing the Single Family industry by enabling employees, engaging residents, and rewarding shareholders
Revenue Management (maximization)
Automated workflows
Custom iPad App
Seamless online rent collection
Service portal with detailed self help videos
Custom iPad App
SKU level integration
Smart home system controls vendor access and utility management
Self Guided Tour
Mobile enabled application and Lease
Industry leading Yardi integration
Proprietary Neighborhood Score
Deal Flow and Closing Management
Renewal or Turn
Acquisition
Renovation
Management
Leasing
Note: See appendix for key terms and definitions. All information as of December 31, 2015 unless otherwise noted
28
Appendix
29
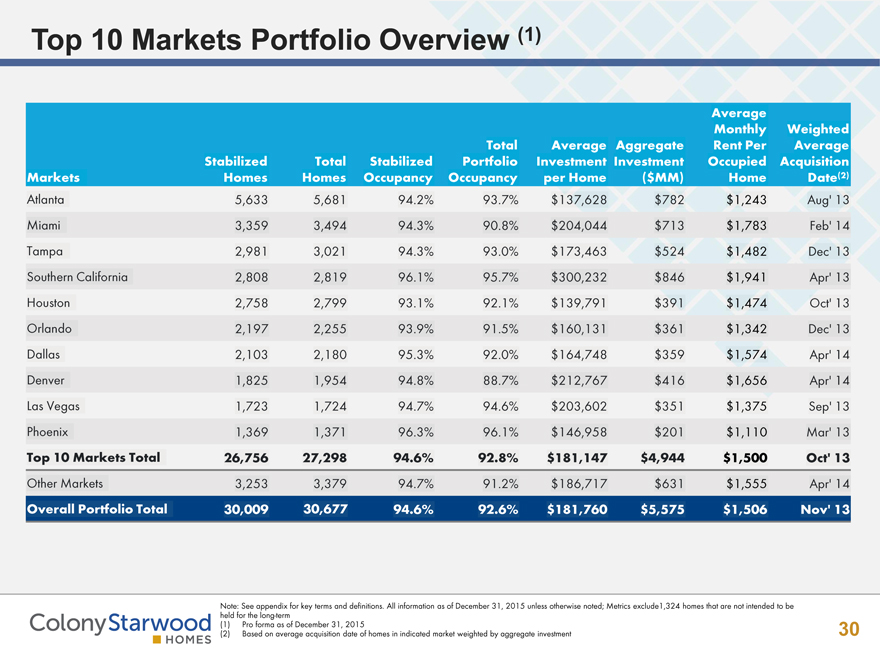
Top 10 Markets Portfolio Overview ( 1)
Average
Monthly Weighted
Total Average Aggregate Rent Per Average
Stabilized Total Stabilized Portfolio Investment Investment Occupied Acquisition
Markets Homes Homes Occupancy Occupancy per Home($MM) Home Date(2)
Atlanta
5,633
5,681
94.2%
93.7%
$1 37,628
$782
$1,243
Aug’ 13
Miami
3,359
3,494
94.3%
90.8%
$204,044
$713
$1,783
Feb’ 14
Tampa 2,981 3,021 94.3% 93.0% $1 73,463 $524 $1,482 Dec’ 13
Southern California
2,808
2,819
96.1%
95.7%
$300,232
$846
$1,941
Apr’ 13
Houston 2,758 2,799 93.1% 92.1% $139,791 $391 $1,474 Oct’ 13
Orlando
2,197
2,255
93.9%
91.5%
$1 60,131
$361
$1,342
Dec’ 13
Dallas 2,103 2,180 95.3% 92.0% $1 64,748 $359 $1,574 Apr’ 14
Denver
1,825
1,954
94.8%
88.7%
$212,767
$416
$1,656
Apr’ 14
Las Vegas 1,723 1,724 94.7% 94.6% $203,602 $351 $1,375 Sep’ 13
Phoenix 1,369
1,371 96.3% 96.1%
$146,958
$201
$1,110
Mar’ 13
Top 10 Markets Total 26,756 27,298 94.6% 92.8% $181,147 $4,944 $1,500 Oct’ 13
Other Markets 3,253 3,379 94.7% 91.2% $186,717 $631 $1,555 Apr’ 14
Overall Portfolio Total 30,009 30,677 94.6% 92.6% $181,760 $5,575 $1,506 Nov’ 13
Note: See appendix for key terms and definitions. All information as of December 31, 2015 unless otherwise noted; Metrics exclude1,324 homes that are not intended to be held for the long-term
(1) Pro forma as of December 31, 2015
(2) Based on average acquisition date of homes in indicated market weighted by aggregate investment
ColonyStarwood
HOMES
30
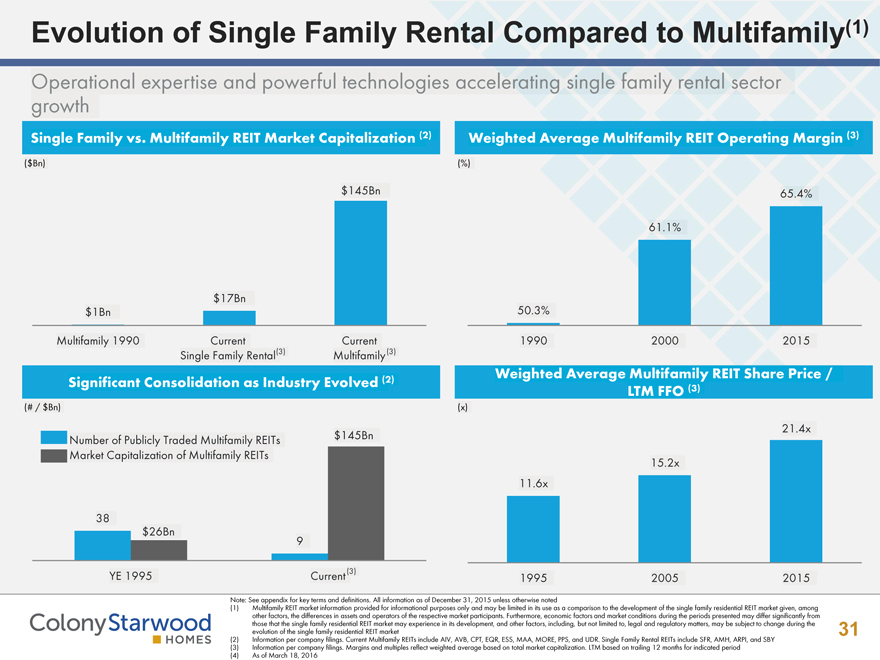
Evolution of Single Family Rental Compared to Multifamily(1)
Operational expertise and powerful technologies accelerating single family rental sector growth
Single Family vs.Multifamily REIT Market Capitalization (2)
($Bn)
Weighted Average Multifamily REIT Operating Margin (3)
(%)
$145Bn 65.4%
61.1%
$1Bn
$17Bn
50.3%
Multifamily 1990 Current
Single Family Rental (3)
Current
Multifamily(3)
1990 2000 2015
(# / $Bn)
Significant Consolidation as Industry Evolved (2)
Weighted Average Multifamily REIT Share Price
LTM FFO(3)
(x)
- Number of Publicly Traded Multifamily REITs
- Market Capitalization of Multifamily REITs
38
9
$26Bn
$145Bn
11.6x
15.2x
21.4x
YE 1995
Note: See appendix for key terms and definitions. All information as of December 31, 2015 unless otherwise noted
(1) Multifamily REIT market information provided for informational purposes only and may be limited in its use as a comparison to the development of the single family residential REIT market given, among other factors, the differences in assets and operators of the respective market participants. Furthermore, economic factors and market conditions during the periods presented may differ significantly from those that the single family residential REIT market may experience in its development, and other factors, including, but not limited to, legal and regulatory matters, may be subject to change during the evolution of the single family residential REIT market
(2) Information per company filings. Current Multifamily REITs include AIV, AVB, CPT, EQR, ESS, MAA, MORE, PPS, and UDR. Single Family Rental REITs include SFR, AMH, ARPI, and SBY
(3) Information per company filings. Margins and multiples reflect weighted average based on total market capitalization. LTM based on trailing 12 months for indicated period
(4) As of March 18, 2016
Current (3) 1995 2005 2015
ColonyStarwood
HOMES
31
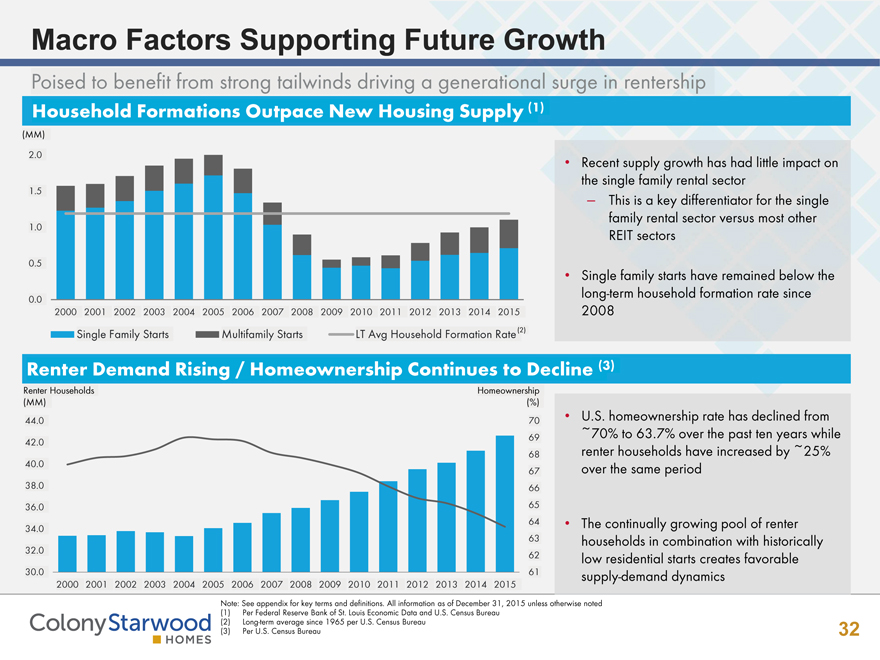
Macro Factors Supporting Future Growth
Poised to benefit from strong tailwinds driving a generational surge in rentership
Household Formations Outpace New Housing Supply (1)
Recent supply growth has had little impact on the single family rental sector
This is a key differentiator for the single family rental sector versus most other REIT sectors
Single family starts have remained below the long-term household formation rate since 2008
U.S. homeownership rate has declined from ~70% to 63.7% over the past ten years while renter households have increased by ~25% over the same period
The continually growing pool of renter households in combination with historically low residential starts creates favorable supply-demand dynamics
Renter Demand Rising / Homeownership Continues to Decline (3)
2001 2000 2002 2003 2004 2005 2006 2007 2008 2009 2010 2011 2012 2013 2014 2015
2001 2000 2002 2003 2004 2005 2006 2007 2008 2009 2010 2011 2012 2013 2014 2015
(MM) 0.0 0.5 1.0 1.5 2.0
30.0 32.0 34.0 36.0 38.0 40.0 42.0 44.0
Renter Households
(MM)
ColonyStarwood
HOMES
Single Family Starts Multifamily Starts LT Avg Household Formation Rate(2)
61 62 63 64 65 66 67 68 69 70 (%) Homeownership
Note: See appendix for key terms and definitions. All information as of December 31, 2015 unless otherwise noted
(1) Per Federal Reserve Bank of St. Louis Economic Data and U.S. Census Bureau
(2) Long-term average since 1965 per U.S. Census Bureau
(3) Per U.S. Census Bureau
32
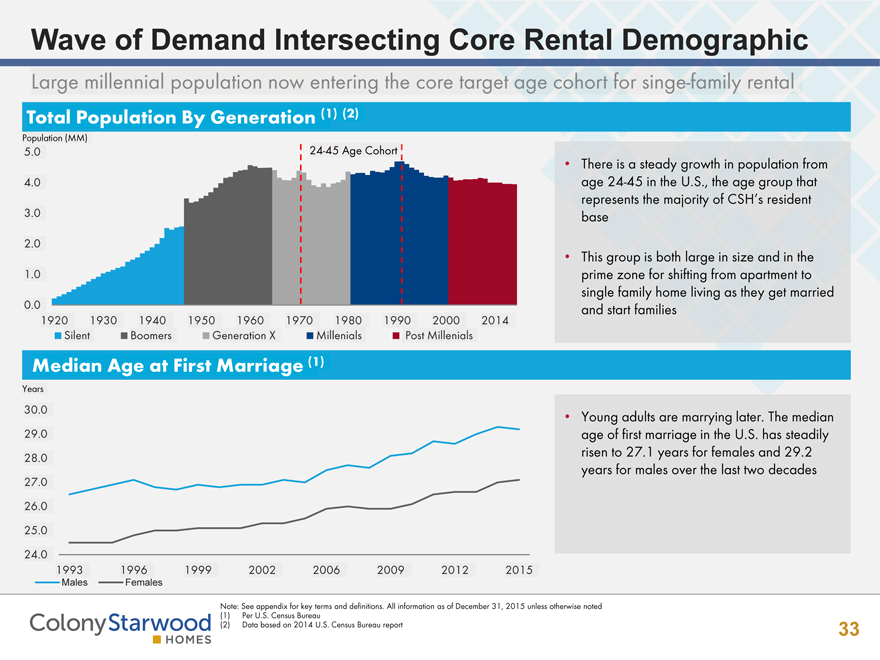
Wave of Demand Intersecting Core Rental Demographic
Large millennial population now entering the core target age cohort for singe-family rental
Population (MM)
0.0 1.0 2.0 3.0 4.0 5.0
1920 1930 1940 1950 1960 1970 1980 1990 2000 2014
Silent Boomers Generation X Millenials Post Millenials
Years 24.0 25.0 26.0 27.0 28.0 29.0 30.0
1993 1996 1999 2002 2006 2009 2012 2015
Males Females
Total Population By Generation (1) (2)
There is a steady growth in population from age 24-45 in the U.S., the age group that represents the majority of CSH’s resident base
This group is both large in size and in the prime zone for shifting from apartment to single family home living as they get married and start families
Median Age at First Marriage (1)
Young adults are marrying later. The median age of first marriage in the U.S. has steadily risen to 27.1 years for females and 29.2 years for males over the last two decades
ColonyStarwood
HOMES
Note: See appendix for key terms and definitions. All information as of December 31, 2015 unless otherwise noted
(1) Per U.S. Census Bureau
(2) Data based on 2014 U.S. Census Bureau report
33
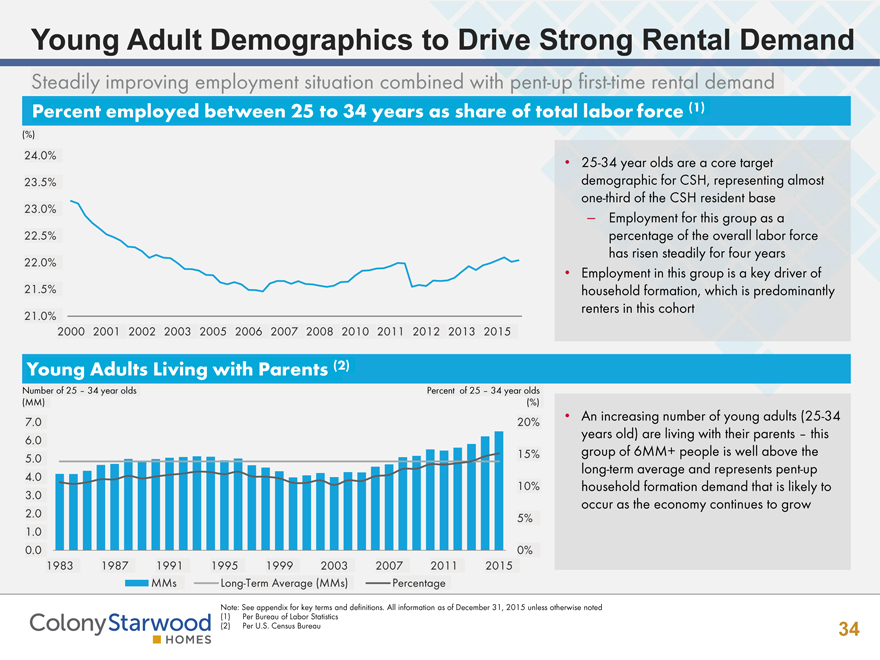
Young Adult Demographics to Drive Strong Rental Demand
Steadily improving employment situation combined with pent-up first-time rental demand
25-34 year olds are a core target demographic for CSH, representing almost one-third of the CSH resident base
Employment for this group as a percentage of the overall labor force has risen steadily for four years
Employment in this group is a key driver of household formation, which is predominantly renters in this cohort
An increasing number of young adults (25-34 years old) are living with their parents – this group of 6MM+ people is well above the long-term average and represents pent-up household formation demand that is likely to occur as the economy continues to grow
Number of 25 – 34 year olds (MM)
(%)
24.0%
23.5% 23.0% 22.5% 22.0% 21.5% 21.0%
2001 2000 2002 2003 2004 2005 2006 2007 2008 2009 2010 2011 2012 2013 2014 2015
Percent of 25 – 34 year olds
(%)
0% 5% 10% 15% 20%
0.0 1.0 2.0 3.0 4.0 5.0 6.0 7.0
MMs Long-Term Average (MMs) Percentage
Note: See appendix for key terms and definitions. All information as of December 31, 2015 unless otherwise noted
(1) Per Bureau of Labor Statistics
(2) Per U.S. Census Bureau
ColonyStarwood
HOMES
34
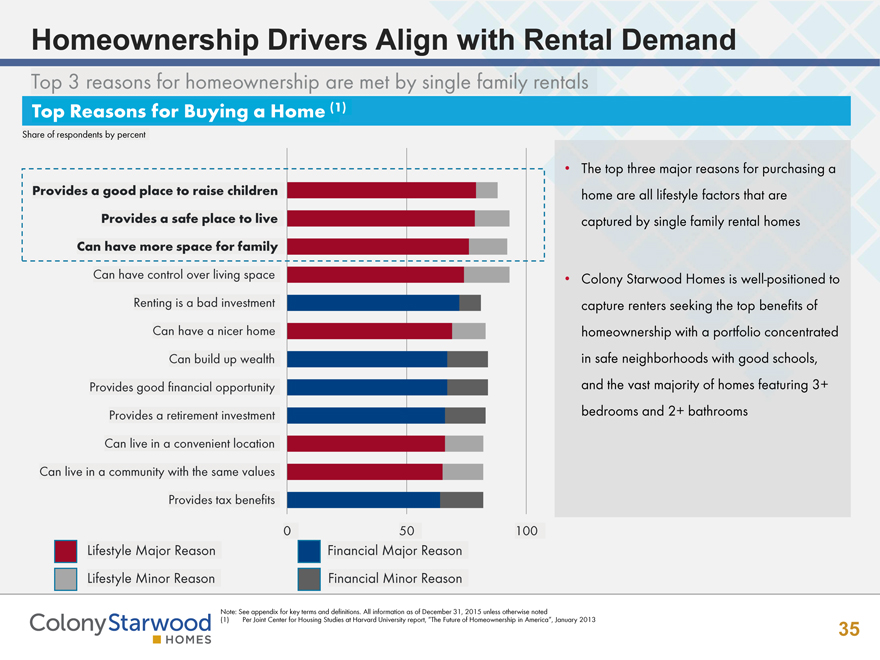
Homeownership Drivers Align with Rental Demand
Top 3 reasons for homeownership are met by single family rentals
Top Reasons for Buying a Home (1) Provides a good place to raise children
Provides a safe place to live
Can have more space for family
Share of respondents by percent
The top three major reasons for purchasing a home are all lifestyle factors that are captured by single family rental homes
Colony Starwood Homes is well-positioned to capture renters seeking the top benefits of homeownership with a portfolio concentrated in safe neighborhoods with good schools, and the vast majority of homes featuring 3+ bedrooms and 2+ bathrooms
Lifestyle Major Reason
Lifestyle Minor Reason
Financial Major Reason
Financial Minor Reason
Provides a retirement investment
Provides good financial opportunity
Can build up wealth
Can have a nicer home
Renting is a bad investment
Can have control over living space
Provides tax benefits
Can live in a community with the same values
Can live in a convenient location
Note: See appendix for key terms and definitions. All information as of December 31, 2015 unless otherwise noted
(1) Per Joint Center for Housing Studies at Harvard University report, “The Future of Homeownership in America”, January 2013
ColonyStarwood
HOMES
35
Key Terms and Definitions
Aggregate Investment. Includes acquisition costs and actual renovation costs for Total Homes. Actual renovation costs may exceed estimated renovation costs, and Colony Starwood Homes may acquire homes in the future with different characteristics that result in higher renovation costs
Average Investment per Home. Represents Aggregate Investment divided by Total Homes
Average Monthly Rent per Occupied Home. Represents average monthly contractual cash rent for occupied properties. Average monthly cash rent is presented before rent concessions and incentives. To date, rent concessions and incentives have been utilized on a limited basis and have not had a significant impact on the Colony Starwood Homes portfolio’s average monthly rent. Excludes 1 ,324 homes not intended to be held for the long term Blended Rent Growth. Represents weighted average rent growth on all new leases and renewals for the three month period ended December 31,
2015
Gross Yield. Represents estimated annual potential rent as a percentage of estimated total cost basis, inclusive of purchase price, estimated rehab costs and additional capitalized costs related to the acquisition
Net Proceeds from the NPL platform. Based on estimated total sale proceeds from NPL and REO assets net of associated debt paydown and
carrying costs, assuming management pursues strategy to convert NPL assets to REO and subsequently sells the REO assets
Net Yield. Represents estimated NOI as a percentage of estimated total cost basis, inclusive of purchase price, estimated rehab costs and additional capitalized costs related to the acquisition. NOI is based on estimated annual rental payments less estimated vacancy, bad debt and property operating costs based on actual performance for similar assets in the same markets and using actual numbers where available for HOA fees, insurance and real estate taxes. Property operating costs exclude any additional capex reserves
Non-core assets. Represents homes that have been identified as not meeting Colony Starwood Homes’ long term strategy due to locations
characterized by lower demographic data, distance to primary portfolio concentration, or have experienced suboptimal operational performance Occupancy. Represents number of homes occupied as of the last day of the period, divided by total homes. Excludes 1,324 homes not intended to be held for the long term
Renewal Rent Growth. Represents average rent growth on renewals for the three month period ended December 31, 2015, defined as average of
the percentage change in rental rate for all lease renewals in the period
Retention. Resident retention for the quarter ended December 31, 2015 defined as the number of retained residents with lease expirations as a percentage of total lease expirations in the period
Stabilizied Homes. Homes that are currently occupied or have been occupied in prior periods. Excludes 1,324 homes not intended to be held for the
long term
Stabilizied Occupancy. Represents number of homes occupied as of the last day of the period divided by Stabilized homes. Excludes 1,324 homes not intended to be held for the long term
Synergies. Expected synergies of ~$50MM are inclusive of elimination of external management fee due to internalization, net of expenses and exclude any potential CA Prop.13 tax impact and one-time expenses such as severance, office lease termination cost, etc.
Top 10 Markets. Refers to Colony Starwood Homes ten markets with the greatest number of homes as December 31, 2015, pro forma for the
SWAY/CAH merger combination
Total Homes. Homes are measured by the number of rental units. This takes into account investments in multi-unit properties and, Management believes, provides a more meaningful measure to investors. Excludes 1,324 homes not intended to be held for the long term
ColonyStarwood 36
HOMES
Key Terms and Definitions (Cont’d)
NAREIT FFO and Core FFO. FFO is used by industry analysts and investors as a supplemental performance measure of an equity REIT. FFO is defined by the National Association of Real Estate Investment Trusts (“NAREIT”) (“NAREIT FFO”) as net income or loss (computed in accordance with GAAP) excluding gains or losses from sales of previously depreciated real estate assets, plus depreciation and amortization of real estate assets and adjustments for unconsolidated partnerships and joint ventures. Core FFO begins with NAREIT FFO as defined by the NAREIT White Paper, and is adjusted for: revenues and expenses related to NPL segment, share-based compensation, non-recurring costs, transaction-related expenses, acquisition
fees and other expenses, write-off of loan costs, loss on derivative financial instruments, amortization of derivative financial instruments cost, severance
expense, non-cash interest expense and other non-comparable items, as applicable. NAREIT FFO and Core FFO do not represent net income or cash flows from operations as defined by GAAP and are not intended to indicate whether cash flows will be sufficient to fund cash needs. They should not be considered an alternative to net income as an indicator of the REIT’s operating performance or to cash flows as a measure of liquidity. Colony Starwood Homes’ NAREIT FFO and Core FFO may not be comparable to the NAREIT FFO of other REITs due to the fact that not all REITs use the NAREIT or
similar Core FFO definition.
ColonyStarwood 37
HOMES