| OMB APPROVAL |
OMB Number: 3235-0570
Expires: August 31, 2020
Estimated average burden hours per response: 20.6 |
UNITED STATES
SECURITIES AND EXCHANGE COMMISSION
Washington, D.C. 20549
FORM N-CSR
CERTIFIED SHAREHOLDER REPORT OF REGISTERED MANAGEMENT
INVESTMENT COMPANIES
| Investment Company Act file number | 811-22858 |
| WST Investment Trust |
| (Exact name of registrant as specified in charter) |
| 150 W. Main Street, Suite 1700 Norfolk, VA | 23510-1666 |
| (Address of principal executive offices) | (Zip code) |
Simon H. Berry
| Ultimus Fund Solutions, LLC 225 Pictoria Drive, Suite 450 Cincinnati, Ohio 45246 |
| (Name and address of agent for service) |
| Registrant's telephone number, including area code: | (866) 515-4626 |
| Date of fiscal year end: | August 31 | |
| Date of reporting period: | August 31, 2019 |
Form N-CSR is to be used by management investment companies to file reports with the Commission not later than 10 days after the transmission to stockholders of any report that is required to be transmitted to stockholders under Rule 30e-1 under the Investment Company Act of 1940 (17 CFR 270.30e-1). The Commission may use the information provided on Form N-CSR in its regulatory, disclosure review, inspection, and policymaking roles.
A registrant is required to disclose the information specified by Form N-CSR, and the Commission will make this information public. A registrant is not required to respond to the collection of information contained in Form N-CSR unless the Form displays a currently valid Office of Management and Budget (“OMB”) control number. Please direct comments concerning the accuracy of the information collection burden estimate and any suggestions for reducing the burden to Secretary, Securities and Exchange Commission, 450 Fifth Street, NW, Washington, DC 20549-0609. The OMB has reviewed this collection of information under the clearance requirements of 44 U.S.C. § 3507.
| Item 1. | Reports to Stockholders. |

WST INVESTMENT TRUST
WSTCM SECTOR SELECT
RISK-MANAGED FUND
WSTCM CREDIT SELECT
RISK-MANAGED FUND
Annual Report
August 31, 2019
Investment Adviser | Administrator |
Beginning on January 1, 2021, as permitted by regulations adopted by the U.S. Securities and Exchange Commission, paper copies of the Funds’ shareholder reports like this one will no longer be sent by mail, unless you specifically request paper copies of the reports from the Funds or from your financial intermediary, such as a broker-dealer or bank. Instead, the reports will be made available on a website, and you will be notified by mail each time a report is posted and provided with a website link to access the report.
If you have already elected to receive shareholder reports electronically, you will not be affected by this change and you need not take any action. You may elect to receive shareholder reports and other communications from the Funds electronically by contacting the Funds at 1-866-515-4626 or, if you own these shares through a financial intermediary, by contacting your financial intermediary.
You may elect to receive all future reports in paper free of charge. You can inform the Funds that you wish to continue receiving paper copies of your shareholder reports by contacting the Funds at 1-866-515-4626. If you own shares through a financial intermediary, you may contact your financial intermediary or follow instructions included with this document to elect to continue to receive paper copies of your shareholder reports. Your election to receive reports in paper will apply to all Funds held with the Fund complex or at your financial intermediary.
WST INVESTMENT TRUST | October 5, 2019 |
Dear Shareholder:
Thank you for being a shareholder of WST Investment Trust Funds. WST Capital Management (“WST” or “Advisor”) values your investment in the Funds and your trust in our strategies. The one-year period ended August 31, 2019 can be understood as driven by two themes: the US-China trade conflict and global monetary policy pivots led primarily by the U.S. Federal Reserve. We consider the official “start” to the U.S. China trade conflict as March 23, 2018, when the U.S. levied a 25% tariff on Chinese steel imports and a 10% tariff on Chinese aluminum imports, touching off a still-growing, still-unresolved spate of tariffs on each side. This move occurred one day after the March 22, 2018, 25-basis point increase by the U.S. Federal Reserve (“Fed”) to the Fed Funds Rate, followed by subsequent 25-basis point hikes in June, September and December 2018. These policy shifts - in combination with concerns about the resiliency of the U.S. economy amid slowing/desynchronizing global growth – contributed to the severe risk-asset sell-off that occurred throughout the last months of calendar year 2018. Risk-asset markets reversed abruptly, to the upside, in the opening days of 2019, as Fed Chairman Jerome Powell telegraphed the Fed’s intention to remain “patient” and responsive to economic conditions in defining rate policy. Even as trade tensions escalated, markets appeared satisfied with the ability of the Fed to course-correct economic slowing through dovish policy. In July 2019, “patient” policy turned proactive and the Fed enacted its first rate cut (25 basis points) in eleven years.
Given defensive rotations and consistent with risk-managed design, the Funds weathered the October to December 2018 correction with favorable relative results (i.e., experiencing less severe losses than their benchmarks) but defensive positioning resulted in a substantial relative performance lag during the rapid market recovery in the first few months of calendar year 2019. The Funds have been unable to recoup relative performance after missing the early 2019 rally, but we remain focused on the potential for risk-managed investing to add value in increasingly volatile markets.
The WSTCM Sector Select Risk-Managed Fund’s (the “Sector Fund”) investment process is based on a proprietary quantitative model designed to make investment decisions and allocate investments among the various primary sectors of the S&P 500® Index (“Sector Investments”), fixed income securities (“Fixed Income Investments”) and gold-related securities (“Gold Investments”).
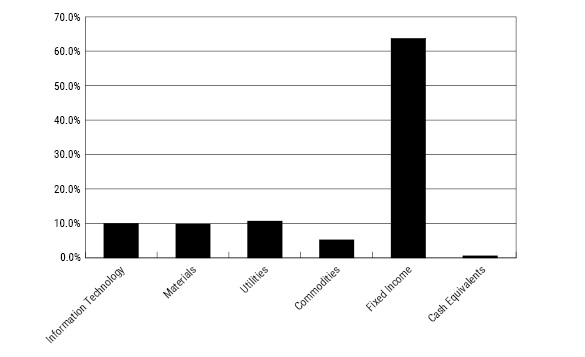
As of August 31, 2019, the Sector Fund had net assets of $16.42 million, and was allocated 30% to Sector Investments, 64% to Fixed Income Investments, 5% to Gold Investments and 1% to cash equivalents.
The Sector Investments are managed to provide systematic exposures to sectors that share the common characteristic of positive momentum. For example, a sector is considered to have positive momentum if it has performed well in the prior twelve months relative to other sectors in the Fund’s investment universe. The Fund’s Sector Investments
1
universe consists of the primary sectors1 of the S&P 500® Index (i.e. consumer discretionary, consumer staples, energy, financials, health care, industrials, information technology, materials and utilities).
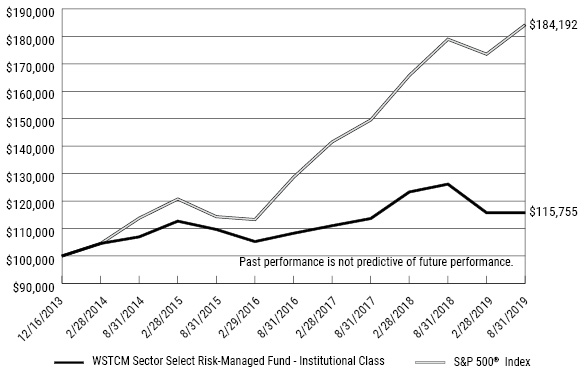
For the twelve-month period ended August 31, 2019, the Institutional Shares of the Sector Fund had a total return of -8.26%. During this time, the S&P® 500 Index gained 2.92%.
The WSTCM Credit Select Risk-Managed Fund’s (the “Credit Fund”) investment process allocates assets between high-yield securities and investment grade securities using a proprietary quantitative model. This strategy employs a combination of short-, intermediate-, and long-term trend-following techniques to identify periods of favorable or unfavorable market conditions for high-yield and investment grade securities. In allocating portfolio investments between high-yield securities and investment grade securities including floating-rate funds, WST may consider multiple factors, including those related to credit, duration, Federal Reserve policy and its expectations for the future course of interest rates and the then-prevailing price and yield levels in the debt market. WST selects securities for their potential for interest income, capital appreciation, or both.
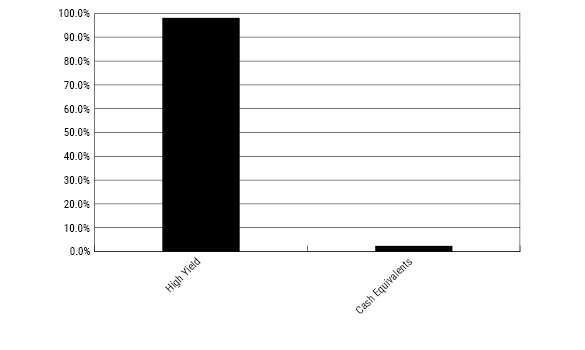
As of August 31, 2019, the Credit Fund had net assets of $54.62 million, allocated 98% to high-yield securities and 2% to cash equivalents.
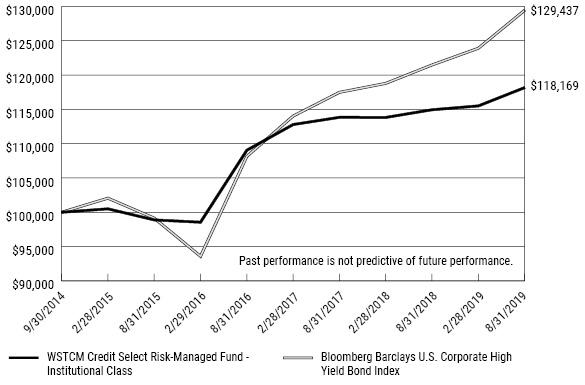
For the twelve-month period ended August 31, 2019, the Institutional Shares of the Credit Fund had a total return of 2.81%. During that time, the Bloomberg Barclays U.S. Corporate High Yield Bond Index gained 6.56% and the Bloomberg Barclays U.S. Aggregate Bond Index gained 10.17%.
Effective October 1, 2019, the WSTCM Sector Select Risk-Managed Fund will transition to a strategy known as Global Allocation Risk-Managed; this strategy remains focused on risk mitigation but deploys WSTCM’s quantitative investment technique across a broader global investment opportunity set while targeting a balanced allocation between equity and fixed income ETFs. We believe this change will allow us to align investor capital with opportunity in shifting global markets. In seeking to achieve its investment objective, the newly named WSTCM Global Allocation Risk-Managed Fund will primarily use a proprietary, quantitative, Global Allocation Risk-Managed Model developed and maintained by the Advisor to make investment decisions. The Global Allocation Risk-Managed Model attempts to manage risk by allocating between equity, fixed income and other types of investments based upon anticipated or perceived market volatility, credit risk and interest rate risk.
1 | The universe excludes ETFs dedicated to Telecommunications and Real Estate, which as of August 31, 2016 are recognized as stand-alone S&P 500 sectors. Real Estate Investment Trusts (REITs) continue to be classified as Financials sector investments. |
2
In conclusion, markets change over time, and although we may not know when these changes will occur, we do know that changing markets bring new investment opportunities. The WST Investment Trust Funds aim to capitalize on these opportunities as they arise. We look forward to providing you with funds that we believe will capture the benefits of rules-based investing founded on sound academic and industry research.
Sincerely,

Roger H. Scheffel Jr., Portfolio Manager
WST Capital Management
a division of Wilbanks, Smith & Thomas Asset Management, LLC
Past performance is not predictive of future performance. Investment results and principal value will fluctuate so that shares, when redeemed, may be worth more or less than their original cost. Current performance may be higher or lower than the performance data quoted. For performance information current to the most recent month-end, please call 1-866-515-4626.
This material is authorized for distribution only when preceded or accompanied by a current prospectus.
WSTCM Funds are distributed by Foreside Fund Services LLC.
The Letter to Shareholders seeks to describe some of the Advisor’s current opinions and views of the financial markets. Although the Advisor believes it has a reasonable basis for any opinions or views expressed, actual results may differ, sometimes significantly so, from those expected or expressed.
An investment in the Funds is subject to investment and market risk. There can be no assurance that the Funds will be successful in meeting their investment objectives. The Funds’ investments are selected primarily by a propriety investment model developed by the investment adviser, Wilbanks, Smith & Thomas. There can be no assurance that the use of the investment model will enable the Funds to achieve positive returns or outperform the market.
3
WSTCM SECTOR SELECT RISK-MANAGED FUND |
Comparison of the Change in Value of a $100,000 Investment in
WSTCM Sector Select Risk-Managed Fund -
Institutional Class(a) and the S&P 500® Index
Average Annual Total Returns (for the periods ended August 31, 2019) | ||||
1 Year | 5 Years | Since | ||
WSTCM Sector Select Risk-Managed Fund - Institutional Class(b) | (8.26%) | 1.59% | 2.60% | |
WSTCM Sector Select Risk-Managed Fund - Investor Class(b) | (8.60%) | 1.30% | 2.32% | |
S&P 500® Index | 2.92% | 10.11% | 11.30% | |
(a) | The line graph above represents performance of the Institutional Class only, which will vary from the performance of the Investor Class based on the difference in fees paid by shareholders in the different classes. |
(b) | Total return is a measure of the change in value of an investment in the Fund over the period covered, which assumes any dividends or capital gain distributions are reinvested in the shares of the Fund. Returns do not reflect the deduction of taxes a shareholder would pay on Fund distributions or the redemption of Fund shares. |
(c) | The Fund commenced operations on December 16, 2013. |
4
WSTCM SECTOR SELECT RISK-MANAGED FUND |
Performance data quoted represents past performance, which is no guarantee of future results. Investment return and principal value are historical and may fluctuate so that redemption value may be worth more or less than the original cost. Current performance may be lower or higher than what is quoted. Fee waivers my positively impact Fund performance. Call 1-866-515-4626 for the most current month-end performance.
As of the latest prospectus, the gross expense and net ratio is 5.68% and 1.87% for Investor Class and 2.25% and 1.62% for Institutional Class. The Adviser has entered into an Expense Limitation Agreement which it has contractually agreed to waive or reduce Management Fees and other expenses of the Fund to not more than 1.25% of the average daily net assets allocable to each Class of the Fund. The Expense Limitation Agreement is currently in effect until January 1, 2021. The Expense Limitation Agreement may be terminated at the end of its then-current term upon not less than 90 days’ notice. The Trust’s Board of Trustees may terminate the Expense Limitation Agreement at any time.
5
WSTCM CREDIT SELECT RISK-MANAGED FUND |
Comparison of the Change in Value of a $100,000 Investment in
WSTCM Credit Select Risk-Managed Fund - Institutional Class(a) and
the Bloomberg Barclays U.S. Corporate High Yield Bond Index
Average Annual Total Returns (for the periods ended August 31, 2019) | |||
1 Year | Since | ||
WSTCM Credit Select Risk-Managed Fund - Institutional Class(b) | 2.81% | 3.45% | |
WSTCM Credit Select Risk-Managed Fund - Investor Class(b) | 2.71% | 3.24% | |
Bloomberg Barclays U.S. Corporate High Yield Bond Index | 6.56% | 5.39% | |
(a) | The line graph above represents performance of the Institutional Class only, which will vary from the performance of the Investor Class based on the difference in fees paid by shareholders in the different classes. |
(b) | Total return is a measure of the change in value of an investment in the Fund over the period covered, which assumes any dividends or capital gain distributions are reinvested in shares of the Fund. Returns do not reflect the deduction of taxes a shareholder would pay on Fund distributions or the redemption of Fund shares. |
(c) | The Fund commenced operations on September 30, 2014. |
6
WSTCM CREDIT SELECT RISK-MANAGED FUND |
Performance data quoted represents past performance, which is no guarantee of future results. Investment return and principal value are historical and may fluctuate so that redemption value may be worth more or less than the original cost. Current performance may be lower or higher than what is quoted. Fee waivers my positively impact Fund performance. Call 1-866-515-4626 for the most current month-end performance.
As of the latest prospectus, the gross expense 1.63% for Investor Class and 1.38% for Institutional Class. The Adviser has entered into an Expense Limitation Agreement which it has contractually agreed to waive or reduce Management Fees and other expenses of the Fund to not more than 1.15% of the average daily net assets allocable to each Class of the Fund. The Expense Limitation Agreement is currently in effect until January 1, 2020. The Expense Limitation Agreement may be terminated at the end of its then-current term upon not less than 90 days’ notice. The Trust’s Board of Trustees may terminate the Expense Limitation Agreement at any time.
7
WST INVESTMENT TRUST |
WSTCM Sector Select Risk-Managed Fund
Sector Diversification
(% of Net Assets)
WSTCM Credit Select Risk-Managed Fund
Investment Strategy Allocation
(% of Net Assets)
8
WSTCM SECTOR SELECT RISK-MANAGED FUND | ||||||||
EXCHANGE-TRADED FUNDS — 99.4% | Shares | Value | ||||||
Invesco S&P 500 Equal Weight Materials ETF | 15,233 | $ | 1,600,850 | |||||
Invesco S&P 500 Equal Weight Technology ETF | 9,312 | 1,643,661 | ||||||
Invesco S&P 500 Equal Weight Utilities ETF | 17,078 | 1,763,474 | ||||||
iShares 3-7 Year Treasury Bond ETF | 19,509 | 2,492,275 | ||||||
iShares Short Treasury Bond ETF(a) | 41,787 | 4,624,150 | ||||||
Janus Henderson Short Duration Income ETF | 17,188 | 861,806 | ||||||
JPMorgan Ultra-Short Income ETF | 49,041 | 2,472,647 | ||||||
SPDR® Gold Shares(b) | 5,944 | 854,450 | ||||||
TOTAL EXCHANGE-TRADED FUNDS(Cost $16,078,510) | $ | 16,313,313 | ||||||
| ||||||||
MONEY MARKET FUNDS — 0.9% | Shares | Value | ||||||
Fidelity Institutional Money Market Government Portfolio - Class I, 2.00%(c) | 51,902 | $ | 51,902 | |||||
First American Treasury Obligations Fund - Class Z, 1.98%(c) | 50,376 | 50,376 | ||||||
Invesco Short-Term Investments Trust - Treasury Portfolio - Institutional Class, 1.99%(c) | 50,376 | 50,376 | ||||||
TOTAL MONEY MARKET FUNDS (Cost $152,654) | $ | 152,654 | ||||||
TOTAL INVESTMENTS AT VALUE— 100.3%(Cost $16,231,164) | $ | 16,465,967 | ||||||
LIABILITIES IN EXCESS OF OTHER ASSETS — (0.3%) | (47,041 | ) | ||||||
NET ASSETS — 100.0% | $ | 16,418,926 | ||||||
(a) | Represents 25% or more of net assets (Note 6). |
(b) | Non-income producing security. |
(c) | The rate shown is the 7-day effective yield as of August 31, 2019. |
See accompanying notes to financial statements. | |
9
WSTCM CREDIT SELECT RISK-MANAGED FUND | ||||||||
EXCHANGE-TRADED FUNDS — 50.6% | Shares | Value | ||||||
Invesco Fundamental High Yield Corporate Bond ETF | 288,321 | $ | 5,495,398 | |||||
iShares iBoxx $ High Yield Corporate Bond ETF | 109,943 | 9,582,632 | ||||||
SPDR Bloomberg Barclays High Yield Bond ETF | 64,929 | 7,064,924 | ||||||
VanEck Vectors Fallen Angel High Yield Bond ETF | 186,984 | 5,484,241 | ||||||
TOTAL EXCHANGE-TRADED FUNDS (Cost $27,510,067) | $ | 27,627,195 | ||||||
| ||||||||
OPEN-END FUNDS — 47.1% | Shares | Value | ||||||
American High-Income Trust - Class F-2 | 3,342 | $ | 33,491 | |||||
BlackRock High Yield Bond Portfolio - Institutional Class | 1 | 1 | ||||||
Eaton Vance Income Fund of Boston – Institutional Class | 1 | 1 | ||||||
Fidelity Advisor Floating Rate High Income Fund - Class I | 1 | 6 | ||||||
Guggenheim Floating Rate Strategies Fund - Institutional Class | 1 | 4 | ||||||
JPMorgan High Yield Fund – Class I | 709,270 | 5,120,930 | ||||||
Lord Abbett Floating Rate Fund - Class I | 1 | 9 | ||||||
Lord Abbett High Yield Fund - Class I | 1 | 1 | ||||||
MFS High Income Fund – I Shares | 1,508,282 | 5,143,242 | ||||||
Neuberger Berman High Income Bond Fund – Institutional Class | 598,096 | 5,113,724 | ||||||
PGIM High Yield Fund - Class Z | 5,857 | 32,211 | ||||||
PIMCO High Yield Fund - Institutional Class | 1 | 1 | ||||||
PIMCO High Yield Spectrum Fund - Institutional Class | 2,195 | 21,514 | ||||||
Pioneer High Yield Fund - Class Y | 2,374 | 22,669 | ||||||
Principal High Income Fund – Institutional Class | 538,921 | 5,076,635 | ||||||
Putnam Ultra Short Duration Income Fund – Class Y | 465 | 4,674 | ||||||
TIAA-CREF High-Yield Fund – Institutional Class | 525,830 | 5,105,811 | ||||||
Vanguard High-Yield Corporate Fund - Admiral Shares | 5,527 | 32,552 | ||||||
Voya Floating Rate Fund - Class I | 1 | 7 | ||||||
TOTAL OPEN-END FUNDS(Cost $25,423,359) | $ | 25,707,483 | ||||||
See accompanying notes to financial statements. |
10
WSTCM CREDIT SELECT RISK-MANAGED FUND | ||||||||
MONEY MARKET FUNDS — 2.2% | Shares | Value | ||||||
Fidelity Institutional Money Market Government Portfolio - Class I, 2.00%(a) | 418,305 | $ | 418,305 | |||||
First American Treasury Obligations Fund - Class Z, 1.98%(a) | 406,001 | 406,001 | ||||||
Invesco Short-Term Investments Trust - Treasury Portfolio - Institutional Class, 1.99%(a) | 406,001 | 406,001 | ||||||
TOTAL MONEY MARKET FUNDS (Cost $1,230,307) | $ | 1,230,307 | ||||||
TOTAL INVESTMENTS AT VALUE— 99.9%(Cost $54,163,733) | $ | 54,564,985 | ||||||
OTHER ASSETS IN EXCESS OF LIABILITIES— 0.1% | 51,891 | |||||||
NET ASSETS— 100.0% | $ | 54,616,876 | ||||||
(a) | The rate shown is the 7-day effective yield as of August 31, 2019. |
See accompanying notes to financial statements. | |
11
WST INVESTMENT TRUST | ||||||||
| Sector Select | Credit Select | ||||||
ASSETS | ||||||||
Investments in securities: | ||||||||
At cost | $ | 16,231,164 | $ | 54,163,733 | ||||
At value (Note 2) | $ | 16,465,967 | $ | 54,564,985 | ||||
Receivable for investment securities sold | 1,587,719 | 11,010,923 | ||||||
Dividends receivable | 5,821 | 86,516 | ||||||
Receivable from Adviser (Note 4) | 1,922 | — | ||||||
Other assets | 13,441 | 23,805 | ||||||
TOTAL ASSETS | 18,074,870 | 65,686,229 | ||||||
LIABILITIES | ||||||||
Payable for capital shares redeemed | — | 11,536 | ||||||
Payable for investment securities purchased | 1,644,331 | 11,005,987 | ||||||
Payable to Adviser (Note 4) | — | 28,361 | ||||||
Payable to Administrator (Note 4) | 7,640 | 10,700 | ||||||
Accrued distribution fees (Note 4) | 33 | 8,329 | ||||||
Other accrued expenses | 3,940 | 4,440 | ||||||
TOTAL LIABILITIES | 1,655,944 | 11,069,353 | ||||||
NET ASSETS | $ | 16,418,926 | $ | 54,616,876 | ||||
NET ASSETS CONSIT OF: | ||||||||
Paid-in capital | $ | 17,397,881 | $ | 56,046,451 | ||||
Accumulated deficit | (978,955 | ) | (1,429,575 | ) | ||||
NET ASSETS | $ | 16,418,926 | $ | 54,616,876 | ||||
PRICING OF INSTITUTIONAL SHARES | ||||||||
Net assets applicable to Institutional Shares | $ | 16,262,852 | $ | 16,570,364 | ||||
Shares of Institutional Shares outstanding (no par value, unlimited number of shares authorized) | 1,656,773 | 1,627,350 | ||||||
Net asset value, offering and redemption price per share (Note 2) | $ | 9.82 | $ | 10.18 | ||||
PRICING OF INVESTOR SHARES | ||||||||
Net assets applicable to Investor Shares | $ | 156,074 | $ | 38,046,512 | ||||
Shares of Investor Shares outstanding (no par value, unlimited number of shares authorized) | 16,091 | 3,753,215 | ||||||
Net asset value, offering and redemption price per share (Note 2) | $ | 9.70 | $ | 10.14 | ||||
See accompanying notes to financial statements. |
12
WST INVESTMENT TRUST | ||||||||
| Sector Select | Credit Select | ||||||
INVESTMENT INCOME | ||||||||
Dividends | $ | 283,752 | $ | 2,838,680 | ||||
EXPENSES | ||||||||
Investment advisory fees (Note 4) | 114,798 | 394,900 | ||||||
Distribution fees, Investor Class (Note 5) | 1,825 | 120,789 | ||||||
Administration fees (Note 4) | 30,000 | 65,715 | ||||||
Legal fees | 44,028 | 36,483 | ||||||
Fund accounting fees (Note 4) | 37,530 | 42,569 | ||||||
Registration and filing fees | 35,695 | 38,461 | ||||||
Transfer agent fees, Institutional Class (Note 4) | 12,000 | 12,000 | ||||||
Transfer agent fees, Investor Class (Note 4) | 12,000 | 18,000 | ||||||
Audit and tax services fees | 17,500 | 17,500 | ||||||
Custodian and bank service fees | 5,584 | 10,960 | ||||||
Trustees’ fees and expenses (Note 4) | 7,792 | 7,792 | ||||||
Insurance expense | 7,591 | 7,591 | ||||||
Printing of shareholder reports | 2,875 | 5,598 | ||||||
Other expenses | 11,651 | 32,167 | ||||||
TOTAL EXPENSES | 340,869 | 810,525 | ||||||
Fee waivers and expense reimbursements by the Adviser (Note 4) | (147,662 | ) | — | |||||
NET EXPENSES | 193,207 | 810,525 | ||||||
NET INVESTMENT INCOME | 90,545 | 2,028,155 | ||||||
REALIZED AND UNREALIZED GAINS (LOSSES) ON INVESTMENTS | ||||||||
Net realized losses from investment transactions | (1,300,137 | ) | (1,124,384 | ) | ||||
Long-term capital gain distributions from regulated investment companies | — | 15,072 | ||||||
Net change in unrealized appreciation (depreciation) on investments | (210,553 | ) | 492,918 | |||||
NET REALIZED AND UNREALIZED LOSSES ON INVESTMENTS | (1,510,690 | ) | (616,394 | ) | ||||
NET INCREASE (DECREASE) IN NET ASSETS RESULTING FROM OPERATIONS | $ | (1,420,145 | ) | $ | 1,411,761 | |||
See accompanying notes to financial statements. |
13
WSTCM SECTOR SELECT RISK-MANAGED FUND | ||||||||
| Year | Year | ||||||
FROM OPERATIONS | ||||||||
Net investment income (loss) | $ | 90,545 | $ | (12,644 | ) | |||
Net realized gains (losses) from investment transactions | (1,300,137 | ) | 1,664,791 | |||||
Net change in unrealized appreciation (depreciation) on investments | (210,553 | ) | 44,627 | |||||
Net increase (decrease) in net assets resulting from operations | (1,420,145 | ) | 1,696,774 | |||||
DISTRIBUTIONS TO SHAREHOLDERS (Note 2) | ||||||||
Institutional Shares | (1,510,149 | ) | (71,980 | ) | ||||
Investor Shares | (88,822 | ) | (3,996 | ) | ||||
Decrease in net assets from distributions to shareholders | (1,598,971 | ) | (75,976 | ) | ||||
CAPITAL SHARE TRANSACTIONS | ||||||||
Institutional Shares | ||||||||
Proceeds from shares sold | 3,828,880 | 46,700 | ||||||
Net asset value of shares issued in reinvestment of distributions | 1,510,149 | 71,980 | ||||||
Payments for shares redeemed | (1,893,438 | ) | (1,376,715 | ) | ||||
Net increase (decrease) in Institutional Shares net assets from capital share transactions | 3,445,591 | (1,258,035 | ) | |||||
Investor Shares | ||||||||
Proceeds from shares sold | 1,200 | 23,523 | ||||||
Net asset value of shares issued in reinvestment of distributions | 88,822 | 3,996 | ||||||
Payments for shares redeemed | (685,945 | ) | (15,536 | ) | ||||
Net increase (decrease) in Investor Shares net assets from capital share transactions | (595,923 | ) | 11,983 | |||||
TOTAL INCREASE (DECREASE) IN NET ASSETS | (169,448 | ) | 374,746 | |||||
NET ASSETS | ||||||||
Beginning of year | 16,588,374 | 16,213,628 | ||||||
End of year | $ | 16,418,926 | $ | 16,588,374 | ||||
(a) | The presentation of Distributions to Shareholders has been updated to reflect the changes prescribed in amendments to Regulation S-X, effective November 5, 2018 (Note 2). For the year ended August 31, 2018, distributions to shareholders were from realized capital gains on investments for each class. Accumulated net investment loss as of August 31, 2018 was $0. |
See accompanying notes to financial statements. | |
14
WSTCM SECTOR SELECT RISK-MANAGED FUND | ||||||||
| Year | Year | ||||||
CAPITAL SHARE ACTIVITY | ||||||||
Institutional Shares | ||||||||
Shares sold | 383,168 | 4,145 | ||||||
Shares reinvested | 155,206 | 6,237 | ||||||
Shares redeemed | (189,070 | ) | (122,050 | ) | ||||
Net increase (decrease) in shares outstanding | 349,304 | (111,668 | ) | |||||
Shares outstanding, beginning of year | 1,307,469 | 1,419,137 | ||||||
Shares outstanding, end of year | 1,656,773 | 1,307,469 | ||||||
Investor Shares | ||||||||
Shares sold | 117 | 2,061 | ||||||
Shares reinvested | 9,214 | 348 | ||||||
Shares redeemed | (69,308 | ) | (1,348 | ) | ||||
Net increase (decrease) in shares outstanding | (59,977 | ) | 1,061 | |||||
Shares outstanding, beginning of year | 76,068 | 75,007 | ||||||
Shares outstanding, end of year | 16,091 | 76,068 | ||||||
See accompanying notes to financial statements. |
15
WSTCM CREDIT SELECT RISK-MANAGED FUND | ||||||||
| Year | Year | ||||||
FROM OPERATIONS | ||||||||
Net investment income | $ | 2,028,155 | $ | 3,260,818 | ||||
Net realized losses from investment transactions | (1,124,384 | ) | (1,863,566 | ) | ||||
Long-term capital gain distributions from regulated investment companies | 15,072 | 4,325 | ||||||
Net change in unrealized appreciation (depreciation) on investments | 492,918 | (881,931 | ) | |||||
Net increase in net assets resulting from operations | 1,411,761 | 519,646 | ||||||
DISTRIBUTIONS TO SHAREHOLDERS (Note 2) | ||||||||
Institutional Shares | (629,594 | ) | (2,858,825 | ) | ||||
Investor Shares | (1,961,426 | ) | (3,548,487 | ) | ||||
Decrease in net assets from distributions to shareholders | (2,591,020 | ) | (6,407,312 | ) | ||||
CAPITAL SHARE TRANSACTIONS | ||||||||
Institutional Shares | ||||||||
Proceeds from shares sold | 2,805,198 | 17,763,029 | ||||||
Net asset value of shares issued in reinvestment of distributions | 628,182 | 2,858,484 | ||||||
Payments for shares redeemed | (11,759,437 | ) | (40,096,868 | ) | ||||
Net decrease in Institutional Shares net assets from capital share transactions | (8,326,057 | ) | (19,475,355 | ) | ||||
Investor Shares | ||||||||
Proceeds from shares sold | 1,869,417 | 10,017,839 | ||||||
Net asset value of shares issued in reinvestment of distributions | 1,961,180 | 3,548,487 | ||||||
Payments for shares redeemed | (27,643,795 | ) | (7,296,232 | ) | ||||
Net increase (decrease) in Investor Shares net assets from capital share transactions | (23,813,198 | ) | 6,270,094 | |||||
TOTAL DECREASE IN NET ASSETS | (33,318,514 | ) | (19,092,927 | ) | ||||
NET ASSETS | ||||||||
Beginning of year | 87,935,390 | 107,028,317 | ||||||
End of year | $ | 54,616,876 | $ | 87,935,390 | ||||
(a) | The presentation of Distributions to Shareholders has been updated to reflect the changes prescribed in amendments to Regulation S-X, effective November 5, 2018 (Note 2). For the year ended August 31, 2018, distributions to shareholders for Institutional Shares consisted of $1,638,144 from net investment income and $1,220,681 from realized capital gains on investments, and for the Investor Shares consisted of $1,975,165 from net investment income and $1,573,322 from realized capital gains on investments. Undistributed net investment income as of August 31, 2018 was $1,852,018. |
See accompanying notes to financial statements. | |
16
WSTCM CREDIT SELECT RISK-MANAGED FUND | ||||||||
| Year | Year | ||||||
CAPITAL SHARE ACTIVITY | ||||||||
Institutional Shares | ||||||||
Shares sold | 278,012 | 1,691,093 | ||||||
Shares reinvested | 64,166 | 280,518 | ||||||
Shares redeemed | (1,155,676 | ) | (3,898,150 | ) | ||||
Net decrease in shares outstanding | (813,498 | ) | (1,926,539 | ) | ||||
Shares outstanding, beginning of year | 2,440,848 | 4,367,387 | ||||||
Shares outstanding, end of year | 1,627,350 | 2,440,848 | ||||||
Investor Shares | ||||||||
Shares sold | 186,460 | 967,671 | ||||||
Shares reinvested | 200,941 | 348,917 | ||||||
Shares redeemed | (2,775,276 | ) | (708,870 | ) | ||||
Net increase (decrease) in shares outstanding | (2,387,875 | ) | 607,718 | |||||
Shares outstanding, beginning of year | 6,141,090 | 5,533,372 | ||||||
Shares outstanding, end of year | 3,753,215 | 6,141,090 | ||||||
See accompanying notes to financial statements. |
17
WSTCM SECTOR SELECT RISK-MANAGED FUND | ||||||||||||||||||||
Per Share Data for a Share Outstanding Throughout Each Year | ||||||||||||||||||||
| Year | Year | Year | Year | Year | |||||||||||||||
Net asset value at beginning of year | $ | 11.99 | $ | 10.85 | $ | 10.36 | $ | 10.85 | $ | 10.68 | ||||||||||
Income (loss) from investment operations: | ||||||||||||||||||||
Net investment income (loss)(a) | 0.06 | (b) | (0.01 | )(b) | (0.01 | ) | 0.03 | 0.01 | ||||||||||||
Net realized and unrealized gains (losses) on investments | (1.06 | ) | 1.20 | 0.52 | (0.16 | ) | 0.26 | |||||||||||||
Total from investment operations | (1.00 | ) | 1.19 | 0.51 | (0.13 | ) | 0.27 | |||||||||||||
Less distributions: | ||||||||||||||||||||
From net investment income | — | — | (0.02 | ) | (0.02 | ) | (0.03 | ) | ||||||||||||
From net realized capital gains | (1.17 | ) | (0.05 | ) | — | (0.34 | ) | (0.07 | ) | |||||||||||
Total distributions | (1.17 | ) | (0.05 | ) | (0.02 | ) | (0.36 | ) | (0.10 | ) | ||||||||||
Net asset value at end of year | $ | 9.82 | $ | 11.99 | $ | 10.85 | $ | 10.36 | $ | 10.85 | ||||||||||
Total return(c) | (8.26 | %) | 11.02 | % | 4.96 | % | (1.26 | %) | 2.51 | % | ||||||||||
Net assets at end of year (000’s) | $ | 16,263 | $ | 15,683 | $ | 15,404 | $ | 16,805 | $ | 16,969 | ||||||||||
Ratios/supplementary data: | ||||||||||||||||||||
Ratio of total expenses to average net assets(d) | 2.11 | % | 1.88 | % | 1.82 | % | 1.74 | % | 1.84 | % | ||||||||||
Ratio of net expenses to average net assets(d)(e) | 1.25 | % | 1.25 | % | 1.25 | % | 1.25 | % | 1.25 | % | ||||||||||
Ratio of net investment income (loss) to average net assets(a)(e) | 0.59 | % | (0.06 | %) | (0.04 | %) | 0.24 | % | 0.04 | % | ||||||||||
Portfolio turnover rate | 533 | % | 268 | % | 346 | % | 472 | % | 150 | % | ||||||||||
(a) | Recognition of net investment income (loss) by the Fund is affected by the timing of the declaration of the dividends by the underlying investment companies in which the Fund invests. |
(b) | Net investment income (loss) per share has been calculated using the average daily shares outstanding during the period. |
(c) | Total return is a measure of the change in value of an investment in the Fund over the periods covered, which assumes any dividends and capital gain distributions are reinvested in shares of the Fund. The returns shown do not reflect the deduction of taxes a shareholder would pay on Fund distributions, if any, or the redemption of Fund shares. |
(d) | Ratio does not include expenses of the investment companies in which the Fund invests. |
(e) | Ratio was determined after advisory fee waivers and expense reimbursements (Note 4). |
See accompanying notes to financial statements. | |
18
WSTCM SECTOR SELECT RISK-MANAGED FUND | ||||||||||||||||||||
Per Share Data for a Share Outstanding Throughout Each Year | ||||||||||||||||||||
| Year | Year | Year | Year | Year | |||||||||||||||
Net asset value at beginning of year | $ | 11.90 | $ | 10.80 | $ | 10.33 | $ | 10.83 | $ | 10.68 | ||||||||||
Income (loss) from investment operations: | ||||||||||||||||||||
Net investment income (loss)(a) | 0.06 | (b) | (0.04 | )(b) | (0.04 | ) | (0.00 | )(c) | (0.01 | ) | ||||||||||
Net realized and unrealized gains (losses) on investments | (1.09 | ) | 1.19 | 0.52 | (0.15 | ) | 0.24 | |||||||||||||
Total from investment operations | (1.03 | ) | 1.15 | 0.48 | (0.15 | ) | 0.23 | |||||||||||||
Less distributions: | ||||||||||||||||||||
From net investment income | — | — | (0.01 | ) | (0.01 | ) | (0.01 | ) | ||||||||||||
From net realized capital gains | (1.17 | ) | (0.05 | ) | — | (0.34 | ) | (0.07 | ) | |||||||||||
Total distributions | (1.17 | ) | (0.05 | ) | (0.01 | ) | (0.35 | ) | (0.08 | ) | ||||||||||
Net asset value at end of year | $ | 9.70 | $ | 11.90 | $ | 10.80 | $ | 10.33 | $ | 10.83 | ||||||||||
Total return(d) | (8.60 | %) | 10.70 | % | 4.69 | % | (1.44 | %) | 2.16 | % | ||||||||||
Net assets at end of year (000’s) | $ | 156 | $ | 906 | $ | 810 | $ | 945 | $ | 1,002 | ||||||||||
Ratios/supplementary data: | ||||||||||||||||||||
Ratio of total expenses to average net assets(e) | 4.54 | % | 5.31 | % | 5.06 | % | 4.50 | % | 5.96 | % | ||||||||||
Ratio of net expenses to average net assets(e)(f) | 1.50 | % | 1.50 | % | 1.50 | % | 1.50 | % | 1.50 | % | ||||||||||
Ratio of net investment income (loss) to average net assets(a)(f) | 0.59 | % | (0.32 | %) | (0.28 | %) | (0.01 | %) | (0.23 | %) | ||||||||||
Portfolio turnover rate | 533 | % | 268 | % | 346 | % | 472 | % | 150 | % | ||||||||||
(a) | Recognition of net investment income (loss) by the Fund is affected by the timing of the declaration of the dividends by the underlying investment companies in which the Fund invests. |
(b) | Net investment income (loss) per share has been calculated using the average daily shares outstanding during the period. |
(c) | Amount rounds to less than $0.01 per share. |
(d) | Total return is a measure of the change in value of an investment in the Fund over the periods covered, which assumes any dividends and capital gain distributions are reinvested in shares of the Fund. The returns shown do not reflect the deduction of taxes a shareholder would pay on Fund distributions, if any, or the redemption of Fund shares. |
(e) | Ratio does not include expenses of the investment companies in which the Fund invests. |
(f) | Ratio was determined after advisory fee waivers and expense reimbursements (Note 4). |
See accompanying notes to financial statements. | |
19
WSTCM CREDIT SELECT RISK-MANAGED FUND | ||||||||||||||||||||
Per Share Data for a Share Outstanding Throughout Each Period | ||||||||||||||||||||
| Year | Year | Year | Year | Period | |||||||||||||||
Net asset value at beginning of period | $ | 10.28 | $ | 10.83 | $ | 10.71 | $ | 9.72 | $ | 10.00 | ||||||||||
Income (loss) from investment operations: | ||||||||||||||||||||
Net investment income(b) | 0.33 | (c) | 0.34 | (c) | 0.33 | 0.21 | 0.16 | |||||||||||||
Net realized and unrealized gains (losses) on investments | (0.06 | ) | (0.24 | ) | 0.13 | 0.79 | (0.27 | ) | ||||||||||||
Total from investment operations | 0.27 | 0.10 | 0.46 | 1.00 | (0.11 | ) | ||||||||||||||
Less distributions: | ||||||||||||||||||||
From net investment income | (0.37 | ) | (0.37 | ) | (0.34 | ) | (0.01 | ) | (0.15 | ) | ||||||||||
From net realized capital gains | — | (0.28 | ) | — | — | (0.00 | )(d) | |||||||||||||
From return of capital | — | — | — | — | (0.02 | ) | ||||||||||||||
Total distributions | (0.37 | ) | (0.65 | ) | (0.34 | ) | (0.01 | ) | (0.17 | ) | ||||||||||
Net asset value at end of period | $ | 10.18 | $ | 10.28 | $ | 10.83 | $ | 10.71 | $ | 9.72 | ||||||||||
Total return(e) | 2.81 | % | 0.97 | % | 4.40 | % | 10.27 | % | (1.11 | %)(f) | ||||||||||
Net assets at end of period (000’s) | $ | 16,570 | $ | 25,085 | $ | 47,308 | $ | 20,152 | $ | 14,951 | ||||||||||
Ratios/supplementary data: | ||||||||||||||||||||
Ratio of total expenses to average net assets(g) | 1.08 | % | 0.91 | % | 0.97 | % | 1.04 | % | 1.11 | %(h) | ||||||||||
Ratio of net investment income to average net assets(b) | 3.31 | % | 3.17 | % | 3.84 | % | 2.50 | % | 1.89 | %(h) | ||||||||||
Portfolio turnover rate | 524 | % | 507 | % | 414 | % | 326 | % | 890 | %(f) | ||||||||||
(a) | Represents the period from the commencement of operations (September 30, 2014) through August 31, 2015. |
(b) | Recognition of net investment income by the Fund is affected by the timing of the declaration of the dividends by the underlying investment companies in which the Fund invests. |
(c) | Net investment income per share has been calculated using the average daily shares outstanding during the period. |
(d) | Amount rounds to less than $0.01 per share. |
(e) | Total return is a measure of the change in value of an investment in the Fund over the periods covered, which assumes any dividends and capital gain distributions are reinvested in shares of the Fund. The returns shown do not reflect the deduction of taxes a shareholder would pay on Fund distributions, if any, or the redemption of Fund shares. |
(f) | Not annualized. |
(g) | Ratio does not include expenses of the investment companies in which the Fund invests. |
(h) | Annualized. |
See accompanying notes to financial statements. | |
20
WSTCM CREDIT SELECT RISK-MANAGED FUND | ||||||||||||||||||||
Per Share Data for a Share Outstanding Throughout Each Period | ||||||||||||||||||||
| Year | Year | Year | Year | Period | |||||||||||||||
Net asset value at beginning of period | $ | 10.23 | $ | 10.79 | $ | 10.68 | $ | 9.72 | $ | 10.00 | ||||||||||
Income (loss) from investment operations: | ||||||||||||||||||||
Net investment income(b) | 0.30 | (c) | 0.32 | (c) | 0.37 | 0.21 | 0.14 | |||||||||||||
Net realized and unrealized gains (losses) on investments | (0.04 | ) | (0.25 | ) | 0.07 | 0.75 | (0.26 | ) | ||||||||||||
Total from investment operations | 0.26 | 0.07 | 0.44 | 0.96 | (0.12 | ) | ||||||||||||||
Less distributions: | ||||||||||||||||||||
From net investment income | (0.35 | ) | (0.35 | ) | (0.33 | ) | (0.00 | )(d) | (0.14 | ) | ||||||||||
From net realized capital gains | — | (0.28 | ) | — | — | (0.00 | )(d) | |||||||||||||
From return of capital | — | — | — | — | (0.02 | ) | ||||||||||||||
Total distributions | (0.35 | ) | (0.63 | ) | (0.33 | ) | (0.00 | )(d) | (0.16 | ) | ||||||||||
Net asset value at end of period | $ | 10.14 | $ | 10.23 | $ | 10.79 | $ | 10.68 | $ | 9.72 | ||||||||||
Total return(e) | 2.71 | % | 0.64 | % | 4.26 | % | 9.91 | % | (1.22 | %)(f) | ||||||||||
Net assets at end of period (000’s) | $ | 38,047 | $ | 62,851 | $ | 59,721 | $ | 49,785 | $ | 41,389 | ||||||||||
Ratios/supplementary data: | ||||||||||||||||||||
Ratio of total expenses to average net assets(g) | 1.29 | % | 1.16 | % | 1.21 | % | 1.24 | % | 1.27 | %(h) | ||||||||||
Ratio of net investment income to average net assets(b) | 3.00 | % | 3.04 | % | 3.63 | % | 2.22 | % | 1.69 | %(h) | ||||||||||
Portfolio turnover rate | 524 | % | 507 | % | 414 | % | 326 | % | 890 | %(f) | ||||||||||
(a) | Represents the period from the commencement of operations (September 30, 2014) through August 31, 2015. |
(b) | Recognition of net investment income by the Fund is affected by the timing of the declaration of the dividends by the underlying investment companies in which the Fund invests. |
(c) | Net investment income per share has been calculated using the average daily shares outstanding during the period. |
(d) | Amount rounds to less than $0.01 per share. |
(e) | Total return is a measure of the change in value of an investment in the Fund over the periods covered, which assumes any dividends and capital gain distributions are reinvested in shares of the Fund. The returns shown do not reflect the deduction of taxes a shareholder would pay on Fund distributions, if any, or the redemption of Fund shares. |
(f) | Not annualized. |
(g) | Ratio does not include expenses of the investment companies in which the Fund invests. |
(h) | Annualized. |
See accompanying notes to financial statements. | |
21
WST INVESTMENT TRUST
NOTES TO FINANCIAL STATEMENTS
August 31, 2019
1. Organization
WSTCM Sector Select Risk-Managed Fund and WSTCM Credit Select Risk-Managed Fund (individually, a “Fund” and collectively, the “Funds”) are each a diversified series of WST Investment Trust (the “Trust”), an open-end management investment company organized as a Delaware statutory trust and registered under the Investment Company Act of 1940, as amended (the “1940 Act”).
WSTCM Sector Select Risk-Managed Fund’s investment objective is to seek long-term capital appreciation, while maintaining a secondary emphasis on generating income.
WSTCM Credit Select Risk-Managed Fund’s investment objective is to seek total return from income and capital appreciation.
Each Fund offers two classes of shares (each a “Class” and collectively the “Classes”): Institutional Shares (sold without any sales loads or distribution fees, but available only to institutional investors and certain broker-dealers and financial institutions that have entered into appropriate arrangements with the Fund) and Investor Shares (sold without any sales loads, but subject to a distribution fee of up to 0.25% per annum of the average daily net assets attributable to Investor Shares). Each Class represents an ownership interest in the same investment portfolio.
2. Significant Accounting Policies
In August 2018, the U.S. Securities and Exchange Commission (the “SEC”) adopted regulations that eliminated or amended disclosure requirements that were redundant or outdated in light of changes in SEC requirements, accounting principles generally accepted in the United States of America (“GAAP”), International Financial Reporting Standards or changes in technology or the business environment. These regulations were effective November 5, 2018, and the Funds are complying with them.
The Funds follow accounting and reporting guidance under Financial Accounting Standards Board (“FASB”) Accounting Standards Codification (“ASC”) Topic 946,Financial Services – Investment Companies. The following is a summary of the Funds’ significant accounting policies used in the preparation of its financial statements. These policies are in conformity with GAAP.
New Accounting Pronouncement – In August 2018, FASB issued Accounting Standards Update No. 2018-13 (“ASU 2018-13”),Disclosure Framework – Changes to the Disclosure Requirements for Fair Value Measurement, which amends the fair value measurement disclosure requirements of ASC Topic 820 (“ASC 820”), “Fair Value Measurement.” ASU 2018-13 includes new, eliminated, and modified disclosure requirements for ASC 820. In addition, ASU 2018-13 clarifies that materiality is an appropriate consideration when
22
WST INVESTMENT TRUST
NOTES TO FINANCIAL STATEMENTS (Continued)
evaluating disclosure requirements. ASU 2018-13 is effective for fiscal years beginning after December 15, 2019, including interim periods therein. Early adoption is permitted and the Funds have adopted ASU 2018-13 with these financial statements.
Securities valuation – The Funds’ portfolio securities are valued as of the close of regular trading on the New York Stock Exchange (“NYSE”) (normally 4:00 p.m. Eastern Time) on each day that the NYSE is open for business. In determining the value of the Funds’ assets, portfolio securities, including exchange-traded funds (“ETFs”), are generally valued at market using quotations from the primary market in which they are traded. The Funds normally use third party pricing services to obtain market quotations. To the extent a Fund is invested in other open-end investment companies, including money market funds, that are registered under the 1940 Act, the Fund’s net asset value per share (“NAV”) is calculated based upon the NAVs reported by such registered open-end investment companies, and the prospectuses for these companies explain the circumstances under which they will use fair value pricing and the effects of using fair value pricing. When using quoted prices or NAVs reported by underlying investment companies and when the market is considered to be active, securities will be classified as Level 1 (see below). Securities and assets for which market quotations are not readily available or which cannot be accurately valued using the Funds’ normal pricing procedures are valued at fair value as determined in good faith under policies established by, and under the direction of, the Trust’s Board of Trustees (the “Board”). Fair value pricing may be used, for example, in situations where (i) portfolio securities, such as securities with small capitalizations, are so thinly traded that there have been no transactions for that stock over an extended period of time; (ii) an event occurs after the close of the exchange on which the portfolio security is principally traded that is likely to change the value of the portfolio security prior to the calculation of the Funds’ NAVs; (iii) the exchange on which the portfolio security is principally traded closes early; or (iv) trading of the portfolio security is halted during the day and does not resume prior to the calculation of the Funds’ NAVs. In such cases, a portfolio security’s “fair value” price may differ from the price next available for that portfolio security using the Funds’ normal pricing procedures, and the fair value price may differ substantially from the price at which the security may ultimately be sold. Fair valued securities will be classified as Level 2 or 3 within the fair value hierarchy, depending on the inputs used.
GAAP establishes a single authoritative definition of fair value, sets out a framework for measuring fair value and requires additional disclosures about fair value measurements.
Various inputs are used in determining the value of the Funds’ investments. These inputs are summarized in the three broad levels listed below:
● | Level 1 – quoted prices in active markets for identical securities |
● | Level 2 – other significant observable inputs |
● | Level 3 – significant unobservable inputs |
23
WST INVESTMENT TRUST
NOTES TO FINANCIAL STATEMENTS (Continued)
The inputs or methodology used for valuing securities are not necessarily an indication of the risks associated with investing in those securities. The inputs used to measure fair value may fall into different levels of the fair value hierarchy. In such cases, for disclosure purposes, the level in the fair value hierarchy within which the fair value measurement falls in its entirety is determined based on the lowest level input that is significant to the fair value measurement.
The following is a summary of the inputs used to value each Fund’s investments as of August 31, 2019:
WSTCM Sector Select | Level 1 | Level 2 | Level 3 | Total | ||||||||||||
Exchange-Traded Funds | $ | 16,313,313 | $ | — | $ | — | $ | 16,313,313 | ||||||||
Money Market Funds | 152,654 | — | — | 152,654 | ||||||||||||
Total | $ | 16,465,967 | $ | — | $ | — | $ | 16,465,967 | ||||||||
WSTCM Credit Select | Level 1 | Level 2 | Level 3 | Total | ||||||||||||
Exchange-Traded Funds | $ | 27,627,195 | $ | — | $ | — | $ | 27,627,195 | ||||||||
Open-End Funds | 25,707,483 | — | — | 25,707,483 | ||||||||||||
Money Market Funds | 1,230,307 | — | — | 1,230,307 | ||||||||||||
Total | $ | 54,564,985 | $ | — | $ | — | $ | 54,564,985 | ||||||||
The Funds did not hold any derivatives or assets or liabilities that were measured at fair value on a recurring basis using significant unobservable inputs (Level 3) as of or during the year ended August 31, 2019.
Share valuation – The NAV per share of each Class of each Fund is calculated as of the close of trading on the NYSE (normally 4:00 p.m., Eastern Time) on each day the NYSE is open for business. The NAV of each Class of each Fund is calculated by dividing the total value of the assets attributable to that Class, less liabilities attributable to that Class, by the number of shares of that Class outstanding. The offering price and redemption price per share of each Class of each Fund is equal to the NAV of such Class.
Investment transactions and investment income– Investment transactions are accounted for on their trade date. Cost of investments sold is determined on a specific identification basis. Dividend income is recorded on the ex-dividend date. Interest income, if any, is accrued as earned and includes amortization of discounts and premiums.
Allocation between Classes – Investment income earned, realized capital gains and losses, and unrealized appreciation and depreciation are allocated daily to each Class of a Fund based upon its proportionate share of total net assets of that Fund. Class-specific
24
WST INVESTMENT TRUST
NOTES TO FINANCIAL STATEMENTS (Continued)
expenses are charged directly to the Class incurring the expense. Common expenses which are not attributable to a specific Class are allocated daily to each Class of shares of a Fund based upon its proportionate share of total net assets of that Fund.
Distributions to shareholders – Dividends arising from net investment income are declared and paid annually to shareholders of the Funds. Net realized short-term capital gains, if any, may be distributed throughout the year and net realized long-term capital gains, if any, are distributed at least once each year. The amount of distributions from net investment income and net realized capital gains are determined in accordance with income tax regulations, which may differ from GAAP, and are recorded on the ex-dividend date. The tax character of distributions paid to shareholders of each Fund during the years ended August 31, 2019 and 2018 was as follows:
Year Ended | Ordinary | Long-Term | Total | |||||||||
WSTCM Sector Select Risk-Managed Fund | ||||||||||||
Institutional Shares | ||||||||||||
August 31, 2019 | $ | 960,866 | $ | 549,283 | $ | 1,510,149 | ||||||
August 31, 2018 | $ | — | $ | 71,980 | $ | 71,980 | ||||||
Investor Shares | ||||||||||||
August 31, 2019 | $ | 56,515 | $ | 32,307 | $ | 88,822 | ||||||
August 31, 2018 | $ | — | $ | 3,996 | $ | 3,996 | ||||||
WSTCM Credit Select Risk-Managed Fund | ||||||||||||
Institutional Shares | ||||||||||||
August 31, 2019 | $ | 629,594 | $ | — | $ | 629,594 | ||||||
August 31, 2018 | $ | 2,849,756 | $ | 9,069 | $ | 2,858,825 | ||||||
Investor Shares | ||||||||||||
August 31, 2019 | $ | 1,961,426 | $ | — | $ | 1,961,426 | ||||||
August 31, 2018 | $ | 3,536,798 | $ | 11,689 | $ | 3,548,487 | ||||||
Estimates– The preparation of financial statements in conformity with GAAP requires management to make estimates and assumptions that affect the reported amounts of assets and liabilities and the disclosure of contingent assets and liabilities as of the date of the financial statements and the reported amounts of income and expenses during the reporting period. Actual results could differ from those estimates.
Federal income tax– Each Fund has qualified and intends to continue to qualify each year as a “regulated investment company” under Subchapter M of the Internal Revenue Code of 1986, as amended (the “Code”). Qualification generally will relieve each Fund of liability for federal income taxes to the extent 100% of its net investment income and net realized capital gains are distributed in accordance with the Code.
25
WST INVESTMENT TRUST
NOTES TO FINANCIAL STATEMENTS (Continued)
In order to avoid imposition of the excise tax applicable to regulated investment companies, it is also each Fund’s intention to declare as dividends in each calendar year at least 98% of its net investment income (earned during the calendar year) and 98.2% of its net realized capital gains (earned during the twelve months ended October 31) plus undistributed amounts from prior years.
The following information is computed on a tax basis for each item as of August 31, 2019:
| WSTCM | WSTCM | ||||||
Tax cost of portfolio investments | $ | 16,231,164 | $ | 54,223,057 | ||||
Gross unrealized appreciation | $ | 318,385 | $ | 381,343 | ||||
Gross unrealized depreciation | (83,582 | ) | (39,415 | ) | ||||
Net unrealized appreciation on investments | 234,803 | 341,928 | ||||||
Undistributed ordinary income | 90,422 | 1,289,153 | ||||||
Accumulated capital and other losses | (1,304,180 | ) | (3,060,656 | ) | ||||
Accumulated deficit | $ | (978,955 | ) | $ | (1,429,575 | ) | ||
The difference between the federal income tax cost of portfolio investments and the financial statement cost of portfolio investments for each Fund is due to certain timing differences in the recognition of capital gains or losses under income tax regulations and GAAP. These “book/tax” differences are temporary in nature and are due to the tax deferral of losses on wash sales.
As of August 31, 2019, the Funds had the following capital loss carryforwards for federal income tax purposes:
| WSTCM | WSTCM | ||||||
Short-term loss carryforwards | $ | 1,297,985 | $ | 2,975,769 | ||||
Long-term loss carryforwards | 6,195 | 84,887 | ||||||
| $ | 1,304,180 | $ | 3,060,656 | |||||
These capital loss carryforwards, which do not expire, may be utilized by the Funds in future years to offset their net realized capital gains, if any.
26
WST INVESTMENT TRUST
NOTES TO FINANCIAL STATEMENTS (Continued)
The Funds recognize the tax benefits or expenses of uncertain tax positions only when the position is “more likely than not” to be sustained assuming examination by tax authorities. Management has reviewed the Funds’ tax positions for all open tax years (generally, three years) and has concluded that no provision for unrecognized tax benefits or expenses is required in these financial statements.
During the year ended August 31, 2019, the Funds did not incur any interest or penalties. Generally, tax authorities can examine tax returns filed during the last three years. Each Fund identifies its major tax jurisdiction as U.S. Federal.
3. Investment Transactions
During the year ended August 31, 2019, the cost of purchases of investment securities and the proceeds from sales of investment securities, other than short-term investments, amounted to $81,592,949 and $80,143,267, respectively, for WSTCM Sector Select Risk-Managed Fund and $272,647,477 and $306,401,149, respectively, for WSTCM Credit Select Risk-Managed Fund.
4. Transactions with Related Parties
The Managing Principal and Chief Investment Officer of Wilbanks, Smith & Thomas Asset Management, LLC, d/b/a WST Capital Management (the “Adviser”) and the chair of its Investment Committee is also the President and a Trustee of the Trust. Certain other officers of the Trust are also officers of the Adviser, or of Ultimus Fund Solutions, LLC (“Ultimus”), the Trust’s administrator, transfer agent, and fund accounting agent.
COMPENSATION OF TRUSTEES
Trustees of the Trust who are affiliated with the Adviser receive no fees from the Funds. Each Fund pays Trustees who are not affiliated with the Adviser a fee of $1,000 each year, plus $500 for each meeting attended in person and $250 for each meeting attended by telephone. The Funds reimburse each Trustee and officer of the Trust for his or her travel and other expenses related to attendance at Board or committee meetings, if any.
Effective September 1, 2019, each Fund will pay the Trustees who are not affiliated with the Adviser a fee of $4,250 each year, plus $500 for each meeting attended in person and $250 for each meeting attended by telephone.
INVESTMENT ADVISORY AGREEMENT
Each Fund’s investments are managed by the Adviser pursuant to the terms of an Investment Advisory Agreement. Under the Investment Advisory Agreement, WSTCM Sector Select Risk-Managed Fund pays the Adviser an advisory fee, computed and accrued daily and paid monthly, at the annual rate of 0.75% of its average daily net assets and WSTCM Credit Select Risk-Managed Fund pays the Adviser an advisory fee, computed and accrued daily and paid monthly, at the annual rate of 0.60% of its average daily net assets.
27
WST INVESTMENT TRUST
NOTES TO FINANCIAL STATEMENTS (Continued)
The Adviser has entered into an Expense Limitation Agreement (“ELA”) with the Trust under which it has agreed to waive its fees and to assume other expenses of WSTCM Sector Select Risk-Managed Fund, if necessary, in an amount that limits the annual operating expenses of the Fund (exclusive of interest, taxes, brokerage fees and commissions, other expenditures that are capitalized in accordance with GAAP, acquired fund fees and expenses, other extraordinary expenses not incurred in the ordinary course of the Fund’s business, and payment, if any, under a Rule 12b-1 Distribution Plan) to not more than 1.25% of the average daily net assets allocable to each Class until January 1, 2021. Accordingly, during the year ended August 31, 2019, the Adviser waived all of its advisory fees and reimbursed $32,864 of other expenses with respect to WSTCM Sector Select Risk-Managed Fund. The Adviser has entered into an ELA with the Trust under which it has agreed to waive its fees and to assume other expenses of WSTCM Credit Select Risk-Managed Fund, if necessary, in an amount that limits the annual operating expenses of the Fund (exclusive of interest, taxes, brokerage fees and commissions, extraordinary expenses, acquired fund fees and expenses and payments, if any, under a Rule 12b-1 distribution plan) to not more than 1.15% of the average daily net assets allocable to each Class until January 1, 2021. There were no fee waivers or expense reimbursements required with respect to WSTCM Credit Select Risk-Managed Fund during the year ended August 31, 2019. Any fee waivers and expense reimbursements by the Adviser are not subject to recoupment. It is expected that each Fund’s ELA will continue from year-to-year provided such continuance is approved by the Board. The Board may terminate the ELA of either Fund at any time. The Adviser may also terminate each Fund’s ELA at the end of the then-current term upon not less than 90 days’ notice to the Trust.
OTHER SERVICE PROVIDERS
Ultimus provides administration, accounting and transfer agency services to the Funds. The Funds pay Ultimus fees in accordance with the agreements for such services. In addition, the Funds pay out-of-pocket expenses including, but not limited to, postage, supplies and costs of pricing the Funds’ portfolio securities.
Under the terms of a Distribution Agreement with the Trust, Foreside Fund Services, LLC (“Foreside”) serves as the principal underwriter and exclusive agent for the distribution of shares of the Funds.
Effective July 2, 2019, pursuant to a Compliance Consulting Agreement with Key Bridge Compliance LLC (“Key Bridge”), Key Bridge provides the Chief Compliance Officer and compliance services to the Trust. The Adviser, not the Funds, pays Key Bridge a fee for these services. Prior to July 2, 2019, pursuant to a Compliance Consulting Agreement with Graydon Compliance Solutions, LLC (“Graydon”), Graydon provided the Chief Compliance Officer and compliance services to the Trust. The Adviser, not the Funds, paid Graydon a fee for these services.
28
WST INVESTMENT TRUST
NOTES TO FINANCIAL STATEMENTS (Continued)
5. Distribution Plan
Each Fund has adopted a Distribution Plan (the “Plan”) in accordance with Rule 12b-1 under the 1940 Act that allows Investor Shares of each Fund to pay for certain expenses related to the distribution of such Shares, including, but not limited to, payments to securities dealers and other persons (including Foreside) who are engaged in the sale of Investor Shares of the Funds or who render shareholder support services not otherwise provided by Ultimus. The annual limitation for payment of expenses pursuant to the Plan is 0.25% per annum of each Fund’s average daily net assets allocable to Investor Shares. During the year ended August 31, 2019, $1,825 and $120,789 of expenses were incurred under the Plan by Investor Shares of WSTCM Sector Select Risk-Managed Fund and WSTCM Credit Select Risk-Managed Fund, respectively.
6. Investment in Other Investment Companies
Each Fund may invest a significant portion of its assets in shares of one or more investment companies, including ETFs, open-end mutual funds and money market mutual funds. The Funds will incur additional indirect expenses (acquired fund fees and expenses) to the extent it invests in shares of other investment companies. As of August 31, 2019, WSTCM Sector Select Risk-Managed Fund had 99.4% of the value of its net assets invested in ETFs; in addition, 28.2% of the value of WSTCM Sector Select Risk-Managed Fund’s net assets is invested in iShares Short Treasury Bond ETF (“SHV”) that invests in U.S. Treasury bonds with remaining maturities between one month and one year. The financial statements of SHV can be found at www.sec.gov. As of August 31, 2019, WST Credit Select Risk-Managed Fund had 50.6% of the value of its net assets invested in ETFs and had 47.1% of the value of its net assets invested in open-end mutual funds.
7. Contingencies and Commitments
The Funds indemnify the Trust’s officers and Trustees for certain liabilities that might arise from their performance of their duties to the Funds. Additionally, in the normal course of business, the Funds enter into contracts that contain a variety of representations and warranties and which provide general indemnifications. The maximum exposure under these arrangements is unknown, as this would involve future claims that may be made against the Funds that have not yet occurred.
29
WST INVESTMENT TRUST
NOTES TO FINANCIAL STATEMENTS (Continued)
8. Subsequent Events
The Funds are required to recognize in the financial statements the effects of all subsequent events that provide additional evidence about conditions that existed as of the date of the Statements of Assets and Liabilities. For non-recognized subsequent events that must be disclosed to keep the financial statements from being misleading, the Funds are required to disclose the nature of the event as well as an estimate of its financial effect, or a statement that such an estimate cannot be made. Management has evaluated subsequent events through the issuance of these financial statements and has noted no such events, except as noted in the following paragraph:
Effective October 1, 2019, WSTCM Sector Select Risk-Managed Fund adopted a new principal investment strategy and changed its name to WSTCM Global Allocation Risk-Managed Fund.
30
WST INVESTMENT TRUST
REPORT OF INDEPENDENT REGISTERED PUBLIC ACCOUNTING FIRM
To the Shareholders and Board of Trustees of
WST Investment Trust
Opinion on the Financial Statements
We have audited the accompanying statements of assets and liabilities, including the schedules of investments, of WST Investment Trust, comprising WSTCM Sector Select Risk-Managed Fund and WSTCM Credit Select Risk-Managed Fund (the “Funds”), as of August 31, 2019, and the related statements of operations for the year then ended, the statements of changes in net assets for each of the two years in the period then ended, including the related notes, and the financial highlights for each of the five periods in the period then ended (collectively referred to as the “financial statements”). In our opinion, the financial statements present fairly, in all material respects, the financial position of the each of the Funds as of August 31, 2019, the results of their operations for the year then ended, and the changes in their net assets and their financial highlights for each of the periods indicated above, in conformity with accounting principles generally accepted in the United States of America.
Basis for Opinion
These financial statements are the responsibility of the Funds’ management. Our responsibility is to express an opinion on the Funds’ financial statements based on our audits. We are a public accounting firm registered with the Public Company Accounting Oversight Board (United States) (“PCAOB”) and are required to be independent with respect to the Funds in accordance with the U.S. federal securities laws and the applicable rules and regulations of the Securities and Exchange Commission and the PCAOB.
We conducted our audits in accordance with the standards of the PCAOB. Those standards require that we plan and perform the audit to obtain reasonable assurance about whether the financial statements are free of material misstatement, whether due to error or fraud.
Our audits included performing procedures to assess the risks of material misstatement of the financial statements, whether due to error or fraud, and performing procedures that respond to those risks. Such procedures included examining, on a test basis, evidence regarding the amounts and disclosures in the financial statements. Our procedures included confirmation of securities owned as of August 31, 2019, by correspondence with the custodian and brokers. Our audits also included evaluating the accounting principles used and significant estimates made by management, as well as evaluating the overall presentation of the financial statements. We believe that our audits provide a reasonable basis for our opinion.
We have served as the Funds’ auditor since 2013.
COHEN & COMPANY, LTD.
Chicago, Illinois
October 30, 2019
31
WST INVESTMENT TRUST
ABOUT YOUR FUNDS’ EXPENSES (Unaudited)
We believe it is important for you to understand the impact of costs on your investment. All mutual funds have operating expenses. As a shareholder of the Funds, you incur ongoing costs, including management fees, class specific expenses (such as Rule 12b-1 distribution fees) and other operating expenses. The following examples are intended to help you understand your ongoing costs (in dollars) of investing in the Funds and to compare these costs with the ongoing costs of investing in other mutual funds.
A mutual fund’s ongoing costs are expressed as a percentage of its average net assets. This figure is known as the expense ratio. The expenses in the table that follow are based on an investment of $1,000 made at the beginning of the most recent period (March 1, 2019) and held until the end of the period (August 31, 2019).
The table that follows illustrates each Fund’s ongoing costs in two ways:
Actual fund return – This section helps you to estimate the actual expenses that you paid over the period. The “Ending Account Value” shown is derived from each Fund’s actual return, and the fourth column shows the dollar amount of operating expenses that would have been paid by an investor who started with $1,000 in the Funds. You may use the information here, together with the amount you invested, to estimate the expenses that you paid over the period.
To do so, simply divide your account value by $1,000 (for example, an $8,600 account value divided by $1,000 = 8.6), then multiply the result by the number given for the Fund under the heading “Expenses Paid During Period.”
Hypothetical 5% return – This section is intended to help you compare each Fund’s ongoing costs with those of other mutual funds. It assumes that each Fund had an annual return of 5% before expenses during the period shown, but that the expense ratio is unchanged. In this case, because the return used is not the Funds’ actual return, the results do not apply to your investment. The example is useful in making comparisons because the SEC requires all mutual funds to calculate expenses based on a 5% return. You can assess each Fund’s ongoing costs by comparing this hypothetical example with the hypothetical examples that appear in shareholder reports of other funds.
Note that expenses shown in the table are meant to highlight and help you compare ongoing costs only. The Funds do not charge transaction fees, such as purchase or redemption fees, and do not charge a “sales load.” The calculations assume no shares were bought or sold during the period. Your actual costs may have been higher or lower, depending on the amount of your investment and the timing of any purchases or redemptions.
More information about each Fund’s expenses can be found in this report. For additional information on operating expenses and other shareholder costs, please refer to each Fund’s prospectus.
32
WST INVESTMENT TRUST
ABOUT YOUR FUNDS’ EXPENSES (Unaudited) (Continued)
WSTCM Sector Select | Beginning | Ending | Net | Expenses |
Institutional Class | ||||
Based on Actual Fund Return | $1,000.00 | $ 1,000.00 | 1.25% | $6.30 |
Based on Hypothetical 5% Return (before expenses) | $1,000.00 | $ 1,018.90 | 1.25% | $6.36 |
Investor Class | ||||
Based on Actual Fund Return | $1,000.00 | $ 997.90 | 1.50% | $7.55 |
Based on Hypothetical 5% Return (before expenses) | $1,000.00 | $ 1,017.64 | 1.50% | $7.63 |
WSTCM Credit Select | Beginning | Ending | Net | Expenses |
Institutional Class | ||||
Based on Actual Fund Return | $1,000.00 | $ 1,023.10 | 1.14% | $5.83 |
Based on Hypothetical 5% Return (before expenses) | $1,000.00 | $ 1,019.45 | 1.14% | $5.81 |
Investor Class | ||||
Based on Actual Fund Return | $1,000.00 | $ 1,022.20 | 1.37% | $6.97 |
Based on Hypothetical 5% Return (before expenses) | $1,000.00 | $ 1,018.31 | 1.37% | $6.96 |
(a) | Annualized, based on each Fund’s most recent one-half year expenses. |
(b) | Expenses are equal to each Fund’s annualized net expense ratio multiplied by the average account value over the period, multiplied by 184/365 (to reflect the one-half year period). |
33
WST INVESTMENT TRUST
OTHER INFORMATION (Unaudited)
The Trust files a complete listing of each Fund’s portfolio holdings with the SEC as of the end of the first and third quarters of each fiscal year on Form N-Q. These filings are available free of charge upon request by calling the Trust toll-free at 1-866-515-4626. Furthermore, you may obtain a copy of these filings on the SEC’s website at www.sec.gov.
A description of the policies and procedures that the Funds use to determine how to vote proxies relating to portfolio securities is available without charge upon request by calling the Trust toll-free at 1-866-515-4626, or on the SEC’s website at www.sec.gov. Information regarding how the Funds voted proxies relating to portfolio securities during the most recent 12-month period ended June 30 is available without charge upon request by calling the Trust toll-free at 1-866-515-4626, or on the SEC’s website at www.sec.gov.
FEDERAL TAX INFORMATION (Unaudited)
For the fiscal year ended August 31, 2019, WSTCM Sector Select Rick-Managed Fund designated $581,590 as long-term capital gain distributions.
Qualified Dividend Income – The WSTCM Sector Select Risk-Managed Fund and the WSTCM Credit Select Risk-Managed Fund both designate none of their ordinary income dividends as qualified dividend income eligible for the reduced tax rate of 15%.
Dividends Received Deduction – Corporate shareholders are generally entitled to take the dividends received deduction on the portion of the WSTCM Sector Select Risk-Managed Fund and the WSTCM Credit Select Risk-Managed Fund’s ordinary income dividends that qualifies under tax law. For each Fund’s fiscal year ended August 31, 2019, none of ordinary income dividends qualified for the corporate dividends received deduction.
This report and the financial statements contained herein are provided for the general information of the shareholders of the WSTCM Funds. This report is not authorized for distribution to prospective investors in the Fund unless preceded or accompanied by an effective prospectus.
WSTCM Funds are distributed by Foreside Fund Services, LLC
34
WST INVESTMENT TRUST
BOARD OF TRUSTEES AND EXECUTIVE OFFICERS (Unaudited)
The Board of Trustees has overall responsibility for management of the Trust’s affairs. The Trustees serve during the lifetime of the Trust and until its termination, or until death, resignation, retirement, or removal. The Trustees, in turn, elect the officers of the Trust to actively supervise its day-to-day operations. The officers have been elected for an annual term. The following are the Trustees and executive officers of the Trust. The address for each Trustee and executive officer of the Trust is 225 Pictoria Drive, Suite 450, Cincinnati, Ohio 45246.
Name and | Length | Position(s) | Principal | Number | Directorships of |
Interested Trustees: | |||||
Wayne F. Wilbanks* | Since July 2013 | Trustee and President | Managing Principal and Chief Investment Officer of Wilbanks, Smith & Thomas, LLC. | 2 | None |
Independent Trustees: | |||||
Thomas G. Douglass | Since June 2013 | Trustee | Principal of Douglass and Douglass, Attorneys. | 2 | Independent Trustee of Centaur Mutual Funds Trust for its one series. |
James H. Speed, Jr. | Since June 2013 | Trustee | Retired, Private Investor (2016 to present); President and CEO of NC Mutual Life Insurance Company (May 2003 to December 2015). | 2 | Independent Trustee of Centaur Mutual Funds Trust for its one series, Chesapeake Investment Trust for its one series, Hillman Capital Management Investment Trust for its one series, Brown Capital Management Funds for its four series, and Starboard Investment Trust for its seventeen series (all registered investment companies); Director of M&F Bancorp; Director of Investors Title Company. |
* | Mr. Wilbanks is considered an “interested person” of the Trust within the meaning of Section 2(a)(19) of the 1940 Act because he is an employee of the Adviser. |
35
WST INVESTMENT TRUST
BOARD OF TRUSTEES AND EXECUTIVE OFFICERS (Unaudited) (Continued)
Name and | Length | Position(s) | Principal Occupation(s) |
Executive Officers: | |||
Matthew A. | Since | Chief | Chief Executive Officer of Key Bridge Compliance, LLC (August 2018 to present); Co-founder and Chairman of F/m Acceleration, LLC (June 2019 to present); President and Chief Executive Officer of JCM Financial Services Consulting, LLC (November 2018 to present); Chief Executive Officer of Graydon Compliance Solutions, LLC (March 2014 to November 2018); Of Counsel of Graydon Head & Ritchey LLP (September 2012 to November 2018); and Adjunct Professor of Business Law of Xavier University (2008 to 2015). |
Roger H. Scheffel, Jr. | Since | Vice | Portfolio manager of the Adviser. |
Stephen L. Preston | Since | AML | Vice President and Chief Compliance Officer of Ultimus Fund Distributors, LLC and Assistant Vice President of Ultimus Fund Solutions, LLC. |
Simon H. Berry | Since | Secretary | Senior Attorney at Ultimus Fund Solutions, LLC (2016 to present); Staff Attorney Supervisor, Kentucky Department of Financial Institutions (2009 to 2016). |
Theresa M. Bridge | Since | Treasurer | Director of Financial Administration of Ultimus Fund Solutions, LLC. |
Additional information about members of the Board and executive officers is available in each Fund’s Statement of Additional Information (“SAI”). To obtain a free copy of the SAI, please call toll-free 1-866-515-4626.
36
This page intentionally left blank.
| Item 2. | Code of Ethics. |
As of the end of the period covered by this report, the registrant has adopted a code of ethics that applies to the registrant’s principal executive officer, principal financial officer, principal accounting officer or controller, or persons performing similar functions, regardless of whether these individuals are employed by the registrant or a third party. Pursuant to Item 13(a)(1), a copy of registrant’s code of ethics is filed as an exhibit to this Form N-CSR. During the period covered by this report, the code of ethics has not been amended, and the registrant has not granted any waivers, including implicit waivers, from the provisions of the code of ethics.
| Item 3. | Audit Committee Financial Expert. |
The registrant’s board of trustees has determined that the registrant has at least one audit committee financial expert serving on its audit committee. The name of the audit committee financial expert is James H. Speed Jr. Mr. Speed is “independent” for purposes of this Item.
| Item 4. | Principal Accountant Fees and Services. |
| (a) | Audit Fees. The aggregate fees billed for professional services rendered by the principal accountant for the audit of the registrant’s annual financial statements or for services that are normally provided by the accountant in connection with statutory and regulatory filings or engagements were $28,000 and $27,000 with respect to the registrant’s fiscal years ended August 31, 2019 and 2018, respectively. |
| (b) | Audit-Related Fees. No fees were billed in either of the last two fiscal years for assurance and related services by the principal accountant that are reasonably related to the performance of the audit of the registrant’s financial statements and are not reported under paragraph (a) of this Item. |
| (c) | Tax Fees. The aggregate fees billed for professional services rendered by the principal accountant for tax compliance, tax advice, and tax planning were $6,000 and $6,000 with respect to the registrant’s fiscal years ended August 31, 2019 and 2018, respectively. The services comprising these fees are the preparation of the registrant’s federal income and excise tax returns. |
| (d) | All Other Fees. No fees were billed in either of the last two fiscal years for products and services provided by the principal accountant, other than the services reported in paragraphs (a) through (c) of this Item. |
| (e)(1) | The audit committee has not adopted pre-approval policies and procedures described in paragraph (c)(7) of Rule 2-01 of Regulation S-X. |
| (e)(2) | None of the services described in paragraph (b) through (d) of this Item were approved by the audit committee pursuant to paragraph (c)(7)(i)(C) of Rule 2-01 of Regulation S-X. |
| (f) | Less than 50% of hours expended on the principal accountant’s engagement to audit the registrant’s financial statements for the most recent fiscal year were attributed to work performed by persons other than the principal accountant’s full-time, permanent employees. |
| (g) | With respect to the fiscal years ended August 31, 2019 and 2018, aggregate non-audit fees of $6,000 and $6,000, respectively, were billed by the registrant’s principal accountant for services rendered to the registrant. No non-audit fees were billed in either of the last two fiscal years by the registrant’s principal accountant for services rendered to the registrant’s investment adviser (not including any sub-adviser whose role is primarily portfolio management and is subcontracted with or overseen by another investment adviser), and any entity controlling, controlled by, or under common control with the adviser that provides ongoing services to the registrant. |
| (h) | The principal accountant has not provided any non-audit services to the registrant’s investment adviser (not including any sub-adviser whose role is primarily portfolio management and is subcontracted with or overseen by another investment adviser), and any entity controlling, controlled by, or under common control with the investment adviser that provides ongoing services to the registrant. |
| Item 5. | Audit Committee of Listed Registrants. |
Not applicable
| Item 6. | Schedule of Investments. |
| (a) | See Schedule I (Investments in securities of unaffiliated issuers) |
| (b) | Not applicable |
| Item 7. | Disclosure of Proxy Voting Policies and Procedures for Closed-End Management Investment Companies. |
Not applicable
| Item 8. | Portfolio Managers of Closed-End Management Investment Companies. |
Not applicable
| Item 9. | Purchases of Equity Securities by Closed-End Management Investment Company and Affiliated Purchasers. |
Not applicable
| Item 10. | Submission of Matters to a Vote of Security Holders. |
The registrant’s Committee of Independent Trustees shall review shareholder recommendations for nominations to fill vacancies on the registrant’s board of trustees if such recommendations are submitted in writing and addressed to the Committee at the registrant’s offices. The Committee may adopt, by resolution, a policy regarding its procedures for considering candidates for the board of trustees, including any recommended by shareholders.
| Item 11. | Controls and Procedures. |
(a) Based on their evaluation of the registrant’s disclosure controls and procedures (as defined in Rule 30a-3(c) under the Investment Company Act of 1940) as of a date within 90 days of the filing date of this report, the registrant’s principal executive officer and principal financial officer have concluded that such disclosure controls and procedures are reasonably designed and are operating effectively to ensure that material information relating to the registrant, including its consolidated subsidiaries, is made known to them by others within those entities, particularly during the period in which this report is being prepared, and that the information required in filings on Form N-CSR is recorded, processed, summarized, and reported on a timely basis.
(b) There were no changes in the registrant’s internal control over financial reporting (as defined in Rule 30a-3(d) under the Investment Company Act of 1940) that occurred during the second fiscal quarter of the period covered by this report that have materially affected, or are reasonably likely to materially affect, the registrant’s internal control over financial reporting.
| Item 12. | Disclosure of Securities Lending Activities for Closed-End Management Investment Companies. |
Not applicable
| Item 13. | Exhibits. |
File the exhibits listed below as part of this Form. Letter or number the exhibits in the sequence indicated.
(a)(1) Any code of ethics, or amendment thereto, that is the subject of the disclosure required by Item 2, to the extent that the registrant intends to satisfy the Item 2 requirements through filing of an exhibit: Attached hereto
(a)(2) A separate certification for each principal executive officer and principal financial officer of the registrant as required by Rule 30a-2(a) under the Act (17 CFR 270.30a-2(a)): Attached hereto
(a)(3) Any written solicitation to purchase securities under Rule 23c-1 under the Act (17 CFR 270.23c-1) sent or given during the period covered by the report by or on behalf of the registrant to 10 or more persons: Not applicable
(a)(4) Change in the registrant’s independent public accountants. Not applicable
(b) Certifications required by Rule 30a-2(b) under the Act (17 CFR 270.30a-2(b)): Attached hereto
| Exhibit 99.CODE ETH | Code of Ethics |
| Exhibit 99.CERT | Certifications required by Rule 30a-2(a) under the Act |
| Exhibit 99.906CERT | Certifications required by Rule 30a-2(b) under the Act |
SIGNATURES
Pursuant to the requirements of the Securities Exchange Act of 1934 and the Investment Company Act of 1940, the registrant has duly caused this report to be signed on its behalf by the undersigned, thereunto duly authorized.
| (Registrant) | WST Investment Trust | ||
| By (Signature and Title)* | /s/ Wayne F. Wilbanks | ||
| Wayne F. Wilbanks, President | |||
| Date | November 4, 2019 | ||
| Pursuant to the requirements of the Securities Exchange Act of 1934 and the Investment Company Act of 1940, this report has been signed below by the following persons on behalf of the registrant and in the capacities and on the dates indicated. | |||
| By (Signature and Title)* | /s/ Wayne F. Wilbanks | ||
| Wayne F. Wilbanks, President | |||
| Date | November 4, 2019 | ||
| By (Signature and Title)* | /s/ Theresa M. Bridge | ||
| Theresa M. Bridge, Treasurer and Principal Accounting Officer | |||
| Date | November 4, 2019 | ||
| * | Print the name and title of each signing officer under his or her signature. |