united states
securities and exchange commission
washington, d.c. 20549
form n-csr
certified shareholder report of registered management
investment companies
Investment Company Act file number 811-22865
Forethought Variable Insurance Trust
(Exact name of registrant as specified in charter)
10 West Market Street, Suite 2300, Indianapolis, Indiana 46204
(Address of principal executive offices) (Zip code)
The Corporation Trust Company
1209 Orange Street Wilmington, DE 19801
(Name and address of agent for service)
Registrant's telephone number, including area code: 317-223-2703
Date of fiscal year end: 12/31
Date of reporting period:6/30/19
Item 1. Reports to Stockholders.
| |
 |
| |
| |
| Semi-Annual Report |
| |
| June 30, 2019 |
| |
| Global Atlantic Portfolios |
| Global Atlantic BlackRock Allocation Portfolio |
| Global Atlantic BlackRock Disciplined Core Portfolio |
| Global Atlantic BlackRock Disciplined Growth Portfolio |
Global Atlantic BlackRock Disciplined International Core Portfolio
Global Atlantic BlackRock Disciplined Mid Cap Growth Portfolio
Global Atlantic BlackRock Disciplined Small Cap Portfolio
Global Atlantic BlackRock Disciplined U.S. Core Portfolio
Global Atlantic BlackRock Disciplined Value Portfolio
Global Atlantic BlackRock High Yield Portfolio |
Global Atlantic Goldman Sachs Core Fixed Income Portfolio
Global Atlantic Goldman Sachs Global Equity Insights Portfolio
Global Atlantic Goldman Sachs Large Cap Growth Insights Portfolio
Global Atlantic Goldman Sachs Mid Cap Value Insights Portfolio |
| |
| Class I and Class II shares |
| |
| Each a separate series of the Forethought Variable Insurance Trust |
| Distributed by Global Atlantic Distributors, LLC |
| Member FINRA |
| Dear Shareholders/Contract Owners: |
While many global equity markets finished 2018 in correction territory (a decline of greater than 20%), most markets erased those losses during the first six months of 2019 with the S&P 500 posting its strongest first half return (up 18.54%) since 1997. The first half of 2019 was not without market volatility, however, as May saw a significant decline in major equity markets driven primarily by continued trade tensions between the U.S. and its major trading partners, mainly China and Mexico. The resulting concerns over global growth, as well as some weakness in U.S. manufacturing, housing, and consumer spending data, caused U.S. bond yields to drop significantly lower, with the U.S. 10-year treasury yield finishing the first half of the year at 2.00%, a level not seen since 2016 and down from a recent high of 3.24% in November 2018, a decline of 124 basis points. Equity markets recovered significantly in June, again eliminating most, if not all, of the declines experienced in May.
After raising interest rates three times in 2017 and four times in 2018, the U.S. Federal Reserve (the “Fed”) has yet to raise rates in 2019. While the Fed indicated in December 2018 that it might raise rates on two occasions in 2019, it has since changed its position and is now unlikely, in our view, to raise rates for the remainder of this year. Domestic investment grade bonds, as measured by the Bbg Barclays US Agg Bond Index, were up 6.11% in the first half of 2019 (as compared to up 0.01% in 2018), while the ICE BofAML U.S. High Yield Index rose 10.16% during the period (as compared to down -2.26% in 2018).
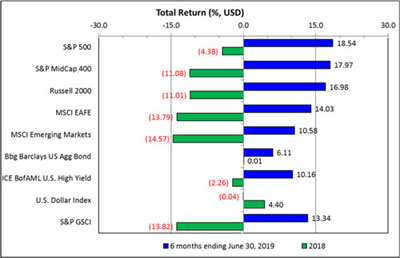
U.S. equity indices fared better than international markets generally, led by the S&P 500 up 18.54% (as compared to down -4.38% in 2018), followed by the S&P MidCap 400 and the Russell 2000 up 17.97% and 16.98%, respectively (as compared to down -11.08% and -11.01%, respectively in 2018). Internationally, the MSCI EAFE and the MSCI Emerging Markets were up 14.03% and 10.58%, respectively (as compared to down -13.79% and -14.57%, respectively in 2018).
Commodities, as measured by the S&P GSCI Index, were up 13.34% in the first six months of 2019 (as compared to down -13.82% in 2018), led by a rise of 22.84% in oil (as compared to down -14.57% in 2018) and an increase of 9.86% in gold (as compared to down -1.94% in 2018). The U.S. dollar was down marginally (-0.04%) during the period (as compared to an increase of 4.40% in 2018).
For asset allocation funds, periods of significant fluctuations in volatility and returns meant that asset allocation decisions, and the timing of those decisions, were important drivers of performance during the period. The following pages contain Management’s discussion of recent Portfolio performance. Thank you for investing in the Global Atlantic Portfolios.
| Sincerely, | |
| | |
 |  |
| | |
| Eric D. Todd, CFA | Cameron Jeffreys, CFA |
| President | Senior Vice President |
| Global Atlantic Investment Advisors, LLC | Global Atlantic Investment Advisors, LLC |
| Portfolio | | Benchmark |
| Global Atlantic BlackRock Allocation Portfolio | | S&P Target Risk® Growth Index |
| Global Atlantic BlackRock Disciplined Core Portfolio | | S&P 500® Index |
| Global Atlantic BlackRock Disciplined Growth Portfolio | | Russell 1000® Growth Index |
| Global Atlantic BlackRock Disciplined International Core Portfolio | | MSCI ACWI ex-USA Index |
| Global Atlantic BlackRock Disciplined Mid Cap Growth Portfolio | | Russell Midcap® Growth Index |
| Global Atlantic BlackRock Disciplined Small Cap Portfolio | | Russell 2000® Index |
| Global Atlantic BlackRock Disciplined U.S. Core Portfolio | | S&P 500® Index |
| Global Atlantic BlackRock Disciplined Value Portfolio | | Russell 1000® Value Index |
| Global Atlantic BlackRock High Yield Portfolio | | ICE BofAML BB-B U.S. High Yield Constrained Index |
| Global Atlantic Goldman Sachs Core Fixed Income Portfolio | | Bloomberg Barclays US Aggregate Bond Index |
| Global Atlantic Goldman Sachs Global Equity Insights Portfolio | | MSCI World Standard Index |
| Global Atlantic Goldman Sachs Large Cap Growth Insights Portfolio | | Russell 1000® Growth Index |
| Global Atlantic Goldman Sachs Mid Cap Value Insights Portfolio | | Russell Midcap® Value Index |
The indices shown are for informational purposes only and are not reflective of any investment. As it is not possible to invest directly in the indices, the data shown does not reflect or compare features of an actual investment, such as its objectives, costs and expenses, liquidity, safety, guarantees or insurance, fluctuation of principal or return, or tax features. Past performance is no guarantee of future results.
This report contains the current opinions of Global Atlantic Investment Advisors, LLC and/or sub-advisers at the time of its publication and should not be considered to be investment advice or a recommendation of any particular security, strategy or investment product. Such opinions are subject to change without notice and securities described herein may no longer be included in, or may at any time be removed from, a Portfolio’s portfolio. This report is distributed for informational purposes only. Information contained herein has been obtained from sources believed to be reliable, but not guaranteed.
Index Definitions:
S&P Target Risk® Growth Index.An index that increases exposure to equities, while also providing limited fixed income exposure to diversify risk.
Bloomberg Barclays US Aggregate Bond Index (“Bbg Barclays US Agg Bond”).An index weighted according to market capitalization and includes, among other categories, Treasury securities, mortgage backed securities, government agency bonds and corporate bonds. To be included in the index, bonds must be rated investment grade by Moody’s and Standard and Poor’s.
ICE BofAML BB-B U.S. High Yield Constrained Index.An index that contains all securities in the ICE BofAML U.S. High Yield Index rated BB1 through B3, based on an average of Moody’s, S&P, and Fitch, but caps issuer exposure at 2%. Index constituents are capitalization-weighted, based on their current amount outstanding, provided the total allocation to an individual issuer does not exceed 2%.
ICE BofAML High Yield Cash Pay MV USI Index (“ICE BofAML U.S. High Yield”).An index that tracks the performance of US dollar denominated, below investment grade corporate debt, currently in a coupon paying period, which is publically issued in the US domestic market.
Chicago Board Options Exchange S&P 500 Volatility Index (“VIX”).An index that reflects a market estimate of future volatility, based on the weighted average of the implied volatilities for a wide range of strikes.
MSCI ACWI ex-USA Total Return Index.A free float-adjusted market capitalization index designed to measure the combined equity market performance of developed and emerging market countries, excluding the United States.
MSCI EAFE Total Return Index (“MSCI EAFE”).An index created by Morgan Stanley Capital International (MSCI) that serves as a benchmark of the performance in major developed international equity markets as represented by 21 major MSCI indexes from Europe, Australasia and the Far East.
MSCI Emerging Markets Total Return Index (“MSCI Emerging Markets”).An index created by MSCI that is designed to measure equity market performance in global emerging markets. The index is unmanaged and not available for direct investment. The Emerging Markets Index is a float-adjusted market capitalization index that consists of indices in 24
emerging economies: Brazil, Chile, China, Colombia, Czech Republic, Egypt, Greece, Hungary, India, Indonesia, Korea, Malaysia, Mexico, Pakistan, Peru, Philippines, Poland, Russia, Qatar, South Africa, Taiwan, Thailand, Turkey, and United Arab Emirates.
MSCI World Standard Index.An index that represents large- and mid-cap equity performance across 23 developed markets countries, covering approximately 85% of the free float-adjusted market capitalization in each. The index offers a broad global equity benchmark, without emerging markets exposure.
Russell 1000® Growth Total Return Index.An unmanaged index of common stock prices that measures the performance of those Russell 1000®Index companies with higher price-to-book ratios and higher forecasted growth values.
Russell 2000 Total Return Index (“Russell 2000”).An index measuring the performance approximately 2,000 small-cap companies in the Russell 3000 Index, which is made up of 3,000 of the biggest U.S. stocks. The Russell 2000 serves as a benchmark for small-cap stocks in the United States.
Russell 3000 Total Return Index.An index measuring the performance of approximately 3,000 of the largest U.S. companies.
Russell Midcap® Growth Total Return Index.An unmanaged index that consists of the bottom 800 securities of the Russell 1000®Index with greater-than-average growth orientation as ranked by total market capitalization. Securities in this index generally have higher price-to-book and price-to-earnings ratios, lower dividend yields and higher forecasted growth values.
Russell Midcap® Value Total Return Index.An unmanaged index of common stock prices that measures the performance of those Russell Midcap companies with lower price-to-book ratios and lower forecasted growth values.
Russell 1000® Value Total Return Index.An index that measures the performance of large- and mid-capitalization value sectors of the U.S. equity market. It is a subset of the Russell 1000®Index, which measures the performance of the large-capitalization sector of the U.S. equity market.
S&P MidCap 400 Total Return Index (“S&P MidCap 400”).A capitalization-weighted index which measures the performance of the mid-range sector of the U.S. stock market.
S&P 500 Total Return Index (“S&P 500”).A market capitalization weighted price index composed of 500 widely held U.S. common stocks. Frequently used as a measure of U.S. stock market performance.
S&P GSCI Total Return Index (“S&P GSCI”).A broad based, production weighted index meant to be representative of the global commodity market beta. The S&P Goldman Sachs Commodity Index (GSCI) consists of 24 commodity futures on physical commodities across five sectors; energy, agriculture, livestock, industrial metals, and precious metals.
U.S. Dollar Index.An index that indicates the general international value of the U.S. Dollar by averaging the exchange rates between the U.S. Dollar and major world currencies.
2644719.1
| Table of Contents |
| | | |
| ■ | Global Atlantic Portfolio Reviews | 5 – 30 |
| | | |
| ■ | Financial Statements: | |
| | | |
| | Portfolios of Investments | 31 – 161 |
| | | |
| | Statements of Assets and Liabilities | 162 – 165 |
| | | |
| | Statements of Operations | 166 – 169 |
| | | |
| | Statements of Changes in Net Assets | 170 – 176 |
| | | |
| | Financial Highlights | 177 – 201 |
| | | |
| ■ | Notes to Financial Statements | 202 – 225 |
| | | |
| ■ | Expense Examples | 226 – 227 |
| | | |
| ■ | Privacy Notice | 228 – 229 |
| | | |
| ■ | Proxy Voting Policy | Back Cover |
| | | |
| ■ | Portfolio Holdings | Back Cover |
| Global Atlantic BlackRock Allocation Portfolio |
| Portfolio Review (Unaudited) |
| June 30, 2019 |
The Portfolio seeks to provide total return.
The Portfolio is sub-advised by BlackRock Investment Management, LLC (“BlackRock”).
How did the Portfolio perform during the period?
During the first six months of 2019, the Class I shares of Global Atlantic BlackRock Allocation Portfolio outperformed its reference benchmark, the S&P Target Risk® Growth Index. The Portfolio posted a return of 13.20% compared to a benchmark return of 11.91%, a difference of 129 basis points. The following discussion of relative performance pertains to this benchmark.
What factors and allocation decisions influenced the Portfolio’s performance?
While many global equity markets finished 2018 in correction territory (a decline of greater than 20%), most markets erased those losses during the first six months of 2019 with the S&P 500 posting its strongest first half return (up 18.54%) since 1997. The S&P MidCap 400 and the Russell 2000 indices were both up 17-18% during the period, while the MSCI EAFE and MSCI Emerging Markets indices also posted strong returns, up 11-14%. The fixed income market also rallied, highlighted by significant decline in the 10-year U.S. Treasury yield to 2.00% at period end, a level not seen since 2016 and down from a recent high of 3.24% in November 2018. The first half of 2019 was not without market volatility, however, as May saw a significant decline in major equity markets driven primarily by continued trade tensions between the U.S. and its major trading partners, mainly China and Mexico. While bond yields remained low during this volatile period, equity markets recovered significantly in June, again eliminating most, if not all, of the declines experienced in May.
The Portfolio retained an overweight stance to equities over fixed income resulting from the portfolio management team’s expectation of a sharp upward reversal in equities in the first half of 2019 following the sharp selloff in the fourth quarter of 2018. Within equities, the Portfolio was biased towards U.S. equities relative to developed market and emerging markets (EM) equities, which contributed to performance during the period. Within U.S. equities, the Portfolio was biased toward technology stocks as well as minimum volatility and momentum factors, all of which outperformed the S&P 500 during the first 6 months of 2019. Internationally, the Portfolio increased its allocation to emerging market equities during the period, effectively removing the Portfolio’s underweight position, however the resumption of trade tensions in May caused EM equities to decline significantly, thus detracting from performance. Developed market international equities was the Portfolio’s largest underweight during the period, driven by a negative view on the future earnings growth potential of the sector.
Within fixed income, the Portfolio was underweight duration and higher in credit quality where possible. The portfolio management team’s view is that given the significant decline in interest rates during the period, there is a greater risk that rates, particularly long-term rates, could rise meaningfully with a small improvement in U.S. economic data, a policy change by the U.S. Federal Reserve, or other factors, which would have a negative impact on fixed income performance. This view detracted from performance during the first six months of 2019 as interest rates remained low, resulting in a rally in longer duration and lower rated bonds.
How was the Portfolio positioned at period end?
At period end, the Portfolio was positioned with 60.5% in equities, and 39.5% in fixed income securities. Of the equity weights, international stocks commanded a 14.1% allocation, which broke down into 5.4% EM and 8.7% developed markets ex-US stocks. Of the remaining equity allocation, 46.3% was dedicated to U.S. equities, primarily large cap, with the largest portion of this (25.3%) in S&P 500 stocks. The fixed income portion of the Portfolio reflected an underweight position in mortgages (3.9%) and overweight positions in credit (20.6%, all investment grade) and U.S. Treasuries (15%). The U.S. Treasury allocation was spread across the curve, with no specific overweight positions.
2658352.2
| Global Atlantic BlackRock Allocation Portfolio |
| Portfolio Review |
| June 30, 2019 (Unaudited) |
The Portfolio’s performance figures* for the periods ended June 30, 2019 as compared to its benchmark:
| | | | Annualized |
| | Six | One | Performance |
| | Months | Year | Since Inception** |
| Global Atlantic BlackRock Allocation Portfolio | | | |
| Class I | 13.20% | 7.49% | 5.57% |
| Class II | 13.11% | 7.19% | 5.34% |
| S&P Target Risk® Growth Index (Total Return) | 11.91% | 6.25% | 4.60% |
| * | The performance data quoted is historical. Past performance is no guarantee of future results. Current performance may be higher or lower than the performance data quoted. The principal value and investment return of an investment will fluctuate so that your shares, when redeemed, may be worth more or less than their original cost. Total returns would have been lower absent fee waivers by the Adviser. Performance figures for periods greater than one year are annualized. The returns shown do not reflect the deduction of taxes that a shareholder may pay on Portfolio distributions or on the redemption of Portfolio shares, as well as other charges and expenses of the insurance contract or separate account. The Portfolio’s total annual operating expenses, after fee waiver and/or reimbursement, were 0.44% and 0.69% for Class I and Class II shares, respectively, per the May 1, 2019 prospectus. |
| ** | The Portfolio’s inception date is November 1, 2017. The Portfolio commenced operations on November 6, 2017. |
The S&P Target Risk® Growth Index (Total Return) provides increased exposure to equities, while also using some fixed income exposure to dampen risk. It is not possible to invest directly in an index.
| Holdings by Asset Class | | % of Net Assets | |
| Exchange Traded Funds - Equity Funds | | | 60.6 | % |
| Exchange Traded Funds - Debt Funds | | | 39.2 | % |
| Money Market Fund | | | 0.0 | % ^ |
| Other Assets Less Liabilities - Net | | | 0.2 | % |
| | | | 100.0 | % |
Please refer to the Portfolio of Investments in this semi-annual report for more information regarding the Portfolio’s holdings as of June 30, 2019.
| ^ | Amount is less than 0.05% |
| Global Atlantic BlackRock Disciplined Core Portfolio |
| Portfolio Review (Unaudited) |
| June 30, 2019 |
The Portfolio seeks to provide long-term capital appreciation.
The Portfolio is sub-advised by BlackRock Investment Management, LLC (“BlackRock”).
How did the Portfolio perform during the period?
During the first six months of 2019, the Class I shares of Global Atlantic BlackRock Disciplined Core Portfolio underperformed its reference benchmark, the S&P 500 Index. The Portfolio posted a return of 18.28% compared to a benchmark return of 18.54%, a difference of -26 basis points. The following discussion of relative performance pertains to this benchmark.
What factors and allocation decisions influenced the Portfolio’s performance?
While many global equity markets finished 2018 in correction territory (a decline of greater than 20%), most markets erased those losses during the first six months of 2019 with the S&P 500 posting its strongest first half return (up 18.54%) since 1997. The S&P MidCap 400 and the Russell 2000 indices were both up 17-18% during the period, while the MSCI EAFE and MSCI Emerging Markets indices also posted strong returns, up 11-14%. The first half of 2019 was not without market volatility, however, as May saw a significant decline in major equity markets driven primarily by continued trade tensions between the U.S. and its major trading partners, mainly China and Mexico. Equity markets recovered significantly in June however, again eliminating most, if not all, of the declines experienced in May.
Value based signals detracted most from performance during the period, as investors generally traded away from more value- oriented areas of the market throughout the first half of the year. A quality and risk management signal positioning the Portfolio away from companies with higher degrees of leverage was the highest individual detractor, given the continued decline in U.S. interest rates.
On the positive side, contributions from sentiment based signals, particularly within the consumer staples and real estate sectors, were notable. The strong performance of the Portfolio’s more traditional trend-based and quality signals during the period was unsurprising given investors’ preference for growth-oriented companies with sustainable businesses. Several signals derived from machine learned text-analysis proved particularly beneficial, most specifically to identify trends in long- term company fundamentals as well as sell-side sentiment towards each company. A signal that evaluates the tightness of every industry’s labor market as an indication of the availability and cost of labor for each company was additive, as was a quality signal that evaluates companies based on a series of long-term sustainability measures. These signals provided stability to the portfolio amidst increased market volatility.
Elsewhere, the Portfolio’s macro thematic signals resulted in mixed returns over the period. Among macro themes, certain industry timing signals proved beneficial, as an underweight position in the materials sector added to relative performance for the period. In contrast, a signal that measures sensitivity to changes in foreign exchange rates detracted, given the heightened volatility across currency markets.
How was the Portfolio positioned at period end?
At period end the Portfolio remains largely sector neutral. The Portfolio had slight overweight positions in the utilities and industrials sectors and slight underweight positions in the energy and consumer staples sectors. The Portfolio seeks to maintain a style neutral approach, therefore it did not have any outsized active exposures to any particular style or factor.
2658352.2
| Global Atlantic BlackRock Disciplined Core Portfolio |
| Portfolio Review (Continued) |
| June 30, 2019 (Unaudited) |
The Portfolio’s performance figures* for the periods ended June 30, 2019 as compared to its benchmark:
| | Six | One | Performance |
| | Months | Year | Since Inception** |
| Global Atlantic BlackRock Disciplined Core Portfolio | | | |
| Class I | 18.28% | 9.29% | 9.88% |
| Class II | 18.21% | 9.07% | 9.57% |
| S&P 500® Index (Total Return) | 18.54% | 10.42% | 10.44% |
| * | The performance data quoted is historical. Past performance is no guarantee of future results. Current performance may be higher or lower than the performance data quoted. The principal value and investment return of an investment will fluctuate so that your shares, when redeemed, may be worth more or less than their original cost. Total returns would have been lower absent fee waivers by the Adviser. The returns shown do not reflect the deduction of taxes that a shareholder may pay on Portfolio distributions or on the redemption of Portfolio shares, as well as other charges and expenses of the insurance contract or separate account. The Portfolio’s total annual operating expenses, after fee waiver and/or reimbursement, were 0.48% and 0.73% for Class I and Class II shares, respectively, per the May 1, 2019 prospectus. |
| ** | The Portfolio’s inception date is November 1, 2017. The Portfolio commenced operations on November 6, 2017. |
The S&P 500® Index (Total Return) is a widely accepted, unmanaged index of U.S. stock market performance which does not take into account charges, fees, and other expenses. Investors cannot invest directly in an index.
| Holdings by Asset Class | | % of Net Assets | |
| Common Stocks | | | 98.5 | % |
| Money Market Fund | | | 1.3 | % |
| Other Assets Less Liabilities - Net | | | 0.2 | % |
| | | | 100.0 | % |
Please refer to the Portfolio of Investments in this semi-annual report for more information regarding the Portfolio’s holdings as of June 30, 2019.
Derivative exposure is included in “Other Assets Less Liabilities - Net”.
| Global Atlantic BlackRock Disciplined Growth Portfolio |
| Portfolio Review (Unaudited) |
| June 30, 2019 |
The Portfolio seeks to provide long-term capital appreciation.
The Portfolio is sub-advised by BlackRock Investment Management, LLC (“BlackRock”).
How did the Portfolio perform during the period?
During the first six months of 2019, the Class II shares of Global Atlantic BlackRock Disciplined Growth Portfolio underperformed its reference benchmark, the Russell 1000 Growth Index. The Portfolio posted a return of 21.02% compared to a benchmark return of 21.49%, a difference of -47 basis points. The following discussion of relative performance pertains to this benchmark.
What factors and allocation decisions influenced the Portfolio’s performance?
While many global equity markets finished 2018 in correction territory (a decline of greater than 20%), most markets erased those losses during the first six months of 2019 with the S&P 500 posting its strongest first half return (up 18.54%) since 1997. The S&P MidCap 400 and the Russell 2000 indices were both up 17-18% during the period, while the MSCI EAFE and MSCI Emerging Markets indices also posted strong returns, up 11-14%. The first half of 2019 was not without market volatility, however, as May saw a significant decline in major equity markets driven primarily by continued trade tensions between the U.S. and its major trading partners, mainly China and Mexico. Equity markets recovered significantly in June however, again eliminating most, if not all, of the declines experienced in May.
Value based signals detracted most from performance during the period, as investors generally traded away from more value- oriented areas of the market throughout the first half of the year. On the positive side, contributions from sentiment based signals, particularly within the consumer staples and real estate sectors, were notable. The strong performance of the Portfolio’s more traditional trend-based and quality signals during the period was unsurprising given investors’ preference for growth-oriented companies with sustainable businesses. Several signals derived from machine learned text-analysis proved particularly beneficial, most specifically to identify trends in long-term company fundamentals as well as sell-side sentiment towards each company. A signal that evaluates the tightness of every industry’s labor market as an indication of the availability and cost of labor for each company was additive, as was a quality signal that evaluates companies based on a series of long-term sustainability measures. These signals provided stability to the portfolio amidst increased market volatility.
Elsewhere, the Portfolio’s macro thematic signals resulted in mixed returns over the period. Among macro themes, certain industry timing signals proved beneficial, as an off-benchmark position in the utilities sector added to relative performance for the period. In contrast, a signal that measures sensitivity to changes in foreign exchange rates detracted, given the heightened volatility across currency markets.
How was the Portfolio positioned at period end?
At period end, the Portfolio remains largely sector neutral. The Portfolio had slight overweight positions in the utilities and financials sectors and slight underweight positions in the consumer discretionary and consumer staples sectors. The Portfolio seeks to maintain a style neutral approach, therefore it did not have any outsized active exposures to any particular style or factor.
2658352.2
| Global Atlantic BlackRock Disciplined Growth Portfolio |
| Portfolio Review (Continued) |
| June 30, 2019 (Unaudited) |
The Portfolio’s performance figures* for the periods ended June 30, 2019 as compared to its benchmark:
| | Six | One | Performance |
| | Months | Year | Since Inception** |
| Global Atlantic BlackRock Disciplined Growth Portfolio | | | |
| Class II | 21.02% | 9.56% | 12.26% |
| Russell 1000® Growth Index (Total Return) | 21.49% | 11.56% | 14.00% |
| * | The performance data quoted is historical. Past performance is no guarantee of future results. Current performance may be higher or lower than the performance data quoted. The principal value and investment return of an investment will fluctuate so that your shares, when redeemed, may be worth more or less than their original cost. Total returns would have been lower absent fee waivers by the Adviser. The returns shown do not reflect the deduction of taxes that a shareholder may pay on Portfolio distributions or on the redemption of Portfolio shares, as well as other charges and expenses of the insurance contract or separate account. The Portfolio’s total annual operating expenses, after fee waiver and/or reimbursement, were 0.79% for Class II shares, per the May 1, 2019 prospectus. |
| ** | The Portfolio’s inception date is November 1, 2017. The Portfolio commenced operations on November 6, 2017. |
The Russell 1000® Growth Index (Total Return) is an unmanaged index of common stock prices that measures the performance of those Russell 1000®Index companies with higher price-to-book ratios and higher forecasted growth values. It is not possible to invest directly in an index.
| Holdings by Asset Class | | % of Net Assets | |
| Common Stocks | | | 97.8 | % |
| Money Market Fund | | | 1.9 | % |
| Other Assets Less Liabilities - Net | | | 0.3 | % |
| | | | 100.0 | % |
Please refer to the Portfolio of Investments in this semi-annual report for more information regarding the Portfolio’s holdings as of June 30, 2019.
Derivative exposure is included in “Other Assets Less Liabilities - Net”.
Global Atlantic BlackRock Disciplined International Core Portfolio
Portfolio Review (Unaudited) |
| June 30, 2019 |
The Portfolio seeks to provide long-term capital appreciation.
The Portfolio is sub-advised by BlackRock Investment Management, LLC (“BlackRock”).
How did the Portfolio perform during the period?
During the first six months of 2019, the Class I shares of Global Atlantic BlackRock Disciplined International Core Portfolio outperformed its reference benchmark, the MSCI ACWI ex USA Index. The Portfolio posted a return of 14.00% compared to a benchmark return of 13.60%, a difference of 40 basis points. The following discussion of relative performance pertains to this benchmark.
What factors and allocation decisions influenced the Portfolio’s performance?
While many global equity markets finished 2018 in correction territory (a decline of greater than 20%), most markets erased those losses during the first six months of 2019 with the S&P 500 posting its strongest first half return (up 18.54%) since 1997. The S&P MidCap 400 and the Russell 2000 indices were both up 17-18% during the period, while the MSCI EAFE and MSCI Emerging Markets indices also posted strong returns, up 11-14%. The first half of 2019 was not without market volatility, however, as May saw a significant decline in major equity markets driven primarily by continued trade tensions between the U.S. and its major trading partners, mainly China and Mexico. Equity markets recovered significantly in June however, again eliminating most, if not all, of the declines experienced in May.
The Portfolio’s macro thematic signals contributed most significantly during the period, particularly those that positioned the Portfolio towards a pro-growth stance given investor preference for high-growth companies, and those related to country timing within France and Germany. Remaining underweight Emerging Markets (EM) countries helped bolster relative performance, as EM markets continued to underperform amid ongoing global trade disputes, a relatively strong dollar, and weak economic/manufacturing activity. Maintaining an underweight position in Japan was also beneficial, as Japan continued to underperform due to sluggish economic growth and investor concern around the strength of the Yen. In contrast, the Portfolio’s underweight position in Russia was a drag on relative returns, as the Russian market significantly outpaced global markets throughout the first half of the year. The Portfolio’s industry timing signals resulted in mixed returns, as an underweight to the financials sector contributed to performance while an underweight to the information technology sector detracted noticeably from relative returns.
Quality-based signals also contributed to performance during the period. The strong performance of the Portfolio’s more traditional trend-based and quality signals during the period was unsurprising given investors’ preference for growth-oriented companies with sustainable businesses. A signal that rewards companies with attractive dividend growth trends was particularly additive, as were signals derived from machine learned text-analysis to identify trends in long-term company fundamentals as well as sell-side sentiment towards each company.
Value-based signals detracted from returns as investors generally traded away from more value-oriented areas of the market throughout the first half of the year. A Quality-based signal evaluating earnings management and efficiency of capital spend was also a notable detractor during the period.
How was the Portfolio positioned at period end?
At period end, the Portfolio remains largely sector neutral. The Portfolio had slight overweight positions in the communication services and healthcare sectors and slight underweight positions in the financials and information technology sectors. While the Portfolio generally targets a country neutral approach, it had a modestly overweight Australia and China position and modestly underweight Japan and Russia position at period end. The Portfolio seeks to maintain a style neutral approach, therefore it did not have any outsized active exposures to any particular style or factor.
2658352.2
| Global Atlantic BlackRock Disciplined International Core Portfolio |
| Portfolio Review (Continued) |
| June 30, 2019 (Unaudited) |
The Portfolio’s performance figures* for the periods ended June 30, 2019 as compared to its benchmark:
| | Six | One | Performance |
| | Months | Year | Since Inception** |
| Global Atlantic BlackRock Disciplined International Core Portfolio | | | |
| Class I | 14.00% | 0.48% | (0.56)% |
| Class II | 13.90% | 0.21% | (0.78)% |
| MSCI ACWI ex-USA Index | 13.60% | 1.29% | 0.00% |
| * | The performance data quoted is historical. Past performance is no guarantee of future results. Current performance may be higher or lower than the performance data quoted. The principal value and investment return of an investment will fluctuate so that your shares, when redeemed, may be worth more or less than their original cost. Total returns would have been lower absent fee waivers by the Adviser. The returns shown do not reflect the deduction of taxes that a shareholder may pay on Portfolio distributions or on the redemption of Portfolio shares, as well as other charges and expenses of the insurance contract or separate account. The Portfolio’s total annual operating expenses, after fee waiver and/or reimbursement, were 0.74% and 0.99% for Class I and Class II shares, respectively, per the May 1, 2019 prospectus. |
| ** | The Portfolio’s inception date is November 1, 2017. The Portfolio commenced operations on November 6, 2017. |
The MSCI ACWI ex-USA Index is a free float-adjusted market capitalization index designed to measure the combined equity market performance of developed and emerging market countries, excluding the United States. It is not possible to invest directly in an index.
| Holdings by Asset Class | | % of Net Assets | |
| Common Stocks | | | 90.1 | % |
| Exchange Traded Funds - Equity Funds | | | 6.3 | % |
| Money Market Fund | | | 0.6 | % |
| Right | | | 0.0 | % ^ |
| Other Assets Less Liabilities - Net | | | 3.0 | % |
| | | | 100.0 | % |
Please refer to the Portfolio of Investments in this semi-annual report for more information regarding the Portfolio’s holdings as of June 30, 2019.
Derivative exposure is included in “Other Assets Less Liabilities - Net”.
| ^ | Amount is less than 0.05% |
| Global Atlantic BlackRock Disciplined Mid Cap Growth Portfolio |
| Portfolio Review (Unaudited) |
| June 30, 2019 |
The Portfolio seeks to provide long-term capital appreciation.
The Portfolio is sub-advised by BlackRock Investment Management, LLC (“BlackRock”).
How did the Portfolio perform during the period?
During the first six months of 2019, the Class I shares of Global Atlantic BlackRock Disciplined Mid Cap Growth Portfolio underperformed its reference benchmark, the Russell Midcap Growth Index. The Portfolio posted a return of 25.53% compared to a benchmark return of 26.08%, a difference of -55 basis points. The following discussion of relative performance pertains to this benchmark.
What factors and allocation decisions influenced the Portfolio’s performance?
While many global equity markets finished 2018 in correction territory (a decline of greater than 20%), most markets erased those losses during the first six months of 2019 with the S&P 500 posting its strongest first half return (up 18.54%) since 1997. The S&P MidCap 400 and the Russell 2000 indices were both up 17-18% during the period, while the MSCI EAFE and MSCI Emerging Markets indices also posted strong returns, up 11-14%. The first half of 2019 was not without market volatility, however, as May saw a significant decline in major equity markets driven primarily by continued trade tensions between the U.S. and its major trading partners, mainly China and Mexico. Equity markets recovered significantly in June however, again eliminating most, if not all, of the declines experienced in May.
Value based signals detracted most from performance during the period, as investors generally traded away from more value- oriented areas of the market throughout the first half of the year. Although quality signals were additive in aggregate, a signal rewarding companies with higher operating asset efficiency detracted notably from performance for the period, as did a signal positioning the Portfolio away from companies with higher degrees of leverage given the continued decline in U.S. interest rates.
On the positive side, contributions from sentiment based signals, particularly within the consumer staples and health care sectors, were notable. The strong performance of the Portfolio’s more traditional trend-based and quality signals during the period was unsurprising given investors’ preference for growth-oriented companies with sustainable businesses. A signal that evaluates the tightness of every industry’s labor market as an indication of the availability and cost of labor for each company contributed most to returns. Several signals derived from machine learned text-analysis proved particularly beneficial, most specifically to identify trends in long-term company fundamentals to gauge changes in management and sell-side sentiment towards each company. A signal identifying investor sentiment based on short positions of hedge funds further contributed, a reversal of the signal’s underperformance in the fourth quarter of 2018 and unsurprising given the relative success of hedge funds throughout the period.
Elsewhere, the Portfolio’s macro thematic signals were slightly negative over the period. Among macro themes, aa signal that measures sensitivity to changes in foreign exchange rates detracted, given the heightened volatility across currency markets. The Portfolio’s industry timing signals resulted in mixed returns, as maintaining an underweight in the energy sector contributed while initiating a small off-benchmark position in the utilities sector detracted.
How was the Portfolio positioned at period end?
At period end, the Portfolio remains largely sector neutral. The Portfolio had slight overweight positions in the financials and communication services sectors and slight underweight positions in the consumer discretionary and information technology sectors. The Portfolio seeks to maintain a style neutral approach, therefore it did not have any outsized active exposures to any particular style or factor.
2658352.2
| Global Atlantic BlackRock Disciplined Mid Cap Growth Portfolio |
| Portfolio Review (Continued) |
| June 30, 2019 (Unaudited) |
The Portfolio’s performance figures* for the periods ended June 30, 2019 as compared to its benchmark:
| | Six | One | Performance |
| | Months | Year | Since Inception** |
| Global Atlantic BlackRock Disciplined Mid Cap Growth Portfolio | | | |
| Class I | 25.53% | 14.07% | 14.90% |
| Class II | 25.45% | 13.78% | 14.66% |
| Russell Midcap® Growth Index (Total Return) | 26.08% | 13.94% | 14.48% |
| * | The performance data quoted is historical. Past performance is no guarantee of future results. Current performance may be higher or lower than the performance data quoted. The principal value and investment return of an investment will fluctuate so that your shares, when redeemed, may be worth more or less than their original cost. Total returns would have been lower absent fee waivers by the Adviser. Performance figures for periods greater than one year are annualized. The returns shown do not reflect the deduction of taxes that a shareholder may pay on Portfolio distributions or on the redemption of Portfolio shares, as well as other charges and expenses of the insurance contract or separate account. The Portfolio’s total annual operating expenses, after fee waiver and/or reimbursement, were 0.63% and 0.88% for Class I and Class II shares, respectively, per the May 1, 2019 prospectus. |
| ** | The Portfolio’s inception date is November 1, 2017. The Portfolio commenced operations on November 6, 2017. |
The Russell Midcap® Growth Index (Total Return) is an unmanaged index that consists of the bottom 800 securities of the Russell 1000®Index with greater-than-average growth orientation as ranked by total market capitalization. It is not possible to invest directly in an index.
| Holdings by Asset Class | | % of Net Assets | |
| Common Stocks | | | 98.2 | % |
| Money Market Fund | | | 1.4 | % |
| Other Assets Less Liabilities - Net | | | 0.4 | % |
| | | | 100.0 | % |
Please refer to the Portfolio of Investments in this semi-annual report for more information regarding the Portfolio’s holdings as of June 30, 2019.
Derivative exposure is included in “Other Assets Less Liabilities - Net”.
| Global Atlantic BlackRock Disciplined Small Cap Portfolio |
| Portfolio Review (Unaudited) |
| June 30, 2019 |
The Portfolio seeks to provide long-term capital appreciation.
The Portfolio is sub-advised by BlackRock Investment Management, LLC (“BlackRock”).
How did the Portfolio perform during the period?
During the first six months of 2019, the Class I shares of Global Atlantic BlackRock Disciplined Small Cap Growth Portfolio outperformed its reference benchmark, the Russell 2000 Index. The Portfolio posted a return of 18.50% compared to a benchmark return of 16.98%, a difference of 152 basis points. The following discussion of relative performance pertains to this benchmark.
What factors and allocation decisions influenced the Portfolio’s performance?
While many global equity markets finished 2018 in correction territory (a decline of greater than 20%), most markets erased those losses during the first six months of 2019 with the S&P 500 posting its strongest first half return (up 18.54%) since 1997. The S&P MidCap 400 and the Russell 2000 indices were both up 17-18% during the period, while the MSCI EAFE and MSCI Emerging Markets indices also posted strong returns, up 11-14%. The first half of 2019 was not without market volatility, however, as May saw a significant decline in major equity markets driven primarily by continued trade tensions between the U.S. and its major trading partners, mainly China and Mexico. Equity markets recovered significantly in June however, again eliminating most, if not all, of the declines experienced in May.
Quality based signals contributed meaningfully to performance during the period, particularly in the financials and healthcare sectors. The strong performance of the Portfolio’s more traditional trend-based and quality signals during the period was unsurprising given investors’ preference for growth-oriented companies with sustainable businesses. A signal that rewards companies with attractive dividend growth trends was particularly additive, as were insights related to quality management, specifically founder-led management structures, technology driven text analysis of company 8-K filings, and measures of long- term sustainability. These signals provided stability to the Portfolio amidst increased market volatility. A signal identifying investor sentiment based on short positions of hedge funds further contributed, a reversal of the signal’s underperformance in the fourth quarter of 2018 and unsurprising given the relative success of hedge funds throughout the period.
Elsewhere, the Portfolio’s macro thematic signals contributed modestly over the period. Among macro themes, a signal measuring sensitivity to changes in foreign exchange rates was slightly positive, while the Portfolio’s industry timing signals resulted in mixed returns.
Value-based signals detracted from returns as investors generally traded away from more value-oriented areas of the market throughout the first half of the year. A quality-based signal preferring companies with lower risk profiles also detracted, given the strong performance of small cap stocks throughout the first half of the year.
How was the Portfolio positioned at period end?
At period end, the Portfolio remains largely sector neutral. The Portfolio had slight overweight positions in the information technology and communication services sectors and slight underweight positions in the financials and healthcare sectors. The Portfolio seeks to maintain a style neutral approach, therefore it did not have any outsized active exposures to any particular style or factor.
2658352.2
| Global Atlantic BlackRock Disciplined Small Cap Portfolio |
| Portfolio Review (Continued) |
| June 30, 2019 (Unaudited) |
The Portfolio’s performance figures* for the periods ended June 30, 2019 as compared to its benchmark:
| | Six | One | Performance |
| | Months | Year | Since Inception** |
| Global Atlantic BlackRock Disciplined Small Cap Portfolio | | | |
| Class I | 18.50% | (0.71)% | 5.69% |
| Class II | 18.41% | (0.98)% | 5.45% |
| Russell 2000® Index (Total Return) | 16.98% | (3.31)% | 4.38% |
| * | The performance data quoted is historical. Past performance is no guarantee of future results. Current performance may be higher or lower than the performance data quoted. The principal value and investment return of an investment will fluctuate so that your shares, when redeemed, may be worth more or less than their original cost. Total returns would have been lower absent fee waivers by the Adviser. Performance figures for periods greater than one year are annualized. The returns shown do not reflect the deduction of taxes that a shareholder may pay on Portfolio distributions or on the redemption of Portfolio shares, as well as other charges and expenses of the insurance contract or separate account. The Portfolio’s total annual operating expenses, after fee waiver and/or reimbursement, were 0.63% and 0.88% for Class I and Class II shares, respectively, per the May 1, 2019 prospectus. |
| ** | The Portfolio’s inception date is November 1, 2017. The Portfolio commenced operations on November 6, 2017. |
The Russell 2000® Index (Total Return) measures the performance of the small-capitalization sector of the U.S. equity market. It is not possible to invest directly in an index.
| Holdings by Asset Class | | % of Net Assets | |
| Common Stocks | | | 97.4 | % |
| Money Market Fund | | | 2.5 | % |
| Warrant | | | 0.0 | % ^ |
| Other Assets Less Liabilities - Net | | | 0.1 | % |
| | | | 100.0 | % |
Please refer to the Portfolio of Investments in this semi-annual report for more information regarding the Portfolio’s holdings as of June 30, 2019.
Derivative exposure is included in “Other Assets Less Liabilities - Net”.
| ^ | Amount is less than 0.05% |
| Global Atlantic BlackRock Disciplined U.S. Core Portfolio |
| Portfolio Review (Unaudited) |
| June 30, 2019 |
The Portfolio seeks to provide long-term capital appreciation.
The Portfolio is sub-advised by BlackRock Investment Management, LLC (“BlackRock”).
How did the Portfolio perform during the period?
During the first six months of 2019, the Class I shares of Global Atlantic BlackRock Disciplined U.S. Core Portfolio underperformed its reference benchmark, the S&P 500 Index. The Portfolio posted a return of 18.32% compared to a benchmark return of 18.54%, a difference of -22 basis points. The following discussion of relative performance pertains to this benchmark.
What factors and allocation decisions influenced the Portfolio’s performance?
While many global equity markets finished 2018 in correction territory (a decline of greater than 20%), most markets erased those losses during the first six months of 2019 with the S&P 500 posting its strongest first half return (up 18.54%) since 1997. The S&P MidCap 400 and the Russell 2000 indices were both up 17-18% during the period, while the MSCI EAFE and MSCI Emerging Markets indices also posted strong returns, up 11-14%. The first half of 2019 was not without market volatility, however, as May saw a significant decline in major equity markets driven primarily by continued trade tensions between the U.S. and its major trading partners, mainly China and Mexico. Equity markets recovered significantly in June however, again eliminating most, if not all, of the declines experienced in May.
Value based signals detracted most from performance during the period, as investors generally traded away from more value- oriented areas of the market throughout the first half of the year. On the positive side, contributions from sentiment based signals, particularly within the consumer staples sector, were notable. The strong performance of the Portfolio’s more traditional trend-based and quality signals during the period was unsurprising given investors’ preference for growth-oriented companies with sustainable businesses. A signal that evaluates the tightness of every industry’s labor market as an indication of the availability and cost of labor for each company was particularly additive. Several signals derived from machine learned text-analysis to identify trends in long-term company fundamentals as well as sell-side sentiment towards each company, together with a quality signal that evaluates companies based on a series of long-term sustainability measures, contributed to performance. These signals provided stability to the Portfolio amidst increased market volatility.
Elsewhere, the Portfolio’s macro thematic signals resulted in mixed returns over the period. Among macro themes, certain industry timing signals proved beneficial, as an underweight position in the Industrials sector added to relative performance for the period. In contrast, a signal that measures sensitivity to changes in foreign exchange rates was challenged, given the heightened volatility across currency markets.
How was the Portfolio positioned at period end?
At period end, the Portfolio remains largely sector neutral. The Portfolio had slight overweight positions in the utilities and industrials sectors and slight underweight positions in the consumer discretionary and consumer staples sectors. The Portfolio seeks to maintain a style neutral approach, therefore it did not have any outsized active exposures to any particular style or factor.
2658352.2
| Global Atlantic BlackRock Disciplined U.S. Core Portfolio |
| Portfolio Review (Continued) |
| June 30, 2019 (Unaudited) |
The Portfolio’s performance figures* for the periods ended June 30, 2019 as compared to its benchmark:
| | Six | One | Performance |
| | Months | Year | Since Inception** |
| Global Atlantic BlackRock Disciplined U.S. Core Portfolio | | | |
| Class I | 18.32% | 9.33% | 9.85% |
| Class II | 18.13% | 8.98% | 9.57% |
| S&P 500® Index (Total Return) | 18.54% | 10.42% | 10.44% |
| * | The performance data quoted is historical. Past performance is no guarantee of future results. Current performance may be higher or lower than the performance data quoted. The principal value and investment return of an investment will fluctuate so that your shares, when redeemed, may be worth more or less than their original cost. Total returns would have been lower absent fee waivers by the Adviser. Performance figures for periods greater than one year are annualized. The returns shown do not reflect the deduction of taxes that a shareholder may pay on Portfolio distributions or on the redemption of Portfolio shares, as well as other charges and expenses of the insurance contract or separate account. The Portfolio’s total annual operating expenses, after fee waiver and/or reimbursement, were 0.48% and 0.73% for Class I and Class II shares, respectively, per the May 1, 2019 prospectus. |
| ** | The Portfolio’s inception date is November 1, 2017. The Portfolio commenced operations on November 6, 2017. |
The S&P 500® Index (Total Return) is a widely accepted, unmanaged index of U.S. stock market performance which does not take into account charges, fees, and other expenses. Investors cannot invest directly in an index.
| Holdings by Asset Class | | % of Net Assets | |
| Common Stocks | | | 97.2 | % |
| Money Market Fund | | | 1.9 | % |
| Other Assets Less Liabilities - Net | | | 0.9 | % |
| | | | 100.0 | % |
| | | | | |
Please refer to the Portfolio of Investments in this semi-annual report for more information regarding the Portfolio’s holdings as of June 30, 2019.
Derivative exposure is included in “Other Assets Less Liabilities - Net”.
| Global Atlantic BlackRock Disciplined Value Portfolio |
| Portfolio Review (Unaudited) |
| June 30, 2019 |
The Portfolio seeks to provide long-term capital appreciation.
The Portfolio is sub-advised by BlackRock Investment Management, LLC (“BlackRock”).
How did the Portfolio perform during the period?
During the first six months of 2019, the Class I shares of Global Atlantic BlackRock Disciplined Value Portfolio outperformed its reference benchmark, the Russell 1000 Value Index. The Portfolio posted a return of 16.40% compared to a benchmark return of 16.24%, a difference of 16 basis points. The following discussion of relative performance pertains to this benchmark.
What factors and allocation decisions influenced the Portfolio’s performance?
While many global equity markets finished 2018 in correction territory (a decline of greater than 20%), most markets erased those losses during the first six months of 2019 with the S&P 500 posting its strongest first half return (up 18.54%) since 1997. The S&P MidCap 400 and the Russell 2000 indices were both up 17-18% during the period, while the MSCI EAFE and MSCI Emerging Markets indices also posted strong returns, up 11-14%. The first half of 2019 was not without market volatility, however, as May saw a significant decline in major equity markets driven primarily by continued trade tensions between the U.S. and its major trading partners, mainly China and Mexico. Equity markets recovered significantly in June however, again eliminating most, if not all, of the declines experienced in May.
While quality based signals contributed meaningfully to performance during the period, this was largely offset by value based insights, which detracted from returns as investors generally traded away from more value-oriented areas of the market throughout the first half of the year. The strong performance of the Portfolio’s more traditional trend-based and quality signals during the period was unsurprising given investors’ preference for growth-oriented companies with sustainable businesses. A signal that evaluates the tightness of every industry’s labor market as an indication of the availability and cost of labor for each company was additive, as were several signals derived from machine learned text-analysis to identify trends in long-term company fundamentals as well as to gauge changes in management sentiment. Other quality based insights that contributed to performance were those rewarding companies with attractive dividend growth trends as well as one that evaluates companies based on a series of long-term sustainability measures. These signals provided stability to the Portfolio amidst increased market volatility.
Elsewhere, the Portfolio’s macro thematic signals contributed modestly over the period. Among macro themes, certain industry timing signals proved beneficial, as an underweight position in the materials sector added to relative performance for the period. In contrast, a signal that measures sensitivity to changes in foreign exchange rates detracted, given the heightened volatility across currency markets.
How was the Portfolio positioned at period end?
At period end, the Portfolio remains largely sector neutral. The Portfolio had slight overweight positions in the information technology and utilities sectors and slight underweight positions in the consumer discretionary and consumer staples sectors. The Portfolio seeks to maintain a style neutral approach, therefore it did not have any outsized active exposures to any particular style or factor.
2658352.2
| Global Atlantic BlackRock Disciplined Value Portfolio |
| Portfolio Review (Continued) |
| June 30, 2019 (Unaudited) |
The Portfolio’s performance figures* for the periods ended June 30, 2019 as compared to its benchmark:
| | Six | One | Performance |
| | Months | Year | Since Inception** |
| Global Atlantic BlackRock Disciplined Value Portfolio | | | |
| Class I | 16.40% | 8.37% | 6.97% |
| Class II | 16.17% | 8.03% | 6.77% |
| Russell 1000® Value Index (Total Return) | 16.24% | 8.46% | 6.58% |
| * | The performance data quoted is historical. Past performance is no guarantee of future results. Current performance may be higher or lower than the performance data quoted. The principal value and investment return of an investment will fluctuate so that your shares, when redeemed, may be worth more or less than their original cost. Total returns would have been lower absent fee waivers by the Adviser. Performance figures for periods greater than one year are annualized. The returns shown do not reflect the deduction of taxes that a shareholder may pay on Portfolio distributions or on the redemption of Portfolio shares, as well as other charges and expenses of the insurance contract or separate account. The Portfolio’s total annual operating expenses, after fee waiver and/or reimbursement, were 0.54% and 0.79% for Class I and Class II shares, respectively, per the May 1, 2019 prospectus. |
| ** | The Portfolio’s inception date is November 1, 2017. The Portfolio commenced operations on November 6, 2017. |
The Russell 1000® Value Index (Total Return) measures the performance of large- and mid-capitalization value sectors of the U.S. equity market. It is not possible to invest directly in an index.
| Holdings by Asset Class | | % of Net Assets | |
| Common Stocks | | | 98.5 | % |
| Money Market Fund | | | 1.2 | % |
| Other Assets Less Liabilities - Net | | | 0.3 | % |
| | | | 100.0 | % |
Please refer to the Portfolio of Investments in this semi-annual report for more information regarding the Portfolio’s holdings as of June 30, 2019.
Derivative exposure is included in “Other Assets Less Liabilities - Net”.
| Global Atlantic BlackRock High Yield Portfolio |
| Portfolio Review (Unaudited) |
| June 30, 2019 |
The Portfolio seeks to provide total return.
The Portfolio is sub-advised by BlackRock Investment Management, LLC (“BlackRock”).
How did the Portfolio perform during the period?
During the first six months of 2019, the Class I shares of Global Atlantic BlackRock High Yield Portfolio outperformed its reference benchmark, the ICE BofAML BB-B U.S. High Yield Constrained Index. The Portfolio posted a return of 10.60% compared to a benchmark return of 10.33%, a difference of 27 basis points. The following discussion of relative performance pertains to this benchmark.
What factors and allocation decisions influenced the Portfolio’s performance?
While many global equity markets finished 2018 in correction territory (a decline of greater than 20%), most markets erased those losses during the first six months of 2019 with the S&P 500 posting its strongest first half return (up 18.54%) since 1997. The S&P MidCap 400 and the Russell 2000 indices were both up 17-18% during the period, while the MSCI EAFE and MSCI Emerging Markets indices also posted strong returns, up 11-14%. The fixed income market also rallied, highlighted by significant decline in the 10-year U.S. Treasury yield to 2.00% at period end, a level not seen since 2016 and down from a recent high of 3.24% in November 2018. The first half of 2019 was not without market volatility, however, as May saw a significant decline in major equity markets driven primarily by continued trade tensions between the U.S. and its major trading partners, mainly China and Mexico. While bond yields remained low during this volatile period, equity markets recovered significantly in June, again eliminating most, if not all, of the declines experienced in May.
The primary contributor during the period was an overweight to the consumer non-cyclical sector, particularly pharmaceutical and healthcare companies. Security selection within the communications sector, notably an overweight position within cable, contributed to performance as did an overweight position in home construction companies within the consumer cyclicals sector.
The primary detractor during the period were underweight positions within the capital goods sector, particularly within the construction materials and building materials industries. An overweight to technology also detracted from performance, as did an underweight position within the electrics sector.
How was the Portfolio positioned at period end?
At period end, the Portfolio was overweight basic materials, finance companies, and communications. The largest sector underweights were energy, capital goods, and banking.
2658352.2
| Global Atlantic BlackRock High Yield Portfolio |
| Portfolio Review (Continued) |
| June 30, 2019 (Unaudited) |
The Portfolio’s performance figures* for the periods ended June 30, 2019 as compared to its benchmark:
| | Six | One | Performance |
| | Months | Year | Since Inception** |
| Global Atlantic BlackRock High Yield Portfolio | | | |
| Class I | 10.60% | 7.12% | 2.97% |
| Class II | 10.41% | 6.78% | 2.71% |
| ICE BofAML BB-B U.S. High Yield Constrained Index^ | 10.33% | 8.58% | 4.71% |
| ICE BofA ML U.S. High Yield Master II Index+ | 10.12% | 7.54% | 4.50% |
| * | The performance data quoted is historical. Past performance is no guarantee of future results. Current performance may be higher or lower than the performance data quoted. The principal value and investment return of an investment will fluctuate so that your shares, when redeemed, may be worth more or less than their original cost. Total returns would have been lower absent fee waivers by the Adviser. The returns shown do not reflect the deduction of taxes that a shareholder may pay on Portfolio distributions or on the redemption of Portfolio shares, as well as other charges and expenses of the insurance contract or separate account. The Portfolio’s total annual operating expenses, after fee waiver and/or reimbursement, were 0.59% and 0.84% for Class I and Class II shares, respectively, per the May 1, 2019 prospectus. |
| ** | The Portfolio’s inception date is November 1, 2017. The Portfolio commenced operations on November 6, 2017. |
| ^ | Effective January 1, 2019, the Portfolio’s benchmark is the ICE BofAML BB-B U.S. High Yield Constrained Index. The ICE BofAML BB-B US High Yield Constrained Index contains all securities in the ICE BofAML US High Yield Index rated BB1 through B3, based on an average of Moody’s, S&P, and Fitch, but caps issuer exposure at 2%. Index constituents are capitalization-weighted, based on their current amount outstanding, provided the total allocation to an individual issuer does not exceed 2%. It is not possible to invest directly in an index. |
| + | The ICE BofA ML U.S. High Yield Master II Index is an unmanaged market value-weighted index comprised of over 2,300 domestic and yankee high-yield bonds, including deferred interest bonds and payment-in-kind securities. It is not possible to invest directly in an index. |
| Holdings by Asset Class | | % of Net Assets | |
| Corporate Bonds and Notes | | | 96.3 | % |
| Money Market Fund | | | 0.9 | % |
| Other Assets Less Liabilities - Net | | | 2.8 | % |
| | | | 100.0 | % |
Please refer to the Portfolio of Investments in this semi-annual report for more information regarding the Portfolio’s holdings as of June 30, 2019.
Derivative exposure is included in “Other Assets Less Liabilities - Net”.
| Global Atlantic Goldman Sachs Core Fixed Income Portfolio |
| Portfolio Review (Unaudited) |
| June 30, 2019 |
The Portfolio seeks to provide total return consisting of capital appreciation and income.
The Portfolio is sub-advised by Goldman Sachs Asset Management, L.P. (“GSAM”).
How did the Portfolio perform during the period?
During the first six months of 2019, the Class I shares of Global Atlantic Goldman Sachs Core Fixed Income Portfolio outperformed its reference benchmark, the Bloomberg Barclays U.S. Aggregate Bond Index. The Portfolio posted a return of 6.85% compared to a benchmark return of 6.11%, a difference of 74 basis points. The following discussion of relative performance pertains to this benchmark.
What factors and allocation decisions influenced the Portfolio’s performance?
While many global equity markets finished 2018 in correction territory (a decline of greater than 20%), most markets erased those losses during the first six months of 2019 with the S&P 500 posting its strongest first half return (up 18.54%) since 1997. The S&P MidCap 400 and the Russell 2000 indices were both up 17-18% during the period, while the MSCI EAFE and MSCI Emerging Markets indices also posted strong returns, up 11-14%. The fixed income market also rallied, highlighted by significant decline in the 10-year U.S. Treasury yield to 2.00% at period end, a level not seen since 2016 and down from a recent high of 3.24% in November 2018. The first half of 2019 was not without market volatility, however, as May saw a significant decline in major equity markets driven primarily by continued trade tensions between the U.S. and its major trading partners, mainly China and Mexico. While bond yields remained low during this volatile period, equity markets recovered significantly in June, again eliminating most, if not all, of the declines experienced in May.
The Portfolio’s duration strategy contributed to performance over the reporting period, due to its U.S. rates positioning and tactical U.S. duration positioning. The Portfolio’s relative value country strategy was also additive for results, driven by long positions in European rates versus short positions in Japanese, Norwegian and UK rates. Furthermore, a long position in 10- year Treasury Inflation-Protected Securities versus short position in UK rates was additive for returns. The Portfolio’s currency strategy contributed to performance, due to short positions in the euro and the British pound, coupled with long positions in the Norwegian Krone and the Australian dollar. These gains were partially offset by long positions in the New Zealand dollar and the Japanese yen. Cross-sector positioning contributed to returns, driven by allocations to corporate credit and paired duration trades, as well as the Portfolio’s exposure to collateralized loan obligations (CLOs). An overweight to emerging market sovereign debt further contributed to performance. These gains were partially offset by an underweight position in emerging market corporate debt, as well as exposure to government/swaps.
Overall, the Portfolio’s security selection strategies were beneficial for returns, due to exposure to investment-grade credit, primarily positions in the utilities and financials sectors. Within the securitized sector, the Portfolio’s mortgage-backed security (MBS) holdings also contributed to performance. Selection of external emerging market debt from Mexico, Indonesia and Brazil also benefited returns. These were partially offset by selections of U.S. government debt.
How was the Portfolio positioned at period end?
At period end, the Portfolio was overweight U.S. rates, whereas it was short European and UK rates versus long Norwegian and Australian rates. The Portfolio had underweight positions in agency MBS and commercial mortgage-backed securities (CMBS). Elsewhere, the Portfolio was overweight asset-backed securities (ABS), corporate credit and emerging market sovereign debt.
2658352.2
| Global Atlantic Goldman Sachs Core Fixed Income Portfolio |
| Portfolio Review (Continued) |
| June 30, 2019 (Unaudited) |
The Portfolio’s performance figures* for the periods ended June 30, 2019 as compared to its benchmark:
| | Six | One | Performance |
| | Months | Year | Since Inception** |
| Global Atlantic Goldman Sachs Core Fixed Income Portfolio | | | |
| Class I | 6.85% | 8.00% | 3.60% |
| Class II | 6.85% | 7.94% | 3.57% |
| Bloomberg Barclays U.S. Aggregate Bond Index | 6.11% | 7.87% | 3.86% |
| * | The performance data quoted is historical. Past performance is no guarantee of future results. Current performance may be higher or lower than the performance data quoted. The principal value and investment return of an investment will fluctuate so that your shares, when redeemed, may be worth more or less than their original cost. Total returns would have been lower absent fee waivers by the Adviser. The returns shown do not reflect the deduction of taxes that a shareholder may pay on Portfolio distributions or on the redemption of Portfolio shares, as well as other charges and expenses of the insurance contract or separate account. The Portfolio’s total annual operating expenses, after fee waiver and/or reimbursement, were 0.44% and 0.69% for Class I and Class II shares, respectively, per the May 1, 2019 prospectus. |
| ** | The Portfolio’s inception date is November 1, 2017. The Portfolio commenced operations on November 6, 2017. |
The Bloomberg Barclays U.S. Aggregate Bond Index represents an unmanaged diversified portfolio of fixed income securities, including U.S. Treasuries, investment-grade corporate bonds, and mortgage-backed and asset-backed securities. It is not possible to invest directly in an index.
| Holdings by Asset Class | | % of Net Assets | |
| Corporate Bonds & Notes | | | 40.9 | % |
| Mortgage Backed Securities | | | 32.5 | % |
| U.S. Treasury Securities | | | 17.0 | % |
| Commercial Paper | | | 1.1 | % |
| Money Market Fund | | | 14.8 | % |
| Asset Backed Securities | | | 7.7 | % |
| Municipal Bonds | | | 1.4 | % |
| Other Assets Less Liabilities - Net | | | (15.4 | )% |
| | | | 100.0 | % |
Please refer to the Portfolio of Investments in this semi-annual report for more information regarding the Portfolio’s holdings as of June 30, 2019.
Derivative exposure is included in “Other Assets Less Liabilities - Net”.
| Global Atlantic Goldman Sachs Global Equity Insights Portfolio |
| Portfolio Review (Unaudited) |
| June 30, 2019 |
The Portfolio seeks to provide long-term capital appreciation.
The Portfolio is sub-advised by Goldman Sachs Asset Management, L.P. (“GSAM”).
How did the Portfolio perform during the period?
During the first six months of 2019, the Class I shares of Global Atlantic Goldman Sachs Global Equity Insights Portfolio underperformed its reference benchmark, the MSCI World Standard Index. The Portfolio posted a return of 14.16% compared to a benchmark return of 16.98%, a difference of -282 basis points. The following discussion of relative performance pertains to this benchmark.
What factors and allocation decisions influenced the Portfolio’s performance?
While many global equity markets finished 2018 in correction territory (a decline of greater than 20%), most markets erased those losses during the first six months of 2019 with the S&P 500 posting its strongest first half return (up 18.54%) since 1997. The S&P MidCap 400 and the Russell 2000 indices were both up 17-18% during the period, while the MSCI EAFE and MSCI Emerging Markets indices also posted strong returns, up 11-14%. The first half of 2019 was not without market volatility, however, as May saw a significant decline in major equity markets driven primarily by continued trade tensions between the U.S. and its major trading partners, mainly China and Mexico. Equity markets recovered significantly in June however, again eliminating most, if not all, of the declines experienced in May.
All four investment themes detracted from performance, with High-Quality Business Models detracting most from results followed by Fundamental Mispricings, Market Themes & Trends, and Sentiment Analysis. Country selection contributed to performance during the period. Among sectors, the Portfolio’s health care holdings detracted the most from returns, particularly underweight positions in the health care equipment & supplies and pharmaceutical industries. On the positive side, holdings in the financials sector contributed the most to returns, mainly driven by underweight positions in banks and diversified financial services.
At an individual stock level, an overweight position in Mylan NV detracted the most from returns despite scoring highly on Sentiment Analysis and Fundamental Mispricing related factors. Conversely, an overweight position in Chipotle Mexican Grill, Inc. (0.5%) contributed the most to returns as the stock scored highly on Sentiment Analysis and High-Quality Business Model related factors.
Among countries, an overweight position in the U.S., held primarily for supportive momentum characteristics detracted the most from returns. Conversely, an underweight position in France, held primarily for its less supportive macroeconomic conditions, contributed most to performance during the period.
How was the Portfolio positioned at period end?
At the end of the period, against the MSCI World Standard Index, the Portfolio had its largest overweight positions in the information technology and industrials sectors, driven primarily by investments in the electronic equipment, instruments & components and road & rail industries. Conversely, the Portfolio’s largest underweight positions were in the financials and communication services industries, driven by underweight positions in the capital markets and diversified telecommunication services industries.
At a country level, the Portfolio had its largest overweight positions in the U.S., primarily for its relatively strong momentum characteristics. The Portfolio held its second largest overweight position in Sweden, primarily for its relatively inexpensive valuations. Conversely, the Portfolio’s largest underweight positions were in the UK and Canada, primarily for their relatively weak momentum characteristics.
2658352.2
| Global Atlantic Goldman Sachs Global Equity Insights Portfolio |
| Portfolio Review (Continued) |
| June 30, 2019 (Unaudited) |
The Portfolio’s performance figures* for the periods ended June 30, 2019 as compared to its benchmark:
| | Six | One | Performance |
| | Months | Year | Since Inception** |
| Global Atlantic Goldman Sachs Global Equity Insights Portfolio | | | |
| Class I | 14.16% | 0.76% | 3.27% |
| Class II | 14.08% | 0.48% | 2.98% |
| MSCI World Standard Index (Net) | 16.98% | 6.33% | 6.11% |
| * | The performance data quoted is historical. Past performance is no guarantee of future results. Current performance may be higher or lower than the performance data quoted. The principal value and investment return of an investment will fluctuate so that your shares, when redeemed, may be worth more or less than their original cost. Total returns would have been lower absent fee waivers by the Adviser. Performance figures for periods greater than one year are annualized. The returns shown do not reflect the deduction of taxes that a shareholder may pay on Portfolio distributions or on the redemption of Portfolio shares, as well as other charges and expenses of the insurance contract or separate account. The Portfolio’s total annual operating expenses, after fee waiver and/or reimbursement, were 0.72% and 0.97% for Class I and Class II shares, respectively, per the May 1, 2019 prospectus. |
| ** | The Portfolio’s inception date is November 1, 2017. The Portfolio commenced operations on November 6, 2017. |
The MSCI World Standard Index (Net) represents large- and mid-cap equity performance across 23 developed markets countries, covering approximately 85% of the free float-adjusted market capitalization in each. It is not possible to invest directly in an index.
| Holdings by Asset Class | | % of Net Assets | |
| Common Stocks | | | 98.9 | % |
| Other Assets Less Liabilities - Net | | | 1.1 | % |
| | | | 100.0 | % |
Please refer to the Portfolio of Investments in this semi-annual report for more information regarding the Portfolio’s holdings as of June 30, 2019.
Global Atlantic Goldman Sachs Large Cap Growth Insights Portfolio
Portfolio Review (Unaudited) |
| June 30, 2019 |
The Portfolio seeks to provide long-term capital appreciation.
The Portfolio is sub-advised by Goldman Sachs Asset Management, L.P. (“GSAM”).
How did the Portfolio perform during the period?
During the first six months of 2019, the Class I shares of Global Atlantic Goldman Sachs Large Cap Growth Insights Portfolio underperformed its reference benchmark, the Russell 1000 Growth Index. The Portfolio posted a return of 19.36% compared to a benchmark return of 21.49%, a difference of -213 basis points. The following discussion of relative performance pertains to this benchmark.
What factors and allocation decisions influenced the Portfolio’s performance?
While many global equity markets finished 2018 in correction territory (a decline of greater than 20%), most markets erased those losses during the first six months of 2019 with the S&P 500 posting its strongest first half return (up 18.54%) since 1997. The S&P MidCap 400 and the Russell 2000 indices were both up 17-18% during the period, while the MSCI EAFE and MSCI Emerging Markets indices also posted strong returns, up 11-14%. The first half of 2019 was not without market volatility, however, as May saw a significant decline in major equity markets driven primarily by continued trade tensions between the U.S. and its major trading partners, mainly China and Mexico. Equity markets recovered significantly in June however, again eliminating most, if not all, of the declines experienced in May.
All four investment themes detracted from performance, with Fundamental Mispricings detracting most from results followed by High-Quality Business Models, Market Themes & Trends, and Sentiment Analysis. Among sectors, the Portfolio’s health care holdings detracted the most from returns, particularly an overweight position in the biotechnology and an underweight position in the health care equipment & supplies industries. On the positive side, holdings in the Industrials sector contributed the most to performance, mainly driven by underweight positions in the air freight & logistics and industrial conglomerate industries.
At an individual stock level, an overweight position in State Street Corp. detracted the most from returns despite scoring highly on Sentiment Analysis and Fundamental Mispricing related factors. Conversely, an overweight position in Chipotle Mexican Grill, Inc. (0.9%) contributed the most to returns as the stock scored highly on Sentiment Analysis and High-Quality Business Model related factors.
How was the Portfolio positioned at period end?
At the end of the period, against the Russell 1000 Growth Index, the Portfolio had its largest overweight positions in the information technology and utilities sectors, driven primarily by investments in the software and independent power and renewable electricity producers industries. Conversely, the Portfolio’s largest underweight positions were in the consumer staples and communication services industries, driven by underweight positions in the beverages and entertainment industries.
2658352.2
| Global Atlantic Goldman Sachs Large Cap Growth Insights Portfolio |
| Portfolio Review (Continued) |
| June 30, 2019 (Unaudited) |
The Portfolio’s performance figures* for the periods ended June 30, 2019 as compared to its benchmark:
| | Six | One | Performance |
| | Months | Year | Since Inception** |
| Global Atlantic Goldman Sachs Large Cap Growth Insights Portfolio | | | |
| Class I | 19.36% | 7.62% | 10.58% |
| Class II | 19.20% | 7.29% | 10.25% |
| Russell 1000® Growth Index (Total Return) | 21.49% | 11.56% | 14.00% |
| * | The performance data quoted is historical. Past performance is no guarantee of future results. Current performance may be higher or lower than the performance data quoted. The principal value and investment return of an investment will fluctuate so that your shares, when redeemed, may be worth more or less than their original cost. Total returns would have been lower absent fee waivers by the Adviser. Performance figures for periods greater than one year are annualized. The returns shown do not reflect the deduction of taxes that a shareholder may pay on Portfolio distributions or on the redemption of Portfolio shares, as well as other charges and expenses of the insurance contract or separate account. The Portfolio’s total annual operating expenses, after fee waiver and/or reimbursement, were 0.46% and 0.71% for Class I and Class II shares, respectively, per the May 1, 2019 prospectus. |
| ** | The Portfolio’s inception date is November 1, 2017. The Portfolio commenced operations on November 6, 2017. |
The Russell 1000® Growth Index (Total Return) is an unmanaged index of common stock prices that measures the performance of those Russell 1000®Index companies with higher price-to-book ratios and higher forecasted growth values. It is not possible to invest directly in an index.
| Holdings by Asset Class | | % of Net Assets | |
| Common Stocks | | | 99.1 | % |
| Money Market Fund | | | 0.3 | % |
| Other Assets Less Liabilities - Net | | | 0.6 | % |
| | | | 100.0 | % |
Please refer to the Portfolio of Investments in this semi-annual report for more information regarding the Portfolio’s holdings as of June 30, 2019.
| Global Atlantic Goldman Sachs Mid Cap Value Insights Portfolio |
| Portfolio Review (Unaudited) |
| June 30, 2019 |
The Portfolio seeks to provide long-term capital appreciation.
The Portfolio is sub-advised by Goldman Sachs Asset Management, L.P. (“GSAM”).
How did the Portfolio perform during the period?
During the first six months of 2019, the Class I shares of Global Atlantic Goldman Sachs Mid Cap Value Insights Portfolio underperformed its reference benchmark, the Russell Midcap Value Index. The Portfolio posted a return of 13.55% compared to a benchmark return of 18.02%, a difference of -447 basis points. The following discussion of relative performance pertains to this benchmark.
What factors and allocation decisions influenced the Portfolio’s performance?
While many global equity markets finished 2018 in correction territory (a decline of greater than 20%), most markets erased those losses during the first six months of 2019 with the S&P 500 posting its strongest first half return (up 18.54%) since 1997. The S&P MidCap 400 and the Russell 2000 indices were both up 17-18% during the period, while the MSCI EAFE and MSCI Emerging Markets indices also posted strong returns, up 11-14%. The first half of 2019 was not without market volatility, however, as May saw a significant decline in major equity markets driven primarily by continued trade tensions between the U.S. and its major trading partners, mainly China and Mexico. Equity markets recovered significantly in June however, again eliminating most, if not all, of the declines experienced in May.
All four investment themes detracted from performance, with High-Quality Business Models detracting most from results, followed by Market Themes & Trends, Fundamental Mispricings, and Sentiment Analysis. Among sectors, the Portfolio’s health care holdings detracted the most from returns, particularly overweight positions in the pharmaceuticals and biotechnology industries. On the positive side, holdings in the consumer discretionary sector contributed the most to performance, mainly driven by an underweight position in the multiline retail industry.
At an individual stock level, an overweight position in Mylan NV (0.4%) detracted the most from returns despite scoring highly on Sentiment Analysis and Fundamental Mispricing related factors. Conversely, an overweight position in ManpowerGroup, Inc. (0.3%) contributed the most to returns as the stock scored highly on Fundamental Mispricing related factors.
How was the Portfolio positioned at period end?
At the end of the period, against the Russell Mid Cap Value Index, the Portfolio had its largest overweight positions in the health care and financials sectors, mainly driven by overweight positions in the biotechnology and banking industries respectively. Conversely, the Portfolio’s largest underweight positions were in the real estate and communication services sectors, driven by underweight positions in the equity real estate investment trusts (REITs) and entertainment industries respectively.
2658352.2
| Global Atlantic Goldman Sachs Mid Cap Value Insights Portfolio |
| Portfolio Review (Continued) |
| June 30, 2019 (Unaudited) |
The Portfolio’s performance figures* for the periods ended June 30, 2019 as compared to its benchmark:
| | Six | One | Performance |
| | Months | Year | Since Inception** |
| Global Atlantic Goldman Sachs Mid Cap Value Insights Portfolio | | | |
| Class I | 13.55% | (0.10)% | 2.45% |
| Class II | 13.23% | (0.47)% | 2.10% |
| Russell Midcap® Value Index (Total Return) | 18.02% | 3.68% | 4.89% |
| * | The performance data quoted is historical. Past performance is no guarantee of future results. Current performance may be higher or lower than the performance data quoted. The principal value and investment return of an investment will fluctuate so that your shares, when redeemed, may be worth more or less than their original cost. Total returns would have been lower absent fee waivers by the Adviser. Performance figures for periods greater than one year are annualized. The returns shown do not reflect the deduction of taxes that a shareholder may pay on Portfolio distributions or on the redemption of Portfolio shares, as well as other charges and expenses of the insurance contract or separate account. The Portfolio’s total annual operating expenses, after fee waiver and/or reimbursement, were 0.64% and 0.89% for Class I and Class II shares, respectively, per the May 1, 2019 prospectus. |
| ** | The Portfolio’s inception date is November 1, 2017. The Portfolio commenced operations on November 6, 2017. |
The Russell Midcap® Value Index (Total Return) is an unmanaged index of common stock prices that measures the performance of those Russell Midcap companies with lower price-to-book ratios and lower forecasted growth values. It is not possible to invest directly in an index.
| Holdings by Asset Class | | % of Net Assets | |
| Common Stocks | | | 98.9 | % |
| Money Market Fund | | | 0.6 | % |
| Other Assets Less Liabilities - Net | | | 0.5 | % |
| | | | 100.0 | % |
Please refer to the Portfolio of Investments in this semi-annual report for more information regarding the Portfolio’s holdings as of June 30, 2019.
| Global Atlantic BlackRock Allocation Portfolio |
| PORTFOLIO OF INVESTMENTS |
| June 30, 2019 (Unaudited) |
| Shares | | | | | Value | |
| | | | | EXCHANGE TRADED FUNDS - 99.8% | | | | |
| | | | | DEBT FUNDS - 39.2% | | | | |
| | 35,734 | | | iShares iBoxx $ Investment Grade Corporate Bond ETF | | $ | 4,444,238 | |
| | 102,353 | | | iShares Intermediate-Term Corporate Bond ETF | | | 5,829,003 | |
| | 30,078 | | | iShares MBS ETF | | | 3,236,393 | |
| | 133,061 | | | iShares Short Maturity Bond ETF | | | 6,696,960 | |
| | 477,636 | | | iShares U.S. Treasury Bond ETF | | | 12,330,173 | |
| | | | | | | | 32,536,767 | |
| | | | | EQUITY FUNDS - 60.6% | | | | |
| | 118,616 | | | iShares Core MSCI EAFE ETF | | | 7,283,022 | |
| | 87,638 | | | iShares Core MSCI Emerging Markets ETF | | | 4,508,099 | |
| | 68,727 | | | iShares Core S&P 500 ETF | | | 20,257,283 | |
| | 124,643 | | | iShares Core S&P Total U.S. Stock Market ETF | | | 8,304,963 | |
| | 58,256 | | | iShares Edge MSCI Min Vol USA ETF | | | 3,596,143 | |
| | 23,428 | | | iShares Edge MSCI USA Momentum Factor ETF | | | 2,778,561 | |
| | 19,934 | | | iShares Global Tech ETF | | | 3,578,751 | |
| | | | | | | | 50,306,822 | |
| | | | | | | | | |
| | | | | TOTAL EXCHANGE TRADED FUNDS (Cost $78,167,139) | | | 82,843,589 | |
| | | | | | | | | |
| | | | | SHORT-TERM INVESTMENT - 0.0%^ | | | | |
| | | | | MONEY MARKET FUND - 0.0%^ | | | | |
| | 33,265 | | | Fidelity Investments Money Market Funds - Government Portfolio, Institutional Class to yield 2.25% (a) (Cost - $33,265) | | | 33,265 | |
| | | | | | | | | |
| | | | | TOTAL INVESTMENTS - 99.8% (Cost - $78,200,404) | | $ | 82,876,854 | |
| | | | | OTHER ASSETS LESS LIABILITES - NET - 0.2% | | | 172,209 | |
| | | | | TOTAL NET ASSETS - 100.0% | | $ | 83,049,063 | |
| (a) | Money market rate shown represents the rate at June 30, 2019. |
| ^ | Represents less than 0.05%. |
ETF - Exchange Traded Fund
See accompanying notes to financial statements.
| Global Atlantic BlackRock Disciplined Core Portfolio |
| PORTFOLIO OF INVESTMENTS |
| June 30, 2019 (Unaudited) |
| Shares | | | | | Value | |
| | | | | COMMON STOCKS - 98.5% | | | | |
| | | | | ADVERTISING - 0.5% | | | | |
| | 129,991 | | | Interpublic Group of Cos, Inc. | | $ | 2,936,497 | |
| | | | | | | | | |
| | | | | AEROSPACE/DEFENSE - 2.0% | | | | |
| | 15,205 | | | L3 Harris Technologies, Inc. * | | | 2,875,722 | |
| | 15,544 | | | Lockheed Martin Corp. | | | 5,650,866 | |
| | 17,803 | | | Raytheon Co. | | | 3,095,586 | |
| | | | | | | | 11,622,174 | |
| | | | | AGRICULTURE - 0.6% | | | | |
| | 33,958 | | | Archer-Daniels-Midland Co. | | | 1,385,486 | |
| | 24,198 | | | Philip Morris International, Inc. | | | 1,900,269 | |
| | | | | | | | 3,285,755 | |
| | | | | AIRLINES - 0.1% | | | | |
| | 7,700 | | | Delta Air Lines, Inc. | | | 436,975 | |
| | | | | | | | | |
| | | | | APPAREL - 0.6% | | | | |
| | 4,920 | | | Levi Strauss & Co. * | | | 102,730 | |
| | 42,335 | | | NIKE, Inc. | | | 3,554,023 | |
| | | | | | | | 3,656,753 | |
| | | | | AUTO MANUFACTURERS - 1.2% | | | | |
| | 96,057 | | | PACCAR, Inc. | | | 6,883,445 | |
| | 1,192 | | | Toyota Motor Corp. (ADR) | | | 147,796 | |
| | | | | | | | 7,031,241 | |
| | | | | AUTO PARTS & EQUIPMENT - 0.1% | | | | |
| | 26,527 | | | Dana, Inc. | | | 528,948 | |
| | 10,448 | | | Goodyear Tire & Rubber Co. (The) | | | 159,854 | |
| | | | | | | | 688,802 | |
| | | | | BANKS - 5.5% | | | | |
| | 172,898 | | | Bank of America Corp. | | | 5,014,042 | |
| | 3,599 | | | Citigroup, Inc. | | | 252,038 | |
| | 97,166 | | | Citizens Financial Group, Inc. | | | 3,435,790 | |
| | 2,075 | | | East West Bancorp, Inc. | | | 97,048 | |
| | 14,815 | | | First Republic Bank | | | 1,446,685 | |
| | 109,194 | | | JP Morgan Chase & Co. | | | 12,207,889 | |
| | 82,885 | | | Morgan Stanley | | | 3,631,192 | |
| | 6,229 | | | Royal Bank of Canada | | | 494,583 | |
| | 4,776 | | | SunTrust Banks, Inc. | | | 300,172 | |
| | 81,843 | | | Wells Fargo & Co. | | | 3,872,811 | |
| | 8,348 | | | Western Alliance Bancorp * | | | 373,323 | |
| | 9,737 | | | Zions Bancorp NA | | | 447,707 | |
| | | | | | | | 31,573,280 | |
See accompanying notes to financial statements.
| Global Atlantic BlackRock Disciplined Core Portfolio |
| PORTFOLIO OF INVESTMENTS (Continued) |
| June 30, 2019 (Unaudited) |
| Shares | | | | | Value | |
| | | | | BEVERAGES - 1.8% | | | | |
| | 34,584 | | | Diageo PLC (ADR) | | $ | 5,959,515 | |
| | 4,371 | | | Molson Coors Brewing Co. | | | 244,776 | |
| | 16,359 | | | Monster Beverage Corp. * | | | 1,044,195 | |
| | 21,173 | | | PepsiCo, Inc. | | | 2,776,415 | |
| | | | | | | | 10,024,901 | |
| | | | | BIOTECHNOLOGY - 2.7% | | | | |
| | 32,389 | | | Amgen, Inc. | | | 5,968,645 | |
| | 2,614 | | | Biogen, Inc. * | | | 611,336 | |
| | 16,278 | | | Celgene Corp. * | | | 1,504,738 | |
| | 73,302 | | | Gilead Sciences, Inc. | | | 4,952,283 | |
| | 4,298 | | | Regeneron Pharmaceuticals, Inc. * | | | 1,345,274 | |
| | 5,719 | | | Vertex Pharmaceuticals, Inc. * | | | 1,048,750 | |
| | | | | | | | 15,431,026 | |
| | | | | CHEMICALS - 2.0% | | | | |
| | 17,288 | | | Air Products & Chemicals, Inc. | | | 3,913,485 | |
| | 52,839 | | | Dow, Inc. | | | 2,605,491 | |
| | 14,616 | | | Dupont de Numours, Inc. | | | 1,097,223 | |
| | 5,553 | | | Ecolab, Inc. | | | 1,096,384 | |
| | 32,679 | | | LyondellBasell Industries NV | | | 2,814,642 | |
| | | | | | | | 11,527,225 | |
| | | | | COMMERCIAL SERVICES - 2.6% | | | | |
| | 34,423 | | | Automatic Data Processing, Inc. | | | 5,691,155 | |
| | 33 | | | Booz Allen Hamilton Holding Corp. | | | 2,185 | |
| | 2,314 | | | CoStar Group, Inc. * | | | 1,282,095 | |
| | 12,142 | | | H&R Block, Inc. | | | 355,761 | |
| | 19,039 | | | Insperity, Inc. | | | 2,325,423 | |
| | 17,299 | | | PayPal Holdings, Inc. * | | | 1,980,044 | |
| | 6,193 | | | S&P Global, Inc. | | | 1,410,703 | |
| | 14,647 | | | Square, Inc. * | | | 1,062,347 | |
| | 8,221 | | | TriNet Group, Inc. * | | | 557,384 | |
| | | | | | | | 14,667,097 | |
| | | | | COMPUTERS - 4.5% | | | | |
| | 94,684 | | | Apple, Inc. | | | 18,739,857 | |
| | 22,738 | | | Dell Technologies, Inc. Class C* | | | 1,155,090 | |
| | 1 | | | EPAM Systems, Inc. * | | | 173 | |
| | 90,203 | | | HP, Inc. | | | 1,875,320 | |
| | 27,281 | | | International Business Machines Corp. | | | 3,762,050 | |
| | | | | | | | 25,532,490 | |
| | | | | COSMETICS/PERSONAL CARE - 1.3% | | | | |
| | 18,224 | | | Colgate-Palmolive Co. | | | 1,306,114 | |
| | 9,456 | | | Estee Lauder Cos, Inc. | | | 1,731,488 | |
| | 38,413 | | | Procter & Gamble Co. | | | 4,211,985 | |
| | | | | | | | 7,249,587 | |
See accompanying notes to financial statements.
| Global Atlantic BlackRock Disciplined Core Portfolio |
| PORTFOLIO OF INVESTMENTS (Continued) |
| June 30, 2019 (Unaudited) |
| Shares | | | | | Value | |
| | | | | DISTRIBUTION/WHOLESALE - 0.1% | | | | |
| | 2,071 | | | WW Grainger, Inc. | | $ | 555,504 | |
| | | | | | | | | |
| | | | | DIVERSIFIED FINANCIAL SERVICES - 4.6% | | | | |
| | 31,378 | | | American Express Co. | | | 3,873,300 | |
| | 5,770 | | | Capital One Financial Corp. | | | 523,570 | |
| | 164,268 | | | Charles Schwab Corp. | | | 6,601,931 | |
| | 36,899 | | | Discover Financial Services | | | 2,862,993 | |
| | 3,217 | | | Evercore, Inc. | | | 284,930 | |
| | 8,538 | | | Franklin Resources, Inc. | | | 297,122 | |
| | 9,929 | | | Mastercard, Inc. | | | 2,626,518 | |
| | 11,269 | | | Synchrony Financial | | | 390,696 | |
| | 21,420 | | | TD Ameritrade Holding Corp. | | | 1,069,286 | |
| | 45,199 | | | Visa, Inc. | | | 7,844,286 | |
| | | | | | | | 26,374,632 | |
| | | | | ELECTRIC - 3.3% | | | | |
| | 62,787 | | | Alliant Energy Corp. | | | 3,081,586 | |
| | 11,912 | | | Avista Corp. | | | 531,275 | |
| | 10,612 | | | Black Hills Corp. | | | 829,540 | |
| | 42,084 | | | Consolidated Edison, Inc. | | | 3,689,925 | |
| | 17,887 | | | Dominion Energy, Inc. | | | 1,383,023 | |
| | 18,602 | | | DTE Energy Co. | | | 2,378,824 | |
| | 19,799 | | | Evergy, Inc. | | | 1,190,910 | |
| | 12,281 | | | IDACORP, Inc. | | | 1,233,381 | |
| | 15,901 | | | Pinnacle West Capital Corp. | | | 1,496,125 | |
| | 51,176 | | | Xcel Energy, Inc. | | | 3,044,460 | |
| | | | | | | | 18,859,049 | |
| | | | | ELECTRICAL COMPONENTS & EQUIPMENT - 0.2% | | | | |
| | 4,086 | | | AMETEK, Inc. | | | 371,172 | |
| | 2,736 | | | Generac Holdings, Inc. * | | | 189,906 | |
| | 6,088 | | | Hubbell, Inc. | | | 793,875 | |
| | | | | | | | 1,354,953 | |
| | | | | ELECTRONICS - 1.8% | | | | |
| | 31,108 | | | ADT, Inc. | | | 190,381 | |
| | 26,608 | | | Allegion PLC | | | 2,941,514 | |
| | 8,479 | | | Fortive Corp. | | | 691,208 | |
| | 28,742 | | | Honeywell International, Inc. | | | 5,018,066 | |
| | 34,316 | | | National Instruments Corp. | | | 1,440,929 | |
| | | | | | | | 10,282,098 | |
| | | | | ENGINEERING & CONSTRUCTION - 0.1% | | | | |
| | 4,663 | | | frontdoor, Inc. * | | | 203,074 | |
| | 3,181 | | | MasTec, Inc. * | | | 163,917 | |
| | | | | | | | 366,991 | |
| | | | | ENTERTAINMENT - 0.1% | | | | |
| | 25,685 | | | International Game Technology PLC | | | 333,134 | |
See accompanying notes to financial statements.
| Global Atlantic BlackRock Disciplined Core Portfolio |
| PORTFOLIO OF INVESTMENTS (Continued) |
| June 30, 2019 (Unaudited) |
| Shares | | | | | Value | |
| | | | | ENVIRONMENTAL CONTROL - 0.6% | | | | |
| | 9,363 | | | Waste Connections, Inc. | | $ | 894,916 | |
| | 22,860 | | | Waste Management, Inc. | | | 2,637,358 | |
| | | | | | | | 3,532,274 | |
| | | | | FOOD - 1.4% | | | | |
| | 59,983 | | | General Mills, Inc. | | | 3,150,307 | |
| | 20,338 | | | Hershey Co. | | | 2,725,902 | |
| | 6,858 | | | JM Smucker Co. (The) | | | 789,973 | |
| | 3,560 | | | McCormick & Co, Inc. | | | 551,836 | |
| | 15,538 | | | Performance Food Group Co. * | | | 621,986 | |
| | | | | | | | 7,840,004 | |
| | | | | GAS - 0.2% | | | | |
| | 9,839 | | | Southwest Gas Holdings, Inc. | | | 881,771 | |
| | | | | | | | | |
| | | | | HAND/MACHINE TOOLS - 0.4% | | | | |
| | 14,948 | | | Snap-on, Inc. | | | 2,475,987 | |
| | | | | | | | | |
| | | | | HEALTHCARE PRODUCTS - 2.3% | | | | |
| | 545 | | | Align Technology, Inc. * | | | 149,167 | |
| | 12,757 | | | Danaher Corp. | | | 1,823,230 | |
| | 1,272 | | | Hill-Rom Holdings, Inc. | | | 133,077 | |
| | 241 | | | IDEXX Laboratories, Inc. * | | | 66,355 | |
| | 69,352 | | | Medtronic PLC | | | 6,754,191 | |
| | 14,693 | | | Stryker Corp. | | | 3,020,587 | |
| | 4,577 | | | Thermo Fisher Scientific, Inc. | | | 1,344,173 | |
| | | | | | | | 13,290,780 | |
| | | | | HEALTHCARE - SERVICES - 1.5% | | | | |
| | 11,027 | | | Anthem, Inc. | | | 3,111,930 | |
| | 318 | | | Humana, Inc. | | | 84,365 | |
| | 20,653 | | | UnitedHealth Group, Inc. | | | 5,039,539 | |
| | 1,156 | | | WellCare Health Plans, Inc. * | | | 329,541 | |
| | | | | | | | 8,565,375 | |
| | | | | HOME BUILDERS - 0.0% ** | | | | |
| | 1,310 | | | Thor Industries, Inc. | | | 76,570 | |
| | | | | | | | | |
| | | | | HOUSEHOLD PRODUCTS/WARES - 0.3% | | | | |
| | 20,714 | | | Church & Dwight Co., Inc. | | | 1,513,365 | |
| | 1,150 | | | Kimberly-Clark Corp. | | | 153,272 | |
| | | | | | | | 1,666,637 | |
| | | | | INSURANCE - 5.2% | | | | |
| | 29,401 | | | Allstate Corp. | | | 2,989,788 | |
| | 21,717 | | | Arthur J Gallagher & Co. | | | 1,902,192 | |
| | 53,382 | | | Berkshire Hathaway, Inc. * | | | 11,379,441 | |
| | 2,569 | | | Cincinnati Financial Corp. | | | 266,328 | |
See accompanying notes to financial statements.
| Global Atlantic BlackRock Disciplined Core Portfolio |
| PORTFOLIO OF INVESTMENTS (Continued) |
| June 30, 2019 (Unaudited) |
| Shares | | | | | Value | |
| | | | | INSURANCE - 5.2% (Continued) | | | | |
| | 19,658 | | | First American Financial Corp. | | $ | 1,055,635 | |
| | 22,786 | | | Lincoln National Corp. | | | 1,468,558 | |
| | 23,092 | | | Loews Corp. | | | 1,262,440 | |
| | 53,871 | | | MetLife, Inc. | | | 2,675,773 | |
| | 51,396 | | | Prudential Financial, Inc. | | | 5,190,996 | |
| | 8,135 | | | Travelers Cos., Inc. | | | 1,216,345 | |
| | 3,330 | | | Unum Group | | | 111,722 | |
| | | | | | | | 29,519,218 | |
| | | | | INTERNET - 10.3% | | | | |
| | 5,467 | | | Alibaba Group Holding Ltd. (ADR) * | | | 926,383 | |
| | 3,075 | | | Alphabet, Inc. - Class A * | | | 3,329,610 | |
| | 7,067 | | | Alphabet, Inc. - Class C * | | | 7,638,791 | |
| | 10,984 | | | Amazon.com, Inc. * | | | 20,799,632 | |
| | 17,473 | | | Baidu, Inc. * (ADR) | | | 2,050,631 | |
| | 13,987 | | | CDW Corp. | | | 1,552,557 | |
| | 2,899 | | | Etsy, Inc. * | | | 177,912 | |
| | 62,632 | | | Facebook, Inc. * | | | 12,087,976 | |
| | 25,156 | | | GoDaddy, Inc. * | | | 1,764,693 | |
| | 20,633 | | | Lyft, Inc. * | | | 1,355,794 | |
| | 7,282 | | | Netflix, Inc. * | | | 2,674,824 | |
| | 12,307 | | | Pinterest, Inc. * | | | 334,996 | |
| | 13,692 | | | Twitter, Inc. * | | | 477,851 | |
| | 37,825 | | | Uber Technologies, Inc. * | | | 1,754,324 | |
| | 9,842 | | | VeriSign, Inc. * | | | 2,058,553 | |
| | | | | | | | 58,984,527 | |
| | | | | LEISURE - 0.3% | | | | |
| | 12,771 | | | Norwegian Cruise Line Holdings Ltd. * | | | 684,909 | |
| | 8,531 | | | Royal Caribbean Cruises Ltd. | | | 1,034,043 | |
| | | | | | | | 1,718,952 | |
| | | | | LODGING - 0.6% | | | | |
| | 92,946 | | | Extended Stay America, Inc. | | | 1,569,858 | |
| | 28,020 | | | Las Vegas Sands Corp. | | | 1,655,702 | |
| | | | | | | | 3,225,560 | |
| | | | | MACHINERY - CONSTRUCTION & MINING - 0.4% | | | | |
| | 10,046 | | | Caterpillar, Inc. | | | 1,369,169 | |
| | 8,270 | | | Oshkosh Corp. | | | 690,462 | |
| | | | | | | | 2,059,631 | |
See accompanying notes to financial statements.
| Global Atlantic BlackRock Disciplined Core Portfolio |
| PORTFOLIO OF INVESTMENTS (Continued) |
| June 30, 2019 (Unaudited) |
| Shares | | | | | Value | |
| | | | | MACHINERY - DIVERSIFIED - 1.7% | | | | |
| | 44,974 | | | Crane Co. | | $ | 3,752,631 | |
| | 6,465 | | | Cummins, Inc. | | | 1,107,713 | |
| | 3,621 | | | Curtiss-Wright Corp. | | | 460,338 | |
| | 21,086 | | | Rockwell Automation, Inc. | | | 3,454,519 | |
| | 3,288 | | | Roper Technologies, Inc. | | | 1,204,263 | |
| | | | | | | | 9,979,464 | |
| | | | | MEDIA - 1.7% | | | | |
| | 2 | | | AMC Networks, Inc. * | | | 109 | |
| | 21,989 | | | CBS Corp. | | | 1,097,251 | |
| | 149,484 | | | Comcast Corp. | | | 6,320,183 | |
| | 1,148 | | | Discovery, Inc. * | | | 32,661 | |
| | 9,667 | | | Fox Corp. - Class A | | | 354,199 | |
| | 3,904 | | | Fox Corp. - Class B | | | 142,613 | |
| | 7,702 | | | Liberty Media Corp-Liberty SiriusXM * | | | 291,213 | |
| | 8,379 | | | Sinclair Broadcast Group, Inc. | | | 449,366 | |
| | 37,856 | | | Sirius XM Holdings, Inc. | | | 211,236 | |
| | 22,606 | | | Viacom, Inc. | | | 675,241 | |
| | | | | | | | 9,574,072 | |
| | | | | MINING - 0.1% | | | | |
| | 1,464 | | | Franco-Nevada Corp. | | | 124,264 | |
| | 9,634 | | | Newmont Mining Corp. | | | 370,620 | |
| | | | | | | | 494,884 | |
| | | | | MISCELLANEOUS MANUFACTURING - 0.1% | | | | |
| | 9,137 | | | AO Smith Corp. | | | 430,901 | |
| | 16,496 | | | ArcelorMittal (ADR) | | | 297,423 | |
| | | | | | | | 728,324 | |
| | | | | OIL & GAS - 3.3% | | | | |
| | 11,534 | | | Anadarko Petroleum Corp. | | | 813,839 | |
| | 28,077 | | | Chevron Corp. | | | 3,493,902 | |
| | 14,473 | | | CNOOC Ltd. (ADR) | | | 2,465,476 | |
| | 86,550 | | | ConocoPhillips | | | 5,279,550 | |
| | 16,464 | | | EOG Resources, Inc. | | | 1,533,786 | |
| | 19,805 | | | Equinor ASA (ADR) | | | 391,743 | |
| | 36,078 | | | Exxon Mobil Corp. | | | 2,764,657 | |
| | 4,550 | | | Helmerich & Payne, Inc. | | | 230,321 | |
| | 4,400 | | | Petroleo Brasileiro SA (ADR) | | | 68,508 | |
| | 21,741 | | | Royal Dutch Shell PLC (ADR) | | | 1,414,687 | |
| | 4,822 | | | Valero Energy Corp. | | | 412,811 | |
| | | | | | | | 18,869,280 | |
See accompanying notes to financial statements.
| Global Atlantic BlackRock Disciplined Core Portfolio |
| PORTFOLIO OF INVESTMENTS (Continued) |
| June 30, 2019 (Unaudited) |
| Shares | | | | | Value | |
| | | | | OIL & GAS SERVICES - 0.5% | | | | |
| | 90,416 | | | Halliburton Co. | | $ | 2,056,060 | |
| | 13,954 | | | Schlumberger Ltd. | | | 554,532 | |
| | | | | | | | 2,610,592 | |
| | | | | PACKAGING & CONTAINERS - 0.5% | | | | |
| | 79,267 | | | WestRock Co. | | | 2,890,867 | |
| | | | | | | | | |
| | | | | PHARMACEUTICALS - 7.3% | | | | |
| | 55,282 | | | AbbVie, Inc. | | | 4,020,107 | |
| | 10,332 | | | AmerisourceBergen Corp. | | | 880,906 | |
| | 72,644 | | | Bristol-Myers Squibb Co. | | | 3,294,405 | |
| | 10,699 | | | Cigna Corp. | | | 1,685,627 | |
| | 42,070 | | | CVS Health Corp. | | | 2,292,394 | |
| | 2,532 | | | DexCom, Inc. * | | | 379,395 | |
| | 12,209 | | | Eli Lilly & Co. | | | 1,352,635 | |
| | 9,006 | | | Herbalife Nutrition Ltd. * | | | 385,097 | |
| | 95,674 | | | Johnson & Johnson | | | 13,325,475 | |
| | 6,094 | | | McKesson Corp. | | | 818,973 | |
| | 132,784 | | | Merck & Co., Inc. | | | 11,133,938 | |
| | 52,992 | | | Pfizer, Inc. | | | 2,295,613 | |
| | | | | | | | 41,864,565 | |
| | | | | PIPELINES - 0.2% | | | | |
| | 10,452 | | | Antero Midstream Corp. | | | 119,780 | |
| | 37,288 | | | Williams Cos., Inc. | | | 1,045,556 | |
| | | | | | | | 1,165,336 | |
| | | | | REAL ESTATE INVESTMENT TRUSTS - 2.9% | | | | |
| | 24,893 | | | Equity LifeStyle Properties, Inc. | | | 3,020,517 | |
| | 26,783 | | | Outfront Media, Inc. | | | 690,734 | |
| | 47,675 | | | Park Hotels & Resorts, Inc. | | | 1,313,923 | |
| | 63,369 | | | Prologis, Inc. | | | 5,075,857 | |
| | 62,714 | | | RLJ Lodging Trust | | | 1,112,546 | |
| | 11,054 | | | Ryman Hospitality Properties, Inc. | | | 896,369 | |
| | 28,787 | | | Simon Property Group, Inc. | | | 4,599,011 | |
| | | | | | | | 16,708,957 | |
| | | | | RETAIL - 4.5% | | | | |
| | 8,141 | | | Advance Auto Parts, Inc. | | | 1,254,854 | |
| | 922 | | | AutoZone, Inc. * | | | 1,013,711 | |
| | 757 | | | Chipotle Mexican Grill, Inc. * | | | 554,790 | |
| | 11,387 | | | Costco Wholesale Corp. | | | 3,009,129 | |
| | 31,903 | | | Darden Restaurants, Inc. | | | 3,883,552 | |
| | 3,424 | | | Dollar General Corp. | | | 462,788 | |
| | 2,270 | | | Domino’s Pizza, Inc. | | | 631,696 | |
| | 13,662 | | | Home Depot, Inc. | | | 2,841,286 | |
| | 7,353 | | | Lululemon Athletica, Inc. * | | | 1,325,084 | |
See accompanying notes to financial statements.
| Global Atlantic BlackRock Disciplined Core Portfolio |
| PORTFOLIO OF INVESTMENTS (Continued) |
| June 30, 2019 (Unaudited) |
| Shares | | | | | Value | |
| | | | | RETAIL - 4.5% (Continued) | | | | |
| | 15,082 | | | McDonald’s Corp. | | $ | 3,131,928 | |
| | 1,126 | | | O’Reilly Automotive, Inc. * | | | 415,854 | |
| | 27,473 | | | Target Corp. | | | 2,379,436 | |
| | 27,561 | | | TJX Cos., Inc. | | | 1,457,426 | |
| | 2,028 | | | Ulta Beauty, Inc. * | | | 703,493 | |
| | 17,305 | | | Walmart, Inc. | | | 1,912,029 | |
| | 9,466 | | | Yum! Brands, Inc. | | | 1,047,602 | |
| | | | | | | | 26,024,658 | |
| | | | | SEMICONDUCTORS - 2.8% | | | | |
| | 3,306 | | | Advanced Micro Devices, Inc. * | | | 100,403 | |
| | 35,449 | | | Applied Materials, Inc. | | | 1,592,015 | |
| | 5,166 | | | Broadcom, Inc. | | | 1,487,085 | |
| | 1 | | | Cabot Microelectronics Corp. | | | 110 | |
| | 9,308 | | | Cirrus Logic, Inc. * | | | 406,760 | |
| | 69,027 | | | Intel Corp. | | | 3,304,322 | |
| | 3,407 | | | Lam Research Corp. | | | 639,971 | |
| | 11,573 | | | NVIDIA Corp. | | | 1,900,634 | |
| | 14,902 | | | QUALCOMM, Inc. | | | 1,133,595 | |
| | 36,252 | | | Taiwan Semiconductor Manufacturing Co. Ltd. (ADR) | | | 1,419,991 | |
| | 19,801 | | | Texas Instruments, Inc. | | | 2,272,363 | |
| | 14,710 | | | Xilinx, Inc. | | | 1,734,603 | |
| | | | | | | | 15,991,852 | |
| | | | | SOFTWARE - 9.0% | | | | |
| | 18,961 | | | Activision Blizzard, Inc. | | | 894,959 | |
| | 17,303 | | | Adobe, Inc. * | | | 5,098,329 | |
| | 18,453 | | | Dropbox, Inc. * | | | 462,248 | |
| | 3,061 | | | Electronic Arts, Inc. * | | | 309,957 | |
| | 35,981 | | | Fidelity National Information Services, Inc. | | | 4,414,149 | |
| | 11,434 | | | Intuit, Inc. | | | 2,988,047 | |
| | 131,791 | | | Microsoft Corp. | | | 17,654,722 | |
| | 2,086 | | | NetEase, Inc. (ADR) | | | 533,536 | |
| | 37,007 | | | Oracle Corp. | | | 2,108,289 | |
| | 50,296 | | | Paychex, Inc. | | | 4,138,858 | |
| | 2,581 | | | Red Hat, Inc. * | | | 484,609 | |
| | 48,713 | | | salesforce.com, Inc. * | | | 7,391,223 | |
| | 8,124 | | | ServiceNow, Inc. * | | | 2,230,607 | |
| | 10,778 | | | Veeva Systems, Inc. * | | | 1,747,222 | |
| | 4,576 | | | Workday, Inc. * | | | 940,734 | |
| | | | | | | | 51,397,489 | |
| | | | | TELECOMMUNICATIONS - 3.4% | | | | |
| | 15,331 | | | AT&T, Inc. | | | 513,742 | |
| | 94,940 | | | BCE, Inc. | | | 4,317,871 | |
| | 41,878 | | | China Mobile Ltd. (ADR) | | | 1,896,655 | |
See accompanying notes to financial statements.
| Global Atlantic BlackRock Disciplined Core Portfolio |
| PORTFOLIO OF INVESTMENTS (Continued) |
| June 30, 2019 (Unaudited) |
| Shares | | | | | Value | |
| | | | | TELECOMMUNICATIONS - 3.4% (Continued) | | | | |
| | 13,980 | | | Ciena Corp. * | | $ | 574,997 | |
| | 134,716 | | | Cisco Systems, Inc. | | | 7,373,007 | |
| | 3 | | | Telephone & Data Systems, Inc. | | | 91 | |
| | 84,908 | | | Verizon Communications, Inc. | | | 4,850,794 | |
| | | | | | | | 19,527,157 | |
| | | | | TRANSPORTATION - 0.5% | | | | |
| | 4,802 | | | CSX Corp. | | | 371,531 | |
| | 13,158 | | | Landstar System, Inc. | | | 1,420,932 | |
| | 14,015 | | | Ryder System, Inc. | | | 817,074 | |
| | | | | | | | 2,609,537 | |
| | | | | TRUCKING & LEASING - 0.0% ** | | | | |
| | 3,519 | | | GATX Corp. | | | 279,021 | |
| | | | | | | | | |
| | | | | WATER - 0.8% | | | | |
| | 38,988 | | | American Water Works Co., Inc. | | | 4,522,608 | |
| | | | | | | | | |
| | | | | TOTAL COMMON STOCKS (Cost - $510,878,561) | | | 562,866,113 | |
| | | | | | | | | |
| | | | | SHORT-TERM INVESTMENT - 1.3% | | | | |
| | | | | MONEY MARKET FUND - 1.3% | | | | |
| | 7,507,530 | | | Fidelity Investments Money Market Funds - Government Portfolio, Institutional Class to yield 2.25% (a)(Cost - $7,507,530) | | | 7,507,530 | |
| | | | | | | | | |
| | | | | TOTAL INVESTMENTS - 99.8% (Cost - $518,386,091) | | $ | 570,373,643 | |
| | | | | OTHER ASSETS LESS LIABILITIES - NET - 0.2% | | | 1,313,715 | |
| | | | | TOTAL NET ASSETS - 100.0% | | $ | 571,687,358 | |
| * | Non-income producing security. |
| ** | Amount is less than 0.05% |
ADR - American Depository Receipt
PLC - Public Limited Company
| (a) | Money market rate shown represents the rate at June 30, 2019. |
| FUTURES CONTRACTS | |
| | | | | | | | | | | | | | | |
| | | Description | | Counterparty | | Contracts | | Expiration Date | | Notional Value | | | Unrealized Appreciation | |
| LONG | | | | | | | | | | | | | | | | |
| | | S&P 500 E-mini Future | | Goldman Sachs | | 62 | | September-19 | | $ | 9,127,020 | | | $ | 136,280 | |
| NET UNREALIZED APPRECIATION ON FUTURES CONTRACTS | | | $ | 136,280 | |
See accompanying notes to financial statements.
| Global Atlantic BlackRock Disciplined Growth Portfolio |
| PORTFOLIO OF INVESTMENTS |
| June 30, 2019 (Unaudited) |
| Shares | | | | | Value | |
| | | | | COMMON STOCKS - 97.8% | | | | |
| | | | | ADVERTISING - 0.7% | | | | |
| | 5,036 | | | Interpublic Group of Cos, Inc. | | $ | 113,763 | |
| | 141 | | | Omnicom Group, Inc. | | | 11,555 | |
| | | | | | | | 125,318 | |
| | | | | AEROSPACE/DEFENSE - 2.7% | | | | |
| | 178 | | | Boeing Co. | | | 64,794 | |
| | 490 | | | L3 Harris Technologies, Inc. * | | | 92,674 | |
| | 163 | | | Heico Corp. | | | 16,849 | |
| | 582 | | | Lockheed Martin Corp. | | | 211,580 | |
| | 371 | | | Raytheon Co. | | | 64,509 | |
| | 42 | | | Teledyne Technologies, Inc. * | | | 11,503 | |
| | | | | | | | 461,909 | |
| | | | | APPAREL - 1.0% | | | | |
| | 84 | | | Levi Strauss & Co. * | | | 1,754 | |
| | 2,109 | | | Nike, Inc. | | | 177,051 | |
| | | | | | | | 178,805 | |
| | | | | AUTO MANUFACTURERS - 0.6% | | | | |
| | 1,228 | | | PACCAR, Inc. | | | 87,998 | |
| | 36 | | | Tesla, Inc. * | | | 8,045 | |
| | | | | | | | 96,043 | |
| | | | | AUTO PARTS & EQUIPMENT - 0.0% ^ | | | | |
| | 274 | | | Dana, Inc. | | | 5,464 | |
| | | | | | | | | |
| | | | | BEVERAGES - 2.2% | | | | |
| | 132 | | | Brown-Forman Corp. - Class A | | | 7,260 | |
| | 337 | | | Brown-Forman Corp. - Class B | | | 18,680 | |
| | 226 | | | Keurig Dr. Pepper, Inc. | | | 6,531 | |
| | 1,371 | | | Monster Beverage Corp. * | | | 87,511 | |
| | 2,050 | | | PepsiCo., Inc. | | | 268,817 | |
| | | | | | | | 388,799 | |
| | | | | BIOTECHNOLOGY - 3.9% | | | | |
| | 1,273 | | | Amgen, Inc. | | | 234,588 | |
| | 159 | | | Biogen, Inc. * | | | 37,185 | |
| | 870 | | | Celgene Corp. * | | | 80,423 | |
| | 2,207 | | | Gilead Sciences, Inc. | | | 149,105 | |
| | 23 | | | Illumina, Inc. * | | | 8,467 | |
| | 209 | | | Incyte Corp. * | | | 17,757 | |
| | 267 | | | Regeneron Pharmaceuticals, Inc. * | | | 83,571 | |
| | 383 | | | Vertex Pharmaceuticals, Inc. * | | | 70,235 | |
| | | | | | | | 681,331 | |
| | | | | BUILDING MATERIALS - 0.0% ^ | | | | |
| | 30 | | | Vulcan Materials Co. | | | 4,119 | |
See accompanying notes to financial statements.
| Global Atlantic BlackRock Disciplined Growth Portfolio |
| PORTFOLIO OF INVESTMENTS (Continued) |
| June 30, 2019 (Unaudited) |
| Shares | | | | | Value | |
| | | | | CHEMICALS - 0.8% | | | | |
| | 293 | | | Air Products & Chemicals, Inc. | | $ | 66,326 | |
| | 320 | | | Ecolab, Inc. | | | 63,181 | |
| | 55 | | | LyondellBasell Industries NV | | | 4,737 | |
| | | | | | | | 134,244 | |
| | | | | COMMERCIAL SERVICES - 5.0% | | | | |
| | 1,454 | | | Automatic Data Processing, Inc. | | | 240,390 | |
| | 464 | | | Booz Allen Hamilton Holding Corp. | | | 30,721 | |
| | 205 | | | CoStar Group, Inc. * | | | 113,582 | |
| | 511 | | | H&R Block, Inc. | | | 14,972 | |
| | 666 | | | Insperity, Inc. | | | 81,345 | |
| | 563 | | | Paylocity Holding Corp. * | | | 52,821 | |
| | 1,308 | | | PayPal Holdings, Inc. * | | | 149,714 | |
| | 377 | | | S&P Global, Inc. | | | 85,877 | |
| | 848 | | | Square, Inc. * | | | 61,505 | |
| | 688 | | | TriNet Group, Inc. * | | | 46,646 | |
| | | | | | | | 877,573 | |
| | | | | COMPUTERS - 7.5% | | | | |
| | 304 | | | Accenture PLC | | | 56,170 | |
| | 5,510 | | | Apple, Inc. | | | 1,090,539 | |
| | 572 | | | Dell Technologies, Inc. - Class C * | | | 29,058 | |
| | 38 | | | Fortinet, Inc. * | | | 2,920 | |
| | 903 | | | International Business Machines Corp. | | | 124,524 | |
| | 65 | | | NetApp, Inc. | | | 4,011 | |
| | | | | | | | 1,307,222 | |
| | | | | COSMETICS/PERSONAL CARE - 0.3% | | | | |
| | 304 | | | Estee Lauder Cos, Inc. | | | 55,665 | |
| | | | | | | | | |
| | | | | DISTRIBUTION/WHOLESALE - 0.2% | | | | |
| | 104 | | | WW Grainger, Inc. | | | 27,896 | |
| | | | | | | | | |
| | | | | DIVERSIFIED FINANCIAL SERVICES - 6.1% | | | | |
| | 701 | | | American Express Co. | | | 86,531 | |
| | 3,806 | | | Charles Schwab Corp. | | | 152,963 | |
| | 955 | | | Discover Financial Services | | | 74,098 | |
| | 268 | | | Franklin Resources, Inc. | | | 9,326 | |
| | 841 | | | Mastercard, Inc. | | | 222,470 | |
| | 1,223 | | | TD Ameritrade Holding Corp. | | | 61,052 | |
| | 2,606 | | | Visa, Inc. | | | 452,271 | |
| | | | | | | | 1,058,711 | |
| | | | | ELECTRIC - 0.4% | | | | |
| | 569 | | | Alliant Energy Corp. | | | 27,927 | |
| | 45 | | | Consolidated Edison, Inc. | | | 3,946 | |
| | 293 | | | IDACORP, Inc. | | | 29,426 | |
| | | | | | | | 61,299 | |
See accompanying notes to financial statements.
| Global Atlantic BlackRock Disciplined Growth Portfolio |
| PORTFOLIO OF INVESTMENTS (Continued) |
| June 30, 2019 (Unaudited) |
| Shares | | | | | Value | |
| | | | | ELECTRICAL COMPONENTS & EQUIPMENT - 0.4% | | | | |
| | 312 | | | Generac Holdings, Inc. * | | $ | 21,656 | |
| | 384 | | | Hubbell, Inc. | | | 50,074 | |
| | | | | | | | 71,730 | |
| | | | | ELECTRONICS - 2.5% | | | | |
| | 1,248 | | | ADT, Inc. | | | 7,638 | |
| | 1,166 | | | Allegion PLC | | | 128,901 | |
| | 159 | | | Fortive Corp. | | | 12,962 | |
| | 993 | | | Honeywell International, Inc. | | | 173,368 | |
| | 22 | | | Mettler-Toledo International, Inc. * | | | 18,480 | |
| | 2,254 | | | National Instruments Corp. | | | 94,645 | |
| | | | | | | | 435,994 | |
| | | | | ENGINEERING & CONSTRUCTION - 0.1% | | | | |
| | 485 | | | Frontdoor, Inc. * | | | 21,122 | |
| | | | | | | | | |
| | | | | ENTERTAINMENT - 0.1% | | | | |
| | 537 | | | International Game Technology PLC | | | 6,965 | |
| | 103 | | | Six Flags Entertainment Corp. | | | 5,117 | |
| | 13 | | | Vail Resorts, Inc. | | | 2,901 | |
| | | | | | | | 14,983 | |
| | | | | ENVIRONMENTAL CONTROL - 0.5% | | | | |
| | 324 | | | Waste Connections, Inc. | | | 30,968 | |
| | 462 | | | Waste Management, Inc. | | | 53,301 | |
| | | | | | | | 84,269 | |
| | | | | FOOD - 0.7% | | | | |
| | 778 | | | General Mills, Inc. | | | 40,861 | |
| | 500 | | | Hershey Co. (The) | | | 67,015 | |
| | 311 | | | Performance Food Group Co. * | | | 12,449 | |
| | | | | | | | 120,325 | |
| | | | | GAS - 0.1% | | | | |
| | 148 | | | Southwest Gas Holdings, Inc. | | | 13,264 | |
| | | | | | | | | |
| | | | | HAND/MACHINE TOOLS - 0.2% | | | | |
| | 242 | | | Snap-On, Inc. | | | 40,085 | |
| | | | | | | | | |
| | | | | HEALTHCARE PRODUCTS - 1.6% | | | | |
| | 96 | | | Align Technology, Inc. * | | | 26,275 | |
| | 441 | | | Hill-Rom Holdings, Inc. | | | 46,137 | |
| | 232 | | | IDEXX Laboratories, Inc. * | | | 63,877 | |
| | 622 | | | Stryker Corp. | | | 127,871 | |
| | 56 | | | Thermo Fisher Scientific, Inc. | | | 16,446 | |
| | | | | | | | 280,606 | |
See accompanying notes to financial statements.
| Global Atlantic BlackRock Disciplined Growth Portfolio |
| PORTFOLIO OF INVESTMENTS (Continued) |
| June 30, 2019 (Unaudited) |
| Shares | | | | | Value | |
| | | | | HEALTHCARE - SERVICES - 2.1% | | | | |
| | 126 | | | Anthem, Inc. | | $ | 35,558 | |
| | 12 | | | Humana, Inc. | | | 3,184 | |
| | 1,244 | | | UnitedHealth Group, Inc. | | | 303,548 | |
| | 54 | | | WellCare Health Plans, Inc. * | | | 15,394 | |
| | | | | | | | 357,684 | |
| | | | | HOUSEHOLD PRODUCTS/WARES - 0.4% | | | | |
| | 922 | | | Church & Dwight Co., Inc. | | | 67,361 | |
| | 35 | | | Kimberly-Clark Corp. | | | 4,665 | |
| | | | | | | | 72,026 | |
| | | | | INSURANCE - 1.4% | | | | |
| | 377 | | | Berkshire Hathaway, Inc. * | | | 80,365 | |
| | 1,040 | | | First American Financial Corp. | | | 55,848 | |
| | 308 | | | Loews Corp. | | | 16,838 | |
| | 164 | | | Progressive Corp. (The) | | | 13,109 | |
| | 774 | | | Prudential Financial, Inc. | | | 78,174 | |
| | | | | | | | 244,334 | |
| | | | | INTERNET - 17.8% | | | | |
| | 254 | | | Alphabet, Inc. - Class A * | | | 275,031 | |
| | 374 | | | Alphabet, Inc. - Class C * | | | 404,260 | |
| | 565 | | | Amazon.com, Inc. * | | | 1,069,901 | |
| | 14 | | | Booking Holdings, Inc. * | | | 26,246 | |
| | 100 | | | Cargurus, Inc. * | | | 3,611 | |
| | 658 | | | CDW Corp. | | | 73,038 | |
| | 194 | | | Etsy, Inc. * | | | 11,906 | |
| | 3,176 | | | Facebook, Inc. * | | | 612,968 | |
| | 1,461 | | | GoDaddy, Inc. * | | | 102,489 | |
| | 1,008 | | | Lyft, Inc. * | | | 66,236 | |
| | 484 | | | Netflix, Inc. * | | | 177,783 | |
| | 117 | | | Palo Alto Networks, Inc. * | | | 23,840 | |
| | 594 | | | Pinterest, Inc. * | | | 16,169 | |
| | 202 | | | RingCentral, Inc. * | | | 23,214 | |
| | 855 | | | Twitter, Inc. * | | | 29,840 | |
| | 1,161 | | | Uber Technologies, Inc. * | | | 53,847 | |
| | 474 | | | VeriSign, Inc. * | | | 99,142 | |
| | 298 | | | Zendesk, Inc. | | | 26,531 | |
| | | | | | | | 3,096,052 | |
| | | | | LEISURE TIME - 0.3% | | | | |
| | 329 | | | Norwegian Cruise Line Holdings Ltd. * | | | 17,644 | |
| | 66 | | | Planet Fitness, Inc. * | | | 4,781 | |
| | 213 | | | Royal Caribbean Cruises Ltd. | | | 25,818 | |
| | | | | | | | 48,243 | |
| | | | | LODGING - 0.9% | | | | |
| | 4,199 | | | Extended Stay America, Inc. | | | 70,921 | |
| | 1,508 | | | Las Vegas Sands Corp. | | | 89,108 | |
| | 96 | | | Wyndham Destinations, Inc. | | | 4,214 | |
| | | | | | | | 164,243 | |
See accompanying notes to financial statements.
| Global Atlantic BlackRock Disciplined Growth Portfolio |
| PORTFOLIO OF INVESTMENTS (Continued) |
| June 30, 2019 (Unaudited) |
| Shares | | | | | Value | |
| | | | | MACHINERY - CONSTRUCTION & MINING - 0.2% | | | | |
| | 514 | | | Oshkosh Corp. | | $ | 42,914 | |
| | | | | | | | | |
| | | | | MACHINERY - DIVERSIFIED - 1.5% | | | | |
| | 823 | | | Crane Co. | | | 68,671 | |
| | 194 | | | Cummins, Inc. | | | 33,240 | |
| | 82 | | | Curtiss-Wright Corp. | | | 10,425 | |
| | 120 | | | IDEX Corp. | | | 20,657 | |
| | 668 | | | Rockwell Automation, Inc. | | | 109,438 | |
| | 29 | | | Roper Technologies, Inc. | | | 10,622 | |
| | | | | | | | 253,053 | |
| | | | | MEDIA - 0.7% | | | | |
| | 814 | | | CBS Corp. | | | 40,619 | |
| | 869 | | | Comcast Corp. | | | 36,741 | |
| | 205 | | | Sinclair Broadcast Group, Inc. | | | 10,994 | |
| | 5,476 | | | Sirius XM Holdings, Inc. | | | 30,556 | |
| | | | | | | | 118,910 | |
| | | | | OFFICE/BUSINESS EQUIPMENT - 0.0% ^ | | | | |
| | 13 | | | Zebra Technologies Corp. * | | | 2,723 | |
| | | | | | | | | |
| | | | | OIL & GAS - 0.3% | | | | |
| | 731 | | | ConocoPhillips | | | 44,591 | |
| | | | | | | | | |
| | | | | PACKAGING & CONTAINERS - 0.2% | | | | |
| | 1,149 | | | WestRock Co. | | | 41,904 | |
| | | | | | | | | |
| | | | | PHARMACEUTICALS - 5.2% | | | | |
| | 2,411 | | | AbbVie, Inc. | | | 175,328 | |
| | 292 | | | AmerisourceBergen Corp. | | | 24,896 | |
| | 1,474 | | | Bristol-Myers Squibb Co. | | | 66,846 | |
| | 111 | | | Cigna Corp. | | | 17,488 | |
| | 145 | | | CVS Health Corp. | | | 7,901 | |
| | 248 | | | DexCom, Inc. * | | | 37,160 | |
| | 21 | | | Eli Lilly & Co. | | | 2,327 | |
| | 166 | | | Herbalife Nutrition Ltd. * | | | 7,098 | |
| | 16 | | | Jazz Pharmaceuticals PLC * | | | 2,281 | |
| | 1,324 | | | Johnson & Johnson | | | 184,407 | |
| | 4,542 | | | Merck & Co., Inc. | | | 380,847 | |
| | | | | | | | 906,579 | |
| | | | | REAL ESTATE INVESTMENT TRUSTS - 2.2% | | | | |
| | 1,235 | | | Equity LifeStyle Properties, Inc. | | | 149,855 | |
| | 835 | | | Park Hotels & Resorts, Inc. | | | 23,013 | |
| | 480 | | | Prologis, Inc. | | | 38,448 | |
| | 429 | | | Ryman Hospitality Properties, Inc. | | | 34,788 | |
| | 841 | | | Simon Property Group, Inc. | | | 134,358 | |
| | | | | | | | 380,462 | |
See accompanying notes to financial statements.
| Global Atlantic BlackRock Disciplined Growth Portfolio |
| PORTFOLIO OF INVESTMENTS (Continued) |
| June 30, 2019 (Unaudited) |
| Shares | | | | | Value | |
| | | | | RETAIL - 5.8% | | | | |
| | 374 | | | Advance Auto Parts, Inc. | | $ | 57,648 | |
| | 63 | | | AutoZone, Inc. * | | | 69,267 | |
| | 49 | | | Chipotle Mexican Grill, Inc. * | | | 35,911 | |
| | 471 | | | Costco Wholesale Corp. | | | 124,466 | |
| | 961 | | | Darden Restaurants, Inc. | | | 116,983 | |
| | 312 | | | Dollar General Corp. | | | 42,170 | |
| | 175 | | | Domino’s Pizza, Inc. | | | 48,699 | |
| | 706 | | | Home Depot, Inc. | | | 146,827 | |
| | 371 | | | Lululemon Athletica, Inc. * | | | 66,858 | |
| | 220 | | | McDonald’s, Corp. | | | 45,685 | |
| | 113 | | | O’Reilly Automotive, Inc. * | | | 41,733 | |
| | 234 | | | Target, Corp. | | | 20,267 | |
| | 1,968 | | | TJX Cos, Inc. | | | 104,068 | |
| | 151 | | | Ulta Beauty, Inc. * | | | 52,380 | |
| | 304 | | | Yum! Brands, Inc. | | | 33,644 | |
| | | | | | | | 1,006,606 | |
| | | | | SEMICONDUCTORS - 3.6% | | | | |
| | 559 | | | Advanced Micro Devices, Inc. * | | | 16,977 | |
| | 2,046 | | | Applied Materials, Inc. | | | 91,886 | |
| | 191 | | | Broadcom, Inc. | | | 54,981 | |
| | 951 | | | Cirrus Logic, Inc. * | | | 41,559 | |
| | 104 | | | Lam Research Corp. | | | 19,535 | |
| | 653 | | | NVIDIA Corp. | | | 107,242 | |
| | 350 | | | ON Semiconductor Corp. * | | | 7,073 | |
| | 945 | | | Qualcomm, Inc. | | | 71,886 | |
| | 1,234 | | | Texas Instruments, Inc. | | | 141,614 | |
| | 610 | | | Xilinx, Inc. | | | 71,931 | |
| | | | | | | | 624,684 | |
| | | | | SOFTWARE - 15.6% | | | | |
| | 1,131 | | | Activision Blizzard, Inc. | | | 53,383 | |
| | 933 | | | Adobe Systems, Inc. * | | | 274,908 | |
| | 277 | | | Dropbox, Inc. * | | | 6,939 | |
| | 263 | | | Electronic Arts, Inc. * | | | 26,631 | |
| | 1,002 | | | Fidelity National Information Services, Inc. | | | 122,925 | |
| | 670 | | | First Data Corp. * | | | 18,137 | |
| | 468 | | | Intuit, Inc. | | | 122,302 | |
| | 7,922 | | | Microsoft Corp. | | | 1,061,231 | |
| | 469 | | | Oracle Corp. | | | 26,719 | |
| | 2,048 | | | Paychex, Inc. | | | 168,530 | |
| | 138 | | | Paycom Software, Inc. * | | | 31,287 | |
| | 183 | | | Red Hat, Inc. * | | | 34,360 | |
| | 1,892 | | | Salesforce.com, Inc. * | | | 287,073 | |
| | 711 | | | ServiceNow, Inc. * | | | 195,219 | |
| | 89 | | | Tableau Software, Inc. * | | | 14,776 | |
See accompanying notes to financial statements.
| Global Atlantic BlackRock Disciplined Growth Portfolio |
| PORTFOLIO OF INVESTMENTS (Continued) |
| June 30, 2019 (Unaudited) |
| Shares | | | | | Value | |
| | | | | SOFTWARE - 15.6% (Continued) | | | | |
| | 91 | | | Take-Two Interactive Software, Inc. * | | $ | 10,331 | |
| | 786 | | | Veeva Systems, Inc. * | | | 127,418 | |
| | 493 | | | Workday, Inc. * | | | 101,351 | |
| | 5,714 | | | Zynga, Inc. * | | | 35,027 | |
| | | | | | | | 2,718,547 | |
| | | | | TELECOMMUNICATIONS - 1.2% | | | | |
| | 652 | | | Ciena Corp. * | | | 26,817 | |
| | 2,905 | | | Cisco Systems, Inc. | | | 158,991 | |
| | 287 | | | Verizon Communications, Inc. | | | 16,396 | |
| | | | | | | | 202,204 | |
| | | | | TRANSPORTATION - 0.3% | | | | |
| | 221 | | | CSX Corp. | | | 17,099 | |
| | 174 | | | Expeditors International of Washington, Inc. | | | 13,200 | |
| | 224 | | | Landstar System, Inc. | | | 24,190 | |
| | | | | | | | 54,489 | |
| | | | | WATER - 0.5% | | | | |
| | 805 | | | American Water Works Co., Inc. | | | 93,380 | |
| | | | | | | | | |
| | | | | TOTAL COMMON STOCKS (Cost - $14,696,469) | | | 17,020,404 | |
| | | | | | | | | |
| | | | | SHORT-TERM INVESTMENT - 1.9% | | | | |
| | | | | MONEY MARKET FUND - 1.9% | | | | |
| | 329,920 | | | Fidelity Investments Money Market Funds - Government Portfolio, Institutional Class to yield 2.25% (a)(Cost - $329,920) | | | 329,920 | |
| | | | | | | | | |
| | | | | TOTAL INVESTMENTS - 99.7% (Cost - $15,026,086) | | $ | 17,350,324 | |
| | | | | OTHER ASSETS LESS LIABILITIES - NET - 0.3% | | | 50,329 | |
| | | | | TOTAL NET ASSETS - 100.0% | | $ | 17,400,653 | |
| * | Non-income producing security |
| ^ | Represents less than 0.05% |
PLC - Public Limited Company
| (a) | Money market rate shown represents the rate at June 30, 2019. |
| FUTURES CONTRACTS | |
| | | | | | | | | | | | Unrealized | |
| Description | | Counterparty | | Contracts | | Expiration Date | | Notional Value | | | Appreciation | |
| LONG | | | | | | | | | | | | | | |
| S&P 500 E-mini Future | | Goldman Sachs | | 2 | | Sep-19 | | $ | 294,420 | | | $ | 4,933 | |
| NET UNREALIZED APPRECIATION ON FUTURES CONTRACTS | | | $ | 4,933 | |
See accompanying notes to financial statements.
| Global Atlantic BlackRock Disciplined International Core Portfolio |
| PORTFOLIO OF INVESTMENTS |
| June 30, 2019 (Unaudited) |
| Shares | | | | | Value | |
| | | | | EXCHANGE TRADED FUNDS - 6.3% | | | | |
| | | | | EQUITY FUNDS - 6.3% | | | | |
| | 107,265 | | | iShares MSCI India ETF | | $ | 3,786,454 | |
| | 11,023 | | | iShares MSCI Saudi Arabia ETF | | | 363,979 | |
| | 123,962 | | | iShares MSCI Taiwan ETF | | | 4,333,712 | |
| | 36,720 | | | iShares MSCI Turkey ETF | | | 874,670 | |
| | | | | TOTAL EQUITY FUNDS (Cost - $9,221,276) | | | 9,358,815 | |
| | | | | | | | | |
| | | | | COMMON STOCKS - 90.1% | | | | |
| | | | | ADVERTISING - 0.0% + | | | | |
| | 1,000 | | | Dentsu, Inc. | | | 34,899 | |
| | 2,685 | | | WPP PLC | | | 33,837 | |
| | | | | | | | 68,736 | |
| | | | | AEROSPACE/DEFENSE - 0.3% | | | | |
| | 14 | | | Dassault Aviation SA | | | 20,152 | |
| | 1,295 | | | MTU Aero Engines AG | | | 308,959 | |
| | 6,624 | | | Rolls-Royce Holdings PLC | | | 70,849 | |
| | | | | | | | 399,960 | |
| | | | | AGRICULTURE - 0.9% | | | | |
| | 14,944 | | | British American Tobacco PLC | | | 522,839 | |
| | 78,000 | | | China Agri-Industries Holdings Ltd. | | | 25,060 | |
| | 1,858 | | | Easy Bio, Inc. * | | | 9,414 | |
| | 28,200 | | | Gudang Garam Tbk. PT | | | 153,451 | |
| | 9,270 | | | Imperial Brands PLC | | | 217,884 | |
| | 11,600 | | | Japan Tobacco, Inc. | | | 256,193 | |
| | 6,900 | | | QL Resources Bhd. | | | 11,421 | |
| | 1,668 | | | Swedish Match AB | | | 70,472 | |
| | | | | | | | 1,266,734 | |
| | | | | AIRLINES - 0.2% | | | | |
| | 92,000 | | | China Eastern Airlines Corp. Ltd. * | | | 54,287 | |
| | 48,576 | | | Qantas Airways Ltd. | | | 184,076 | |
| | | | | | | | 238,363 | |
| | | | | APPAREL - 2.4% | | | | |
| | 1,997 | | | adidas AG | | | 617,441 | |
| | 2,000 | | | Asics Corp. | | | 21,663 | |
| | 5,326 | | | boohoo Group PLC * | | | 14,350 | |
| | 1,386 | | | Burberry Group PLC | | | 32,845 | |
| | 827 | | | Christian Dior SE | | | 434,164 | |
| | 367 | | | Fila Korea Ltd. | | | 24,379 | |
| | 33 | | | Hermes International | | | 23,834 | |
| | 1,340 | | | Kering SA | | | 793,669 | |
| | 2,499 | | | LVMH Moet Hennessy Louis Vuitton SE | | | 1,065,206 | |
| | 9,746 | | | Moncler SpA | | | 417,313 | |
| | 1,640 | | | Puma SE | | | 109,537 | |
| | | | | | | | 3,554,401 | |
| | | | | AUTO MANUFACTURERS - 2.1% | | | | |
| | 40,500 | | | BAIC Motor Corp. Ltd. | | | 25,402 | |
| | 22,000 | | | China First Capital Group Ltd. * | | | 6,561 | |
| | 3,771 | | | Ferrari NV | | | 613,243 | |
| | 34,000 | | | Geely Automobile Holdings Ltd. | | | 58,143 | |
| | 9,300 | | | Honda Motor Co. Ltd. | | | 240,398 | |
| | 1,300 | | | Hyundai Motor Co. | | | 157,624 | |
See accompanying notes to financial statements.
| Global Atlantic BlackRock Disciplined International Core Portfolio |
| PORTFOLIO OF INVESTMENTS (Continued) |
| June 30, 2019 (Unaudited) |
| Shares | | | | | Value | |
| | | | | AUTO MANUFACTURERS - 2.1% (Continued) | | | | |
| | 3,576 | | | Kia Motors Corp. | | $ | 136,270 | |
| | 13,400 | | | Mitsubishi Motors Corp. | | | 64,177 | |
| | 26,500 | | | Nissan Motor Co. Ltd. | | | 189,785 | |
| | 1,229 | | | Peugeot SA | | | 30,329 | |
| | 13,500 | | | Sinotruk Hong Kong Ltd. | | | 23,363 | |
| | 8,700 | | | Toyota Motor Corp. | | | 540,056 | |
| | 113 | | | Volkswagen AG | | | 19,451 | |
| | 69,220 | | | Volvo AB | | | 1,099,305 | |
| | | | | | | | 3,204,107 | |
| | | | | AUTO PARTS & EQUIPMENT - 1.2% | | | | |
| | 3,200 | | | Aisin Seiki Co. Ltd. | | | 110,191 | |
| | 1,780 | | | Cie Generale des Etablissements Michelinn SCA | | | 226,119 | |
| | 2,700 | | | Denso Corp. | | | 113,598 | |
| | 4,002 | | | Faurecia SA | | | 185,991 | |
| | 4,503 | | | Hella GmbH Hueck & Co. KgaA | | | 222,966 | |
| | 429 | | | Hyundai Mobis Co. Ltd. | | | 87,498 | |
| | 26,900 | | | JTEKT Corp. | | | 326,076 | |
| | 10,600 | | | Tokai Rika Co. Ltd. * | | | 174,830 | |
| | 7,500 | | | Toyoda Gosei Co. Ltd. | | | 146,255 | |
| | 9,300 | | | Toyota Boshoku Corp. | | | 122,055 | |
| | 9,299 | | | Weichai Power Co. Ltd. | | | 16,639 | |
| | | | | | | | 1,732,218 | |
| | | | | BANKS - 11.5% | | | | |
| | 8,658 | | | ABSA Group Ltd. | | | 108,062 | |
| | 2,400 | | | Aeon Financial Service Co. Ltd. | | | 38,649 | |
| | 100 | | | Agricultural Bank of China Ltd. | | | 52 | |
| | 465,000 | | | Agricultural Bank of China Ltd. | | | 194,630 | |
| | 10,119 | | | Australia & New Zealand Banking Group Ltd. | | | 200,320 | |
| | 102,956 | | | Banco Bilbao Vizcaya Argentaria SA | | | 576,500 | |
| | 11,220 | | | Banco Bradesco SA * | | | 98,422 | |
| | 37,632 | | | Banco Bradesco SA Preferred * | | | 371,445 | |
| | 140,220 | | | Banco Comercial Portugues SA * | | | 43,418 | |
| | 5,300 | | | Banco del Bajio SA * | | | 10,605 | |
| | 9,300 | | | Banco do Brasil SA * | | | 130,498 | |
| | 20,600 | | | Banco Santander Brasil SA | | | 246,438 | |
| | 62,400 | | | Bank Central Asia Tbk. PT | | | 132,397 | |
| | 5,258 | | | Bank Leumi Le-Israel BM | | | 37,977 | |
| | 145,100 | | | Bank Mandiri Persero Tbk. PT | | | 82,423 | |
| | 923,000 | | | Bank of China Ltd. | | | 389,875 | |
| | 108,000 | | | Bank of Communications Co. Ltd. | | | 81,976 | |
| | 8,956 | | | Bank of Montreal | | | 677,963 | |
| | 11,077 | | | Bank of Nova Scotia (The) | | | 596,255 | |
| | 460,200 | | | Bank Rakyat Indonesia Persero Tbk. PT | | | 142,026 | |
| | 2,061 | | | Bankinter SA | | | 14,219 | |
| | 41,426 | | | Barclays PLC | | | 78,979 | |
| | 47,500 | | | BOC Hong Kong Holdings Ltd. | | | 186,960 | |
| | 1,206 | | | Canadian Imperial Bank of Commerce | | | 95,040 | |
| | 214,000 | | | China CITIC Bank Corp. Ltd. | | | 121,894 | |
| | 693,000 | | | China Construction Bank Corp. | | | 596,978 | |
| | 31,000 | | | China Everbright Bank Co. Ltd. | | | 17,196 | |
| | 345,600 | | | China Minsheng Banking Corp. Ltd. | | | 239,321 | |
See accompanying notes to financial statements.
| Global Atlantic BlackRock Disciplined International Core Portfolio |
| PORTFOLIO OF INVESTMENTS (Continued) |
| June 30, 2019 (Unaudited) |
| Shares | | | | | Value | |
| | | | | BANKS - 11.5% (Continued) | | | | |
| | 119,000 | | | Chongqing Rural Commercial Bank Co. Ltd. | | $ | 64,736 | |
| | 14,700 | | | CIMB Group Holdings Bhd. | | | 19,138 | |
| | 3,820 | | | Commonwealth Bank of Australia | | | 221,907 | |
| | 1,426 | | | Credicorp Ltd. | | | 326,426 | |
| | 4,800 | | | DBS Group Holdings Ltd. | | | 92,101 | |
| | 22,888 | | | DNB ASA | | | 426,027 | |
| | 5,900 | | | Erste Group Bank AG | | | 219,306 | |
| | 75,901 | | | FirstRand Ltd. | | | 368,975 | |
| | 24,900 | | | Grupo Financiero Banorte SAB de CV | | | 144,488 | |
| | 109,119 | | | HSBC Holdings PLC | | | 912,276 | |
| | 513,000 | | | Industrial & Commercial Bank of China Ltd. | | | 374,285 | |
| | 10,700 | | | Industrial Bank Co. Ltd. * | | | 28,494 | |
| | 1,090 | | | Industrial Bank of Korea * | | | 13,263 | |
| | 38,404 | | | ING Groep NV | | | 445,917 | |
| | 87,500 | | | Itau Unibanco Holding SA Preference* | | | 826,680 | |
| | 702 | | | KBC Group NV | | | 46,080 | |
| | 158,893 | | | Lloyds Banking Group PLC | | | 114,438 | |
| | 5,709 | | | Macquarie Group Ltd. | | | 502,349 | |
| | 140,800 | | | Malayan Banking Bhd. | | | 302,554 | |
| | 21,126 | | | Mediobanca Banca di Credito Finanziario SpA | | | 218,113 | |
| | 270,800 | | | Mitsubishi UFJ Financial Group, Inc. | | | 1,286,891 | |
| | 19,200 | | | Mizuho Financial Group, Inc. | | | 27,818 | |
| | 3,929 | | | Natixis SA | | | 15,835 | |
| | 2,059 | | | Nedbank Group Ltd. | | | 36,971 | |
| | 6,946 | | | Nordea Bank ABP | | | 50,473 | |
| | 11,759 | | | OTP Bank Nyrt | | | 468,809 | |
| | 21,800 | | | Oversea-Chinese Banking Corp. Ltd. | | | 183,688 | |
| | 13,000 | | | Postal Savings Bank of China Co. Ltd. | | | 7,721 | |
| | 30,300 | | | Public Bank Bhd. | | | 168,639 | |
| | 55,300 | | | Resona Holdings, Inc. | | | 230,254 | |
| | 6,292 | | | Royal Bank of Canada | | | 501,097 | |
| | 41,308 | | | Skandinaviska Enskilda Banken AB | | | 382,529 | |
| | 29,259 | | | Standard Bank Group Ltd. | | | 408,075 | |
| | 10,500 | | | Sumitomo Mitsui Financial Group, Inc. | | | 370,921 | |
| | 6,000 | | | Sumitomo Mitsui Trust Holdings, Inc. | | | 217,524 | |
| | 92,700 | | | Thanachart Capital PCL * (NVDR) | | | 167,762 | |
| | 21,275 | | | Toronto-Dominion Bank (The) | | | 1,245,811 | |
| | 7,653 | | | UBS Group AG | | | 91,051 | |
| | 2,500 | | | United Overseas Bank Ltd. | | | 48,283 | |
| | 2,054 | | | Woori Bank | | | 24,993 | |
| | 2,100 | | | Yamaguchi Financial Group, Inc. | | | 14,346 | |
| | | | | | | | 17,127,562 | |
| | | | | BASE METALS - 0.0% + | | | | |
| | 5,656 | | | OZ Minerals Ltd. * | | | 39,810 | |
| | | | | | | | | |
| | | | | BEVERAGES - 2.5% | | | | |
| | 75,000 | | | Ambev SA | | | 349,888 | |
| | 2,100 | | | Asahi Group Holdings Ltd. | | | 94,436 | |
| | 2,678 | | | Carlsberg A/S | | | 355,568 | |
| | 12,000 | | | China Resources Beer Holdings Co. Ltd. | | | 56,986 | |
| | 33,191 | | | Diageo PLC | | | 1,429,477 | |
See accompanying notes to financial statements.
| Global Atlantic BlackRock Disciplined International Core Portfolio |
| PORTFOLIO OF INVESTMENTS (Continued) |
| June 30, 2019 (Unaudited) |
| Shares | | | | | Value | |
| | | | | BEVERAGES - 2.5% (Continued) | | | | |
| | 2,200 | | | Fomento Economico Mexicano SAB de CV | | $ | 21,265 | |
| | 1,700 | | | Fraser & Neave Holdings Bhd. * | | | 14,217 | |
| | 537 | | | Heineken Holding NV | | | 56,445 | |
| | 20,400 | | | Kirin Holdings Co. Ltd. | | | 439,942 | |
| | 300 | | | Kweichow Moutai Co. Ltd. | | | 42,980 | |
| | 3,150 | | | Pernod Ricard SA | | | 581,309 | |
| | 856 | | | Royal Unibrew A/S | | | 62,561 | |
| | 1,100 | | | Suntory Beverage & Food Ltd. | | | 47,833 | |
| | 6,683 | | | Treasury Wine Estates Ltd. | | | 69,972 | |
| | 1,999 | | | Wuliangye Yibin Co. Ltd. | | | 34,329 | |
| | | | | | | | 3,657,208 | |
| | | | | BIOTECHNOLOGY- 0.5% | | | | |
| | 7,500 | | | 3SBio, Inc. | | | 12,883 | |
| | 240 | | | BeiGene Ltd. * (ADR) | | | 29,748 | |
| | 3,107 | | | CSL Ltd. | | | 468,773 | |
| | 416 | | | Genmab AS * | | | 76,612 | |
| | 3,647 | | | H Lundbeck AS | | | 144,289 | |
| | 33 | | | Medy-Tox, Inc. | | | 12,861 | |
| | 600 | | | PeptiDream, Inc. * | | | 30,685 | |
| | | | | | | | 775,851 | |
| | | | | BUILDING MATERIALS - 1.3% | | | | |
| | 3,000 | | | AGC, Inc. | | | 103,722 | |
| | 2,800 | | | Anhui Conch Cement Co. Ltd. * | | | 16,918 | |
| | 73,000 | | | BBMG Corp. | | | 23,453 | |
| | 180,400 | | | Cemex SAB DE CV * | | | 76,154 | |
| | 32,000 | | | China Resources Cement Holdings Ltd. | | | 31,007 | |
| | 4,096 | | | Cie de Saint-Gobain | | | 159,877 | |
| | 41,765 | | | CSR Ltd. | | | 114,597 | |
| | 3,967 | | | HeidelbergCement AG | | | 321,474 | |
| | 1,246 | | | Kingspan Group PLC | | | 67,769 | |
| | 600 | | | LafargeHolcim Ltd. | | | 29,335 | |
| | 3,800 | | | LIXIL Group Corp. | | | 60,100 | |
| | 1,600 | | | Sanwa Holdings Corp. | | | 17,197 | |
| | 5,155 | | | Sika AG | | | 880,844 | |
| | 1,028 | | | Wienerberger AG | | | 25,404 | |
| | | | | | | | 1,927,851 | |
| | | | | CHEMICALS - 2.5% | | | | |
| | 3,508 | | | Air Liquide SA | | | 491,574 | |
| | 2,378 | | | Arkema SA | | | 221,466 | |
| | 23,000 | | | Daicel Corp. | | | 204,511 | |
| | 2,300 | | | DIC Corp. | | | 60,713 | |
| | 2,653 | | | Evonik Industries AG | | | 77,374 | |
| | 26 | | | Givaudan SA | | | 73,493 | |
| | 1,194 | | | Hanwha Chemical Corp. * | | | 23,474 | |
| | 1,600 | | | JSR Corp. | | | 25,261 | |
| | 15,000 | | | Kingboard Laminates Holdings Ltd. | | | 13,747 | |
| | 4,482 | | | Koninklijke DSM NV | | | 554,816 | |
| | 315 | | | LG Chem Ltd. | | | 96,711 | |
| | 63 | | | Lotte Chemical Corp. * | | | 13,777 | |
| | 162 | | | LOTTE Fine Chemical Co. Ltd. * | | | 7,408 | |
| | 21,800 | | | Mitsubishi Chemical Holdings Corp. | | | 152,280 | |
See accompanying notes to financial statements.
| Global Atlantic BlackRock Disciplined International Core Portfolio |
| PORTFOLIO OF INVESTMENTS (Continued) |
| June 30, 2019 (Unaudited) |
| Shares | | | | | Value | |
| | | | | CHEMICALS - 2.5% (Continued) | | | | |
| | 300 | | | Nippon Shokubai Co. Ltd. * | | $ | 19,826 | |
| | 5,500 | | | Nitto Dekno Corp. | | | 271,427 | |
| | 13,229 | | | OC Oerlikon Corp. AG | | | 161,733 | |
| | 75,000 | | | PTT Global Chemical PCL (NVDR) | | | 156,518 | |
| | 4,000 | | | Shin-Etsu Chemical Co. Ltd. | | | 372,564 | |
| | 1,527 | | | Solvay SA | | | 158,418 | |
| | 19,300 | | | Sumitomo Chemical Co. Ltd. | | | 89,567 | |
| | 1,430 | | | Symrise AG | | | 137,835 | |
| | 12,700 | | | Ube Industries Ltd. | | | 263,336 | |
| | 1,036 | | | Victrex PLC | | | 28,533 | |
| | 900 | | | Zeon Corp. | | | 9,999 | |
| | | | | | | | 3,686,361 | |
| | | | | COAL - 0.1% | | | | |
| | 188,800 | | | Bukit Asam TBK PT * | | | 39,557 | |
| | 103,000 | | | China Coal Energy Co. Ltd. | | | 42,848 | |
| | 46,000 | | | China Shenhua Energy Co. Ltd. | | | 96,328 | |
| | | | | | | | 178,733 | |
| | | | | COMMERCIAL SERVICES - 1.2% | | | | |
| | 210 | | | Adyen NV * | | | 162,286 | |
| | 5,219 | | | Ashtead Group PLC | | | 149,716 | |
| | 800 | | | Benesse Holdings, Inc. | | | 18,623 | |
| | 1,217 | | | Bureau Veritas SA | | | 30,102 | |
| | 10,000 | | | Car, Inc. * | | | 7,910 | |
| | 7,363 | | | Edenred | | | 376,151 | |
| | 2,400 | | | Estacio Participacoes SA | | | 18,335 | |
| | 8,225 | | | Experian PLC | | | 249,556 | |
| | 10,645 | | | G4S PLC | | | 28,180 | |
| | 6,022 | | | IDP Education Ltd. | | | 74,630 | |
| | 620 | | | Intertek Group PLC | | | 43,415 | |
| | 3,773 | | | Randstad NV | | | 207,530 | |
| | 4,000 | | | Recruit Holdings Co. Ltd. | | | 133,432 | |
| | 7,500 | | | RELX PLC | | | 182,267 | |
| | 7,698 | | | Rentokil Initial PLC | | | 38,944 | |
| | 9,500 | | | Shenzhen International Holdings Ltd. | | | 18,848 | |
| | 500 | | | Toppan Printing Co. Ltd. | | | 7,588 | |
| | 5,485 | | | Transurban Group | | | 56,736 | |
| | | | | | | | 1,804,249 | |
| | | | | COMPUTERS - 1.4% | | | | |
| | 100 | | | BOE Technology Group Co. Ltd. | | | 50 | |
| | 2,633 | | | Capgemini SE | | | 327,882 | |
| | 9,367 | | | CGI Group, Inc. * | | | 721,691 | |
| | 1,488 | | | Check Point Software Technologies Ltd. * | | | 172,028 | |
| | 7,707 | | | Computershare Ltd. | | | 87,670 | |
| | 256 | | | Jenoptik AG | | | 8,294 | |
| | 98,000 | | | Lenovo Group Ltd. | | | 75,891 | |
| | 11,929 | | | Logitech International SA | | | 477,282 | |
| | 6,200 | | | Nihon Unisys Ltd. * | | | 208,029 | |
| | 1,300 | | | NTT Data Corp. | | | 17,315 | |
| | 156 | | | Samsung SDS Co. Ltd. | | | 29,048 | |
| | 86 | | | Teleperformance | | | 17,256 | |
| | | | | | | | 2,142,436 | |
See accompanying notes to financial statements.
| Global Atlantic BlackRock Disciplined International Core Portfolio |
| PORTFOLIO OF INVESTMENTS (Continued) |
| June 30, 2019 (Unaudited) |
| Shares | | | | | Value | |
| | | | | COSMETICS - 2.7% | | | | |
| | 318 | | | Amorepacific Corp. | | $ | 45,305 | |
| | 1,200 | | | Fancl Corp. * | | | 29,516 | |
| | 4,700 | | | Kao Corp. | | | 358,149 | |
| | 85 | | | LG Household & Health Care Ltd. | | | 96,657 | |
| | 5,100 | | | L’Oreal SA | | | 1,454,874 | |
| | 1,000 | | | Pigeon Corp. | | | 40,236 | |
| | 11,300 | | | Pola Orbis Holdings, Inc. | | | 315,695 | |
| | 17,883 | | | Unilever NV (Dutch Certificate) | | | 1,090,758 | |
| | 8,918 | | | Unilever PLC | | | 555,523 | |
| | | | | | | | 3,986,713 | |
| | | | | DISTRIBUTION/WHOLESALE - 1.2% | | | | |
| | 1,557 | | | Ferguson PLC | | | 110,969 | |
| | 35,836 | | | Inchcape PLC | | | 280,948 | |
| | 6,300 | | | Itochu Corp. | | | 120,486 | |
| | 233 | | | LG Corp. * | | | 15,518 | |
| | 23,800 | | | Marubeni Corp. | | | 157,503 | |
| | 42,700 | | | Mitsui & Co. Ltd. | | | 695,153 | |
| | 432 | | | Posco Daewoo Corp. * | | | 6,865 | |
| | 4,412 | | | Rexel SA | | | 56,097 | |
| | 19,200 | | | Sumitomo Corp. | | | 290,923 | |
| | 55,800 | | | United Tractors Tbk. PT | | | 111,383 | |
| | | | | | | | 1,845,845 | |
| | | | | DIVERSIFIED FINANCIAL SERVICES - 2.0% | | | | |
| | 582 | | | Aareal Bank AG | | | 15,357 | |
| | 258 | | | ASX Ltd. | | | 14,913 | |
| | 1,822 | | | Azimut Holding SpA | | | 35,128 | |
| | 7,300 | | | B3 SA- Brasil Bolsa Balcao SA | | | 71,483 | |
| | 3,300 | | | BOC Aviation Ltd. | | | 27,709 | |
| | 20,000 | | | China International Capital Corp. Ltd. | | | 40,346 | |
| | 84,100 | | | Daiwa Securities Group, Inc. | | | 368,513 | |
| | 2,699 | | | Deutsche Boerse AG | | | 382,359 | |
| | 539 | | | DWS Group GmbH & Co. KGaA | | | 18,893 | |
| | 524 | | | Flow Traders | | | 15,324 | |
| | 47,400 | | | Guotai Junan Securities Co. Ltd. * | | | 84,455 | |
| | 1,705 | | | Hana Financial Group, Inc. | | | 55,226 | |
| | 7,900 | | | Hitachi Capital Corp. * | | | 175,613 | |
| | 5,100 | | | Hong Kong Exchanges & Clearing Ltd. | | | 180,042 | |
| | 9,806 | | | IG Group Holdings PLC | | | 72,909 | |
| | 3,787 | | | KB Financial Group, Inc. | | | 150,378 | |
| | 206 | | | Korea Investment Holdings Co. Ltd. * | | | 14,398 | |
| | 13,300 | | | Krungthai Card PLC * (GDR) | | | 18,757 | |
| | 4,792 | | | Magellan Financial Group Ltd. | | | 171,502 | |
| | 9,333 | | | Man Group PLC | | | 18,506 | |
| | 5,297 | | | Meritz Securities Co. Ltd. * | | | 24,589 | |
| | 1,128 | | | Mirae Asset Daewoo Co. Ltd. * | | | 7,991 | |
| | 12,200 | | | Mitsubishi UFJ Lease & Finance Co. Ltd. * | | | 64,658 | |
| | 8,800 | | | Muangthai Capital PLC (NVDR) | | | 16,213 | |
| | 1,090 | | | NH Investment & Securities Co. Ltd. * | | | 13,688 | |
| | 29,706 | | | Old Mutual Ltd. | | | 44,660 | |
| | 16,500 | | | ORIX Corp. | | | 246,260 | |
| | 5,022 | | | Platinum Asset Management Ltd. | | | 17,092 | |
See accompanying notes to financial statements.
| Global Atlantic BlackRock Disciplined International Core Portfolio |
| PORTFOLIO OF INVESTMENTS (Continued) |
| June 30, 2019 (Unaudited) |
| Shares | | | | | Value | |
| | | | | DIVERSIFIED FINANCIAL SERVICES - 2.0% (Continued) | | | | |
| | 1,245 | | | Samsung Securities Co. Ltd. * | | $ | 42,160 | |
| | 9,540 | | | Schroders PLC | | | 370,318 | |
| | 2,770 | | | Shinhan Financial Group Co. Ltd. * | | | 107,715 | |
| | 18,999 | | | Standard Life Aberdeen PLC | | | 71,234 | |
| | 600 | | | Tokyo Century Corp. * | | | 25,311 | |
| | | | | | | | 2,983,700 | |
| | | | | ELECTRIC - 1.4% | | | | |
| | 5,415 | | | A2A SpA | | | 9,410 | |
| | 3,126 | | | AGL Energy Ltd. | | | 43,895 | |
| | 29,487 | | | AusNet Services | | | 38,798 | |
| | 1,768 | | | Capital Power Corp. | | | 40,792 | |
| | 47,000 | | | China Power International Development Ltd. | | | 11,491 | |
| | 5,700 | | | Chubu Electric Power Co., Inc. | | | 79,966 | |
| | 124,000 | | | Datang International Power Generation Co. Ltd. | | | 31,109 | |
| | 7,961 | | | E.ON SE | | | 86,589 | |
| | 1,091 | | | EDP Renovaveis SA | | | 11,207 | |
| | 3,458 | | | Emera, Inc. | | | 141,601 | |
| | 22,250 | | | Engie SA * | | | 338,013 | |
| | 5,800 | | | Glow Energy PCL (NVDR) * | | | 16,832 | |
| | 5,800 | | | Gulf Energy Development PCL | | | 23,262 | |
| | 8,800 | | | Gulf Energy Development PLC (NVDR) | | | 35,295 | |
| | 3,349 | | | Hera SpA * | | | 12,830 | |
| | 19,900 | | | Hokuriku Electric Power Co. * | | | 144,254 | |
| | 62,000 | | | Huadian Power International Corp. Ltd. | | | 24,522 | |
| | 6,806 | | | Iberdrola SA | | | 67,942 | |
| | 3,200 | | | Kansai Electric Power Co., Inc. | | | 36,666 | |
| | 1,686 | | | Korea Electric Power Corp. * | | | 37,308 | |
| | 3,304 | | | Northland Power, Inc. | | | 64,474 | |
| | 24,900 | | | Shikoku Electric Power Co., Inc. | | | 230,187 | |
| | 29,725 | | | Spark Infrastructure Group | | | 50,689 | |
| | 61,500 | | | Tenaga Nasional Bhd. | | | 205,967 | |
| | 31,825 | | | Terna Rete Elettrica Nazionale SpA | | | 202,957 | |
| | 1,382 | | | Uniper SE | | | 41,911 | |
| | 1,158 | | | Verbund AG | | | 60,662 | |
| | | | | | | | 2,088,629 | |
| | | | | ELECTRICAL COMPONENT & EQUIPMENT - 0.6% | | | | |
| | 2,000 | | | Casio Computer Co. Ltd. | | | 24,838 | |
| | 296 | | | LS Corp. * | | | 12,177 | |
| | 242 | | | LS Industrial Systems Co. Ltd. * | | | 10,584 | |
| | 500 | | | Mabuchi Motor Co. Ltd. | | | 17,101 | |
| | 8,335 | | | Schneider Electric SE | | | 757,074 | |
| | 785 | | | Signify NV | | | 23,243 | |
| | 25,600 | | | Xinjiang Goldwind Science & Technology Co. Ltd. | | | 27,984 | |
| | | | | | | | 873,001 | |
| | | | | ELECTRONICS - 0.4% | | | | |
| | 1,000 | | | Anritsu Corp. * | | | 17,384 | |
| | 5,038 | | | Assa Abloy AB | | | 113,974 | |
| | 14,654 | | | Electrocomponents PLC | | | 118,018 | |
| | 686 | | | Halma PLC | | | 17,636 | |
| | 1,669 | | | LG Display Co. Ltd. * | | | 25,801 | |
| | 100 | | | Nidec Corp. | | | 13,667 | |
See accompanying notes to financial statements.
| Global Atlantic BlackRock Disciplined International Core Portfolio |
| PORTFOLIO OF INVESTMENTS (Continued) |
| June 30, 2019 (Unaudited) |
| Shares | | | | | Value | |
| | | | | ELECTRONICS - 0.4% (Continued) | | | | |
| | 729 | | | Samsung Electro-Mechanics Co. Ltd. * | | $ | 61,747 | |
| | 778 | | | Sartorius AG Preference | | | 159,743 | |
| | | | | | | | 527,970 | |
| | | | | ENERGY - ALTERNATE SOURCES - 0.1% | | | | |
| | 140,000 | | | CK Power PCL (NVDR) | | | 32,184 | |
| | 1,226 | | | Landis+Gyr Group AG | | | 97,766 | |
| | 83 | | | OCI Co. Ltd. * | | | 6,707 | |
| | 333 | | | Vestas Wind Systems AS | | | 28,809 | |
| | 36,000 | | | Xinyi Solar Holdings Ltd. | | | 17,741 | |
| | | | | | | | 183,207 | |
| | | | | ENGINEERING & CONSTRUCTION - 1.8% | | | | |
| | 174 | | | Acciona SA | | | 18,705 | |
| | 1,111 | | | ACS Actividades de Construccion y Servicios SA | | | 44,421 | |
| | 2,176 | | | Aena SME SA | | | 431,921 | |
| | 2,758 | | | Bouygues SA | | | 102,296 | |
| | 150,000 | | | China Communications Construction Co. Ltd. | | | 134,208 | |
| | 110,000 | | | China Communications Services Corp. Ltd. | | | 85,325 | |
| | 142,500 | | | China Railway Construction Corp. Ltd. | | | 174,739 | |
| | 178,000 | | | China Railway Group Ltd. | | | 135,337 | |
| | 7,697 | | | CIMIC Group Ltd. | | | 241,819 | |
| | 197 | | | Daelim Industrial Co. Ltd. * | | | 19,621 | |
| | 1,783 | | | Daewoo Engineering & Construction Co. Ltd. * | | | 7,628 | |
| | 545 | | | Flughafen Zurich AG | | | 102,739 | |
| | 309 | | | Gaztransport Et Technigaz SA | | | 31,019 | |
| | 1,800 | | | Grupo Aeroportuario del Centro Norte SAB de CV | | | 10,989 | |
| | 423 | | | GS Engineering & Construction Corp. * | | | 14,782 | |
| | 3,519 | | | Hochtief AG | | | 429,197 | |
| | 606 | | | Hyundai Engineering & Construction Co. Ltd. * | | | 28,131 | |
| | 3,800 | | | Kajima Corp. | | | 52,129 | |
| | 3,900 | | | Kandenko Co. Ltd. * | | | 32,578 | |
| | 173,000 | | | Metallurgical Corp of China Ltd. | | | 46,281 | |
| | 1,322 | | | Samsung Engineering Co. Ltd. * | | | 19,636 | |
| | 21,300 | | | Singapore Technologies Engineering Ltd. | | | 65,178 | |
| | 42,574 | | | Sydney Airport | | | 240,206 | |
| | 2,200 | | | Taisei Corp. | | | 79,942 | |
| | 1,339 | | | Vinci SA | | | 137,328 | |
| | 390 | | | WSP Global, Inc. | | | 21,515 | |
| | | | | | | | 2,707,670 | |
| | | | | ENTERTAINMENT - 0.5% | | | | |
| | 22,797 | | | Aristocrat Leisure Ltd. | | | 491,452 | |
| | 2,600 | | | Sankyo Co. Ltd. | | | 94,115 | |
| | 2,900 | | | Toho Co. Ltd. | | | 123,278 | |
| | 10,828 | | | William Hill PLC | | | 21,298 | |
| | | | | | | | 730,143 | |
| | | | | FOOD - 3.8% | | | | |
| | 4,031 | | | A2 Milk Co. Ltd. * | | | 39,718 | |
| | 5,108 | | | A2 Milk Co. Ltd. * | | | 49,646 | |
| | 86 | | | Barry Callebaut AG | | | 172,706 | |
| | 25,100 | | | Berli Jucker PCL (NVDR) | | | 41,332 | |
| | 5,416 | | | Bid Corp. Ltd. | | | 117,909 | |
| | 900 | | | BRF SA * | | | 6,890 | |
See accompanying notes to financial statements.
| Global Atlantic BlackRock Disciplined International Core Portfolio |
| PORTFOLIO OF INVESTMENTS (Continued) |
| June 30, 2019 (Unaudited) |
| Shares | | | | | Value | |
| | | | | FOOD - 3.8% (Continued) | | | | |
| | 208 | | | Chr. Hansen Holding AS | | $ | 19,562 | |
| | 70 | | | CJ CheilJedang Corp. | | | 18,005 | |
| | 66,000 | | | Dali Foods Group Co. Ltd | | | 43,845 | |
| | 2,047 | | | Danone SA | | | 173,669 | |
| | 1,500 | | | Foshan Haitian Flavouring & Food Co. Ltd. | | | 22,931 | |
| | 1,220 | | | Greggs PLC | | | 35,681 | |
| | 16,500 | | | Indofood Sukses Makmur Tbk PT | | | 8,205 | |
| | 40,900 | | | JBS SA | | | 224,741 | |
| | 2,263 | | | Kesko OYJ | | | 126,072 | |
| | 700 | | | Kewpie Corp. | | | 15,470 | |
| | 2,720 | | | Magnit PJSC (GDR) | | | 39,644 | |
| | 24,594 | | | Nestle SA | | | 2,549,200 | |
| | 1,600 | | | Nichirei Corp. * | | | 37,973 | |
| | 47 | | | NongShim Co. Ltd. | | | 10,339 | |
| | 11,139 | | | Remgro Ltd. | | | 148,428 | |
| | 4,600 | | | Seven & i Holdings Co. Ltd. | | | 155,753 | |
| | 24,440 | | | SSP Group PLC | | | 213,379 | |
| | 12,950 | | | Suedzucker AG | | | 219,590 | |
| | 9,136 | | | Tate & Lyle PLC | | | 85,857 | |
| | 21,000 | | | Uni-President China Holdings Ltd. | | | 23,386 | |
| | 5,834 | | | Wesfarmers Ltd. | | | 148,039 | |
| | 127,500 | | | WH Group Ltd. | | | 129,254 | |
| | 113,475 | | | Wm Morrison Supermarkets PLC | | | 290,861 | |
| | 14,991 | | | Woolworths Group Ltd. | | | 349,578 | |
| | 8,448 | | | Woolworths Holdings Ltd. - South Africa * | | | 29,284 | |
| | 1,200 | | | Yamazaki Baking Co. Ltd. | | | 18,144 | |
| | 5,000 | | | Yihai International Holding Ltd. | | | 25,952 | |
| | | | | | | | 5,591,043 | |
| | | | | FOOD SERVICE - 0.6% | | | | |
| | 35,358 | | | Compass Group PLC | | | 849,153 | |
| | | | | | | | | |
| | | | | FOREST PRODUCTS & PAPER - 0.1% | | | | |
| | 26,300 | | | Indah Kiat Pulp & Paper Corp. Tbk PT | | | 17,453 | |
| | 13,000 | | | Pabrik Kertas Tjiwi Kimia Tbk. PT * | | | 11,571 | |
| | 1,178 | | | Smurfit Kappa Group PLC | | | 35,698 | |
| | 3,212 | | | UPM-Kymmene OYJ | | | 85,483 | |
| | | | | | | | 150,205 | |
| | | | | GAS - 0.5% | | | | |
| | 55,807 | | | Centrica PLC | | | 62,346 | |
| | 5,134 | | | Italgas SpA | | | 34,542 | |
| | 431 | | | Korea Gas Corp. * | | | 15,752 | |
| | 49,128 | | | National Grid PLC | | | 522,586 | |
| | 570 | | | Rubis ScA | | | 32,144 | |
| | 12,405 | | | Snam SpA | | | 61,748 | |
| | 14,000 | | | Towngas China Co. Ltd. | | | 10,089 | |
| | | | | | | | 739,207 | |
| | | | | HAND/MACHINE TOOLS - 0.1% | | | | |
| | 20,500 | | | Techtronic Industries Co. Ltd. | | | 156,915 | |
| | | | | | | | | |
| | | | | HEALTHCARE-PRODUCTS - 1.4% | | | | |
| | 1,400 | | | Asahi Intecc Co. Ltd. | | | 34,487 | |
See accompanying notes to financial statements.
| Global Atlantic BlackRock Disciplined International Core Portfolio |
| PORTFOLIO OF INVESTMENTS (Continued) |
| June 30, 2019 (Unaudited) |
| Shares | | | | | Value | |
| | | | | HEALTHCARE-PRODUCTS - 1.4% (Continued) | | | | |
| | 5,428 | | | Aspen Pharmacare Holdings Ltd. | | $ | 38,666 | |
| | 771 | | | Carl Zeiss Meditec AG | | | 76,168 | |
| | 2,331 | | | Cochlear Ltd. | | | 338,345 | |
| | 1,606 | | | Demant AS * | | | 50,013 | |
| | 3,501 | | | GN Store Nord AS | | | 163,619 | |
| | 21,000 | | | Hengan International Group Co. Ltd. | | | 154,426 | |
| | 7,613 | | | Koninklijke Philips NV * | | | 331,052 | |
| | 1,194 | | | Qiagen NV * | | | 48,529 | |
| | 1,266 | | | Sartorius Stedim Biotech | | | 199,967 | |
| | 16,661 | | | Smith & Nephew PLC | | | 361,536 | |
| | 603 | | | Sonova Holding AG | | | 137,175 | |
| | 181 | | | Straumann Holding AG | | | 159,911 | |
| | | | | | | | 2,093,894 | |
| | | | | HEALTHCARE-SERVICES - 0.3% | | | | |
| | 28,000 | | | Bangkok Dusit Medical Services PCL (NDVR) | | | 23,738 | |
| | 1,639 | | | Fresenius Medical Care AG & Co. KGaA | | | 128,863 | |
| | 2,275 | | | Fresenius SE & Co. KGaA | | | 123,528 | |
| | 6,000 | | | Genscript Biotech Corp. * | | | 15,068 | |
| | 10,800 | | | IHH Healthcare Bhd. | | | 15,158 | |
| | 300 | | | Miraca Holdings, Inc. | | | 6,822 | |
| | 420 | | | SillaJen, Inc. * | | | 17,969 | |
| | 2,563 | | | Sonic Healthcare Ltd. | | | 48,742 | |
| | | | | | | | 379,888 | |
| | | | | HOLDING COMPANIES - DIVERSIFIED - 0.2% | | | | |
| | 18,300 | | | Alfa SAB de CV | | | 17,927 | |
| | 66 | | | CJ Corp. * | | | 5,773 | |
| | 10 | | | CJ Corp. Preference * | | | 232 | |
| | 30,000 | | | CK Hutchison Holdings Ltd. | | | 295,680 | |
| | 600 | | | Jardine Matheson Holdings Ltd. | | | 37,812 | |
| | | | | | | | 357,424 | |
| | | | | HOME BUILDERS - 0.3% | | | | |
| | 2,397 | | | Bovis Homes Group PLC | | | 31,513 | |
| | 3,094 | | | Persimmon PLC | | | 78,637 | |
| | 181,006 | | | Taylor Wimpey PLC | | | 363,403 | |
| | | | | | | | 473,553 | |
| | | | | HOME FURNISHINGS - 0.1% | | | | |
| | 1,387 | | | LG Electronics, Inc. | | | 95,258 | |
| | | | | | | | | |
| | | | | INSURANCE - 5.2% | | | | |
| | 85,600 | | | AIA Group Ltd. | | | 923,110 | |
| | 3,646 | | | Allianz SE | | | 880,238 | |
| | 904 | | | ASR Nederland NV | | | 36,814 | |
| | 26,832 | | | Aviva PLC | | | 142,231 | |
| | 4,386 | | | AXA SA | | | 115,379 | |
| | 280 | | | Baloise Holding AG | | | 49,625 | |
| | 89,000 | | | China Life Insurance Co. Ltd. | | | 219,182 | |
| | 202,000 | | | China Reinsurance Group Corp. | | | 35,940 | |
| | 671 | | | CNP Assurances | | | 15,252 | |
| | 33,700 | | | Dai-ichi Life Holdings, Inc. | | | 508,284 | |
| | 4,188 | | | Direct Line Insurance Group PLC | | | 17,685 | |
| | 7,462 | | | Great-West Lifeco, Inc. | | | 172,167 | |
See accompanying notes to financial statements.
| Global Atlantic BlackRock Disciplined International Core Portfolio |
| PORTFOLIO OF INVESTMENTS (Continued) |
| June 30, 2019 (Unaudited) |
| Shares | | | | | Value | |
| | | | | INSURANCE - 5.2% (Continued) | | | | |
| | 1,794 | | | Hanwha Life Insurance Co. Ltd. | | $ | 5,088 | |
| | 1,500 | | | IRB Brasil Resseguros SA | | | 38,953 | |
| | 3,800 | | | Japan Post Holdings Co. Ltd. | | | 43,030 | |
| | 3,400 | | | Japan Post Insurance Co. Ltd. | | | 63,020 | |
| | 95,853 | | | Legal & General Group PLC | | | 328,769 | |
| | 30,597 | | | Manulife Financial Corp. | | | 557,267 | |
| | 50,903 | | | Medibank Pvt Ltd. | | | 124,667 | |
| | 47,411 | | | MMI Holdings Ltd. - South Africa * | | | 63,781 | |
| | 6,300 | | | MS&AD Insurance Group Holdings, Inc. | | | 199,981 | |
| | 845 | | | NN Group NV | | | 34,065 | |
| | 163,000 | | | People’s Insurance Co Group of China Ltd. (The) | | | 63,635 | |
| | 72,000 | | | PICC Property & Casualty Co. Ltd. | | | 77,691 | |
| | 4,700 | | | Ping An Insurance Group Co of China Ltd. | | | 60,636 | |
| | 48,000 | | | Ping An Insurance Group Co of China Ltd. | | | 576,307 | |
| | 8,219 | | | Power Corp. of Canada | | | 177,431 | |
| | 17,332 | | | Power Financial Corp. | | | 399,495 | |
| | 22,681 | | | QBE Insurance Group Ltd. | | | 188,291 | |
| | 77 | | | Samsung Fire & Marine Insurance Co. Ltd. * | | | 17,872 | |
| | 300 | | | Samsung Life Insurance Co. Ltd. | | | 21,721 | |
| | 41,276 | | | Sanlam Ltd. | | | 228,783 | |
| | 2,900 | | | Sompo Holdings, Inc. | | | 112,000 | |
| | 5,535 | | | Storebrand ASA | | | 40,691 | |
| | 3,804 | | | Sun Life Financial, Inc. | | | 157,866 | |
| | 246 | | | Swiss Life Holding AG | | | 122,066 | |
| | 1,975 | | | Swiss Re AG | | | 201,025 | |
| | 14,400 | | | T&D Holdings, Inc. | | | 156,310 | |
| | 6,800 | | | Tokio Marine Holdings, Inc. | | | 340,757 | |
| | 1,320 | | | Topdanmark AS | | | 74,560 | |
| | 2,295 | | | TRYG AS | | | 74,726 | |
| | 158 | | | Zurich Insurance Group AG | | | 55,081 | |
| | | | | | | | 7,721,472 | |
| | | | | INTERNET - 4.0% | | | | |
| | 611 | | | 58.com, Inc. * (ADR) | | | 37,986 | |
| | 10,528 | | | Alibaba Group Holding Ltd. * (ADR) | | | 1,783,970 | |
| | 28,441 | | | Auto Trader Group PLC | | | 198,287 | |
| | 311 | | | Autohome, Inc. * (ADR) | | | 26,628 | |
| | 1,730 | | | Baidu, Inc. * (ADR) | | | 203,033 | |
| | 1,597 | | | carsales.com Ltd. | | | 15,163 | |
| | 2,919 | | | Ctrip.com International Ltd. * (ADR) | | | 107,740 | |
| | 300 | | | CyberAgent, Inc. * | | | 10,873 | |
| | 368,000 | | | HengTen Networks Group Ltd. * | | | 8,761 | |
| | 6,373 | | | JD.com, Inc. * (ADR) | | | 193,038 | |
| | 2,400 | | | Kakaku.com, Inc. | | | 46,334 | |
| | 264 | | | Kakao Corp. * | | | 30,066 | |
| | 4,390 | | | Moneysupermarket.com Group PLC | | | 23,036 | |
| | 3,014 | | | Naspers Ltd. | | | 730,888 | |
| | 545 | | | NAVER Corp. | | | 53,809 | |
| | 62 | | | NCSoft Corp. | | | 25,613 | |
| | 1,181 | | | SEEK Ltd. | | | 17,537 | |
| | 557 | | | Shopify, Inc. | | | 167,763 | |
| | 1,822 | | | SINA Corp. - China * | | | 78,583 | |
See accompanying notes to financial statements.
| Global Atlantic BlackRock Disciplined International Core Portfolio |
| PORTFOLIO OF INVESTMENTS (Continued) |
| June 30, 2019 (Unaudited) |
| Shares | | | | | Value | |
| | | | | INTERNET - 4.0% (Continued) | | | | |
| | 45,000 | | | Tencent Holdings Ltd. | | $ | 2,030,976 | |
| | 1,900 | | | Trend Micro, Inc. - Japan * | | | 84,736 | |
| | 317 | | | Wix.com Ltd. * | | | 45,046 | |
| | 7,000 | | | Yahoo Japan Corp. | | | 20,531 | |
| | 209 | | | YY, Inc. * (ADR) | | | 14,565 | |
| | | | | | | | 5,954,962 | |
| | | | | INVESTMENT COMPANIES - 0.1% | | | | |
| | 1,119 | | | Industrivarden AB | | | 24,821 | |
| | 598 | | | Investor AB | | | 28,752 | |
| | 11,300 | | | Legend Holdings Corp. | | | 26,585 | |
| | 690 | | | Reinet Investments SCA | | | 11,116 | |
| | 144 | | | Wendel SA | | | 19,662 | |
| | | | | | | | 110,936 | |
| | | | | IRON/STEEL - 0.4% | | | | |
| | 44,200 | | | Angang Steel Co. Ltd. | | | 20,141 | |
| | 16,000 | | | China Oriental Group Co. Ltd. | | | 9,359 | |
| | 11,232 | | | Fortescue Metals Group Ltd. | | | 71,096 | |
| | 9,300 | | | Gerdau SA Preference * | | | 36,762 | |
| | 397 | | | Hyundai Steel Co. * | | | 14,372 | |
| | 42,000 | | | Maanshan Iron & Steel Co. Ltd. | | | 16,666 | |
| | 1,200 | | | POSCO | | | 254,103 | |
| | 2,569 | | | Salzgitter AG | | | 73,666 | |
| | 11,800 | | | Vale SA * | | | 159,513 | |
| | | | | | | | 655,678 | |
| | | | | LEISURE TIME - 0.2% | | | | |
| | 2,176 | | | Carnival PLC | | | 96,347 | |
| | 18,000 | | | China Travel International Investment Hong Kong Ltd. | | | 3,732 | |
| | 1,517 | | | CTS Eventim AG & Co. KGaA | | | 70,692 | |
| | 15,050 | | | TUI AG | | | 147,947 | |
| | 1,300 | | | Yamaha Motor Co. Ltd. | | | 23,107 | |
| | | | | | | | 341,825 | |
| | | | | LODGING - 0.1% | | | | |
| | 5,375 | | | Crown Resorts Ltd. | | | 46,960 | |
| | 1,513 | | | Melia Hotels International SA | | | 14,473 | |
| | 32,800 | | | Sands China Ltd. | | | 156,810 | |
| | | | | | | | 218,243 | |
| | | | | MACHINERY-CONSTRUCTION & MINING - 0.2% | | | | |
| | 15,100 | | | B Grimm Power PCL | | | 17,603 | |
| | 5,302 | | | Doosan Infracore Co. Ltd. * | | | 28,561 | |
| | 2,425 | | | Epiroc AB - Class A | | | 25,269 | |
| | 200 | | | Komatsu Ltd. | | | 4,826 | |
| | 11,692 | | | Sandvik AB | | | 214,983 | |
| | | | | | | | 291,242 | |
| | | | | MACHINERY- DIVERSIFED - 1.4% | | | | |
| | 5,000 | | | Amada Holdings Co. Ltd. | | | 56,293 | |
| | 13,015 | | | Atlas Copco AB - Class A | | | 416,336 | |
| | 504 | | | Bucher Industries AG | | | 173,893 | |
| | 500 | | | Keyence Corp. | | | 306,896 | |
| | 12,173 | | | Kone OYJ | | | 719,470 | |
| | 15,347 | | | Valmet OYJ | | | 383,100 | |
| | | | | | | | 2,055,988 | |
See accompanying notes to financial statements.
| Global Atlantic BlackRock Disciplined International Core Portfolio |
| PORTFOLIO OF INVESTMENTS (Continued) |
| June 30, 2019 (Unaudited) |
| Shares | | | | | Value | |
| | | | | MEDIA - 1.0% | | | | |
| | 1,300 | | | Fuji Media Holdings, Inc. | | $ | 18,123 | |
| | 673 | | | Lagardere SCA | | | 17,551 | |
| | 39,003 | | | Mediaset Espana Comunicacion SA | | | 284,000 | |
| | 3,328 | | | Multichoice Group Ltd. * | | | 31,618 | |
| | 11,967 | | | Pearson PLC | | | 124,798 | |
| | 20,066 | | | Quebecor, Inc. | | | 478,943 | |
| | 425 | | | Schibsted ASA | | | 11,729 | |
| | 5,500 | | | Tokyo Broadcasting System Holdings, Inc. | | | 93,930 | |
| | 2,167 | | | Vivendi SA | | | 59,745 | |
| | 4,321 | | | Wolters Kluwer NV * | | | 315,027 | |
| | | | | | | | 1,435,464 | |
| | | | | METAL FABRICATE/HARDWARE - 0.1% | | | | |
| | 4,900 | | | NTN Corp. | | | 14,554 | |
| | 9,743 | | | Sims Metal Management Ltd. | | | 74,251 | |
| | | | | | | | 88,805 | |
| | | | | MINING - 2.8% | | | | |
| | 12,878 | | | Anglo American PLC | | | 367,870 | |
| | 13,498 | | | Anglo American PLC | | | 385,377 | |
| | 1,113 | | | AngloGold Ashanti Ltd. | | | 20,049 | |
| | 42,525 | | | BHP Group Ltd. | | | 1,228,294 | |
| | 13,118 | | | BHP Group PLC | | | 336,410 | |
| | 73,719 | | | Centamin PLC | | | 107,333 | |
| | 25,600 | | | China Zhongwang Holdings Ltd. | | | 12,911 | |
| | 1,235 | | | Cia de Minas Buenaventura SAA (ADR) | | | 20,587 | |
| | 2,281 | | | Detour Gold Corp. * | | | 28,837 | |
| | 5,229 | | | Evolution Mining Ltd. | | | 15,999 | |
| | 1,142 | | | Franco-Nevada Corp. | | | 97,137 | |
| | 18,156 | | | Glencore PLC | | | 63,163 | |
| | 81,000 | | | Jiangxi Copper Co. Ltd. | | | 107,827 | |
| | 3,165 | | | Kirkland Lake Gold Ltd. | | | 136,651 | |
| | 40,000 | | | MMG Ltd. * | | | 13,978 | |
| | 27,056 | | | Regis Resources Ltd. | | | 100,249 | |
| | 8,119 | | | Rio Tinto Ltd. | | | 591,174 | |
| | 8,411 | | | Rio Tinto PLC | | | 522,442 | |
| | 912 | | | Southern Copper Corp. | | | 35,431 | |
| | 15,000 | | | Zhaojin Mining Industry Co. Ltd. | | | 16,800 | |
| | | | | | | | 4,208,519 | |
| | | | | MISCELLANEOUS MANUFACTURING - 0.8% | | | | |
| | 2,925 | | | Alfa Laval AB | | | 63,871 | |
| | 8,160 | | | Ansell Ltd. | | | 153,751 | |
| | 42,000 | | | China Railway Signal & Communication Corp. Ltd. | | | 30,536 | |
| | 4,500 | | | FUJIFILM Holdings Corp. | | | 228,174 | |
| | 1,400 | | | Nikon Corp. | | | 19,803 | |
| | 244 | | | POSCO Chemtech Co. Ltd. * | | | 11,327 | |
| | 4,918 | | | Siemens AG | | | 585,825 | |
| | 3,101 | | | Smiths Groups PLC | | | 61,765 | |
| | 12,400 | | | Top Glove Corp. Bhd. * | | | 14,733 | |
| | | | | | | | 1,169,785 | |
See accompanying notes to financial statements.
| Global Atlantic BlackRock Disciplined International Core Portfolio |
| PORTFOLIO OF INVESTMENTS (Continued) |
| June 30, 2019 (Unaudited) |
| Shares | | | | | Value | |
| | | | | OFFICE/BUSINESS EQUIPMENT - 0.2% | | | | |
| | 10,700 | | | Canon, Inc. | | $ | 312,439 | |
| | 3,800 | | | Ricoh Co. Ltd. | | | 37,951 | |
| | | | | | | | 350,390 | |
| | | | | OIL & GAS - 4.8% | | | | |
| | 67,888 | | | Beach Energy Ltd. | | | 94,566 | |
| | 100,504 | | | BP PLC | | | 701,723 | |
| | 536,000 | | | China Petroleum & Chemical Corp. | | | 364,308 | |
| | 51,300 | | | China Petroleum & Chemical Corp. * | | | 40,856 | |
| | 245,000 | | | CNOOC Ltd. | | | 418,970 | |
| | 78,823 | | | Ecopetrol SA | | | 71,769 | |
| | 12,715 | | | Enerplus Corp. | | | 95,843 | |
| | 12,983 | | | Galp Energia SGPS SA | | | 199,968 | |
| | 5,578 | | | Husky Energy, Inc. | | | 52,973 | |
| | 820 | | | Idemitsu Kosan Co. Ltd. | | | 24,659 | |
| | 5,125 | | | Imperial Oil Ltd. | | | 142,210 | |
| | 125,700 | | | JXTG Holdings, Inc. | | | 623,483 | |
| | 3,640 | | | Neste Oyj | | | 123,694 | |
| | 677 | | | Novatek PJSC (GDR) | | | 143,524 | |
| | 18,975 | | | Oil Search Ltd. | | | 94,142 | |
| | 4,935 | | | Parex Resources, Inc. * | | | 79,345 | |
| | 5,600 | | | Petrobras Distribuidora SA | | | 36,514 | |
| | 418,000 | | | PetroChina Co. Ltd. | | | 230,602 | |
| | 27,000 | | | Petroleo Brasileiro SA * | | | 210,638 | |
| | 8,861 | | | Petroleo Brasileiro SA Preference * | | | 63,094 | |
| | 11,500 | | | Petronas Dagangan Bhd. * | | | 70,684 | |
| | 17,900 | | | PTT Exploration & Production PCL (NVDR) * | | | 78,797 | |
| | 37,502 | | | Royal Dutch Shell PLC | | | 1,227,824 | |
| | 21,418 | | | Royal Dutch Shell PLC | | | 703,547 | |
| | 7,781 | | | Santos Ltd. | | | 38,659 | |
| | 5,561 | | | Saras SpA * | | | 8,385 | |
| | 204 | | | SK Holdings Co. Ltd. | | | 40,989 | |
| | 270 | | | SK Innovation Co. Ltd. * | | | 37,180 | |
| | 7,738 | | | Suncor Energy, Inc. | | | 241,896 | |
| | 20,500 | | | Thai Oil PCL * | | | 44,453 | |
| | 12,202 | | | Total SA | | | 684,708 | |
| | 5,600 | | | Ultrapar Participacoes SA * | | | 29,515 | |
| | 8,401 | | | Woodside Petroleum Ltd. | | | 214,357 | |
| | | | | | | | 7,233,875 | |
| | | | | OIL & GAS SERVICES - 0.2% | | | | |
| | 7,312 | | | Petrofac Ltd. | | | 40,016 | |
| | 304,400 | | | Sapura Energy Bhd. | | | 22,098 | |
| | 21,000 | | | Sinopec Engineering Group Co. Ltd. | | | 17,795 | |
| | 9,495 | | | Subsea 7 SA | | | 114,316 | |
| | 2,169 | | | TGS NOPEC Geophysical Co. ASA | | | 60,852 | |
| | 4,503 | | | WorleyParsons Ltd. | | | 46,483 | |
| | | | | | | | 301,560 | |
| | | | | PACKAGING & CONTAINERS - 0.0% + | | | | |
| | 528 | | | Huhtamaki OYJ | | | 21,743 | |
| | | | | | | | | |
| | | | | PHARMACEUTICALS - 6.2% | | | | |
| | 935 | | | Almirall SA | | | 17,292 | |
| | 4,717 | | | Amplifon SpA | | | 110,443 | |
See accompanying notes to financial statements.
| Global Atlantic BlackRock Disciplined International Core Portfolio |
| PORTFOLIO OF INVESTMENTS (Continued) |
| June 30, 2019 (Unaudited) |
| Shares | | | | | Value | |
| | | | | PHARMACEUTICALS - 6.2% (Continued) | | | | |
| | 46,500 | | | Astellas Pharma, Inc. | | $ | 662,498 | |
| | 4,335 | | | AstraZeneca PLC | | | 355,195 | |
| | 2,166 | | | Bausch Health Cos, Inc. * | | | 54,765 | |
| | 2,155 | | | Bayer AG | | | 149,554 | |
| | 640 | | | Celltrion, Inc. * | | | 113,905 | |
| | 174 | | | Celltrion Pharm, Inc. * | | | 7,241 | |
| | 24,000 | | | China Traditional Chinese Medicine Holdings Co. Ltd. * | | | 11,674 | |
| | 1,700 | | | Chugai Pharmaceutical Co. Ltd. | | | 111,082 | |
| | 53 | | | Daewoong Pharmaceutical Co. Ltd. | | | 6,885 | |
| | 2,400 | | | Eisai Co. Ltd. | | | 135,682 | |
| | 258 | | | Galenica AG | | | 12,966 | |
| | 56,321 | | | GlaxoSmithKline PLC | | | 1,130,104 | |
| | 2,112 | | | Grifols SA | | | 62,534 | |
| | 12,000 | | | Guangzhou Baiyunshan Pharmaceutical Holdings Co. Ltd. | | | 54,144 | |
| | 400 | | | Hisamitsu Pharmaceutical Co., Inc. | | | 15,797 | |
| | 8,700 | | | Hypera SA | | | 67,849 | |
| | 503 | | | Ipsen SA | | | 68,738 | |
| | 400 | | | Kissei Pharmaceutical Co. Ltd. | | | 9,987 | |
| | 200 | | | Kobayashi Pharmaceutical Co. Ltd. | | | 14,312 | |
| | 2,400 | | | Kyowa Hokka Kirin Co. Ltd. | | | 43,193 | |
| | 16,500 | | | Luye Pharma Group Ltd. | | | 11,954 | |
| | 6,600 | | | Medipal Holdings Corp. | | | 145,734 | |
| | 1,200 | | | Mitsubishi Tanabe Pharma Corp. | | | 13,366 | |
| | 17,565 | | | Novartis AG | | | 1,606,972 | |
| | 4,190 | | | Novo Nordisk AS | | | 213,847 | |
| | 6,200 | | | Otsuka Holdings Co. Ltd. | | | 202,332 | |
| | 7,499 | | | Roche Holding AG | | | 2,112,411 | |
| | 3,994 | | | Sanofi | | | 345,267 | |
| | 4,100 | | | Shionogi & Co. Ltd. | | | 236,281 | |
| | 14,000 | | | SSY Group Ltd. | | | 12,652 | |
| | 13,700 | | | Takeda Pharmaceutical Co. Ltd. | | | 486,125 | |
| | 3,529 | | | Teva Pharmaceutical Industries Ltd. * (ADR) | | | 32,573 | |
| | 1,254 | | | Teva Pharmaceutical Industries Ltd. * | | | 11,497 | |
| | 6,000 | | | Tong Ren Tang Technologies Co. Ltd. | | | 7,150 | |
| | 7,604 | | | UCB SA | | | 631,446 | |
| | 104 | | | ViroMed Co. Ltd. * | | | 15,186 | |
| | 1,500 | | | Wuxi Biologics Cayman, Inc. * | | | 13,469 | |
| | | | | | | | 9,314,102 | |
| | | | | PIPELINES - 0.4% | | | | |
| | 12,777 | | | Enbridge, Inc. | | | 462,485 | |
| | 880 | | | Gibson Energy, Inc. | | | 15,725 | |
| | 1,307 | | | TC Energy Corp. | | | 64,932 | |
| | | | | | | | 543,142 | |
| | | | | PRIVATE EQUITY - 0.1% | | | | |
| | 4,486 | | | Brookfield Asset Management, Inc. | | | 215,074 | |
| | | | | | | | | |
| | | | | REAL ESTATE - 2.0% | | | | |
| | 32,400 | | | CapitaLand Ltd. | | | 84,535 | |
| | 52,000 | | | China Overseas Land & Investment Ltd. | | | 191,693 | |
| | 21,000 | | | CK Asset Holdings Ltd. | | | 164,371 | |
| | 18,000 | | | Country Garden Holdings Co. Ltd. | | | 27,372 | |
See accompanying notes to financial statements.
| Global Atlantic BlackRock Disciplined International Core Portfolio |
| PORTFOLIO OF INVESTMENTS (Continued) |
| June 30, 2019 (Unaudited) |
| Shares | | | | | Value | |
| | | | | REAL ESTATE - 2.0% (Continued) | | | | |
| | 1,600 | | | Daito Trust Construction Co. Ltd. | | $ | 203,973 | |
| | 580 | | | Deutsche Wohnen AG | | | 21,314 | |
| | 2,081 | | | Fabege AB | | | 31,344 | |
| | 479 | | | Fastighets AB Balder * | | | 16,056 | |
| | 206 | | | FirstService Corp. | | | 19,863 | |
| | 28,000 | | | Future Land Development Holdings Ltd. | | | 36,844 | |
| | 10,500 | | | Greentown China Holdings Ltd. | | | 7,473 | |
| | 10,000 | | | Hang Lung Properties Ltd. | | | 23,782 | |
| | 38,300 | | | Hongkong Land Holdings Ltd. | | | 246,652 | |
| | 29,000 | | | Kaisa Group Holdings Ltd. * | | | 14,328 | |
| | 15,500 | | | KWG Property Holding Ltd. | | | 15,733 | |
| | 2,826 | | | LEG Immobilien AG | | | 319,250 | |
| | 26,000 | | | Logan Property Holdings Co. Ltd. | | | 42,066 | |
| | 4,100 | | | Mitsubishi Estate Co. Ltd. | | | 76,299 | |
| | 730 | | | PSP Swiss Property AG | | | 85,429 | |
| | 308 | | | REA Group Ltd. | | | 20,758 | |
| | 58,000 | | | Shanghai Industrial Holdings Ltd. | | | 125,763 | |
| | 38,000 | | | Shenzhen Investment Ltd. | | | 14,008 | |
| | 38,500 | | | Shui On Land Ltd. | | | 8,920 | |
| | 500 | | | Sumitomo Realty & Development Co. Ltd. | | | 17,858 | |
| | 18,000 | | | Sun Hung Kai Properties Ltd. | | | 305,280 | |
| | 3,000 | | | Sunac China Holdings Ltd. | | | 14,746 | |
| | 87,200 | | | Swire Properties Ltd. | | | 352,148 | |
| | 4,669 | | | TAG Immobilien AG * | | | 108,043 | |
| | 505 | | | TLG Immobilien AG | | | 14,809 | |
| | 1,400 | | | Tokyo Tatemono Co. Ltd. | | | 15,554 | |
| | 41,000 | | | Wharf Holdings Ltd. (The) | | | 108,634 | |
| | 30,000 | | | Wharf Real Estate Investment Co. Ltd. | | | 211,392 | |
| | 60,000 | | | Yuexiu Property Co. Ltd. | | | 13,594 | |
| | 20,000 | | | Yuzhou Properties Co. Ltd. | | | 9,395 | |
| | | | | | | | 2,969,279 | |
| | | | | REAL ESTATE INVESTMENT TRUSTS - 1.0% | | | | |
| | 999 | | | Alstria Office REIT AG | | | 16,200 | |
| | 5,068 | | | British Land Co. PLC (The) | | | 34,727 | |
| | 1,933 | | | Canadian Apartment Properties REIT | | | 71,536 | |
| | 339,200 | | | CapitaLand Mall Trust * | | | 659,371 | |
| | 5,413 | | | Charter Hall Group | | | 41,139 | |
| | 2,010 | | | Dexus | | | 18,308 | |
| | 19,445 | | | Goodman Group | | | 205,092 | |
| | 3,437 | | | Klepierre SA | | | 115,386 | |
| | 28,000 | | | Mapletree Commercial Trust | | | 43,254 | |
| | 14,100 | | | Mapletree Industrial Trust | | | 23,344 | |
| | 5,030 | | | Merlin Properties Socimi SA | | | 69,884 | |
| | 44,238 | | | Scentre Group | | | 119,209 | |
| | 4,909 | | | Stockland * | | | 14,365 | |
| | | | | | | | 1,431,815 | |
| | | | | RETAIL - 1.9% | | | | |
| | 4,819 | | | Alimentation Couche-Tard, Inc. | | | 303,909 | |
| | 4,000 | | | Alsea SAB de CV * | | | 7,891 | |
| | 900 | | | Aoyama Trading Co. Ltd. * | | | 17,642 | |
| | 196,800 | | | Astra International Tbk PT | | | 103,780 | |
See accompanying notes to financial statements.
| Global Atlantic BlackRock Disciplined International Core Portfolio |
| PORTFOLIO OF INVESTMENTS (Continued) |
| June 30, 2019 (Unaudited) |
| Shares | | | | | Value | |
| | | | | RETAIL - 1.9% (Continued) | | | | |
| | 16,976 | | | Barloworld Ltd. | | $ | 154,095 | |
| | 145,200 | | | Chow Tai Fook Jewellery Group Ltd. | | | 157,978 | |
| | 14,900 | | | Citizen Watch Co. Ltd. | | | 76,478 | |
| | 1,174 | | | Clicks Group Ltd. | | | 17,091 | |
| | 7,800 | | | CP All PCL (NVDR) | | | 21,873 | |
| | 685 | | | Domino’s Pizza Enterprises Ltd. | | | 18,093 | |
| | 46 | | | E-Mart, Inc. * | | | 5,577 | |
| | 600 | | | Fast Retailing Co. Ltd. | | | 362,706 | |
| | 1,497 | | | Hennes & Mauritz AB | | | 26,680 | |
| | 218 | | | Hotel Shilla Co. Ltd. * | | | 18,314 | |
| | 4,042 | | | Industria de Diseno Textil SA | | | 121,750 | |
| | 4,300 | | | Isetan Mitsukoshi Holdings Ltd. | | | 34,882 | |
| | 1,594 | | | JD Sports Fashion PLC | | | 11,896 | |
| | 20,000 | | | Li Ning Co. Ltd. * | | | 47,155 | |
| | 22,500 | | | Lifestyle International Holdings Ltd. | | | 32,890 | |
| | 2,200 | | | Lojas Renners SA * | | | 26,979 | |
| | 900 | | | Magazine Luiza SA | | | 49,020 | |
| | 4,012 | | | Restaurant Brands International, Inc. | | | 279,604 | |
| | 500 | | | Ryohin Keikaku Co. Ltd. | | | 90,310 | |
| | 535 | | | Samsung C&T Corp. | | | 44,342 | |
| | 700 | | | Shimachu Co. Ltd. * | | | 16,275 | |
| | 17,390 | | | Steinhoff International Holdings NV * | | | 1,603 | |
| | 3,800 | | | Sundrug Co. Ltd. | | | 102,848 | |
| | 3,500 | | | Takashimaya Co. Ltd. * | | | 38,365 | |
| | 162,400 | | | Wal-Mart de Mexico SAB de CV | | | 442,863 | |
| | 500 | | | Welcia Holdings Co. Ltd. | | | 20,350 | |
| | 3,339 | | | Yum China Holdings, Inc. | | | 154,262 | |
| | 11,000 | | | Zhongsheng Group Holdings Ltd. | | | 30,624 | |
| | | | | | | | 2,838,125 | |
| | | | | SEMICONDUCTORS - 2.0% | | | | |
| | 6,300 | | | Advantest Corp. | | | 173,376 | |
| | 995 | | | ASM International NV | | | 64,882 | |
| | 352 | | | ASML Holding NV | | | 73,654 | |
| | 2,927 | | | BE Semiconductor Industries NV | | | 75,465 | |
| | 2,947 | | | Dialog Semiconductor PLC * | | | 119,005 | |
| | 5,000 | | | Hua Hong Semiconductor Ltd. | | | 9,677 | |
| | 1,145 | | | NXP Semiconductors NV | | | 111,763 | |
| | 37,617 | | | Samsung Electronics Co. Ltd. | | | 1,531,199 | |
| | 4,018 | | | Samsung Electronics Co. Ltd. Preference | | | 133,104 | |
| | 728 | | | Seoul Semiconductor Co. Ltd. | | | 11,380 | |
| | 3,183 | | | SK Hynix, Inc. * | | | 191,589 | |
| | 5,924 | | | STMicroelectronics NV | | | 105,241 | |
| | 2,100 | | | Tokyo Electron Ltd. | | | 294,709 | |
| | 3,200 | | | Ulvac, Inc. * | | | 101,429 | |
| | | | | | | | 2,996,473 | |
| | | | | SHIPBUILDING - 0.0% + | | | | |
| | 447 | | | Daewoo Shipbuilding & Marine Engineering Co. Ltd. * | | | 12,659 | |
| | | | | | | | | |
| | | | | SOFTWARE - 2.2% | | | | |
| | 669 | | | Altium Ltd. | | | 16,056 | |
| | 2,102 | | | Amadeus IT Group SA | | | 166,749 | |
See accompanying notes to financial statements.
| Global Atlantic BlackRock Disciplined International Core Portfolio |
| PORTFOLIO OF INVESTMENTS (Continued) |
| June 30, 2019 (Unaudited) |
| Shares | | | | | Value | |
| | | | | SOFTWARE - 2.2% (Continued) | | | | |
| | 600 | | | Capcom Co. Ltd. | | $ | 12,040 | |
| | 103 | | | Com2usCorp. | | | 9,054 | |
| | 1,334 | | | CompuGroup Medical SE | | | 107,860 | |
| | 2,522 | | | Dassault Systemes SE | | | 402,949 | |
| | 510 | | | Descartes Systems Group, Inc. (The) * | | | 18,909 | |
| | 380 | | | GungHo Online Entertainment, Inc. | | | 10,510 | |
| | 14,000 | | | Kingdee International Software Group Co. Ltd. | | | 15,142 | |
| | 2,900 | | | Konami Holdings Corp. | | | 135,929 | |
| | 400 | | | Mixi, Inc. | | | 8,023 | |
| | 693 | | | Momo, Inc. (ADR) | | | 24,809 | |
| | 2,376 | | | Nemetschek SE | | | 143,271 | |
| | 754 | | | NetEase, Inc. (ADR) | | | 192,850 | |
| | 4,537 | | | Open Text Corp. | | | 187,624 | |
| | 62 | | | Pearl Abyss Corp. * | | | 11,400 | |
| | 7,442 | | | SAP SE | | | 1,023,435 | |
| | 1,610 | | | SimCorp AS | | | 155,989 | |
| | 6,129 | | | Software AG | | | 210,787 | |
| | 1,708 | | | Temenos Group AG | | | 305,951 | |
| | 1,600 | | | TOTVS SA * | | | 18,364 | |
| | 1,463 | | | Ubisoft Entertainment SA * | | | 114,692 | |
| | | | | | | | 3,292,393 | |
| | | | | TELECOMMUNICATIONS - 4.3% | | | | |
| | 532,300 | | | America Movil SAB de CV | | | 387,623 | |
| | 21,401 | | | BCE, Inc. | | | 975,758 | |
| | 76,500 | | | China Mobile Ltd. | | | 696,701 | |
| | 360,000 | | | China Telecom Corp. Ltd. | | | 181,094 | |
| | 30,000 | | | China Unicom Hong Kong Ltd. | | | 32,909 | |
| | 25,902 | | | Deutsche Telekom AG * | | | 448,711 | |
| | 763 | | | Freenet AG * | | | 15,288 | |
| | 14,900 | | | KDDI Corp. | | | 379,415 | |
| | 7 | | | KT Corp. * | | | 172 | |
| | 2,255 | | | LG Uplus Corp. * | | | 28,318 | |
| | 3,800 | | | Megacable Holdings SAB de CV | | | 16,180 | |
| | 3,876 | | | Mobile TeleSystems PJSC (ADR) | | | 36,085 | |
| | 5,400 | | | Nippon Telegraph & Telephone Corp. | | | 251,455 | |
| | 23,100 | | | NTT Docomo, Inc. | | | 538,693 | |
| | 14,353 | | | Orange SA | | | 226,626 | |
| | 1,912 | | | Rogers Communications, Inc. | | | 102,568 | |
| | 123 | | | Samsung SDI Co. Ltd. | | | 25,193 | |
| | 141 | | | SK Telecom Co. Ltd. | | | 31,628 | |
| | 12,200 | | | Softbank Corp. | | | 158,473 | |
| | 6,000 | | | SoftBank Group Corp. | | | 287,637 | |
| | 1,658 | | | Sunrise Communications Group AG | | | 123,882 | |
| | 15 | | | Swisscom AG | | | 7,540 | |
| | 25,159 | | | Telefonaktiebolaget LM Ericsson | | | 238,894 | |
| | 68,564 | | | Telefonica Deutschland Holding AG | | | 191,844 | |
| | 50,463 | | | Telefonica SA | | | 414,971 | |
| | 33,900 | | | Telekom Malaysia Bhd. | | | 32,813 | |
| | 10,676 | | | Telstra Corp. Ltd. | | | 28,844 | |
| | 12,300 | | | TIM Participacoes SA | | | 37,003 | |
See accompanying notes to financial statements.
| Global Atlantic BlackRock Disciplined International Core Portfolio |
| PORTFOLIO OF INVESTMENTS (Continued) |
| June 30, 2019 (Unaudited) |
| Shares | | | | | | | | | | Value | |
| | | | | TELECOMMUNICATIONS - 4.3% (Continued) | | | | | | |
| | 312,175 | | | Vodafone Group PLC | | | | | | | | $ | 513,795 | |
| | | | | | | | | | | | | | 6,410,113 | |
| | | | | TOYS/GAMES/HOBBIES - 0.0% + | | | | | | | | | | |
| | 100 | | | Nintendo Co. Ltd. | | | | | | | | | 36,653 | |
| | | | | | | | | | | | | | | |
| | | | | TRANSPORTATION - 2.0% | | | | | | | | | | |
| | 36 | | | AP Moller - Maersk AS | | | | | | | | | 44,723 | |
| | 2,551 | | | Canadian National Railway Co. | | | | | | | | | 236,603 | |
| | 335 | | | Canadian Pacific Railway Ltd. | | | | | | | | | 79,069 | |
| | 100 | | | Central Japan Railway Co. | | | | | | | | | 20,030 | |
| | 69 | | | CJ Lojostics Corp. * | | | | | | | | | 8,038 | |
| | 26,000 | | | Cosco Shipping Energy Transportation Co. Ltd. | | | | 15,375 | |
| | 77,500 | | | Cosco Shipping Holdings Co. Ltd. * | | | | | | | | | 30,256 | |
| | 14,437 | | | Deutsche Post AG | | | | | | | | | 475,141 | |
| | 5,408 | | | DSV AS | | | | | | | | | 531,888 | |
| | 6,600 | | | East Japan Railway Co. | | | | | | | | | 617,486 | |
| | 286 | | | Kuehne + Nagel International AG | | | | | | | | | 42,504 | |
| | 7,700 | | | Mitsubishi Logistics Corp. | | | | | | | | | 211,832 | |
| | 5,200 | | | Nippon Express Co. Ltd. | | | | | | | | | 276,555 | |
| | 22,458 | | | Royal Mail PLC | | | | | | | | | 60,566 | |
| | 152,000 | | | Sinotrans Ltd. | | | | | | | | | 55,255 | |
| | 6,893 | | | TFI International, Inc. | | | | | | | | | 209,045 | |
| | 1,200 | | | West Japan Railway Co. | | | | | | | | | 97,078 | |
| | | | | | | | | | | | | | 3,011,444 | |
| | | | | WATER - 0.3% | | | | | | | | | | |
| | 7,235 | | | Severn Trent PLC | | | | | | | | | 188,580 | |
| | 7,592 | | | Veolia Environnement SA | | | | | | | | | 185,192 | |
| | | | | | | | | | | | | | 373,772 | |
| | | | | | | | | | | | | | | |
| | | | | TOTAL COMMON STOCKS - (Cost -$134,325,066) | | | | 134,223,529 | |
| | | | | | | | | | | | | | | |
| | | | | | | Expiration Date | | Exercise Price | | | | | |
| | | | | RIGHT - 0.0% + | | | | | | | | | | |
| | 6 | | | Helixmith Co. Ltd. (Cost - $384) | | 8/7/2019 | | $ | 136,000 | | | | 170 | |
| | | | | | | | | | | | | | | |
| | | | | SHORT-TERM INVESTMENT - 0.6% | | | | | | | | | | |
| | | | | MONEY MARKET FUND - 0.6% | | | | | | | | | | |
| | 918,626 | | | Fidelity Investments Money Market - Government Portfolio, Institutional Class to yield 2.25% (a) (Cost - $918,626) | | | | 918,626 | |
| | | | | | | | | | | | | | | |
| | | | | TOTAL INVESTMENTS - 97.0% (Cost - $144,465,353) | | | $ | 144,501,140 | |
| | | | | OTHER ASSETS LESS LIABILITIES - NET - 3.0% | | | | 4,455,974 | |
| | | | | TOTAL NET ASSETS - 100.0% | | | | | | | | $ | 148,957,114 | |
ADR - American Depositary Receipt
ETF - Exchange Traded Fund
GDR - Global Depositary Receipt
NVDR - Non-voting Depositary Receipt
PLC - Public Limited Company
SDR - Special Drawing Rights
| * | Non-income producing security. |
| + | Represents less than 0.05%. |
| (a) | Money market rate shown represents the rate at June 30, 2019. |
See accompanying notes to financial statements.
| Global Atlantic BlackRock Disciplined International Core Portfolio |
| PORTFOLIO OF INVESTMENTS (Continued) |
| June 30, 2019 (Unaudited) |
| FUTURES CONTRACTS | |
| | | | | | | | | | | | Unrealized | |
| Description | | Counterparty | | Contracts | | Expiration Date | | Notional Value | | | Appreciation | |
| LONG | | | | | | | | | | | | | | |
| Euro Stoxx 50 Index | | Goldman Sachs | | 39 | | Sep-19 | | $ | 1,539,362 | | | $ | 38,334 | |
| FTSE 100 Index | | Goldman Sachs | | 6 | | Sep-19 | | | 562,712 | | | | 810 | |
| MSCI Emerging Market Index | | Goldman Sachs | | 16 | | Sep-19 | | | 842,720 | | | | 32,835 | |
| Nikkei Index (JPY) | | Goldman Sachs | | 13 | | Sep-19 | | | 1,285,340 | | | | 19,741 | |
| S&P/TSX 60 Index | | Goldman Sachs | | 2 | | Sep-19 | | | 299,277 | | | | 1,195 | |
| SPI 200 Index | | Goldman Sachs | | 2 | | Sep-19 | | | 230,139 | | | | 2,830 | |
| NET UNREALIZED APPRECIATION ON FUTURES CONTRACTS | | | $ | 95,745 | |
See accompanying notes to financial statements.
| Global Atlantic BlackRock Disciplined International Core Portfolio |
| PORTFOLIO OF INVESTMENTS (Continued) |
| June 30, 2019 (Unaudited) |
FORWARD FOREIGN CURRENCY CONTRACTS
| | | | | Currency Units to | | | | | | | | Unrealized Appreciation/ | |
| Settlement Date | | Counterparty | | Receive | | | | In Exchange For | | (Depreciation) | |
| 7/1/2019 | | Morgan Stanley | | $ | 44,061 | | USD | | $ | 845,103 | | MXN | | $ | 72 | |
| 7/1/2019 | | Morgan Stanley | | | 16,425 | | USD | | | 232,949 | | ZAR | | | (95 | ) |
| 7/1/2019 | | Morgan Stanley | | | 9,498 | | USD | | | 2,704,634 | | HUF | | | (44 | ) |
| 7/2/2019 | | Morgan Stanley | | | 82,922 | | CNH | | | 12,063 | | USD | | | 2 | |
| 7/2/2019 | | Morgan Stanley | | | 12,058 | | USD | | | 102,689 | | NOK | | | 14 | |
| NET UNREALIZED DEPRECIATION ON FORWARD FOREIGN CURRENCY CONTRACTS | | $ | (51 | ) |
See accompanying notes to financial statements.
Global Atlantic BlackRock Disciplined Mid Cap Growth Portfolio
PORTFOLIO OF INVESTMENTS
June 30, 2019 (Unaudited)
| Shares | | | | | Value | |
| | | | | COMMON STOCKS - 98.2% | | | | |
| | | | | ADVERTISING - 1.2% | | | | |
| | 66,506 | | | Interpublic Group of Cos., Inc. | | $ | 1,502,371 | |
| | 7,616 | | | Omnicom Group, Inc. | | | 624,131 | |
| | 907 | | | Trade Desk, Inc. * | | | 206,596 | |
| | | | | | | | 2,333,098 | |
| | | | | AEROSPACE/DEFENSE - 1.2% | | | | |
| | 6,503 | | | HEICO Corp. | | | 870,166 | |
| | 9,729 | | | HEICO Corp. - Class A | | | 1,005,687 | |
| | 2,411 | | | L3Harris Technologies, Inc. * | | | 455,992 | |
| | | | | | | | 2,331,845 | |
| | | | | APPAREL - 0.2% | | | | |
| | 10,197 | | | Levi Strauss & Co. * | | | 212,913 | |
| | 7,787 | | | Under Armour, Inc. - Class C * | | | 172,871 | |
| | | | | | | | 385,784 | |
| | | | | AUTO MANUFACTURERS - 0.5% | | | | |
| | 14,326 | | | PACCAR, Inc. | | | 1,026,601 | |
| | | | | | | | | |
| | | | | AUTO PARTS & EQUIPMENT - 0.2% | | | | |
| | 3,620 | | | Aptiv PLC | | | 292,605 | |
| | 3,621 | | | Dana, Inc. | | | 72,202 | |
| | | | | | | | 364,807 | |
| | | | | BANKS - 0.8% | | | | |
| | 7,043 | | | Synovus Financial Corp. | | | 246,505 | |
| | 27,495 | | | Western Alliance BanCorp * | | | 1,229,576 | |
| | | | | | | | 1,476,081 | |
| | | | | BEVERAGES - 0.4% | | | | |
| | 659 | | | Brown-Forman Corp. - Class A | | | 36,245 | |
| | 13,264 | | | Brown-Forman Corp. - Class B | | | 735,224 | |
| | | | | | | | 771,469 | |
| | | | | BIOTECHNOLOGY - 2.5% | | | | |
| | 2,040 | | | Alnylam Pharmaceuticals, Inc. * | | | 148,022 | |
| | 609 | | | Amgen, Inc. | | | 112,227 | |
| | 9,775 | | | BioMarin Pharmaceutical, Inc. * | | | 837,229 | |
| | 133 | | | Bio-Rad Laboratories, Inc. * | | | 41,574 | |
| | 4,026 | | | Exact Sciences Corp. * | | | 475,229 | |
| | 10,973 | | | Exelixis, Inc. * | | | 234,493 | |
| | 2,546 | | | Gilead Sciences, Inc. | | | 172,008 | |
| | 16,374 | | | Incyte Corp. * | | | 1,391,135 | |
| | 10,360 | | | Ionis Pharmaceuticals, Inc. * | | | 665,837 | |
| | 1,101 | | | Regeneron Pharmaceuticals, Inc. * | | | 344,613 | |
| | 6,356 | | | Seattle Genetics, Inc. * | | | 439,899 | |
| | 536 | | | Vertex Pharmaceuticals, Inc. * | | | 98,292 | |
| | | | | | | | 4,960,558 | |
| | | | | BUILDING MATERIALS - 1.2% | | | | |
| | 861 | | | Lennox International, Inc. | | | 236,775 | |
| | 3,722 | | | Martin Marietta Materials, Inc. | | | 856,469 | |
| | 9,093 | | | Vulcan Materials Co. | | | 1,248,560 | |
| | | | | | | | 2,341,804 | |
See accompanying notes to financial statements.
Global Atlantic BlackRock Disciplined Mid Cap Growth Portfolio
PORTFOLIO OF INVESTMENTS (Continued)
June 30, 2019 (Unaudited)
| Shares | | | | | Value | |
| | | | | CHEMICALS - 0.5% | | | | |
| | 301 | | | Air Products & Chemicals, Inc. | | $ | 68,137 | |
| | 13,601 | | | Axalta Coating Systems Ltd. * | | | 404,902 | |
| | 950 | | | Dow, Inc. | | | 46,845 | |
| | 591 | | | NewMarket Corp. | | | 236,956 | |
| | 5,246 | | | Versum Materials, Inc. | | | 270,588 | |
| | | | | | | | 1,027,428 | |
| | | | | COMMERCIAL SERVICES - 7.8% | | | | |
| | 3,464 | | | Automatic Data Processing, Inc. | | | 572,703 | |
| | 2,330 | | | Avalara, Inc. * | | | 168,226 | |
| | 19,386 | | | Booz Allen Hamilton Holding Corp. | | | 1,283,547 | |
| | 4,094 | | | Bright Horizons Family Solutions, Inc. * | | | 617,662 | |
| | 319 | | | Cintas Corp. | | | 75,696 | |
| | 5,787 | | | CoStar Group, Inc. * | | | 3,206,345 | |
| | 213 | | | FleetCor Technologies, Inc. * | | | 59,821 | |
| | 1,106 | | | Global Payments, Inc. | | | 177,104 | |
| | 15,426 | | | H&R Block, Inc. | | | 451,982 | |
| | 2,019 | | | IHS Markit Ltd. * | | | 128,651 | |
| | 8,470 | | | Insperity, Inc. | | | 1,034,526 | |
| | 512 | | | MarketAxess Holdings, Inc. | | | 164,567 | |
| | 3,962 | | | Morningstar, Inc. | | | 573,064 | |
| | 12,197 | | | Paylocity Holding Corp. * | | | 1,144,323 | |
| | 16,734 | | | Robert Half International, Inc. | | | 954,005 | |
| | 2,124 | | | ServiceMaster Global Holdings, Inc. * | | | 110,639 | |
| | 30,925 | | | Square, Inc. * | | | 2,242,990 | |
| | 6,340 | | | Total System Services, Inc. | | | 813,232 | |
| | 8,938 | | | TransUnion | | | 657,032 | |
| | 7,424 | | | TriNet Group, Inc. * | | | 503,347 | |
| | 1,692 | | | United Rentals, Inc. * | | | 224,409 | |
| | | | | | | | 15,163,871 | |
| | | | | COMPUTERS - 2.5% | | | | |
| | 4,487 | | | Dell Technologies, Inc. - Class C * | | | 227,940 | |
| | 5,571 | | | Elastic NV * | | | 415,931 | |
| | 4,789 | | | EPAM Systems, Inc. * | | | 828,976 | |
| | 11,106 | | | Fortinet, Inc. * | | | 853,274 | |
| | 21,279 | | | Genpact Ltd. | | | 810,517 | |
| | 7,731 | | | NCR Corp. * | | | 240,434 | |
| | 20,515 | | | NetApp, Inc. | | | 1,265,776 | |
| | 17,958 | | | Pure Storage, Inc. * | | | 274,219 | |
| | | | | | | | 4,917,067 | |
| | | | | DISTRIBUTION/WHOLESALE - 1.1% | | | | |
| | 9,913 | | | Copart, Inc. * | | $ | 740,898 | |
| | 5,514 | | | WW Grainger, Inc. | | | 1,479,020 | |
| | | | | | | | 2,219,918 | |
| | | | | DIVERSIFIED FINANCIAL SERVICES - 3.2% | | | | |
| | 2,348 | | | Alliance Data Systems Corp. | | | 329,025 | |
| | 25,125 | | | Discover Financial Services | | | 1,949,449 | |
| | 5,347 | | | E*TRADE Financial Corp. | | | 238,476 | |
| | 12,679 | | | Evercore, Inc. | | | 1,122,979 | |
See accompanying notes to financial statements.
Global Atlantic BlackRock Disciplined Mid Cap Growth Portfolio
PORTFOLIO OF INVESTMENTS (Continued)
June 30, 2019 (Unaudited)
| Shares | | | | | Value | |
| | | | | DIVERSIFIED FINANCIAL SERVICES (Continued) - 3.2% | | | | |
| | 1,634 | | | Raymond James Financial, Inc. | | $ | 138,155 | |
| | 5,890 | | | SEI Investments Co. | | | 330,429 | |
| | 16,694 | | | Synchrony Financial | | | 578,781 | |
| | 14,529 | | | T Rowe Price Group, Inc. | | | 1,593,976 | |
| | | | | | | | 6,281,270 | |
| | | | | ELECTRIC - 0.3% | | | | |
| | 1,311 | | | Alliant Energy Corp. | | | 64,344 | |
| | 1,130 | | | Black Hills Corp. | | | 88,332 | |
| | 4,460 | | | IDACORP, Inc. | | | 447,918 | |
| | | | | | | | 600,594 | |
| | | | | ELECTRICAL COMPONENTS & EQUIPMENT - 0.9% | | | | |
| | 3,963 | | | AMETEK, Inc. | | | 359,999 | |
| | 3,408 | | | Generac Holdings, Inc. * | | | 236,549 | |
| | 8,648 | | | Hubbell, Inc. | | | 1,127,699 | |
| | 344 | | | Universal Display Corp. | | | 64,693 | |
| | | | | | | | 1,788,940 | |
| | | | | ELECTRONICS - 5.2% | | | | |
| | 32,555 | | | ADT, Inc. | | | 199,237 | |
| | 23,855 | | | Allegion PLC | | | 2,637,170 | |
| | 18,932 | | | Fortive Corp. | | | 1,543,337 | |
| | 633 | | | Jabil, Inc. | | | 20,003 | |
| | 7,037 | | | Keysight Technologies, Inc. * | | | 631,993 | |
| | 2,697 | | | Mettler-Toledo International, Inc. * | | | 2,265,480 | |
| | 40,913 | | | National Instruments Corp. | | | 1,717,937 | |
| | 1,354 | | | Resideo Technologies, Inc. * | | | 29,680 | |
| | 583 | | | Waters Corp. * | | | 125,485 | |
| | 9,313 | | | Woodward, Inc. | | | 1,053,858 | |
| | | | | | | | 10,224,180 | |
| | | | | ENGINERRING & CONSTRUCTION - 0.2% | | | | |
| | 4,972 | | | frontdoor, Inc. * | | | 216,531 | |
| | 1,842 | | | MasTec, Inc. * | | | 94,918 | |
| | | | | | | | 311,449 | |
| | | | | ENTERTAINMENT - 0.8% | | | | |
| | 9,748 | | | International Game Technology PLC | | | 126,432 | |
| | 3,792 | | | Live Nation Entertainment, Inc. * | | | 251,220 | |
| | 8,549 | | | Six Flags Entertainment Corp. | | | 424,714 | |
| | 2,984 | | | Vail Resorts, Inc. | | | 665,969 | |
| | | | | | | | 1,468,335 | |
| | | | | ENVIRONMENTAL CONTROL - 0.1% | | | | |
| | 2,103 | | | Republic Services, Inc. | | | 182,204 | |
| | 398 | | | Waste Connections, Inc. | | | 38,041 | |
| | | | | | | | 220,245 | |
| | | | | FOOD - 1.4% | | | | |
| | 15,962 | | | Hershey Co. | | | 2,139,387 | |
| | 2,753 | | | McCormick & Co., Inc. | | | 426,743 | |
| | 2,578 | | | Performance Food Group Co. * | | | 103,197 | |
| | | | | | | | 2,669,327 | |
See accompanying notes to financial statements.
Global Atlantic BlackRock Disciplined Mid Cap Growth Portfolio
PORTFOLIO OF INVESTMENTS (Continued)
June 30, 2019 (Unaudited)
| Shares | | | | | Value | |
| | | | | HAND/MACHINE TOOLS - 0.2% | | | | |
| | 2,242 | | | Snap-on, Inc. | | $ | 371,365 | |
| | | | | | | | | |
| | | | | HEALTHCARE PRODUCTS - 5.2% | | | | |
| | 2,141 | | | ABIOMED, Inc. * | | | 557,709 | |
| | 5,940 | | | Align Technology, Inc. * | | | 1,625,778 | |
| | 3,115 | | | Bio-Techne Corp. | | | 649,446 | |
| | 12,465 | | | Bruker Corp. | | | 622,627 | |
| | 1,159 | | | Genomic Health, Inc. * | | | 67,419 | |
| | 15,912 | | | Hill-Rom Holdings, Inc. | | | 1,664,713 | |
| | 9,946 | | | IDEXX Laboratories, Inc. * | | | 2,738,432 | |
| | 1,531 | | | Insulet Corp. * | | | 182,771 | |
| | 6,094 | | | Masimo Corp. * | | | 906,909 | |
| | 3,243 | | | Penumbra, Inc. * | | | 518,880 | |
| | 1,531 | | | ResMed, Inc. | | | — | |
| | 89 | | | Teleflex, Inc. | | | 29,472 | |
| | 4,521 | | | Varian Medical Systems, Inc. * | | | 615,444 | |
| | | | | | | | 10,179,600 | |
| | | | | HEALTHCARE - SERVICES - 1.5% | | | | |
| | 234 | | | Anthem, Inc. | | | 66,037 | |
| | 17,638 | | | Centene Corp. * | | | 924,937 | |
| | 2,047 | | | Chemed Corp. | | | 738,639 | |
| | 1,132 | | | IQVIA Holdings, Inc. * | | | 182,139 | |
| | 1,549 | | | Molina Healthcare, Inc. * | | | 221,724 | |
| | 2,916 | | | WellCare Health Plans, Inc. * | | | 831,264 | |
| | | | | | | | 2,964,740 | |
| | | | | HOME BUILDERS - 0.2% | | | | |
| | 3,282 | | | DR Horton, Inc. | | | 141,553 | |
| | 5,540 | | | Lennar Corp. | | | 268,468 | |
| | | | | | | | 410,021 | |
| | | | | HOME FURNISHINGS - 0.2% | | | | |
| | 4,589 | | | Tempur Sealy International, Inc. * | | | 336,695 | |
| | | | | | | | | |
| | | | | HOUSEHOLD PRODUCTS/WARES - 1.1% | | | | |
| | 28,027 | | | Church & Dwight Co., Inc. | | | 2,047,653 | |
| | 636 | | | Clorox Co. | | | 97,378 | |
| | | | | | | | 2,145,031 | |
| | | | | | | | | |
| | | | | HOUSEWARES - 0.1% | | | | |
| | 2,512 | | | Scotts Miracle-Gro Co. | | | 247,432 | |
| | | | | | | | | |
| | | | | INSURANCE - 0.3% | | | | |
| | 2,562 | | | Erie Indemnity Co. | | | 651,465 | |
| | | | | | | | | |
| | | | | INTERNET - 9.4% | | | | |
| | 426 | | | Anaplan, Inc. * | | | 21,500 | |
| | 1,310 | | | Cargurus, Inc. * | | | 47,304 | |
| | 20,530 | | | CDW Corp. | | | 2,278,830 | |
See accompanying notes to financial statements.
Global Atlantic BlackRock Disciplined Mid Cap Growth Portfolio
PORTFOLIO OF INVESTMENTS (Continued)
June 30, 2019 (Unaudited)
| Shares | | | | | Value | |
| | | | | INTERNET (Continued) - 9.4% | | | | |
| | 14,593 | | | Etsy, Inc. * | | $ | 895,572 | |
| | 2,537 | | | Expedia Group, Inc. | | | 337,497 | |
| | 35,230 | | | GoDaddy, Inc. * | | | 2,471,385 | |
| | 4,446 | | | GrubHub, Inc. * | | | 346,744 | |
| | 4,325 | | | Lyft, Inc. * | | | 284,196 | |
| | 2,068 | | | Match Group, Inc. | | | 139,114 | |
| | 364 | | | Okta, Inc. * | | | 44,958 | |
| | 7,494 | | | Palo Alto Networks, Inc. * | | | 1,526,977 | |
| | 3,432 | | | Pinterest, Inc. * | | | 93,419 | |
| | 4,554 | | | Proofpoint, Inc. * | | | 547,619 | |
| | 13,031 | | | RingCentral, Inc. * | | | 1,497,523 | |
| | 3,751 | | | Roku, Inc. * | | | 339,766 | |
| | 4,424 | | | Spotify Technology SA * | | | 646,877 | |
| | 47,623 | | | Twitter, Inc. * | | | 1,662,043 | |
| | 14,134 | | | VeriSign, Inc. * | | | 2,956,267 | |
| | 3,920 | | | Wayfair, Inc. * | | | 572,320 | |
| | 14,746 | | | Zendesk, Inc. * | | | 1,312,836 | |
| | 4,241 | | | Zscaler, Inc. * | | | 325,030 | |
| | | | | | | | 18,347,777 | |
| | | | | LEISURE - 0.8% | | | | |
| | 10,847 | | | Norwegian Cruise Line Holdings Ltd. * | | | 581,725 | |
| | 13,073 | | | Planet Fitness, Inc. * | | | 947,008 | |
| | | | | | | | 1,528,733 | |
| | | | | LODGING - 1.3% | | | | |
| | 13,168 | | | Choice Hotels International, Inc. | | | 1,145,748 | |
| | 61,232 | | | Extended Stay America, Inc. | | | 1,034,208 | |
| | 2,541 | | | Hilton Worldwide Holdings, Inc. | | | 248,357 | |
| | 544 | | | Las Vegas Sands Corp. | | | 32,145 | |
| | | | | | | | 2,460,458 | |
| | | | | MACHINERY - CONSTRUCTION & MINING - 0.2% | | | | |
| | 5,063 | | | Oshkosh Corp. | | | 422,710 | |
| | | | | | | | | |
| | | | | MACHINERY - DIVERSIFIED - 3.1% | | | | |
| | 2,499 | | | Cognex Corp. | | | 119,902 | |
| | 14,186 | | | Crane Co. | | | 1,183,680 | |
| | 1,040 | | | Cummins, Inc. | | | 178,194 | |
| | 10,389 | | | IDEX Corp. | | | 1,788,362 | |
| | 16,346 | | | Rockwell Automation, Inc. | | | 2,677,965 | |
| | 268 | | | Roper Technologies, Inc. | | | 98,158 | |
| | | | | | | | 6,046,261 | |
| | | | | MEDIA - 2.9% | | | | |
| | 10,203 | | | Altice USA, Inc. * | | | 248,443 | |
| | 1,418 | | | AMC Networks, Inc. * | | | 77,267 | |
| | 844 | | | Cable One, Inc. | | | 988,316 | |
| | 25,988 | | | CBS Corp. | | | 1,296,801 | |
| | 6,038 | | | FactSet Research Systems, Inc. | | | 1,730,249 | |
| | 7,014 | | | Sinclair Broadcast Group, Inc. | | | 376,161 | |
| | 146,373 | | | Sirius XM Holdings, Inc. | | | 816,761 | |
See accompanying notes to financial statements.
Global Atlantic BlackRock Disciplined Mid Cap Growth Portfolio
PORTFOLIO OF INVESTMENTS (Continued)
June 30, 2019 (Unaudited)
| Shares | | | | | Value | |
| | | | | MEDIA (Continued) - 2.9% | | | | |
| | 1,429 | | | World Wrestling Entertainment, Inc. | | $ | 103,188 | |
| | | | | | | | 5,637,186 | |
| | | | | MISCELLANEOUS MANUFACTURER - 1.3% | | | | |
| | 18,798 | | | AO Smith Corp. | | | 886,514 | |
| | 4,937 | | | AptarGroup, Inc. | | | 613,867 | |
| | 2,725 | | | Carlisle Cos, Inc. | | | 382,617 | |
| | 4,876 | | | Hexcel Corp. | | | 394,371 | |
| | 2,681 | | | Ingersoll-Rand PLC | | | 339,602 | |
| | | | | | | | 2,616,971 | |
| | | | | OFFICE/BUSINESS EQUIPMENT - 0.4% | | | | |
| | 4,052 | | | Zebra Technologies Corp. * | | | 848,853 | |
| | | | | | | | | |
| | | | | OIL & GAS - 0.6% | | | | |
| | 27,962 | | | Cabot Oil & Gas Corp. | | | 642,008 | |
| | 7,776 | | | ConocoPhillips | | | 474,336 | |
| | 1,185 | | | Continental Resources, Inc. * | | | 49,877 | |
| | 6,674 | | | Transocean Ltd. * | | | 42,780 | |
| | | | | | | | 1,209,001 | |
| | | | | PACKAGING & CONTAINERS - 0.7% | | | | |
| | 11,198 | | | Ball Corp. | | | 783,748 | |
| | 16,044 | | | Westrock Co. | | | 585,125 | |
| | | | | | | | 1,368,873 | |
| | | | | PHARMACEUTICALS - 2.7% | | | | |
| | 1,460 | | | AbbVie, Inc. | | | 106,171 | |
| | 1,003 | | | Agios Pharmaceuticals, Inc. * | | | 50,030 | |
| | 15,723 | | | AmerisourceBergen Corp. | | | 1,340,543 | |
| | 8,195 | | | DexCom, Inc. * | | | 1,227,939 | |
| | 7,689 | | | Herbalife Nutrition Ltd. * | | | 328,782 | |
| | 6,832 | | | Jazz Pharmaceuticals PLC * | | | 973,970 | |
| | 9,148 | | | Merck & Co, Inc. | | | 767,060 | |
| | 8,718 | | | Nektar Therapeutics * | | | 310,186 | |
| | 902 | | | PRA Health Sciences, Inc. * | | | 89,433 | |
| | 780 | | | Sarepta Therapeutics, Inc. * | | | 118,521 | |
| | | | | | | | 5,312,635 | |
| | | | | PIPELINES - 0.1% | | | | |
| | 2,546 | | | Cheniere Energy, Inc. * | | | 174,274 | |
| | | | | | | | | |
| | | | | REAL ESTATE - 0.3% | | | | |
| | 11,182 | | | CBRE Group, Inc. * | | | 573,637 | |
| | | | | | | | | |
| | | | | REAL ESTATE INVESTMENT TRUSTS - 2.5% | | | | |
| | 21,631 | | | Equity LifeStyle Properties, Inc. | | | 2,624,706 | |
| | 3,431 | | | Extra Space Storage, Inc. | | | 364,029 | |
| | 893 | | | Lamar Advertising Co. | | | 72,074 | |
| | 12,732 | | | Outfront Media, Inc. | | | 328,358 | |
| | 1,168 | | | Park Hotels & Resorts, Inc. | | | 32,190 | |
See accompanying notes to financial statements.
Global Atlantic BlackRock Disciplined Mid Cap Growth Portfolio
PORTFOLIO OF INVESTMENTS (Continued)
June 30, 2019 (Unaudited)
| Shares | | | | | Value | |
| | | | | REAL ESTATE INVESTMENT TRUSTS (Continued) - 2.5% | | | | |
| | 2,522 | | | Ryman Hospitality Properties, Inc. | | $ | 204,509 | |
| | 5,522 | | | SBA Communications Corp. * | | | 1,241,566 | |
| | | | | | | | 4,867,432 | |
| | | | | RETAIL - 8.9% | | | | |
| | 5,314 | | | Advance Auto Parts, Inc. | | | 819,100 | |
| | 1,608 | | | AutoZone, Inc. * | | | 1,767,948 | |
| | 434 | | | CarMax, Inc. * | | | 37,684 | |
| | 2,132 | | | Chipotle Mexican Grill, Inc. * | | | 1,562,500 | |
| | 15,547 | | | Darden Restaurants, Inc. | | | 1,892,536 | |
| | 20,854 | | | Dollar General Corp. | | | 2,818,627 | |
| | 4,952 | | | Domino’s Pizza Inc. | | | 1,378,043 | |
| | 13,162 | | | Lululemon Athletica Inc. * | | | 2,371,924 | |
| | 11,629 | | | Nordstrom Inc. | | | 370,500 | |
| | 2,043 | | | Ollie’s Bargain Outlet Holdings, Inc. * | | | 177,966 | |
| | 4,812 | | | O’Reilly Automotive Inc. * | | | 1,777,168 | |
| | 4,241 | | | Tractor Supply Co. | | | 461,421 | |
| | 5,289 | | | Ulta Beauty Inc. * | | | 1,834,700 | |
| | | | | | | | 17,270,117 | |
| | | | | SEMICONDUCTORS - 4.0% | | | | |
| | 62,181 | | | Advanced Micro Devices, Inc. * | | | 1,888,437 | |
| | 6,878 | | | Cirrus Logic, Inc. * | | | 300,569 | |
| | 3,084 | | | KLA-Tencor Corp. | | | 364,529 | |
| | 12,127 | | | Lam Research Corp. | | | 2,277,936 | |
| | 4,570 | | | Skyworks Solutions, Inc. | | | 353,124 | |
| | 21,574 | | | Xilinx, Inc. | | | 2,544,005 | |
| | | | | | | | 7,728,600 | |
| | | | | SOFTWARE - 15.5% | | | | |
| | 1,690 | | | Akamai Technologies, Inc. * | | | 135,437 | |
| | 1,285 | | | ANSYS, Inc. * | | | 263,194 | |
| | 6,988 | | | Aspen Technology, Inc. * | | | 868,469 | |
| | 3,676 | | | Atlassian Corp. PLC * | | | 480,968 | |
| | 12,056 | | | Black Knight, Inc. * | | | 725,168 | |
| | 10,849 | | | Broadridge Financial Solutions, Inc. | | | 1,385,200 | |
| | 14,201 | | | Cadence Design Systems, Inc. * | | | 1,005,573 | |
| | 2,749 | | | Ceridian HCM Holding, Inc. * | | | 138,000 | |
| | 5,828 | | | Cerner Corp. | | | 427,192 | |
| | 20,021 | | | Dropbox, Inc. * | | | 501,526 | |
| | 1,824 | | | Fastly, Inc. * | | | 36,991 | |
| | 13,946 | | | Fidelity National Information Services, Inc. | | | 1,710,895 | |
| | 32,055 | | | First Data Corp. * | | | 867,729 | |
| | 19,505 | | | Fiserv, Inc. * | | | 1,778,076 | |
| | 2,634 | | | HubSpot, Inc. * | | | 449,150 | |
| | 1,863 | | | Intuit, Inc. | | | 486,858 | |
| | 747 | | | Jack Henry & Associates, Inc. | | | 100,038 | |
| | 442 | | | Medidata Solutions, Inc. * | | | 40,005 | |
| | 7,872 | | | New Relic, Inc. * | | | 681,007 | |
| | 42,982 | | | Paychex, Inc. | | | 3,536,989 | |
| | 6,129 | | | Paycom Software, Inc. * | | | 1,389,567 | |
See accompanying notes to financial statements.
Global Atlantic BlackRock Disciplined Mid Cap Growth Portfolio
PORTFOLIO OF INVESTMENTS (Continued)
June 30, 2019 (Unaudited)
| Shares | | | | | Value | |
| | | | | SOFTWARE (Continued) - 15.5% | | | | |
| | 1,243 | | | PTC, Inc. * | | $ | — | |
| | 2,669 | | | RealPage, Inc. * | | | 157,071 | |
| | 11,387 | | | Red Hat, Inc. * | | | 2,138,023 | |
| | 4,318 | | | salesforce.com, Inc. * | | | 655,170 | |
| | 6,185 | | | ServiceNow, Inc. * | | | 1,698,215 | |
| | 5,632 | | | Smartsheet, Inc. * | | | 272,589 | |
| | 9,663 | | | Splunk, Inc. * | | | 1,215,122 | |
| | 3,237 | | | Synopsys, Inc. * | | | 416,570 | |
| | 4,900 | | | Tableau Software, Inc. * | | | 813,498 | |
| | 5,983 | | | Take-Two Interactive Software, Inc. * | | | 679,250 | |
| | 6,430 | | | Twilio, Inc. * | | | 876,731 | |
| | 16,540 | | | Veeva Systems, Inc. * | | | 2,681,299 | |
| | 3,947 | | | Workday, Inc. * | | | 811,424 | |
| | 119,362 | | | Zynga, Inc. * | | | 731,688 | |
| | | | | | | | 30,154,682 | |
| | | | | TELECOMMUNICATIONS - 1.0% | | | | |
| | 3,537 | | | Arista Networks, Inc. * | | | 918,276 | |
| | 9,267 | | | Ciena Corp. * | | | 381,152 | |
| | 3,284 | | | Motorola Solutions, Inc. | | | 547,541 | |
| | 2,285 | | | United States Cellular Corp. * | | | 102,071 | |
| | | | | | | | 1,949,040 | |
| | | | | TRANSPORTATION - 1.2% | | | | |
| | 7,736 | | | CH Robinson Worldwide, Inc. | | | 652,532 | |
| | 4,335 | | | Expeditors International of Washington, Inc. | | | 328,853 | |
| | 11,921 | | | Landstar System, Inc. | | | 1,287,349 | |
| | 1,337 | | | Ryder System, Inc. | | | 77,947 | |
| | | | | | | | 2,346,681 | |
| | | | | TRUCKING & LEASING - 0.1% | | | | |
| | 1,186 | | | GATX Corp. | | | 94,038 | |
| | | | | | | | | |
| | | | | WATER - 0.2% | | | | |
| | 1,929 | | | American Water Works Co, Inc. | | | 223,764 | |
| | | | | | | | | |
| | | | | TOTAL COMMON STOCKS (Cost - $164,238,604) | | | 191,372,743 | |
| | | | | | | | | |
| | | | | SHORT-TERM INVESTMENT - 1.4% | | | | |
| | | | | MONEY MARKET FUND - 1.4% | | | | |
| | 2,766,300 | | | Fidelity Investments Money Market Funds - Government Portfolio, Institutional Class to yield 2.25% (a)(Cost - $2,766,300) | | | 2,766,300 | |
| | | | | | | | | |
| | | | | TOTAL INVESTMENTS - 99.6% (Cost - $167,004,904) | | $ | 194,139,043 | |
| | | | | OTHER ASSETS LESS LIABILITIES - NET - 0.4% | | | 721,477 | |
| | | | | TOTAL NET ASSETS - 100.0% | | $ | 194,860,520 | |
| * | Non-Income producing security. |
| | PLC - Public Limited Company |
| | REIT - Real Estate Investment Trust |
| (a) | Money market rate shown represents the rate at June 30, 2019. |
See accompanying notes to financial statements.
Global Atlantic BlackRock Disciplined Mid Cap Growth Portfolio
PORTFOLIO OF INVESTMENTS (Continued)
June 30, 2019 (Unaudited)
| Description | | Counterparty | | Contracts | | Expiration Date | | Notional Value | | | Unrealized Appreciation | |
| LONG | | | | | | | | | | | | | | |
| S&P 500 E-mini Future | | Goldman Sachs | | 25 | | Sep-19 | | $ | 3,680,250 | | | $ | 46,442 | |
| NET UNREALIZED APPRECIATION ON FUTURES CONTRACTS | | | $ | 46,442 | |
See accompanying notes to financial statements.
Global Atlantic BlackRock Disciplined Small Cap Portfolio
PORTFOLIO OF INVESTMENTS
June 30, 2019 (Unaudited)
| Shares | | | | | Value | |
| | | | | COMMON STOCKS - 97.4% | | | | |
| | | | | AEROSPACE/DEFENSE - 0.4% | | | | |
| | 454 | | | AAR Corp. | | $ | 16,703 | |
| | 433 | | | Aerojet Rocketdyne Holdings, Inc. * | | | 19,385 | |
| | 310 | | | Moog, Inc. | | | 29,019 | |
| | | | | | | | 65,107 | |
| | | | | AGRICULTURE - 0.2% | | | | |
| | 294 | | | Alico, Inc. | | | 8,920 | |
| | 3,155 | | | Vector Group Ltd. | | | 30,761 | |
| | | | | | | | 39,681 | |
| | | | | AIRLINES - 0.4% | | | | |
| | 923 | | | Hawaiian Holdings, Inc. | | | 25,318 | |
| | 225 | | | SkyWest, Inc. | | | 13,651 | |
| | 550 | | | Spirit Airlines, Inc. * | | | 26,251 | |
| | | | | | | | 65,220 | |
| | | | | APPAREL - 1.0% | | | | |
| | 318 | | | Columbia Sportswear Co. | | | 31,851 | |
| | 1,383 | | | Crocs, Inc. * | | | 27,314 | |
| | 311 | | | Deckers Outdoor Corp. * | | | 54,727 | |
| | 415 | | | Oxford Industries, Inc. | | | 31,457 | |
| | 1,352 | | | Wolverine World Wide, Inc. | | | 37,234 | |
| | | | | | | | 182,583 | |
| | | | | AUTO MANUFACTURERS - 0.1% | | | | |
| | 458 | | | Navistar International Corp. * | | | 15,778 | |
| | | | | | | | | |
| | | | | AUTO PARTS & EQUIPMENT - 1.1% | | | | |
| | 348 | | | Cooper-Standard Holdings, Inc. * | | | 15,945 | |
| | 2,773 | | | Dana, Inc. | | | 55,294 | |
| | 1,114 | | | Meritor, Inc. * | | | 27,015 | |
| | 392 | | | Miller Industries, Inc. | | | 12,054 | |
| | 865 | | | Modine Manufacturing Co. * | | | 12,378 | |
| | 201 | | | Standard Motor Products, Inc. | | | 9,113 | |
| | 1,530 | | | Tenneco, Inc. | | | 16,968 | |
| | 2,228 | | | Tower International, Inc. | | | 43,446 | |
| | | | | | | | 192,213 | |
| | | | | BANKS - 8.3% | | | | |
| | 2,194 | | | Bancorp, Inc. * | | | 19,570 | |
| | 1,637 | | | Bank of Commerce Holdings | | | 17,500 | |
| | 264 | | | Banner Corp. | | | 14,296 | |
| | 220 | | | BOK Financial Corp. | | | 16,606 | |
| | 2,030 | | | Cadence BanCorp | | | 42,224 | |
| | 879 | | | Capital City Bank Group, Inc. | | | 21,843 | |
| | 330 | | | Carolina Financial Corp. | | | 11,580 | |
| | 2,833 | | | Cathay General Bancorp | | | 101,733 | |
| | 451 | | | CenterState Bank Corp. | | | 10,387 | |
See accompanying notes to financial statements.
Global Atlantic BlackRock Disciplined Small Cap Portfolio
PORTFOLIO OF INVESTMENTS (Continued)
June 30, 2019 (Unaudited)
| Shares | | | | | Value | |
| | | | | BANKS (Continued) - 8.3% | | | | |
| | 2,032 | | | Chemical Financial Corp. | | $ | 83,536 | |
| | 329 | | | Enterprise Bancorp, Inc. | | | 10,433 | |
| | 3,140 | | | First Commonwealth Financial Corp. | | | 42,296 | |
| | 313 | | | First Community Corp. | | | 5,794 | |
| | 390 | | | First Horizon National Corp. | | | 5,823 | |
| | 524 | | | First Merchants Corp. | | | 19,860 | |
| | 1,239 | | | First of Long Island Corp. | | | 24,879 | |
| | 120 | | | First United Corp. | | | 2,365 | |
| | 1,342 | | | Glacier Bancorp, Inc. | | | 54,418 | |
| | 1,449 | | | Heritage Commerce Corp. | | | 17,750 | |
| | 2,097 | | | Home BancShares, Inc. | | | 40,388 | |
| | 3,219 | | | Hope Bancorp, Inc. | | | 44,358 | |
| | 24 | | | IBERIABANK Corp. | | | 1,820 | |
| | 1,667 | | | Independent Bank Corp. | | | 36,324 | |
| | 491 | | | Independent Bank Group, Inc. | | | 26,985 | |
| | 404 | | | International Bancshares Corp. | | | 15,235 | |
| | 1,375 | | | Lakeland Financial Corp. | | | 64,391 | |
| | 539 | | | LCNB Corp. | | | 10,241 | |
| | 1,051 | | | MBT Financial Corp. | | | 10,531 | |
| | 745 | | | Merchants Bancorp | | | 12,687 | |
| | 398 | | | MidWestOne Financial Group, Inc. | | | 11,128 | |
| | 567 | | | National Bank Holdings Corp. | | | 20,582 | |
| | 491 | | | Preferred Bank | | | 23,200 | |
| | 352 | | | Renasant Corp. | | | 12,651 | |
| | 510 | | | Republic Bancorp, Inc. * | | | 25,372 | |
| | 1,015 | | | Republic First Bancorp, Inc. * | | | 4,984 | |
| | 2,046 | | | Sandy Spring Bancorp, Inc. | | | 71,364 | |
| | 520 | | | Shore Bancshares, Inc. | | | 8,497 | |
| | 797 | | | Sierra Bancorp | | | 21,615 | |
| | 1,284 | | | SmartFinancial, Inc. * | | | 27,850 | |
| | 621 | | | South State Corp. | | | 45,749 | |
| | 279 | | | Southern First Bancshares, Inc. * | | | 10,926 | |
| | 771 | | | Synovus Financial Corp. | | | 26,985 | |
| | 75 | | | TriCo Bancshares | | | 2,835 | |
| | 3,809 | | | TriState Capital Holdings, Inc. * | | | 81,284 | |
| | 4,616 | | | United Community Banks, Inc. | | | 131,833 | |
| | 191 | | | Walker & Dunlop, Inc. | | | 10,163 | |
| | 1,154 | | | West Bancorporation, Inc. | | | 24,488 | |
| | 1,640 | | | Wintrust Financial Corp. | | | 119,982 | |
| | | | | | | | 1,467,341 | |
| | | | | BEVERAGES - 0.3% | | | | |
| | 150 | | | Boston Beer Co, Inc. * | | | 56,664 | |
See accompanying notes to financial statements.
Global Atlantic BlackRock Disciplined Small Cap Portfolio
PORTFOLIO OF INVESTMENTS (Continued)
June 30, 2019 (Unaudited)
| Shares | | | | | Value | |
| | | | | BIOTECHNOLOGY - 3.9% | | | | |
| | 1,515 | | | ACADIA Pharmaceuticals, Inc. * | | $ | 40,496 | |
| | 4,507 | | | Achillion Pharmaceuticals, Inc. * | | | 12,079 | |
| | 2,241 | | | Acorda Therapeutics, Inc. * | | | 17,188 | |
| | 1,610 | | | Agenus, Inc. * | | | 4,830 | |
| | 1,093 | | | Alder Biopharmaceuticals, Inc. * | | | 12,865 | |
| | 350 | | | Allogene Therapeutics, Inc. * | | | 9,398 | |
| | 807 | | | AMAG Pharmaceuticals, Inc. * | | | 8,062 | |
| | 875 | | | Amicus Therapeutics, Inc. * | | | 10,920 | |
| | 327 | | | AnaptysBio, Inc. * | | | 18,449 | |
| | 6,159 | | | Aptinyx, Inc. * | | | — | |
| | 989 | | | Arcus Biosciences, Inc. * | | | 7,863 | |
| | 2,190 | | | Ardelyx, Inc. * | | | 5,891 | |
| | 323 | | | Arena Pharmaceuticals, Inc. * | | | 18,937 | |
| | 825 | | | Arrowhead Pharmaceuticals, Inc. * | | | 21,862 | |
| | 510 | | | Assembly Biosciences, Inc. * | | | 6,880 | |
| | 298 | | | Atara Biotherapeutics, Inc. * | | | 5,993 | |
| | 5,026 | | | Athersys, Inc. * | | | 8,444 | |
| | 252 | | | Audentes Therapeutics, Inc. * | | | 9,541 | |
| | 152 | | | Blueprint Medicines Corp. * | | | 14,338 | |
| | 1,099 | | | Calithera Biosciences, Inc. * | | | 4,286 | |
| | 1,062 | | | ChemoCentryx, Inc. * | | | 9,877 | |
| | 905 | | | CytomX Therapeutics, Inc. * | | | 10,154 | |
| | 375 | | | Denali Therapeutics, Inc. * | | | 7,785 | |
| | 313 | | | Editas Medicine, Inc. * | | | 7,744 | |
| | 510 | | | Emergent BioSolutions, Inc. * | | | 24,638 | |
| | 2,668 | | | Enzo Biochem, Inc. * | | | 8,991 | |
| | 247 | | | Exact Sciences Corp. * | | | 29,156 | |
| | 656 | | | Fate Therapeutics, Inc. * | | | 13,317 | |
| | 337 | | | FibroGen, Inc. * | | | 15,226 | |
| | 216 | | | Five Prime Therapeutics, Inc. * | | | 1,302 | |
| | 1,472 | | | Halozyme Therapeutics, Inc. * | | | 25,289 | |
| | 107 | | | Intercept Pharmaceuticals, Inc. * | | | 8,514 | |
| | 2,227 | | | Intrexon Corp. * | | | 17,059 | |
| | 899 | | | Iovance Biotherapeutics, Inc. * | | | 22,043 | |
| | 269 | | | Ligand Pharmaceuticals, Inc. * | | | 30,706 | |
| | 354 | | | MacroGenics, Inc. * | | | 6,007 | |
| | 728 | | | Medicines Co. * | | | 26,550 | |
| | 807 | | | Myriad Genetics, Inc. * | | | 22,418 | |
| | 1,030 | | | NeoGenomics, Inc. * | | | 22,598 | |
| | 3,592 | | | Nymox Pharmaceutical Corp. * | | | 5,208 | |
| | 648 | | | Prothena Corp. PLC * | | | 6,849 | |
| | 165 | | | Puma Biotechnology, Inc. * | | | 2,097 | |
| | 382 | | | REGENXBIO, Inc. * | | | 19,623 | |
See accompanying notes to financial statements.
Global Atlantic BlackRock Disciplined Small Cap Portfolio
PORTFOLIO OF INVESTMENTS (Continued)
June 30, 2019 (Unaudited)
| Shares | | | | | Value | |
| | | | | BIOTECHNOLOGY (Continued) - 3.9% | | | | |
| | 1,213 | | | Retrophin, Inc. * | | $ | 24,369 | |
| | 6 | | | Sage Therapeutics, Inc. * | | | 1,099 | |
| | 1,095 | | | Sangamo Therapeutics, Inc. * | | | 11,793 | |
| | 244 | | | Spark Therapeutics, Inc. * | | | 24,981 | |
| | 636 | | | Theravance Biopharma, Inc. * | | | 10,386 | |
| | 258 | | | Ultragenyx Pharmaceutical, Inc. * | | | 16,383 | |
| | 541 | | | Veracyte, Inc. * | | | 15,424 | |
| | 2,433 | | | ZIOPHARM Oncology, Inc. * | | | 14,184 | |
| | | | | | | | 700,092 | |
| | | | | BUILDING MATERIALS - 1.8% | | | | |
| | 762 | | | Boise Cascade Co. | | | 21,420 | |
| | 2,392 | | | Builders FirstSource, Inc. * | | | 40,329 | |
| | 515 | | | Continental Building Products, Inc. * | | | 13,684 | |
| | 1,005 | | | Griffon Corp. | | | 17,005 | |
| | 782 | | | Louisiana-Pacific Corp. | | | 20,504 | |
| | 4,439 | | | LSI Industries, Inc. | | | 16,202 | |
| | 339 | | | Masonite International Corp. * | | | 17,859 | |
| | 828 | | | PGT Innovations, Inc. * | | | 13,844 | |
| | 716 | | | Summit Materials, Inc. * | | | 13,783 | |
| | 1,054 | | | Trex Co., Inc. * | | | 75,572 | |
| | 1,828 | | | Universal Forest Products, Inc. | | | 69,574 | |
| | | | | | | | 319,776 | |
| | | | | CHEMICALS - 1.8% | | | | |
| | 490 | | | AdvanSix, Inc. * | | | 11,971 | |
| | 721 | | | Ferro Corp. * | | | 11,392 | |
| | 1,075 | | | HB Fuller Co. | | | 49,880 | |
| | 211 | | | Ingevity Corp. * | | | 22,191 | |
| | 1,131 | | | Innospec, Inc. | | | 103,192 | |
| | 460 | | | Koppers Holdings, Inc. * | | | 13,506 | |
| | 320 | | | Materion Corp. | | | 21,699 | |
| | 1,298 | | | PolyOne Corp. | | | 40,744 | |
| | 418 | | | Stepan Co. | | | 38,418 | |
| | 90 | | | Univar, Inc. * | | | 1,984 | |
| | | | | | | | 314,977 | |
| | | | | COAL - 0.3% | | | | |
| | 109 | | | Arch Coal, Inc. | | | 10,269 | |
| | 1,002 | | | Peabody Energy Corp. | | | 24,148 | |
| | 1,162 | | | SunCoke Energy, Inc. * | | | 10,319 | |
| | | | | | | | 44,736 | |
| | | | | COMMERCIAL SERVICES - 5.8% | | | | |
| | 649 | | | Aaron’s, Inc. | | | 39,855 | |
| | 575 | | | AMN Healthcare Services, Inc. * | | | 31,194 | |
| | 548 | | | Arlo Technologies, Inc. * | | | 2,197 | |
| | 1,145 | | | ASGN, Inc. * | | | 69,387 | |
See accompanying notes to financial statements.
Global Atlantic BlackRock Disciplined Small Cap Portfolio
PORTFOLIO OF INVESTMENTS (Continued)
June 30, 2019 (Unaudited)
| Shares | | | | | Value | |
| | | | | COMMERCIAL SERVICES (Continued) - 5.8% | | | | |
| | 206 | | | Avalara, Inc. * | | $ | 14,873 | |
| | 1,122 | | | Care.com, Inc. * | | | 12,320 | |
| | 1,179 | | | Carriage Services, Inc. | | | 22,413 | |
| | 1,441 | | | Chegg, Inc. * | | | 55,608 | |
| | 383 | | | CorVel Corp. * | | | 33,325 | |
| | 640 | | | CRA International, Inc. | | | 24,531 | |
| | 125 | | | Forrester Research, Inc. | | | 5,879 | |
| | 176 | | | Grand Canyon Education, Inc. * | | | 20,596 | |
| | 586 | | | Green Dot Corp. * | | | 28,655 | |
| | 883 | | | GreenSky, Inc. * | | | 10,852 | |
| | 911 | | | Hackett Group, Inc. | | | 15,296 | |
| | 393 | | | Harsco Corp. * | | | 10,784 | |
| | 514 | | | HealthEquity, Inc. * | | | 33,616 | |
| | 216 | | | Herc Holdings, Inc. * | | | 9,899 | |
| | 843 | | | HMS Holdings Corp. * | | | 27,305 | |
| | 981 | | | Insperity, Inc. | | | 119,819 | |
| | 706 | | | International Money Express, Inc. * | | | 9,955 | |
| | 604 | | | Kelly Services, Inc. | | | 15,819 | |
| | 1,894 | | | Kforce, Inc. | | | 66,460 | |
| | 1,414 | | | Korn Ferry | | | 56,659 | |
| | 885 | | | LiveRamp Holdings, Inc. * | | | 42,905 | |
| | 410 | | | Matthews International Corp. | | | 14,289 | |
| | 80 | | | Medifast, Inc. | | | 10,264 | |
| | 282 | | | National Research Corp. | | | 16,240 | |
| | 616 | | | Paylocity Holding Corp. * | | | 57,793 | |
| | 762 | | | Quad/Graphics, Inc. | | | 6,027 | |
| | 329 | | | Rosetta Stone, Inc. * | | | 7,528 | |
| | 393 | | | Sotheby’s * | | | 22,845 | |
| | 690 | | | SP Plus Corp. * | | | 22,032 | |
| | 262 | | | Strategic Education, Inc. | | | 46,636 | |
| | 392 | | | TriNet Group, Inc. * | | | 26,578 | |
| | 169 | | | Viad Corp. | | | 11,195 | |
| | | | | | | | 1,021,629 | |
| | | | | COMPUTERS - 1.9% | | | | |
| | 571 | | | EPAM Systems, Inc. * | | | 98,840 | |
| | 507 | | | Insight Enterprises, Inc. * | | | 29,507 | |
| | 376 | | | Lumentum Holdings, Inc. * | | | 20,082 | |
| | 1,132 | | | Mitek Systems, Inc. * | | | 11,252 | |
| | 648 | | | Nutanix, Inc. * | | | 16,809 | |
| | 721 | | | Presidio, Inc. | | | 9,856 | |
| | 1,135 | | | Pure Storage, Inc. * | | | 17,331 | |
| | 332 | | | Qualys, Inc. * | | | 28,911 | |
| | 651 | | | Rapid7, Inc. * | | | 37,654 | |
| | 132 | | | Science Applications International Corp. | | | 11,426 | |
See accompanying notes to financial statements.
Global Atlantic BlackRock Disciplined Small Cap Portfolio
PORTFOLIO OF INVESTMENTS (Continued)
June 30, 2019 (Unaudited)
| Shares | | | | | Value | |
| | | | | COMPUTERS - 1.9% (Continued) | | | | |
| | 200 | | | Varonis Systems, Inc. * | | $ | 12,388 | |
| | 511 | | | Virtusa Corp. * | | | 22,704 | |
| | 382 | | | Vocera Communications, Inc. * | | | 12,193 | |
| | | | | | | | 328,953 | |
| | | | | COSMETICS/PERSONAL CARE - 0.3% | | | | |
| | 759 | | | Inter Parfums, Inc. | | | 50,466 | |
| | | | | | | | | |
| | | | | DISTRIBUTION/WHOLESALE - 1.1% | | | | |
| | 476 | | | Anixter International, Inc. * | | | 28,422 | |
| | 881 | | | Core-Mark Holding Co, Inc. | | | 34,993 | |
| | 1,193 | | | G-III Apparel Group Ltd. * | | | 35,098 | |
| | 856 | | | H&E Equipment Services, Inc. | | | 24,901 | |
| | 1,922 | | | ScanSource, Inc. * | | | 62,580 | |
| | 457 | | | Systemax, Inc. | | | 10,127 | |
| | | | | | | | 196,121 | |
| | | | | DIVERSIFIED FINANCIAL SERVICES - 1.9% | | | | |
| | 674 | | | Ares Management Corp. | | | 17,639 | |
| | 4,679 | | | Boston Private Financial Holdings, Inc. | | | 56,476 | |
| | 178 | | | Cohen & Steers, Inc. | | | 9,156 | |
| | 982 | | | Enova International, Inc. * | | | 22,635 | |
| | 86 | | | Evercore, Inc. | | | 7,617 | |
| | 446 | | | Federal Agricultural Mortgage Corp. | | | 32,406 | |
| | 2,425 | | | Ladenburg Thalmann Financial Services, Inc. | | | 8,318 | |
| | 3,331 | | | LendingClub Corp. * | | | 10,926 | |
| | 31 | | | LendingTree, Inc. * | | | 13,021 | |
| | 13,134 | | | Medley Management, Inc. | | | 32,310 | |
| | 1,278 | | | Moelis & Co. | | | 44,666 | |
| | 368 | | | Piper Jaffray Cos | | | 27,331 | |
| | 802 | | | Silvercrest Asset Management Group, Inc. | | | 11,252 | |
| | 321 | | | Stifel Financial Corp. | | | 18,958 | |
| | 111 | | | WageWorks, Inc. * | | | 5,638 | |
| | 297 | | | Westwood Holdings Group, Inc. | | | 10,454 | |
| | | | | | | | 328,803 | |
| | | | | ELECTRIC - 2.5% | | | | |
| | 585 | | | Avista Corp. | | | 26,091 | |
| | 906 | | | Black Hills Corp. | | | 70,822 | |
| | 1,517 | | | Clearway Energy, Inc. | | | 25,577 | |
| | 1,408 | | | Clearway Energy, Inc. - Class A | | | 22,781 | |
| | 2,249 | | | IDACORP, Inc. | | | 225,867 | |
| | 1,131 | | | PNM Resources, Inc. | | | 57,579 | |
| | 760 | | | Vistra Energy Corp. | | | 17,206 | |
| | | | | | | | 445,923 | |
See accompanying notes to financial statements.
Global Atlantic BlackRock Disciplined Small Cap Portfolio
PORTFOLIO OF INVESTMENTS (Continued)
June 30, 2019 (Unaudited)
| Shares | | | | | Value | |
| | | | | ELECTRICAL COMPONENTS & EQUIPMENT - 0.8% | | | | |
| | 78 | | | EnerSys | | $ | 5,343 | |
| | 1,593 | | | Generac Holdings, Inc. * | | | 110,570 | |
| | 147 | | | Littelfuse, Inc. | | | 26,006 | |
| | | | | | | | 141,919 | |
| | | | | ELECTRONICS - 3.3% | | | | |
| | 550 | | | Alarm.com Holdings, Inc. * | | | 29,425 | |
| | 231 | | | Control4 Corp. * | | | 5,486 | |
| | 6,967 | | | Fitbit, Inc. * | | | 30,655 | |
| | 2,043 | | | GoPro, Inc. * | | | 11,155 | |
| | 951 | | | OSI Systems, Inc. * | | | 107,111 | |
| | 1,501 | | | Sanmina Corp. * | | | 45,450 | |
| | 583 | | | SYNNEX Corp. | | | 57,367 | |
| | 467 | | | Tech Data Corp. * | | | 48,848 | |
| | 1,245 | | | Vishay Intertechnology, Inc. | | | 20,567 | |
| | 181 | | | Vishay Precision Group, Inc. * | | | 7,354 | |
| | 1,298 | | | Watts Water Technologies, Inc. | | | 120,948 | |
| | 848 | | | Woodward, Inc. | | | 95,960 | |
| | | | | | | | 580,326 | |
| | | | | ENERGY - ALTERNATE SOURCES - 0.1% | | | | |
| | 4,036 | | | Pacific Ethanol, Inc. * | | | 3,088 | |
| | 649 | | | Renewable Energy Group, Inc. * | | | 10,293 | |
| | 128 | | | REX American Resources Corp. * | | | 9,331 | |
| | | | | | | | 22,712 | |
| | | | | ENGINEERING & CONSTRUCTION - 1.4% | | | | |
| | 1,153 | | | Comfort Systems USA, Inc. | | | 58,791 | |
| | 545 | | | EMCOR Group, Inc. | | | 48,015 | |
| | 1,221 | | | Great Lakes Dredge & Dock Corp. * | | | 13,480 | |
| | 1,082 | | | MasTec, Inc. * | | | 55,755 | |
| | 694 | | | MYR Group, Inc. * | | | 25,921 | |
| | 973 | | | Primoris Services Corp. | | | 20,365 | |
| | 275 | | | TopBuild Corp. * | | | 22,759 | |
| | | | | | | | 245,086 | |
| | | | | ENTERTAINMENT - 0.7% | | | | |
| | 652 | | | AMC Entertainment Holdings, Inc. | | | 6,083 | |
| | 473 | | | Eldorado Resorts, Inc. * | | | 21,791 | |
| | 1,272 | | | IMAX Corp. * | | | 25,694 | |
| | 310 | | | Marriott Vacations Worldwide Corp. | | | 29,884 | |
| | 1,055 | | | Penn National Gaming, Inc. * | | | 20,319 | |
| | 867 | | | SeaWorld Entertainment, Inc. * | | | 26,877 | |
| | | | | | | | 130,648 | |
| | | | | ENVIRONMENTAL CONTROL - 0.2% | | | | |
| | 726 | | | CECO Environmental Corp. * | | | 6,962 | |
| | 291 | | | Tetra Tech, Inc. | | | 22,858 | |
| | | | | | | | 29,820 | |
See accompanying notes to financial statements.
Global Atlantic BlackRock Disciplined Small Cap Portfolio
PORTFOLIO OF INVESTMENTS (Continued)
June 30, 2019 (Unaudited)
| Shares | | | | | Value | |
| | | | | FOOD - 1.1% | | | | |
| | 200 | | | Calavo Growers, Inc. | | $ | 19,348 | |
| | 545 | | | Chefs’ Warehouse, Inc. * | | | 19,113 | |
| | 3,512 | | | Dean Foods Co. | | | 3,244 | |
| | 82 | | | J&J Snack Foods Corp. | | | 13,198 | |
| | 417 | | | John B Sanfilippo & Son, Inc. | | | 33,231 | |
| | 2,071 | | | Performance Food Group Co. * | | | 82,902 | |
| | 128 | | | Sanderson Farms, Inc. | | | 17,480 | |
| | 672 | | | Seneca Foods Corp. * | | | — | |
| | 425 | | | Simply Good Foods Co. * | | | 10,234 | |
| | | | | | | | 198,750 | |
| | | | | FOREST PRODUCTS & PAPER - 0.1% | | | | |
| | 640 | | | Schweitzer-Mauduit International, Inc. | | | 21,235 | |
| | | | | | | | | |
| | | | | GAS - 0.8% | | | | |
| | 780 | | | Chesapeake Utilities Corp. | | | 74,116 | |
| | 778 | | | Southwest Gas Holdings, Inc. | | | 69,724 | |
| | | | | | | | 143,840 | |
| | | | | HAND/MACHINE TOOLS - 0.5% | | | | |
| | 2,019 | | | Milacron Holdings Corp. * | | | 27,862 | |
| | 545 | | | MSA Safety, Inc. | | | 57,438 | |
| | | | | | | | 85,300 | |
| | | | | HEALTHCARE PRODUCTS - 4.2% | | | | |
| | 3,283 | | | Accuray, Inc. * | | | 12,705 | |
| | 170 | | | Adaptive Biotechnologies Corp. * | | | 8,211 | |
| | 1,266 | | | AtriCure, Inc. * | | | 37,777 | |
| | 27 | | | Atrion Corp. | | | 23,024 | |
| | 352 | | | Cantel Medical Corp. | | | 28,385 | |
| | 410 | | | Cardiovascular Systems, Inc. * | | | 17,601 | |
| | 680 | | | CONMED Corp. | | | 58,188 | |
| | 802 | | | Genomic Health, Inc. * | | | 46,652 | |
| | 882 | | | Globus Medical, Inc. * | | | 37,309 | |
| | 135 | | | Haemonetics Corp. * | | | 16,246 | |
| | 215 | | | ICU Medical, Inc. * | | | 54,161 | |
| | 306 | | | Inogen, Inc. * | | | 20,429 | |
| | 436 | | | Insulet Corp. * | | | 52,050 | |
| | 157 | | | Integer Holdings Corp. * | | | 13,175 | |
| | 628 | | | Intersect ENT, Inc. * | | | 14,293 | |
| | 489 | | | iRhythm Technologies, Inc. * | | | 38,670 | |
| | 506 | | | Luminex Corp. | | | 10,444 | |
| | 205 | | | Masimo Corp. * | | | 30,508 | |
| | 580 | | | Merit Medical Systems, Inc. * | | | 34,545 | |
| | 725 | | | NanoString Technologies, Inc. * | | | 22,004 | |
| | 36 | | | Nevro Corp. * | | | 2,334 | |
| | 551 | | | Novocure Ltd. * | | | 34,840 | |
See accompanying notes to financial statements.
Global Atlantic BlackRock Disciplined Small Cap Portfolio
PORTFOLIO OF INVESTMENTS (Continued)
June 30, 2019 (Unaudited)
| Shares | | | | | Value | |
| | | | | HEALTHCARE PRODUCTS - 4.2% (Continued) | | | | |
| | 146 | | | NuVasive, Inc. * | | $ | 8,547 | |
| | 7,845 | | | OPKO Health, Inc. * | | | 19,142 | |
| | 172 | | | Penumbra, Inc. * | | | 27,520 | |
| | 209 | | | Repligen Corp. * | | | 17,964 | |
| | 1,995 | | | RTI Surgical Holdings, Inc. * | | | 8,479 | |
| | 203 | | | STAAR Surgical Co. * | | | 5,964 | |
| | 57 | | | Surmodics, Inc. * | | | 2,461 | |
| | 264 | | | Tandem Diabetes Care, Inc. * | | | 17,033 | |
| | 1,104 | | | Wright Medical Group NV * | | | 32,921 | |
| | | | | | | | 753,582 | |
| | | | | HEALTHCARE - SERVICES - 2.7% | | | | |
| | 684 | | | American Renal Associates Holdings, Inc. * | | | 5,089 | |
| | 866 | | | Catalent, Inc. * | | | 46,946 | |
| | 143 | | | Chemed Corp. | | | 51,600 | |
| | 743 | | | Encompass Health Corp. | | | 47,076 | |
| | 703 | | | Ensign Group, Inc. | | | 40,015 | |
| | 1,719 | | | Invitae Corp. * | | | 40,397 | |
| | 490 | | | LHC Group, Inc. * | | | 58,594 | |
| | 731 | | | Medpace Holdings, Inc. * | | | 47,822 | |
| | 161 | | | Molina Healthcare, Inc. * | | | 23,046 | |
| | 689 | | | Natera, Inc. * | | | 19,003 | |
| | 123 | | | National HealthCare Corp. | | | 9,981 | |
| | 991 | | | Select Medical Holdings Corp. * | | | 15,727 | |
| | 674 | | | Syneos Health, Inc. * | | | 34,435 | |
| | 169 | | | Teladoc Health, Inc. * | | | 11,223 | |
| | 410 | | | Tenet Healthcare Corp. * | | | 8,471 | |
| | 216 | | | Tivity Health, Inc. * | | | 3,551 | |
| | 83 | | | US Physical Therapy, Inc. | | | 10,173 | |
| | | | | | | | 473,149 | |
| | | | | HOME BUILDERS - 1.0% | | | | |
| | 1,085 | | | Beazer Homes USA, Inc. * | | | 10,427 | |
| | 55 | | | LCI Industries | | | 4,950 | |
| | 2,233 | | | MDC Holdings, Inc. | | | 73,198 | |
| | 1,382 | | | Meritage Homes Corp. * | | | 70,952 | |
| | 1,328 | | | TRI Pointe Group, Inc. * | | | 15,896 | |
| | 294 | | | William Lyon Homes * | | | 5,360 | |
| | | | | | | | 180,783 | |
| | | | | HOME FURNISHINGS - 0.2% | | | | |
| | 303 | | | Hooker Furniture Corp. | | | 6,248 | |
| | 379 | | | iRobot, Corp. * | | | 34,732 | |
| | | | | | | | 40,980 | |
| | | | | HOUSEWARE PRODUCTS/WARES - 0.4% | | | | |
| | 1,340 | | | ACCO Brands Corp. | | | 10,546 | |
| | 245 | | | Central Garden & Pet Co. * | | | 6,603 | |
See accompanying notes to financial statements.
Global Atlantic BlackRock Disciplined Small Cap Portfolio
PORTFOLIO OF INVESTMENTS (Continued)
June 30, 2019 (Unaudited)
| Shares | | | | | Value | |
| | | | | HOUSEWARE PRODUCTS/WARES - 0.4% (Continued) | | | | |
| | 85 | | | Central Garden & Pet Co. - Class A * | | $ | 2,094 | |
| | 927 | | | CSS Industries, Inc. | | | 4,524 | |
| | 631 | | | Quanex Building Products Corp. | | | 11,920 | |
| | 295 | | | Spectrum Brands Holdings, Inc. | | | 15,862 | |
| | 137 | | | WD-40 Co. | | | 21,788 | |
| | | | | | | | 73,337 | |
| | | | | INSURANCE - 2.8% | | | | |
| | 178 | | | American National Insurance Co. | | | 20,732 | |
| | 2,723 | | | CNO Financial Group, Inc. | | | 45,420 | |
| | 1,368 | | | Employers Holdings, Inc. | | | 57,825 | |
| | 1,941 | | | Essent Group Ltd. * | | | 91,208 | |
| | 332 | | | FBL Financial Group, Inc. | | | 21,182 | |
| | 4,364 | | | Genworth Financial, Inc. * | | | 16,190 | |
| | 1,272 | | | Greenlight Capital Re Ltd. * | | | 10,799 | |
| | 455 | | | HCI Group, Inc. | | | 18,414 | |
| | 539 | | | Horace Mann Educators Corp. | | | 21,716 | |
| | 124 | | | Kemper Corp. | | | 10,700 | |
| | 620 | | | Kinsale Capital Group, Inc. | | | 56,718 | |
| | 1,313 | | | MGIC Investment Corp. * | | | 17,253 | |
| | 1,003 | | | National General Holdings Corp. | | | 23,009 | |
| | 1,150 | | | Protective Insurance Corp. | | | 19,976 | |
| | 1,861 | | | Radian Group, Inc. | | | 42,524 | |
| | 653 | | | United Fire Group, Inc. | | | 31,644 | |
| | | | | | | | 505,310 | |
| | | | | INTERNET - 3.4% | | | | |
| | 926 | | | Boingo Wireless, Inc. * | | | 16,640 | |
| | 607 | | | Cargurus, Inc. * | | | 21,919 | |
| | 930 | | | Cars.com, Inc. * | | | 18,340 | |
| | 749 | | | Cogent Communications Holdings, Inc. | | | 44,461 | |
| | 1,072 | | | Etsy, Inc. * | | | 65,789 | |
| | 3,134 | | | Groupon, Inc. * | | | 11,220 | |
| | 271 | | | GrubHub, Inc. * | | | 21,135 | |
| | 1,866 | | | NIC, Inc. | | | 29,931 | |
| | 339 | | | Overstock.com, Inc. * | | | 4,610 | |
| | 323 | | | Perficient, Inc. * | | | 11,085 | |
| | 456 | | | Proofpoint, Inc. * | | | 54,834 | |
| | 1,247 | | | QuinStreet, Inc. * | | | 19,765 | |
| | 481 | | | RealReal, Inc. * | | | 13,901 | |
| | 969 | | | RingCentral, Inc. * | | | 111,357 | |
| | 192 | | | Shutterfly, Inc. | | | 7,524 | |
| | 86 | | | Stamps.com, Inc. * | | | 3,893 | |
| | 942 | | | TechTarget, Inc. * | | | 20,018 | |
| | 1,115 | | | TrueCar, Inc. * | | | 6,088 | |
| | 2,865 | | | US Auto Parts Network, Inc. * | | | 3,581 | |
See accompanying notes to financial statements.
Global Atlantic BlackRock Disciplined Small Cap Portfolio
PORTFOLIO OF INVESTMENTS (Continued)
June 30, 2019 (Unaudited)
| Shares | | | | | Value | |
| | | | | INTERNET - 3.4% (Continued) | | | | |
| | 1,048 | | | Yelp, Inc. * | | $ | 35,821 | |
| | 690 | | | Zendesk, Inc. * | | | 61,431 | |
| | 374 | | | Zscaler, Inc. * | | | 28,663 | |
| | | | | | | | 612,006 | |
| | | | | INVESTMENT COMPANIES - 0.1% | | | | |
| | 2,067 | | | BrightSphere Investment Group PLC | | | 23,584 | |
| | | | | | | | | |
| | | | | IRON/STEEL - 0.3% | | | | |
| | 322 | | | Carpenter Technology Corp. | | | 15,450 | |
| | 1,759 | | | Cleveland-Cliffs, Inc. | | | 18,769 | |
| | 991 | | | Schnitzer Steel Industries, Inc. | | | 25,934 | |
| | | | | | | | 60,153 | |
| | | | | LEISURE TIME - 0.7% | | | | |
| | 259 | | | Fox Factory Holding Corp. * | | | 21,370 | |
| | 484 | | | Malibu Boats, Inc. * | | | 18,803 | |
| | 880 | | | MasterCraft Boat Holdings, Inc. * | | | 17,239 | |
| | 970 | | | Planet Fitness, Inc. * | | | 70,267 | |
| | | | | | | | 127,679 | |
| | | | | LODGING - 0.5% | | | | |
| | 713 | | | Boyd Gaming Corp. | | | 19,208 | |
| | 1,029 | | | Caesars Entertainment Corp. * | | | 12,163 | |
| | 1,507 | | | Century Casinos, Inc. * | | | 14,618 | |
| | 1,304 | | | Marcus Corp. | | | 42,980 | |
| | | | | | | | 88,969 | |
| | | | | MACHINERY - DIVERSIFIED - 1.4% | | | | |
| | 211 | | | Alamo Group, Inc. | | | 21,085 | |
| | 254 | | | Albany International Corp. | | | 21,059 | |
| | 383 | | | Altra Industrial Motion Corp. | | | 13,742 | |
| | 1,338 | | | Applied Industrial Technologies, Inc. | | | 82,327 | |
| | 1,081 | | | Briggs & Stratton Corp. | | | 11,069 | |
| | 410 | | | Cactus, Inc. * | | | 13,579 | |
| | 424 | | | Curtiss-Wright Corp. | | | 53,903 | |
| | 816 | | | DXP Enterprises, Inc. * | | | 30,918 | |
| | 277 | | | Manitowoc Co., Inc. * | | | 4,931 | |
| | | | | | | | 252,613 | |
| | | | | MEDIA - 1.3% | | | | |
| | 1,456 | | | Entercom Communications Corp. | | | 8,445 | |
| | 4,818 | | | Entravision Communications Corp. | | | 15,032 | |
| | 1,573 | | | Gray Television, Inc. * | | | 25,781 | |
| | 621 | | | Liberty Latin America Ltd. - Class A * | | | 10,700 | |
| | 1,484 | | | Liberty Latin America Ltd. - Class C * | | | 25,510 | |
| | 222 | | | Meredith Corp. | | | 12,223 | |
See accompanying notes to financial statements.
Global Atlantic BlackRock Disciplined Small Cap Portfolio
PORTFOLIO OF INVESTMENTS (Continued)
June 30, 2019 (Unaudited)
| Shares | | | | | Value | |
| | | | | MEDIA (Continued) - 1.3% | | | | |
| | 1,116 | | | MSG Networks, Inc. * | | $ | 23,146 | |
| | 190 | | | Nexstar Media Group, Inc. | | | 19,190 | |
| | 658 | | | Sinclair Broadcast Group, Inc. | | | 35,289 | |
| | 1,189 | | | TEGNA, Inc. | | | 18,013 | |
| | 1,921 | | | Townsquare Media, Inc. | | | 10,335 | |
| | 395 | | | World Wrestling Entertainment, Inc. | | | 28,523 | |
| | | | | | | | 232,187 | |
| | | | | METAL FABRICATE/HARDWARE - 1.1% | | | | |
| | 509 | | | Lawson Products, Inc. * | | | — | |
| | 453 | | | LB Foster Co. * | | | 12,385 | |
| | 3,607 | | | Rexnord Corp. * | | | 109,004 | |
| | 2,495 | | | Ryerson Holding Corp. * | | | 20,783 | |
| | 1,088 | | | TimkenSteel Corp. * | | | 8,845 | |
| | 302 | | | TriMas Corp. * | | | 9,353 | |
| | 975 | | | Worthington Industries, Inc. | | | 39,254 | |
| | | | | | | | 199,624 | |
| | | | | MINING - 0.3% | | | | |
| | 5,768 | | | Coeur Mining, Inc. * | | | — | |
| | 6,536 | | | Hecla Mining Co. | | | 11,765 | |
| | 429 | | | Kaiser Aluminum Corp. | | | 41,874 | |
| | | | | | | | 53,639 | |
| | | | | MISCELLANEOUS MANUFACTURER - 1.4% | | | | |
| | 401 | | | Axon Enterprise, Inc. * | | | 25,748 | |
| | 311 | | | EnPro Industries, Inc. | | | 19,854 | |
| | 816 | | | ESCO Technologies, Inc. | | | 67,418 | |
| | 572 | | | Fabrinet * | | | 28,411 | |
| | 34 | | | Hillenbrand, Inc. | | | 1,345 | |
| | 142 | | | John Bean Technologies Corp. | | | 17,200 | |
| | 128 | | | Proto Labs, Inc. * | | | 14,851 | |
| | 366 | | | Raven Industries, Inc. | | | 13,132 | |
| | 430 | | | Standex International Corp. | | | 31,450 | |
| | 523 | | | Trinseo SA | | | 22,144 | |
| | | | | | | | 241,553 | |
| | | | | OFFICE FURNISHINGS - 0.4% | | | | |
| | 2,204 | | | Interface, Inc. | | | 33,787 | |
| | 1,019 | | | Kimball International, Inc. | | | 17,761 | |
| | 1,001 | | | Steelcase, Inc. | | | 17,117 | |
| | | | | | | | 68,665 | |
| | | | | OIL & GAS - 1.9% | | | | |
| | 1,039 | | | Brigham Minerals, Inc. * | | | 22,297 | |
| | 475 | | | Carrizo Oil & Gas, Inc. * | | | 4,760 | |
| | 2,758 | | | CNX Resources Corp. * | | | 20,161 | |
| | 644 | | | CVR Energy, Inc. | | | 32,194 | |
| | 550 | | | Delek US Holdings, Inc. | | | 22,286 | |
See accompanying notes to financial statements.
Global Atlantic BlackRock Disciplined Small Cap Portfolio
PORTFOLIO OF INVESTMENTS (Continued)
June 30, 2019 (Unaudited)
| Shares | | | | | Value | |
| | | | | OIL & GAS (Continued) - 1.9% | | | | |
| | 3,248 | | | Denbury Resources, Inc. * | | $ | 4,028 | |
| | 2,253 | | | Ensco PLC | | | 19,218 | |
| | 5,122 | | | Evolution Petroleum Corp. | | | 36,622 | |
| | 2,377 | | | Gulfport Energy Corp. * | | | 11,671 | |
| | 1,933 | | | Matador Resources Co. * | | | 38,428 | |
| | 219 | | | Montage Resources Corp. * | | | 1,336 | |
| | 248 | | | Murphy USA, Inc. * | | | 20,839 | |
| | 4,899 | | | Oasis Petroleum, Inc. * | | | 27,826 | |
| | 2 | | | Parker Drilling Co. * | | | 41 | |
| | 342 | | | PDC Energy, Inc. * | | | 12,333 | |
| | 107 | | | Penn Virginia Corp. * | | | 3,283 | |
| | 8,102 | | | Southwestern Energy Co. * | | | 25,602 | |
| | 3,839 | | | SRC Energy, Inc. * | | | 19,041 | |
| | 781 | | | Talos Energy, Inc. * | | | 18,782 | |
| | | | | | | | 340,748 | |
| | | | | OIL & GAS SERVICES - 1.3% | | | | |
| | 2,783 | | | Archrock, Inc. | | | 29,500 | |
| | 394 | | | Basic Energy Services, Inc. * | | | 749 | |
| | 656 | | | C&J Energy Services, Inc. * | | | 7,728 | |
| | 273 | | | Dril-Quip, Inc. * | | | 13,104 | |
| | 949 | | | Exterran Corp. * | | | 13,495 | |
| | 1,558 | | | Forum Energy Technologies, Inc. * | | | — | |
| | 1,688 | | | FTS International, Inc. * | | | 9,419 | |
| | 190 | | | KLX Energy Services Holdings, Inc. * | | | 3,882 | |
| | 1,097 | | | Matrix Service Co. * | | | 22,225 | |
| | 676 | | | McDermott International, Inc. * | | | 6,530 | |
| | 607 | | | MRC Global, Inc. * | | | 10,392 | |
| | 577 | | | Oceaneering International, Inc. * | | | 11,765 | |
| | 1,382 | | | Oil States International, Inc. * | | | 25,291 | |
| | 3,545 | | | Pioneer Energy Services Corp. * | | | 897 | |
| | 1,973 | | | ProPetro Holding Corp. * | | | 40,841 | |
| | 20,995 | | | Superior Energy Services, Inc. * | | | 27,293 | |
| | 2,699 | | | TETRA Technologies, Inc. * | | | 4,399 | |
| | 510 | | | US Silica Holdings, Inc. | | | 6,523 | |
| | | | | | | | 234,033 | |
| | | | | PACKAGING & CONTAINERS - 0.1% | | | | |
| | 417 | | | Greif, Inc. | | | 13,573 | |
| | | | | | | | | |
| | | | | PHARMACEUTICALS - 3.9% | | | | |
| | 777 | | | Aimmune Therapeutics, Inc. * | | | 16,177 | |
| | 2,123 | | | Akebia Therapeutics, Inc. * | | | 10,275 | |
| | 2,804 | | | Amneal Pharmaceuticals, Inc. * | | | — | |
| | 1,989 | | | Array BioPharma, Inc. * | | | 92,150 | |
| | 121 | | | BioSpecifics Technologies Corp. * | | | 7,225 | |
See accompanying notes to financial statements.
Global Atlantic BlackRock Disciplined Small Cap Portfolio
PORTFOLIO OF INVESTMENTS (Continued)
June 30, 2019 (Unaudited)
| Shares | | | | | Value | |
| | | | | PHARMACEUTICALS (Continued) - 3.9% | | | | |
| | 4,959 | | | Chimerix, Inc. * | | $ | 21,423 | |
| | 707 | | | Clovis Oncology, Inc. * | | | 10,513 | |
| | 855 | | | Concert Pharmaceuticals, Inc. * | | | 10,260 | |
| | 1,331 | | | Corcept Therapeutics, Inc. * | | | 14,841 | |
| | 4,429 | | | Corvus Pharmaceuticals, Inc. * | | | 16,564 | |
| | 1,507 | | | Dermira, Inc. * | | | 14,407 | |
| | 635 | | | Diplomat Pharmacy, Inc. * | | | 3,867 | |
| | 209 | | | Enanta Pharmaceuticals, Inc. * | | | 17,635 | |
| | 798 | | | Endo International PLC * | | | 3,288 | |
| | 631 | | | Global Blood Therapeutics, Inc. * | | | 33,191 | |
| | 642 | | | Heron Therapeutics, Inc. * | | | 11,935 | |
| | 2,040 | | | Horizon Pharma PLC * | | | 49,082 | |
| | 865 | | | Intellia Therapeutics, Inc. * | | | 14,160 | |
| | 789 | | | Intra-Cellular Therapies, Inc. * | | | 10,241 | |
| | 1,900 | | | Ironwood Pharmaceuticals, Inc. * | | | 20,786 | |
| | 82 | | | Mallinckrodt PLC * | | | 753 | |
| | 100 | | | Mirati Therapeutics, Inc. * | | | 10,300 | |
| | 215 | | | MyoKardia, Inc. * | | | 10,780 | |
| | 807 | | | Natural Health Trends Corp. | | | 6,496 | |
| | 406 | | | Nektar Therapeutics * | | | 14,445 | |
| | 1,252 | | | Owens & Minor, Inc. | | | 4,006 | |
| | 263 | | | Pacira Pharmaceuticals, Inc. * | | | 11,438 | |
| | 987 | | | Phibro Animal Health Corp. | | | 31,357 | |
| | 302 | | | Portola Pharmaceuticals, Inc. * | | | 8,193 | |
| | 225 | | | PRA Health Sciences, Inc. * | | | 22,309 | |
| | 839 | | | Prestige Consumer Healthcare, Inc. * | | | 26,580 | |
| | 179 | | | Ra Pharmaceuticals, Inc. * | | | 5,383 | |
| | 299 | | | Reata Pharmaceuticals, Inc. * | | | 28,211 | |
| | 185 | | | Sarepta Therapeutics, Inc. * | | | 28,111 | |
| | 3,816 | | | Seres Therapeutics, Inc. * | | | 12,288 | |
| | 474 | | | Spectrum Pharmaceuticals, Inc. * | | | 4,081 | |
| | 247 | | | Supernus Pharmaceuticals, Inc. * | | | 8,173 | |
| | 395 | | | USANA Health Sciences, Inc. * | | | 31,375 | |
| | 858 | | | Vanda Pharmaceuticals, Inc. * | | | 12,089 | |
| | 661 | | | Xencor, Inc. * | | | 27,055 | |
| | 207 | | | Zogenix, Inc. * | | | 9,890 | |
| | | | | | | | 691,333 | |
| | | | | REAL ESTATE - 0.6% | | | | |
| | 432 | | | Marcus & Millichap, Inc. * | | | 13,327 | |
| | 1,446 | | | McGrath RentCorp | | | 89,869 | |
| | 991 | | | Target Hospitality Corp. * | | | 9,018 | |
| | | | | | | | 112,214 | |
| | | | | REAL ESTATE INVESTMENT TRUSTS - 8.5% | | | | |
| | 1,676 | | | Acadia Realty Trust | | | 45,872 | |
See accompanying notes to financial statements.
Global Atlantic BlackRock Disciplined Small Cap Portfolio
PORTFOLIO OF INVESTMENTS (Continued)
June 30, 2019 (Unaudited)
| Shares | | | | | Value | |
| | | | | REAL ESTATE INVESTMENT TRUSTS (Continued) - 8.5% | | | | |
| | 937 | | | Ares Commercial Real Estate Corp. | | $ | 13,924 | |
| | 1,455 | | | CareTrust REIT, Inc. | | | 34,600 | |
| | 7,553 | | | Cedar Realty Trust, Inc. | | | 20,015 | |
| | 2,378 | | | Chatham Lodging Trust | | | 44,873 | |
| | 2,359 | | | CorePoint Lodging, Inc. | | | 29,228 | |
| | 920 | | | Cousins Properties, Inc. | | | 33,276 | |
| | 4,618 | | | DiamondRock Hospitality Co. | | | 47,750 | |
| | 2,451 | | | Easterly Government Properties, Inc. | | | 44,388 | |
| | 1,020 | | | EastGroup Properties, Inc. | | | 118,300 | |
| | 5,838 | | | First Industrial Realty Trust, Inc. | | | 214,488 | |
| | 2,467 | | | Four Corners Property Trust, Inc. | | | 67,423 | |
| | 1,374 | | | Franklin Street Properties Corp. | | | 10,140 | |
| | 326 | | | GEO Group, Inc. | | | 6,849 | |
| | 326 | | | Hannon Armstrong Sustainable Infrastructure Capital, Inc. | | | 9,187 | |
| | 4,112 | | | Hersha Hospitality Trust | | | 68,012 | |
| | 4,360 | | | Invesco Mortgage Capital, Inc. | | | 70,283 | |
| | 968 | | | Kite Realty Group Trust | | | 14,646 | |
| | 2,873 | | | Ladder Capital Corp. | | | 47,721 | |
| | 1,626 | | | National Storage Affiliates Trust | | | 47,056 | |
| | 544 | | | NexPoint Residential Trust, Inc. | | | 22,522 | |
| | 1,788 | | | Preferred Apartment Communities, Inc. | | | 26,731 | |
| | 167 | | | PS Business Parks, Inc. | | | 28,145 | |
| | 363 | | | QTS Realty Trust, Inc. | | | 16,763 | |
| | 1,539 | | | Retail Opportunity Investments Corp. | | | 26,363 | |
| | 1,391 | | | Rexford Industrial Realty, Inc. | | | 56,155 | |
| | 5,792 | | | RLJ Lodging Trust | | | 102,750 | |
| | 556 | | | Ryman Hospitality Properties, Inc. | | | 45,086 | |
| | 943 | | | STAG Industrial, Inc. | | | 28,516 | |
| | 1,954 | | | Sunstone Hotel Investors, Inc. | | | 26,789 | |
| | 1,263 | | | Terreno Realty Corp. | | | 61,938 | |
| | 1,498 | | | TPG RE Finance Trust, Inc. | | | 28,896 | |
| | 2,231 | | | Xenia Hotels & Resorts, Inc. | | | 46,516 | |
| | | | | | | | 1,505,201 | |
| | | | | RETAIL - 4.9% | | | | |
| | 1,907 | | | American Eagle Outfitters, Inc. | | | 32,228 | |
| | 277 | | | America’s Car-Mart, Inc. * | | | 23,844 | |
| | 1,330 | | | Asbury Automotive Group, Inc. * | | | 112,172 | |
| | 513 | | | Barnes & Noble, Inc. | | | 3,432 | |
| | 303 | | | Bassett Furniture Industries, Inc. | | | 4,621 | |
| | 327 | | | Beacon Roofing Supply, Inc. * | | | 12,007 | |
| | 1,746 | | | Bed Bath & Beyond, Inc. | | | 20,289 | |
| | 405 | | | Big Lots, Inc. | | | 11,587 | |
| | 652 | | | BJ’s Restaurants, Inc. | | | 28,649 | |
| | 1,009 | | | BJ’s Wholesale Club Holdings, Inc. * | | | 26,638 | |
See accompanying notes to financial statements.
Global Atlantic BlackRock Disciplined Small Cap Portfolio
PORTFOLIO OF INVESTMENTS (Continued)
June 30, 2019 (Unaudited)
| Shares | | | | | Value | |
| | | | | RETAIL - 4.9% (Continued) | | | | |
| | 1,473 | | | Bloomin’ Brands, Inc. | | $ | 27,854 | |
| | 1,364 | | | BMC Stock Holdings, Inc. * | | | 28,917 | |
| | 566 | | | Brinker International, Inc. | | | 22,272 | |
| | 503 | | | Carrols Restaurant Group, Inc. * | | | 4,542 | |
| | 1,182 | | | Cato Corp. | | | 14,562 | |
| | 742 | | | Cheesecake Factory, Inc. | | | 32,440 | |
| | 2,489 | | | Chico’s FAS, Inc. | | | 8,388 | |
| | 856 | | | Citi Trends, Inc. | | | 12,515 | |
| | 167 | | | Dillard’s, Inc. | | | 10,401 | |
| | 283 | | | FirstCash, Inc. | | | 28,306 | |
| | 499 | | | Five Below, Inc. * | | | 59,890 | |
| | 1,733 | | | Foundation Building Materials, Inc. * | | | 30,813 | |
| | 151 | | | Freshpet, Inc. * | | | 6,872 | |
| | 435 | | | Lithia Motors, Inc. | | | 51,669 | |
| | 347 | | | Ollie’s Bargain Outlet Holdings, Inc. * | | | 30,227 | |
| | 716 | | | PC Connection, Inc. | | | 25,046 | |
| | 110 | | | RH * | | | 12,716 | |
| | 696 | | | Rush Enterprises, Inc. | | | 25,418 | |
| | 1,409 | | | Sonic Automotive, Inc. | | | 32,900 | |
| | 2,119 | | | Texas Roadhouse, Inc. | | | 113,727 | |
| | 883 | | | Zumiez, Inc. * | | | 23,046 | |
| | | | | | | | 877,988 | |
| | | | | SAVINGS & LOANS - 2.2% | | | | |
| | 5,662 | | | Community Bankers Trust Corp. | | | 47,957 | |
| | 1,068 | | | First Defiance Financial Corp. | | | 30,513 | |
| | 2,732 | | | First Financial Northwest, Inc. | | | 38,658 | |
| | 48 | | | First Savings Financial Group, Inc. | | | 2,880 | |
| | 70 | | | Hingham Institution for Savings | | | 13,861 | |
| | 2,835 | | | Meridian Bancorp, Inc. | | | 50,718 | |
| | 3,391 | | | Riverview Bancorp, Inc. | | | 28,959 | |
| | 1,721 | | | United Community Financial Corp. | | | 16,470 | |
| | 3,996 | | | Washington Federal, Inc. | | | 139,580 | |
| | 321 | | | WSFS Financial Corp. | | | 13,257 | |
| | | | | | | | 382,853 | |
| | | | | SEMICONDUCTORS - 1.7% | | | | |
| | 510 | | | Alpha & Omega Semiconductor Ltd. * | | | 4,763 | |
| | 230 | | | Ambarella, Inc. * | | | 10,150 | |
| | 5,456 | | | Amkor Technology, Inc. * | | | 40,702 | |
| | 193 | | | Aquantia Corp. * | | | 2,515 | |
| | 558 | | | Brooks Automation, Inc. * | | | 21,622 | |
| | 218 | | | Cabot Microelectronics Corp. | | | 23,997 | |
| | 1,546 | | | Cirrus Logic, Inc. * | | | 67,560 | |
| | 460 | | | Cohu, Inc. | | | 7,098 | |
| | 940 | | | Diodes, Inc. * | | | 34,188 | |
See accompanying notes to financial statements.
Global Atlantic BlackRock Disciplined Small Cap Portfolio
PORTFOLIO OF INVESTMENTS (Continued)
June 30, 2019 (Unaudited)
| Shares | | | | | Value | |
| | | | | SEMICONDUCTORS - 1.7% (Continued) | | | | |
| | 800 | | | GSI Technology, Inc. * | | $ | 6,856 | |
| | 327 | | | Inphi Corp. * | | | 16,383 | |
| | 150 | | | Power Integrations, Inc. | | | 12,027 | |
| | 372 | | | Semtech Corp. * | | | 17,875 | |
| | 1,070 | | | Synaptics, Inc. * | | | 31,180 | |
| | 858 | | | Ultra Clean Holdings, Inc. * | | | 11,943 | |
| | | | | | | | 308,859 | |
| | | | | SOFTWARE - 4.2% | | | | |
| | 2,129 | | | Allscripts Healthcare Solutions, Inc. * | | | 24,760 | |
| | 266 | | | Appfolio, Inc. * | | | 27,204 | |
| | 962 | | | Benefitfocus, Inc. * | | | 26,118 | |
| | 253 | | | Blackline, Inc. * | | | 13,538 | |
| | 460 | | | Bottomline Technologies de, Inc. * | | | 20,350 | |
| | 942 | | | Box, Inc. * | | | 16,589 | |
| | 2,717 | | | Castlight Health, Inc. * | | | 8,776 | |
| | 3,085 | | | Cloudera, Inc. * | | | 16,227 | |
| | 699 | | | Cornerstone OnDemand, Inc. * | | | 40,493 | |
| | 442 | | | Coupa Software, Inc. * | | | 55,962 | |
| | 619 | | | CSG Systems International, Inc. | | | 30,226 | |
| | 675 | | | Domo, Inc. * | | | 18,441 | |
| | 2,300 | | | Evolent Health, Inc. * | | | 18,285 | |
| | 183 | | | Fair Isaac, Corp. * | | | 57,466 | |
| | 333 | | | Fastly, Inc. * | | | 6,753 | |
| | 666 | | | Five9, Inc. * | | | 34,159 | |
| | 1,963 | | | InnerWorkings, Inc. * | | | 7,499 | |
| | 110 | | | Instructure, Inc. * | | | 4,675 | |
| | 847 | | | LivePerson, Inc. * | | | 23,750 | |
| | 369 | | | ManTech International Corp. | | | 24,299 | |
| | 40 | | | Medidata Solutions, Inc. * | | | 3,620 | |
| | 127 | | | MicroStrategy, Inc. * | | | 18,200 | |
| | 551 | | | New Relic, Inc. * | | | 47,667 | |
| | 595 | | | Omnicell, Inc. * | | | 51,188 | |
| | 788 | | | Progress Software Corp. | | | 34,373 | |
| | 250 | | | SPS Commerce, Inc. * | | | 25,552 | |
| | 2,863 | | | Telenav, Inc. * | | | 22,904 | |
| | 1,349 | | | TiVo Corp. | | | 9,942 | |
| | 636 | | | Workiva, Inc. * | | | 36,945 | |
| | 1,001 | | | Yext, Inc. * | | | 20,110 | |
| | | | | | | | 746,071 | |
| | | | | STOREAGE/WAREHOUSING - 0.2% | | | | |
| | 861 | | | Mobile Mini, Inc. | | | 26,200 | |
See accompanying notes to financial statements.
Global Atlantic BlackRock Disciplined Small Cap Portfolio
PORTFOLIO OF INVESTMENTS (Continued)
June 30, 2019 (Unaudited)
| Shares | | | | | Value | |
| | | | | TELECOMMUNICATIONS - 2.1% | | | | |
| | 6,098 | | | A10 Networks, Inc. * | | $ | 41,588 | |
| | 284 | | | Aerohive Networks, Inc. * | | | 1,258 | |
| | 988 | | | Calix, Inc. * | | | 6,481 | |
| | 2,451 | | | Ciena Corp. * | | | 100,810 | |
| | 1,334 | | | Consolidated Communications Holdings, Inc. | | | 6,577 | |
| | 1,770 | | | Extreme Networks, Inc. * | | | 11,452 | |
| | 1,120 | | | Finisar Corp. * | | | 25,614 | |
| | 4,635 | | | Infinera Corp. * | | | 13,488 | |
| | 1,528 | | | Iridium Communications, Inc. * | | | 35,541 | |
| | 277 | | | NETGEAR, Inc. * | | | 7,005 | |
| | 958 | | | Ooma, Inc. * | | | 10,040 | |
| | 250 | | | Plantronics, Inc. | | | 9,260 | |
| | 529 | | | TESSCO Technologies, Inc. | | | 9,448 | |
| | 258 | | | Ubiquiti Networks, Inc. | | | 33,927 | |
| | 592 | | | ViaSat, Inc. * | | | 47,845 | |
| | 1,506 | | | Vonage Holdings Corp. * | | | 17,063 | |
| | | | | | | | 377,397 | |
| | | | | TRANSPORTATION - 1.2% | | | | |
| | 245 | | | Atlas Air Worldwide Holdings, Inc. * | | | 10,937 | |
| | 2,485 | | | Covenant Transportation Group, Inc. * | | | 36,554 | |
| | 810 | | | Hub Group, Inc. * | | | 34,004 | |
| | 588 | | | Knight-Swift Transportation Holdings, Inc. | | | 19,310 | |
| | 2,720 | | | Marten Transport Ltd. | | | 49,368 | |
| | 5,808 | | | Nordic American Tankers Ltd. | | | 13,591 | |
| | 52 | | | Saia, Inc. * | | | 3,363 | |
| | 808 | | | Scorpio Tankers, Inc. | | | 23,852 | |
| | 361 | | | Universal Logistics Holdings, Inc. | | | — | |
| | 561 | | | Werner Enterprises, Inc. | | | 17,436 | |
| | | | | | | | 208,415 | |
| | | | | TRUCKING & LEASING - 0.1% | | | | |
| | 167 | | | GATX Corp. | | | 13,241 | |
| | 343 | | | Greenbrier Cos, Inc. | | | 10,427 | |
| | | | | | | | 23,668 | |
| | | | | WATER - 0.2% | | | | |
| | 601 | | | SJW Group | | | 36,523 | |
| | | | | | | | | |
| | | | | TOTAL COMMON STOCKS (Cost - $17,140,533) | | | 17,308,588 | |
| | | | | | | | | |
| | | | | WARRANT - 0.0% ^ | | | | |
| | 20 | | | Parker Drilling Co. (Cost - $0) | | | — | �� |
See accompanying notes to financial statements.
Global Atlantic BlackRock Disciplined Small Cap Portfolio
PORTFOLIO OF INVESTMENTS (Continued)
June 30, 2019 (Unaudited)
| Shares | | | | | Value | |
| | | | | SHORT-TERM INVESTMENT - 2.5% | | | | |
| | | | | MONEY MARKET FUND - 2.5% | | | | |
| | 452,302 | | | Fidelity Investments Money Market Funds - Government Portfolio, Institutional Class to yield 2.25% (a)(Cost - $452,302) | | $ | 452,302 | |
| | | | | | | | | |
| | | | | TOTAL INVESTMENTS - 99.9% (Cost - $17,592,835) | | $ | 17,760,890 | |
| | | | | OTHER ASSETS LESS LIABILITIES - NET - 0.1% | | | 2,149 | |
| | | | | TOTAL NET ASSETS - 100.0% | | $ | 17,763,039 | |
| * | Non-income producing security. |
| ^ | Represents less than 0.05% |
| | PLC - Public Limited Company |
| | REIT - Real Estate Investment Trust |
| (a) | Money market rate shown represents the rate at June 30, 2019. |
| | | | | | | | | | | | Unrealized | |
| Description | | Counterparty | | Contracts | | Expiration Date | | Notional Value | | | Appreciation | |
| LONG | | | | | | | | | | | | | | |
| E-mini Russell 2000 Future | | Goldman Sachs | | 5 | | Sep-19 | | $ | 443,722 | | | $ | 10,030 | |
| NET UNREALIZED APPRECIATION ON FUTURES CONTRACTS | | | $ | 10,030 | |
See accompanying notes to financial statements.
Global Atlantic BlackRock Disciplined U.S. Core Portfolio
PORTFOLIO OF INVESTMENTS
June 30, 2019 (Unaudited)
| Shares | | | | | Value | |
| | | | | COMMON STOCKS - 97.2% | | | | |
| | | | | ADVERTISING - 0.7% | | $ | 164,681 | |
| | 7,290 | | | Interpublic Group of Cos, Inc. | | | 9,588 | |
| | 117 | | | Omnicom Group, Inc. | | | 174,269 | |
| | | | | | | | | |
| | | | | AEROSPACE/DEFENSE - 2.0% | | | | |
| | 547 | | | L3Harris Technologies, Inc. * | | | 103,454 | |
| | 819 | | | Lockheed Martin Corp. | | | 297,739 | |
| | 624 | | | Raytheon Co. | | | 108,501 | |
| | | | | | | | 509,694 | |
| | | | | AGRICULTURE - 0.8% | | | | |
| | 132 | | | Altria Group, Inc. | | | 6,250 | |
| | 2,240 | | | Archer-Daniels-Midland Co. | | | 91,392 | |
| | 1,384 | | | Phillip Morris International, Inc. | | | 108,686 | |
| | | | | | | | 206,328 | |
| | | | | AIRLINES - 0.0% ^ | | | | |
| | 147 | | | Delta Air Lines, Inc. | | | 8,342 | |
| | | | | | | | | |
| | | | | APPAREL - 0.6% | | | | |
| | 1,872 | | | NIKE, Inc. | | | 157,154 | |
| | | | | | | | | |
| | | | | AUTO MANUFACTURERS - 1.2% | | | | |
| | 4,085 | | | PACCAR, Inc. | | | 292,731 | |
| | | | | | | | | |
| | | | | AUTO PARTS & EQUIPMENT - 0.1% | | | | |
| | 1,556 | | | Dana, Inc. | | | 31,027 | |
| | | | | | | | | |
| | | | | BANKS - 5.3% | | | | |
| | 7,373 | | | Bank of America Corp. | | | 213,817 | |
| | 261 | | | Citigroup, Inc. | | | 18,278 | |
| | 3,984 | | | Citizens Financial Group, Inc. | | | 140,874 | |
| | 681 | | | First Republic Bank | | | 66,500 | |
| | 4,884 | | | JPMorgan Chase & Co. | | | 546,031 | |
| | 2,721 | | | Morgan Stanley | | | 119,207 | |
| | 3,380 | | | Wells Fargo & Co. | | | 159,942 | |
| | 1,074 | | | Western Alliance Bancorp * | | | 48,029 | |
| | 161 | | | Zions Bancorp NA | | | 7,403 | |
| | | | | | | | 1,320,081 | |
| | | | | BEVERAGES - 1.3% | | | | |
| | 189 | | | Molson Coors Brewing Co. | | | 10,584 | |
| | 998 | | | Monster Beverage Corp. * | | | 63,702 | |
| | 1,983 | | | PepsiCo, Inc. | | | 260,031 | |
| | | | | | | | 334,317 | |
| | | | | BIOTECHNOLOGY - 2.7% | | | | |
| | 1,419 | | | Amgen, Inc. | | | 261,493 | |
| | 97 | | | Biogen, Inc. * | | | 22,685 | |
| | 705 | | | Celgene Corp. * | | | 65,170 | |
| | 3,086 | | | Gilead Sciences, Inc. | | | 208,490 | |
| | 266 | | | Regeneron Pharmaceuticals, Inc. * | | | 83,258 | |
See accompanying notes to financial statements.
Global Atlantic BlackRock Disciplined U.S. Core Portfolio
PORTFOLIO OF INVESTMENTS (Continued)
June 30, 2019 (Unaudited)
| Shares | | | | | Value | |
| | | | | BIOTECHNOLOGY (Continued) - 2.7% | | | | |
| | 189 | | | Vertex Pharmaceuticals, Inc. * | | $ | 34,659 | |
| | | | | | | | 675,755 | |
| | | | | CHEMICALS - 2.0% | | | | |
| | 810 | | | Air Products & Chemicals, Inc. | | | 183,360 | |
| | 790 | | | Dow, Inc. * | | | 38,955 | |
| | 513 | | | DuPont de Nemours Inc | | | 38,511 | |
| | 487 | | | Ecolab, Inc. | | | 96,153 | |
| | 1,486 | | | LyondellBasell Industries NV | | | 127,989 | |
| | | | | | | | 484,968 | |
| | | | | COMMERCIAL SERVICES - 2.5% | | | | |
| | 1,457 | | | Automatic Data Processing, Inc. | | | 240,886 | |
| | 1 | | | Booz Allen Hamilton Holding Corp. | | | 66 | |
| | 136 | | | CoStar Group, Inc. * | | | 75,352 | |
| | 117 | | | H&R Block, Inc. | | | 3,428 | |
| | 796 | | | Insperity, Inc. | | | 97,223 | |
| | 901 | | | PayPal Holdings, Inc. * | | | 103,128 | |
| | 149 | | | S&P Global, Inc. | | | 33,941 | |
| | 344 | | | Square, Inc. * | | | 24,950 | |
| | 701 | | | TriNet Group, Inc. * | | | 47,528 | |
| | | | | | | | 626,502 | |
| | | | | COMPUTERS - 4.3% | | | | |
| | 4,021 | | | Apple, Inc. | | | 795,836 | |
| | 681 | | | Dell Technologies, Inc. - Class C * | | | 34,595 | |
| | 3,163 | | | HP, Inc. | | | 65,759 | |
| | 1,344 | | | International Business Machines Corp. | | | 185,338 | |
| | | | | | | | 1,081,528 | |
| | | | | COSMETICS/PERSONAL CARE - 1.3% | | | | |
| | 896 | | | Colgate-Palmolive Co. | | | 64,216 | |
| | 418 | | | Estee Lauder Cos, Inc. | | | 76,540 | |
| | 1,677 | | | Proctor & Gamble Co. | | | 183,883 | |
| | | | | | | | 324,639 | |
| | | | | DISTRIBUTION/WHOLESALE - 0.1% | | | | |
| | 77 | | | WW Grainger, Inc. | | | 20,654 | |
| | | | | | | | | |
| | | | | DIVERSIFIED FINANCIAL SERVICES - 5.0% | | | | |
| | 1,430 | | | American Express Co. | | | 176,519 | |
| | 366 | | | Capital One Financial Corp. | | | 33,211 | |
| | 7,016 | | | Charles Schwab Corp. | | | 281,973 | |
| | 1,893 | | | Discover Financial Services | | | 146,878 | |
| | 243 | | | Evercore, Inc. | | | 21,523 | |
| | 516 | | | Franklin Resources, Inc. | | | 17,957 | |
| | 318 | | | Mastercard, Inc. | | | 84,121 | |
| | 1,172 | | | TD Ameritrade Holding Corp. | | | 58,506 | |
| | 2,371 | | | Visa, Inc. | | | 411,487 | |
| | | | | | | | 1,232,175 | |
| | | | | ELECTRIC - 3.5% | | | | |
| | 2,284 | | | Alliant Energy Corp. | | | 112,099 | |
| | 747 | | | Avista Corp. | | | 33,316 | |
See accompanying notes to financial statements.
Global Atlantic BlackRock Disciplined U.S. Core Portfolio
PORTFOLIO OF INVESTMENTS (Continued)
June 30, 2019 (Unaudited)
| Shares | | | | | Value | |
| | | | | ELECTRIC (Continued) - 3.1% | | | | |
| | 580 | | | Black Hills Corp. | | $ | 45,339 | |
| | 1,838 | | | Consolidated Edison, Inc. | | | 161,156 | |
| | 361 | | | Dominion Energy, Inc. | | | 27,913 | |
| | 944 | | | DTE Energy Co. | | | 120,719 | |
| | 812 | | | Evergy, Inc. | | | 48,842 | |
| | 693 | | | IDACORP, Inc. | | | 69,598 | |
| | 341 | | | Pinnacle West Capital Corp. | | | 32,085 | |
| | 1,994 | | | Xcel Energy, Inc. | | | 118,623 | |
| | | | | | | | 769,690 | |
| | | | | ELECTRICAL COMPONENTS & EQUIPMENT - 0.3% | | | | |
| | 303 | | | Generac Holdings, Inc. * | | | 21,031 | |
| | 362 | | | Hubbell, Inc. | | | 47,205 | |
| | | | | | | | 68,236 | |
| | | | | ELECTRONICS - 2.1% | | | | |
| | 2,264 | | | ADT, Inc. | | | 13,856 | |
| | 1,358 | | | Allegion PLC | | | 150,127 | |
| | 1,425 | | | Honeywell International, Inc. | | | 248,791 | |
| | 2,705 | | | National Instruments Corp. | | | 113,583 | |
| | | | | | | | 526,357 | |
| | | | | ENGINEERING & CONSTRUCTION - 0.1% | | | | |
| | 219 | | | frontdoor, Inc. * | | | 9,537 | |
| | 76 | | | MasTec, Inc. * | | | 3,916 | |
| | | | | | | | 13,453 | |
| | | | | ENTERTAINMENT - 0.1% | | | | |
| | 809 | | | International Game Technology PLC | | | 10,493 | |
| | | | | | | | | |
| | | | | ENVIRONMENTAL CONTROL - 0.6% | | | | |
| | 419 | | | Waste Connections, Inc. | | | 40,048 | |
| | 841 | | | Waste Management, Inc. | | | 97,026 | |
| | | | | | | | 137,074 | |
| | | | | FOOD - 1.3% | | | | |
| | 2,406 | | | General Mills, Inc. | | | 126,363 | |
| | 956 | | | Hershey Co. | | | 128,133 | |
| | 223 | | | JM Smucker Co. | | | 25,687 | |
| | 153 | | | McCormick & Co, Inc. | | | 23,717 | |
| | 539 | | | Performance Food Group Co. * | | | 21,576 | |
| | | | | | | | 325,476 | |
| | | | | GAS - 0.2% | | | | |
| | 611 | | | Southwest Gas Holdings, Inc. | | | 54,758 | |
| | | | | | | | | |
| | | | | HAND/MACHINE TOOLS - 0.3% | | | | |
| | 524 | | | Snap-on, Inc. | | | 86,795 | |
| | | | | | | | | |
| | | | | HEALTHCARE PRODUCTS - 2.5% | | | | |
| | 718 | | | Danaher Corp. | | | 102,617 | |
| | 413 | | | Hill-Rom Holdings, Inc. | | | 43,208 | |
| | 2,914 | | | Medtronic PLC | | | 283,794 | |
| | 652 | | | Stryker Corp. | | | 134,038 | |
See accompanying notes to financial statements.
Global Atlantic BlackRock Disciplined U.S. Core Portfolio
PORTFOLIO OF INVESTMENTS (Continued)
June 30, 2019 (Unaudited)
| Shares | | | | | Value | |
| | | | | HEALTHCARE PRODUCTS (Continued) - 2.5% | | | | |
| | 177 | | | Thermo Fisher Scientific, Inc. | | $ | 51,981 | |
| | | | | | | | 615,638 | |
| | | | | HEALTHCARE - SERVICES - 1.4% | | | | |
| | 525 | | | Anthem, Inc. | | | 148,160 | |
| | 844 | | | UnitedHealth Group, Inc. | | | 205,944 | |
| | | | | | | | 354,104 | |
| | | | | HOUSEHOLD PRODUCTS/WARES - 0.5% | | | | |
| | 1,464 | | | Church & Dwight Co., Inc. | | | 106,960 | |
| | 76 | | | Kimberly-Clark Corp. | | | 10,129 | |
| | | | | | | | 117,089 | |
| | | | | INSURANCE - 5.3% | | | | |
| | 1,093 | | | Allstate Corp. | | | 111,147 | |
| | 272 | | | Arthur J. Gallagher & Co. | | | 23,824 | |
| | 2,371 | | | Berkshire Hathaway, Inc. * | | | 505,426 | |
| | 323 | | | Cincinnati Financial Corp. | | | 33,485 | |
| | 180 | | | Essent Group Ltd. * | | | 8,458 | |
| | 1,596 | | | First American Financial Corp. | | | 85,705 | |
| | 550 | | | Lincoln National Corp. | | | 35,448 | |
| | 2,236 | | | Loews Corp. | | | 122,242 | |
| | 1,552 | | | MetLife, Inc. | | | 77,088 | |
| �� | 2,846 | | | Prudential Financial, Inc. | | | 287,446 | |
| | 253 | | | Travelers Cos, Inc. | | | 37,829 | |
| | | | | | | | 1,328,098 | |
| | | | | INTERNET - 9.3% | | | | |
| | 307 | | | Alphabet, Inc. - Class A * | | | 331,839 | |
| | 155 | | | Alphabet, Inc. - Class C * | | | 167,834 | |
| | 471 | | | Amazon.com, Inc. * | | | 891,900 | |
| | 172 | | | Etsy, Inc. * | | | 10,556 | |
| | 2,701 | | | Facebook, Inc. * | | | 521,293 | |
| | 1,275 | | | GoDaddy, Inc. * | | | 89,441 | |
| | 574 | | | Lyft, Inc. * | | | 37,718 | |
| | 283 | | | Netflix, Inc. * | | | 103,952 | |
| | 535 | | | Pinterest, Inc. * | | | 14,563 | |
| | 471 | | | Twitter, Inc. * | | | 16,438 | |
| | 1,631 | | | Uber Technologies, Inc. * | | | 75,646 | |
| | 299 | | | VeriSign, Inc. * | | | 62,539 | |
| | | | | | | | 2,323,719 | |
| | | | | LEISURE - 0.4% | | | | |
| | 664 | | | Norwegian Cruise Line Holdings Ltd. * | | | 35,610 | |
| | 452 | | | Royal Caribbean Cruises Ltd. | | | 54,787 | |
| | | | | | | | 90,397 | |
| | | | | LODGING - 0.7% | | | | |
| | 4,654 | | | Extended Stay America, Inc. | | | 78,606 | |
| | 1,485 | | | Las Vegas Sands Corp. | | | 87,749 | |
| | | | | | | | 166,355 | |
| | | | | MACHINERY - CONSTRUCTION & MINING - 0.3% | | | | |
| | 167 | | | Caterpillar, Inc. | | | 22,760 | |
See accompanying notes to financial statements.
Global Atlantic BlackRock Disciplined U.S. Core Portfolio
PORTFOLIO OF INVESTMENTS (Continued)
June 30, 2019 (Unaudited)
| Shares | | | | | Value | |
| | | | | MACHINERY - CONSTRUCTION & MINING (Continued) - 0.3% | | | | |
| | 632 | | | Oshkosh Corp. | | $ | 52,766 | |
| | | | | | | | 75,526 | |
| | | | | MACHINERY - DIVERSIFIED - 1.8% | | | | |
| | 2,175 | | | Crane Co. | | | 181,482 | |
| | 365 | | | Cummins, Inc. | | | 62,539 | |
| | 948 | | | Rockwell Automation, Inc. | | | 155,311 | |
| | 116 | | | Roper Technologies, Inc. | | | 42,486 | |
| | | | | | | | 441,818 | |
| | | | | MEDIA - 1.6% | | | | |
| | 712 | | | CBS Corp. | | | 35,529 | |
| | 7,254 | | | Comcast Corp. | | | 306,699 | |
| | 146 | | | Fox Corp. - Class A * | | | 5,349 | |
| | 167 | | | Fox Corp. - Class B * | | | 6,101 | |
| | 200 | | | Sinclair Broadcast Group, Inc. | | | 10,726 | |
| | 1,396 | | | Sirius XM Holdings, Inc. | | | 7,790 | |
| | 120 | | | Viacom, Inc. - Class A | | | 4,092 | |
| | 1,059 | | | Viacom, Inc. - Class B | | | 31,632 | |
| | | | | | | | 407,918 | |
| | | | | MINING - 0.1% | | | | |
| | 693 | | | Newmont Mining Corp. | | | 26,660 | |
| | | | | | | | | |
| | | | | MISCELLANEOUS MANUFACTURER - 0.0% ^ | | | | |
| | 96 | | | AO Smith Corp. | | | 4,527 | |
| | | | | | | | | |
| | | | | OIL & GAS - 3.2% | | | | |
| | 502 | | | Anadarko Petroleum Corp. | | | 35,421 | |
| | 597 | | | Cabot Oil & Gas Corp. | | | 13,707 | |
| | 1,629 | | | Chevron Corp. | | | 202,713 | |
| | 4,248 | | | ConocoPhillips | | | 259,128 | |
| | 1,055 | | | EOG Resources, Inc. | | | 98,284 | |
| | 1,984 | | | Exxon Mobil Corp. | | | 152,034 | |
| | 164 | | | Helmerich & Payne, Inc. | | | 8,302 | |
| | 326 | | | Valero Energy Corp. | | | 27,909 | |
| | | | | | | | 797,498 | |
| | | | | OIL & GAS SERVICES - 0.5% | | | | |
| | 3,662 | | | Halliburton Co. | | | 83,274 | |
| | 918 | | | Schlumberger Ltd. | | | 36,481 | |
| | | | | | | | 119,755 | |
| | | | | PACKAGING & CONTAINERS - 0.6% | | | | |
| | 3,765 | | | Westrock Co. | | | 137,310 | |
| | | | | | | | | |
| | | | | PHARMACEUTICALS - 7.0% | | | | |
| | 2,233 | | | AbbVie, Inc. | | | 162,384 | |
| | 348 | | | AmerisourceBergen Corp. | | | 29,670 | |
| | 2,747 | | | Bristol-Myers Squibb Co. | | | 124,576 | |
| | 464 | | | Cigna Corp. | | | 73,103 | |
| | 2,026 | | | CVS Health Corp. | | | 110,397 | |
See accompanying notes to financial statements.
Global Atlantic BlackRock Disciplined U.S. Core Portfolio
PORTFOLIO OF INVESTMENTS (Continued)
June 30, 2019 (Unaudited)
| Shares | | | | | Value | |
| | | | | PHARMACEUTICALS (Continued) - 7.0% | | | | |
| | 73 | | | DexCom, Inc. * | | $ | 10,938 | |
| | 443 | | | Eli Lilly & Co. | | | 49,080 | |
| | 434 | | | Herbalife Nutrition Ltd. * | | | 18,558 | |
| | 4,235 | | | Johnson & Johnson | | | 589,851 | |
| | 233 | | | McKesson Corp. | | | 31,313 | |
| | 5,724 | | | Merck & Co., Inc. | | | 479,957 | |
| | 1,668 | | | Pfizer, Inc. | | | 72,258 | |
| | | | | | | | 1,752,085 | |
| | | | | PIPELINES - 0.2% | | | | |
| | 567 | | | Antero Midstream Corp. | | | 6,498 | |
| | 1,983 | | | Williams Cos, Inc. | | | 55,603 | |
| | | | | | | | 62,101 | |
| | | | | REAL ESTATE INVESTMENT TRUSTS - 2.9% | | | | |
| | 7 | | | Equinix, Inc. | | | 3,530 | |
| | 1,193 | | | Equity LifeStyle Properties, Inc. | | | 144,759 | |
| | 867 | | | Outfront Media, Inc. | | | 22,360 | |
| | 2,709 | | | Park Hotels & Resorts, Inc. | | | 74,660 | |
| | 2,496 | | | Prologis, Inc. | | | 199,930 | |
| | 1,680 | | | RLJ Lodging Trust | | | 29,803 | |
| | 491 | | | Ryman Hospitality Properties, Inc. | | | 39,815 | |
| | 1,235 | | | Simon Property Group, Inc. | | | 197,304 | |
| | | | | | | | 712,161 | |
| | | | | RETAIL - 4.6% | | | | |
| | 357 | | | Advance Auto Parts, Inc. | | | 55,028 | |
| | 33 | | | AutoZone, Inc. * | | | 36,283 | |
| | 20 | | | Chipotle Mexican Grill, Inc. * | | | 14,658 | |
| | 423 | | | Costco Wholesale Corp. | | | 111,782 | |
| | 1,227 | | | Darden Restaurants, Inc. | | | 149,363 | |
| | 106 | | | Dollar General Corp. | | | 14,327 | |
| | 87 | | | Domino’s Pizza, Inc. | | | 24,210 | |
| | 710 | | | Home Depot, Inc. | | | 147,659 | |
| | 289 | | | Lululemon Athletica, Inc. * | | | 52,081 | |
| | 854 | | | McDonald’s Corp. | | | 177,342 | |
| | 33 | | | O’Reilly Automotive ,Inc. * | | | 12,188 | |
| | 1,105 | | | Target Corp. | | | 95,704 | |
| | 1,358 | | | TJX Cos, Inc. | | | 71,811 | |
| | 97 | | | Ulta Beauty, Inc. * | | | 33,648 | |
| | 1,060 | | | Walmart, Inc. | | | 117,119 | |
| | 364 | | | Yum! Brands, Inc. | | | 40,284 | |
| | | | | | | | 1,153,487 | |
| | | | | SEMICONDUCTORS - 2.9% | | | | |
| | 1,418 | | | Applied Materials, Inc. | | | 63,682 | |
| | 259 | | | Broadcom Ltd. | | | 74,556 | |
| | 1,017 | | | Cirrus Logic, Inc. * | | | 44,443 | |
| | 3,416 | | | Intel Corp. | | | 163,524 | |
| | 22 | | | Lam Research Corp. | | | 4,132 | |
| | 442 | | | NVIDIA Corp. | | | 72,590 | |
See accompanying notes to financial statements.
Global Atlantic BlackRock Disciplined U.S. Core Portfolio
PORTFOLIO OF INVESTMENTS (Continued)
June 30, 2019 (Unaudited)
| Shares | | | | | Value | |
| | | | | SEMICONDUCTORS (Continued) - 2.9% | | | | |
| | 804 | | | QUALCOMM, Inc. | | $ | 61,160 | |
| | 1,299 | | | Texas Instruments, Inc. | | | 149,073 | |
| | 649 | | | Xilinx, Inc. | | | 76,530 | |
| | | | | | | | 709,690 | |
| | | | | SOFTWARE - 8.8% | | | | |
| | 957 | | | Activision Blizzard, Inc. | | | 45,170 | |
| | 766 | | | Adobe Systems, Inc. * | | | 225,702 | |
| | 73 | | | Electronic Arts, Inc. * | | | 7,392 | |
| | 1,626 | | | Fidelity National Information Services, Inc. | | | 199,478 | |
| | 494 | | | Intuit, Inc. | | | 129,097 | |
| | 5,678 | | | Microsoft Corp. | | | 760,625 | |
| | 1,952 | | | Oracle Corp. | | | 111,205 | |
| | 1,662 | | | Paychex, Inc. | | | 136,766 | |
| | 69 | | | Red Hat, Inc. * | | | 12,955 | |
| | 2,190 | | | salesforce.com, Inc. * | | | 332,289 | |
| | 384 | | | ServiceNow, Inc. * | | | 105,435 | |
| | 413 | | | Veeva Systems, Inc. * | | | 66,951 | |
| | 222 | | | Workday, Inc. * | | | 45,639 | |
| | | | | | | | 2,178,704 | |
| | | | | TELECOMMUNICATIONS - 3.2% | | | | |
| | 3,248 | | | AT&T, Inc. | | | 108,840 | |
| | 640 | | | Ciena Corp. * | | | 26,323 | |
| | 5,746 | | | Cisco Systems, Inc. | | | 314,479 | |
| | 5,978 | | | Verizon Communications, Inc. | | | 341,523 | |
| | | | | | | | 791,165 | |
| | | | | TRANSPORTATION - 0.4% | | | | |
| | 298 | | | CSX Corp. | | | 23,056 | |
| | 283 | | | Landstar System, Inc. | | | 30,561 | |
| | 864 | | | Ryder System, Inc. | | | 50,371 | |
| | | | | | | | 103,988 | |
| | | | | TRUCKING & LEASING - 0.1% | | | | |
| | 217 | | | GATX Corp. | | | 17,206 | |
| | | | | | | | | |
| | | | | WATER - 0.9% | | | | |
| | 1,938 | | | American Water Works Co., Inc. | | | 224,807 | |
| | | | | | | | | |
| | | | | TOTAL COMMON STOCKS (Cost - $21,904,102) | | | 24,184,302 | |
| | | | | | | | | |
| | | | | SHORT-TERM INVESTMENT - 1.9% | | | | |
| | | | | MONEY MARKET FUND - 1.9% | | | | |
| | 460,579 | | | Fidelity Investments Money Market Funds - Government Portfolio, Institutional Class to yield 2.25% (a) (Cost - $460,579) | | | 460,579 | |
| | | | | | | | | |
| | | | | TOTAL INVESTMENTS - 99.1% (Cost - $22,364,681) | | $ | 24,644,881 | |
| | | | | OTHER ASSETS LESS LIABILITIES - NET - 0.9% | | | 220,072 | |
| | | | | TOTAL NET ASSETS - 100.0% | | $ | 24,864,953 | |
| * | Non-income producing security. |
| ^ | Represents less than 0.05% |
| (a) | Money market rate shown represents the rate at June 30, 2019. |
| | PLC - Public Limited Company |
| | REIT - Real Estate Investment Trust |
See accompanying notes to financial statements.
Global Atlantic BlackRock Disciplined U.S. Core Portfolio
PORTFOLIO OF INVESTMENTS (Continued)
June 30, 2019 (Unaudited)
| Description | | Counterparty | | Contracts | | Expiration Date | | Notional Value | | | Unrealized Appreciation | |
| LONG | | | | | | | | | | | | | | |
| S&P 500 E-mini Future | | Goldman Sachs | | 4 | | Sep-19 | | $ | 588,840 | | | $ | 7,946 | |
| NET UNREALIZED APPRECIATION ON FUTURES CONTRACTS | | | | 7,946 | |
| | | | | | | | | | | | | | | |
See accompanying notes to financial statements.
Global Atlantic BlackRock Disciplined Value Portfolio
PORTFOLIO OF INVESTMENTS
June 30, 2019 (Unaudited)
| Shares | | | | | Value | |
| | | | | COMMON STOCKS - 98.5% | | | | |
| | | | | ADVERTISING - 0.6% | | | | |
| | 78,334 | | | Interpublic Group of Cos, Inc. | | $ | 1,769,565 | |
| | | | | | | | | |
| | | | | AEROSPACE/DEFENSE - 1.0% | | | | |
| | 4,960 | | | L3Harris Technologies, Inc. * | | | 938,085 | |
| | 3,021 | | | Lockheed Martin Corp. | | | 1,098,254 | |
| | 2,763 | | | Raytheon Co. | | | 480,430 | |
| | 562 | | | Teledyne Technologies, Inc. * | | | 153,915 | |
| �� | 662 | | | United Technologies Corp. | | | 86,192 | |
| | | | | | | | 2,756,876 | |
| | | | | AGRICULTURE - 1.6% | | | | |
| | 47,051 | | | Archer-Daniels-Midland Co. | | | 1,919,681 | |
| | 32,803 | | | Philip Morris International, Inc. | | | 2,576,020 | |
| | | | | | | | 4,495,701 | |
| | | | | AIRLINES - 0.2% | | | | |
| | 3,999 | | | Delta Air Lines, Inc. | | | 226,943 | |
| | 1,961 | | | Southwest Airlines Co. | | | 99,580 | |
| | | | | | | | 326,523 | |
| | | | | APPAREL - 0.0% ^ | | | | |
| | 671 | | | Kontoor Brands, Inc. * | | | 18,801 | |
| | | | | | | | | |
| | | | | AUTO MANUFACTURERS - 1.3% | | | | |
| | 49,241 | | | PACCAR, Inc. | | | 3,528,610 | |
| | | | | | | | | |
| | | | | AUTO PARTS & EQUIPMENT - 0.6% | | | | |
| | 28,978 | | | Dana, Inc. | | | 577,821 | |
| | 52,798 | | | Goodyear Tire & Rubber Co. | | | 807,809 | |
| | 2,555 | | | Lear Corp. | | | 355,835 | |
| | | | | | | | 1,741,465 | |
| | | | | BANKS - 11.4% | | | | |
| | 23,031 | | | Associated Banc-Corp. | | | 486,875 | |
| | 155,412 | | | Bank of America Corp. | | | 4,506,948 | |
| | 4,034 | | | Bank of New York Mellon Corp. | | | 178,101 | |
| | 23,803 | | | Citigroup, Inc. | | | 1,666,924 | |
| | 69,493 | | | Citizens Financial Group, Inc. | | | 2,457,272 | |
| | 661 | | | Comerica, Inc. | | | 48,015 | |
| | 620 | | | Cullen/Frost Bankers, Inc. | | | 58,069 | |
| | 11,056 | | | East West Bancorp, Inc. | | | 517,089 | |
| | 11,023 | | | First Republic Bank | | | 1,076,396 | |
| | 83,027 | | | JPMorgan Chase & Co. | | | 9,282,419 | |
| | 69,125 | | | Morgan Stanley | | | 3,028,366 | |
| | 54,609 | | | Regions Financial Corp. | | | 815,858 | |
| | 15,574 | | | State Street Corp. | | | 873,078 | |
| | 9,091 | | | SunTrust Banks, Inc. | | | 571,369 | |
| | 3,958 | | | US Bancorp | | | 65,663 | |
| | 73,371 | | | Wells Fargo & Co. | | | 3,471,916 | |
| | 30,415 | | | Western Alliance Bancorp * | | | 1,360,159 | |
See accompanying notes to financial statements.
Global Atlantic BlackRock Disciplined Value Portfolio
PORTFOLIO OF INVESTMENTS (Continued)
June 30, 2019 (Unaudited)
| Shares | | | | | Value | |
| | | | | BANKS (Continued) - 11.4% | | | | |
| | 20,740 | | | Zions Bancorp NA | | $ | 953,625 | |
| | | | | | | | 31,418,142 | |
| | | | | BEVERAGES - 0.3% | | | | |
| | 3,540 | | | Molson Coors Brewing Co. | | | 198,240 | |
| | 4,775 | | | Monster Beverage Corp. * | | | 304,788 | |
| | 3,091 | | | PepsiCo, Inc. | | | 405,323 | |
| | | | | | | | 908,351 | |
| | | | | BIOTECHNOLOGY - 1.6% | | | | |
| | 9,600 | | | Amgen, Inc. | | | 1,769,088 | |
| | 724 | | | Corteva, Inc. * | | | 21,409 | |
| | 29,841 | | | Gilead Sciences, Inc. | | | 2,016,058 | |
| | 1,670 | | | Regeneron Pharmaceuticals, Inc. * | | | 522,710 | |
| | 1,272 | | | United Therapeutics Corp. * | | | 99,292 | |
| | | | | | | | 4,428,557 | |
| | | | | BUILDING MATERIALS - 0.1% | | | | |
| | 5,479 | | | MDU Resources Group, Inc. | | | 141,358 | |
| | | | | | | | | |
| | | | | CHEMICALS - 3.0% | | | | |
| | 8,635 | | | Air Products & Chemicals, Inc. | | | 1,954,705 | |
| | 34,324 | | | Dow, Inc. | | | 1,692,516 | |
| | 19,056 | | | DuPont de Nemours, Inc. | | | 1,430,534 | |
| | 5,256 | | | Ecolab, Inc. | | | 1,037,745 | |
| | 22,493 | | | LyondellBasell Industries NV | | | 1,937,322 | |
| | 3,769 | | | Mosaic Co. | | | 94,338 | |
| | | | | | | | 8,147,160 | |
| | | | | COMMERCIAL SERVICES - 1.0% | | | | |
| | 1,979 | | | Automatic Data Processing, Inc. | | | 327,188 | |
| | 11 | | | Booz Allen Hamilton Holding Corp. | | | 728 | |
| | 733 | | | CoStar Group, Inc. * | | | 406,126 | |
| | 6,032 | | | H&R Block, Inc. | | | 176,738 | |
| | 9,249 | | | Insperity, Inc. | | | 1,129,673 | |
| | 2,867 | | | Square, Inc. * | | | 207,944 | |
| | 5,653 | | | TriNet Group, Inc. * | | | 383,273 | |
| | 1,308 | | | Worldpay, Inc. * | | | 160,295 | |
| | | | | | | | 2,791,965 | |
| | | | | COMPUTERS - 1.0% | | | | |
| | 6,288 | | | Amdocs Ltd. | | | 390,422 | |
| | 9,146 | | | Dell Technologies, Inc. - Class C * | | | 464,617 | |
| | 50,535 | | | HP, Inc. | | | 1,050,623 | |
| | 5,645 | | | International Business Machines Corp. | | | 778,446 | |
| | | | | | | | 2,684,108 | |
| | | | | COSMETICS/PERSONAL CARE - 1.9% | | | | |
| | 14,095 | | | Colgate-Palmolive Co. | | | 1,010,189 | |
| | 38,588 | | | Proctor & Gamble Co. | | | 4,231,174 | |
| | | | | | | | 5,241,363 | |
| | | | | DISTRIBUTION/WHOLESALE - 0.2% | | | | |
| | 1,768 | | | WW Grainger, Inc. | | | 474,231 | |
See accompanying notes to financial statements.
Global Atlantic BlackRock Disciplined Value Portfolio
PORTFOLIO OF INVESTMENTS (Continued)
June 30, 2019 (Unaudited)
| Shares | | | | | Value | |
| | | | | DIVERSIFIED FINANCIAL SERVICES - 3.6% | | | | |
| | 19,023 | | | Ally Financial, Inc. | | $ | 589,523 | |
| | 10,758 | | | American Express, Co. | | | 1,327,968 | |
| | 15,720 | | | Capital One Financial Corp. | | | 1,426,433 | |
| | 63,210 | | | Charles Schwab Corp. | | | 2,540,410 | |
| | 23,108 | | | Discover Financial Services | | | 1,792,950 | |
| | 3,125 | | | Evercore. Inc. | | | 276,781 | |
| | 18,221 | | | Franklin Resources, Inc. | | | 634,091 | |
| | 6,168 | | | OneMain Holdings, Inc. | | | 208,540 | |
| | 16,460 | | | Synchrony Financial | | | 570,668 | |
| | 9,148 | | | TD Ameritrade Holding Corp. | | | 456,668 | |
| | | | | | | | 9,824,032 | |
| | | | | ELECTRIC - 5.6% | | | | |
| | 49,140 | | | Alliant Energy Corp. | | | 2,411,791 | |
| | 10,953 | | | Avista Corp. | | | 488,504 | |
| | 9,572 | | | Black Hills Corp. | | | 748,243 | |
| | 30,923 | | | Consolidated Edison, Inc. | | | 2,711,329 | |
| | 10,158 | | | Dominion Energy, Inc. | | | 785,417 | |
| | 17,226 | | | DTE Energy Co. | | | 2,202,861 | |
| | 23,327 | | | Evergy, Inc. | | | 1,403,119 | |
| | 10,066 | | | IDACORP, Inc. | | | 1,010,928 | |
| | 912 | | | NorthWestern Corp. | | | 65,801 | |
| | 15,191 | | | Pinnacle West Capital Corp. | | | 1,429,321 | |
| | 36,876 | | | Xcel Energy, Inc. | | | 2,193,753 | |
| | | | | | | | 15,451,067 | |
| | | | | ELECTRICAL COMPONENTS & EQUIPMENT - 0.4% | | | | |
| | 2,085 | | | AMETEK, Inc. | | | 189,401 | |
| | 4,100 | | | Generac Holdings, Inc. * | | | 284,581 | |
| | 5,282 | | | Hubbell, Inc. | | | 688,773 | |
| | | | | | | | 1,162,755 | |
| | | | | ELECTRONICS - 1.8% | | | | |
| | 51,498 | | | ADT, Inc. | | | 315,168 | |
| | 14,006 | | | Allegion PLC | | | 1,548,363 | |
| | 3,113 | | | Fortive Corp. | | | 253,772 | |
| | 9,149 | | | Honeywell International, Inc. | | | 1,597,324 | |
| | 1,156 | | | Jabil, Inc. | | | 36,530 | |
| | 29,707 | | | National Instruments Corp. | | | 1,247,397 | |
| | 4,472 | | | Resideo Technologies, Inc. * | | | 98,026 | |
| | | | | | | | 5,096,580 | |
| | | | | ENGINEERING & CONSTRUCTION - 0.1% | | | | |
| | 1,657 | | | frontdoor, Inc. * | | | 72,162 | |
| | 1,408 | | | MasTec, Inc. * | | | 72,555 | |
| | | | | | | | 144,717 | |
| | | | | ENTERTAINMENT - 0.2% | | | | |
| | 1,187 | | | Cinemark Holdings, Inc. | | | 42,851 | |
| | 29,385 | | | International Game Technology PLC | | | 381,123 | |
| | | | | | | | 423,974 | |
See accompanying notes to financial statements.
Global Atlantic BlackRock Disciplined Value Portfolio
PORTFOLIO OF INVESTMENTS (Continued)
June 30, 2019 (Unaudited)
| Shares | | | | | Value | |
| | | | | ENVIRONMENTAL CONTROL - 0.5% | | | | |
| | 1,117 | | | Republic Services, Inc. | | $ | 96,777 | |
| | 3,703 | | | Waste Connections, Inc. | | | 353,933 | |
| | 8,157 | | | Waste Management, Inc. | | | 941,073 | |
| | | | | | | | 1,391,783 | |
| | | | | FOOD - 2.0% | | | | |
| | 38,218 | | | General Mills, Inc. | | | 2,007,209 | |
| | 9,995 | | | Hershey Co. | | | 1,339,630 | |
| | 7,941 | | | JM Smucker Co. | | | 914,724 | |
| | 7,736 | | | Kroger Co. | | | 167,949 | |
| | 2,400 | | | Lamb Weston Holdings, Inc. | | | 152,064 | |
| | 3,112 | | | McCormick & Co., Inc. | | | 482,391 | |
| | 9,677 | | | Performance Food Group Co. * | | | 387,370 | |
| | | | | | | | 5,451,337 | |
| | | | | GAS - 0.4% | | | | |
| | 9,301 | | | Southwest Gas Holdings, Inc. | | | 833,556 | |
| | 7,440 | | | UGI Corp. | | | 397,370 | |
| | | | | | | | 1,230,926 | |
| | | | | HAND/MACHINE TOOLS - 0.4% | | | | |
| | 7,356 | | | Snap-on, Inc. | | | 1,218,448 | |
| | | | | | | | | |
| | | | | HEALTHCARE PRODUCTS - 3.1% | | | | |
| | 11,796 | | | Danaher Corp. | | | 1,685,884 | |
| | 4,670 | | | Hill-Rom Holdings, Inc. | | | 488,575 | |
| | 49,347 | | | Medtronic PLC | | | 4,805,904 | |
| | 3,287 | | | Stryker Corp. | | | 675,741 | |
| | 3,429 | | | Thermo Fisher Scientific, Inc. | | | 1,007,030 | |
| | | | | | | | 8,663,134 | |
| | | | | HEALTHCARE - SERVICES - 0.7% | | | | |
| | 7,018 | | | Anthem, Inc. | | | 1,980,550 | |
| | | | | | | | | |
| | | | | HOME BUILDERS - 0.2% | | | | |
| | 5,629 | | | DR Horton, Inc. | | | 242,779 | |
| | 6,703 | | | Thor Industries, Inc. | | | 391,790 | |
| | | | | | | | 634,569 | |
| | | | | HOUSEHOLD PRODUCTS/WARES - 0.5% | | | | |
| | 12,788 | | | Church & Dwight Co., Inc. | | | 934,291 | |
| | 4,011 | | | Kimberly-Clark Corp. | | | 534,586 | |
| | | | | | | | 1,468,877 | |
| | | | | INSURANCE - 8.7% | | | | |
| | 21,516 | | | Allstate Corp. | | | 2,187,962 | |
| | 6,702 | | | American Financial Group, Inc. | | | 686,754 | |
| | 11,341 | | | Arthur J. Gallagher & Co. | | | 993,358 | |
| | 37,419 | | | Berkshire Hathaway, Inc. * | | | 7,976,608 | |
| | 12,755 | | | Cincinnati Financial Corp. | | | 1,322,311 | |
| | 17,356 | | | First American Financial Corp. | | | 932,017 | |
| | 18,102 | | | Lincoln National Corp. | | | 1,166,674 | |
| | 35,058 | | | Loews Corp. | | | 1,916,621 | |
See accompanying notes to financial statements.
Global Atlantic BlackRock Disciplined Value Portfolio
PORTFOLIO OF INVESTMENTS (Continued)
June 30, 2019 (Unaudited)
| Shares | | | | | Value | |
| | | | | INSURANCE (Continued) - 8.7% | | | | |
| | 25,070 | | | MetLife, Inc. | | $ | 1,245,227 | |
| | 37,815 | | | Prudential Financial, Inc. | | | 3,819,315 | |
| | 7,472 | | | Travelers Cos, Inc. | | | 1,117,213 | |
| | 20,307 | | | Unum Group | | | 681,300 | |
| | | | | | | | 24,045,360 | |
| | | | | INTERNET - 0.8% | | | | |
| | 75 | | | Amazon.com, Inc. * | | | 142,022 | |
| | 3,712 | | | CDW Corp. | | | 412,032 | |
| | 489 | | | Etsy, Inc. * | | | 30,010 | |
| | 923 | | | Facebook, Inc. * | | | 178,139 | |
| | 8,617 | | | GoDaddy, Inc. * | | | 604,483 | |
| | 3,913 | | | Lyft, Inc. * | | | 257,123 | |
| | 4,951 | | | Pinterest, Inc. * | | | 134,766 | |
| | 6,827 | | | Uber Technologies, Inc. * | | | 316,636 | |
| | | | | | | | 2,075,211 | |
| | | | | IRON/STEEL - 0.1% | | | | |
| | 1,740 | | | Reliance Steel & Aluminum Co. | | | 164,639 | |
| | 974 | | | Steel Dynamics, Inc. | | | 29,415 | |
| | | | | | | | 194,054 | |
| | | | | LEISURE TIME - 0.4% | | | | |
| | 6,667 | | | Norwegian Cruise Line Holdings Ltd. * | | | 357,551 | |
| | 6,147 | | | Royal Caribbean Cruises Ltd. | | | 745,078 | |
| | | | | | | | 1,102,629 | |
| | | | | LODGING - 0.8% | | | | |
| | 75,280 | | | Extended Stay America, Inc. | | | 1,271,479 | |
| | 14,084 | | | Las Vegas Sands Corp. | | | 832,224 | |
| | | | | | | | 2,103,703 | |
| | | | | MACHINERY - CONSTRUCTION & MINING - 0.3% | | | | |
| | 11,221 | | | Oshkosh Corp. | | | 936,841 | |
| | | | | | | | | |
| | | | | MACHINERY - DIVERSIFIED - 2.4% | | | | |
| | 1,087 | | | AGCO Corp. | | | 84,319 | |
| | 30,478 | | | Crane Co. | | | 2,543,084 | |
| | 6,274 | | | Cummins, Inc. | | | 1,074,987 | |
| | 6,301 | | | Curtiss-Wright Corp. | | | 801,046 | |
| | 1,477 | | | IDEX Corp. | | | 254,251 | |
| | 7,109 | | | Rockwell Automation, Inc. | | | 1,164,667 | |
| | 1,672 | | | Roper Technologies, Inc. | | | 612,387 | |
| | | | | | | | 6,534,741 | |
| | | | | MEDIA - 3.2% | | | | |
| | 1,508 | | | CBS Corp. | | | 75,249 | |
| | 111,118 | | | Comcast Corp. | | | 4,698,069 | |
| | 1,524 | | | Discovery, Inc. * | | | 46,787 | |
| | 7,659 | | | Fox Corp. - Class A | | | 280,626 | |
| | 6,417 | | | Fox Corp. - Class C | | | 234,413 | |
| | 7,033 | | | Liberty Media Corp-Liberty SiriusXM - Class A * | | | 265,918 | |
| | 3,677 | | | Sinclair Broadcast Group, Inc. | | | 197,198 | |
See accompanying notes to financial statements.
Global Atlantic BlackRock Disciplined Value Portfolio
PORTFOLIO OF INVESTMENTS (Continued)
June 30, 2019 (Unaudited)
| Shares | | | | | Value | |
| | | | | MEDIA (Continued) - 3.2% | | | | |
| | 13,943 | | | Sirius XM Holdings, Inc. | | | 77,802 | |
| | 1,773 | | | Tribune Media Co. | | | 81,948 | |
| | 3,260 | | | Viacom, Inc. - Class A | | | 111,166 | |
| | 25,978 | | | Viacom, Inc. - Class C | | | 775,963 | |
| | 13,920 | | | Walt Disney Co. | | | 1,943,789 | |
| | | | | | | | 8,788,928 | |
| | | | | MINING - 0.4% | | | | |
| | 28,762 | | | Newmont Mining Corp. | | | 1,106,474 | |
| | | | | | | | | |
| | | | | MISCELLANEOUS MANUFACTURER - 0.3% | | | | |
| | 9,325 | | | AO Smith Corp. | | | 439,767 | |
| | 44,262 | | | General Electric Co. | | | 464,751 | |
| | | | | | | | 904,518 | |
| | | | | OIL & GAS - 6.4% | | | | |
| | 6,781 | | | Anadarko Petroleum Corp. | | | 478,467 | |
| | 9,138 | | | Antero Resources Corp. * | | | 50,533 | |
| | 13,305 | | | Cabot Oil & Gas Corp. | | | 305,483 | |
| | 37,835 | | | Chevron Corp. | | | 4,708,187 | |
| | 57,139 | | | ConocoPhillips | | | 3,485,479 | |
| | 7,154 | | | Encana Corp. | | | 36,700 | |
| | 18,153 | | | EOG Resources, Inc. | | | 1,691,133 | |
| | 62,096 | | | Exxon Mobil Corp. | | | 4,758,416 | |
| | 2,047 | | | Helmerich & Payne, Inc. | | | 103,619 | |
| | 31,360 | | | Marathon Oil Corp. | | | 445,626 | |
| | 58,095 | | | Nabors Industries Ltd. | | | 168,476 | |
| | 5,281 | | | Phillips 66 | | | 493,985 | |
| | 51,446 | | | Transocean Ltd. * | | | 329,769 | |
| | 7,321 | | | Valero Energy Corp. | | | 626,751 | |
| | | | | | | | 17,682,624 | |
| | | | | OIL & GAS SERVICES - 1.0% | | | | |
| | 43,987 | | | Halliburton Co. | | | 1,000,264 | |
| | 24,736 | | | National Oilwell Varco, Inc. | | | 549,881 | |
| | 32,706 | | | Schlumberger Ltd. | | | 1,299,737 | |
| | | | | | | | 2,849,882 | |
| | | | | PACKAGING & CONTAINERS - 0.8% | | | | |
| | 1 | | | Amcor PLC * | | | 9 | |
| | 56,794 | | | Westrock Co. | | | 2,071,277 | |
| | | | | | | | 2,071,286 | |
| | | | | PHARMACEUTICALS - 8.1% | | | | |
| | 6,392 | | | AbbVie, Inc. | | | 464,826 | |
| | 5,321 | | | AmerisourceBergen Corp. | | | 453,668 | |
| | 30,648 | | | Bristol-Myers Squibb Co. | | | 1,389,887 | |
| | 6,638 | | | Cigna Corp. | | | 1,045,817 | |
| | 37,111 | | | CVS Health Corp. | | | 2,022,178 | |
| | 1,102 | | | DexCom, Inc. * | | | 165,124 | |
| | 2,624 | | | Eli Lilly & Co. | | | 290,713 | |
| | 13,107 | | | Herbalife Nutrition Ltd. * | | | 560,455 | |
See accompanying notes to financial statements.
Global Atlantic BlackRock Disciplined Value Portfolio
PORTFOLIO OF INVESTMENTS (Continued)
June 30, 2019 (Unaudited)
| Shares | | | | | Value | |
| | | | | PHARMACEUTICALS (Continued) - 8.1% | | | | |
| | 2,209 | | | Jazz Pharmaceuticals PLC * | | $ | 314,915 | |
| | 62,195 | | | Johnson & Johnson | | | 8,662,520 | |
| | 6,510 | | | McKesson Corp. | | | 874,879 | |
| | 38,075 | | | Merk & Co., Inc. | | | 3,192,589 | |
| | 68,129 | | | Pfizer, Inc. | | | 2,951,348 | |
| | | | | | | | 22,388,919 | |
| | | | | PIPELINES - 0.7% | | | | |
| | 7,913 | | | Antero Midstream Corp. | | | 90,683 | |
| | 38,951 | | | Kinder Morgan, Inc. | | | 813,297 | |
| | 41,309 | | | Williams Cos, Inc. | | | 1,158,304 | |
| | | | | | | | 2,062,284 | |
| | | | | REAL ESTATE INVESTMENT TRUSTS - 0.1% | | | | |
| | 1,489 | | | CBRE Group, Inc. * | | | 76,386 | |
| | | | | | | | | |
| | | | | REAL ESTATE INVESTMENT TRUSTS - 4.6% | | | | |
| | 1,981 | | | Alexandria Real Estate Equities, Inc. | | | 279,499 | |
| | 2,758 | | | Apartment Investment & Management Co. | | | 138,231 | |
| | 2,406 | | | Apple Hospitality REIT, Inc. | | | 38,159 | |
| | 5,815 | | | Boston Properties, Inc. | | | 750,135 | |
| | 11,028 | | | Equity LifeStyle Properties, Inc. | | | 1,338,138 | |
| | 26,492 | | | Outfront Media, Inc. | | | 683,229 | |
| | 48,843 | | | Park Hotels & Resorts, Inc. | | | 1,346,113 | |
| | 42,073 | | | Prologis, Inc. | | | 3,370,047 | |
| | 10,013 | | | Realty Income Corp. | | | 690,597 | |
| | 59,803 | | | RLJ Lodging Trust | | | 1,060,905 | |
| | 7,526 | | | Ryman Hospitality Properties, Inc. | | | 610,283 | |
| | 15,022 | | | Simon Property Group, Inc. | | | 2,399,915 | |
| | 3 | | | Weingarten Realty Investors | | | 82 | |
| | | | | | | | 12,705,333 | |
| | | | | RETAIL - 3.5% | | | | |
| | 3,911 | | | Advance Auto Parts, Inc. | | | 602,842 | |
| | 17,201 | | | Darden Restaurants, Inc. | | | 2,093,878 | |
| | 559 | | | Domino’s Pizza, Inc. | | | 155,559 | |
| | 2,330 | | | Lululemon Athletica, Inc. * | | | 419,889 | |
| | 8,680 | | | McDonald’s Corp. | | | 1,802,489 | |
| | 2,379 | | | Nu Skin Enterprises, Inc. | | | 117,332 | |
| | 3,682 | | | Penske Automotive Group, Inc. | | | 174,159 | |
| | 18,187 | | | Target Corp. | | | 1,575,176 | |
| | 23,548 | | | Walmart, Inc. | | | 2,601,819 | |
| | 1,551 | | | Yum! Brands, Inc. | | | 171,649 | |
| | | | | | | | 9,714,792 | |
| | | | | SEMICONDUCTORS - 2.2% | | | | |
| | 1,876 | | | Analog Devices, Inc. | | | 211,744 | |
| | 1,918 | | | Broadcom, Inc. | | | 552,115 | |
| | 6,928 | | | CirrusLogic, Inc. * | | | 302,754 | |
| | 77,186 | | | Intel Corp. | | | 3,694,894 | |
| | 7,740 | | | NXP Semiconductors NV | | | 755,501 | |
See accompanying notes to financial statements.
Global Atlantic BlackRock Disciplined Value Portfolio
PORTFOLIO OF INVESTMENTS (Continued)
June 30, 2019 (Unaudited)
| Shares | | | | | Value | |
| | | | | SEMICONDUCTORS (Continued) - 2.2% | | | | |
| | 3,875 | | | QUALCOMM, Inc. | | $ | 294,771 | |
| | 1,502 | | | Xilinx, Inc. | | | 177,117 | |
| | | | | | | | 5,988,896 | |
| | | | | SOFTWARE - 2.4% | | | | |
| | 3,315 | | | Activision Blizzard, Inc. | | | 156,468 | |
| | 6,809 | | | Dropbox, Inc. * | | | 170,565 | |
| | 21,049 | | | Fidelity National Information Services, Inc. | | | 2,582,291 | |
| | 2,611 | | | Intuit, Inc. | | | 682,333 | |
| | 5,904 | | | Paychex, Inc. | | | 485,840 | |
| | 7,992 | | | salesforce.com, Inc. * | | | 1,212,626 | |
| | 1,737 | | | ServiceNow, Inc. * | | | 476,928 | |
| | 3,255 | | | Veeva Systems, Inc. * | | | 527,668 | |
| | 714 | | | Workday, Inc. * | | | 146,784 | |
| | 35,895 | | | Zynga, Inc. * | | | 220,037 | |
| | | | | | | | 6,661,540 | |
| | | | | TELECOMMUNICATIONS - 4.1% | | | | |
| | 105,803 | | | AT&T, Inc. | | | 3,545,459 | |
| | 5,143 | | | Ciena Corp. * | | | 211,532 | |
| | 17,713 | | | Cisco Systems, Inc. | | | 969,432 | |
| | 7,240 | | | Corning, Inc. | | | 240,585 | |
| | 3,860 | | | United States Cellular Corp. * | | | 172,426 | |
| | 109,547 | | | Verizon Communications, Inc. | | | 6,258,420 | |
| | | | | | | | 11,397,854 | |
| | | | | TRANSPORTATION - 0.5% | | | | |
| | 2,472 | | | Landstar System, Inc. | | | 266,951 | |
| | 19,370 | | | Ryder System, Inc. | | | 1,129,273 | |
| | | | | | | | 1,396,224 | |
| | | | | TRUCKING & LEASING - 0.2% | | | | |
| | 3,796 | | | GATX Corp. | | | 300,985 | |
| | | | | | | | | |
| | | | | WATER - 1.2% | | | | |
| | 28,370 | | | American Water Works Co., Inc. | | | 3,290,920 | |
| | | | | | | | | |
| | | | | TOTAL COMMON STOCKS (Cost - $255,303,896) | | | 271,395,909 | |
| | | | | | | | | |
| | | | | SHORT-TERM INVESTMENT - 1.2% | | | | |
| | | | | MONEY MARKET FUND - 1.2% | | | | |
| | 3,331,104 | | | Fidelity Investments Money Market Funds - Government Portfolio, Institutional Class to yield 2.25% (a)(Cost - $3,331,104) | | | 3,331,104 | |
| | | | | | | | | |
| | | | | TOTAL INVESTMENTS - 99.7% (Cost - $258,635,000) | | $ | 274,727,013 | |
| | | | | OTHER ASSETS LESS LIABILITIES - NET - 0.3% | | | 827,210 | |
| | | | | TOTAL NET ASSETS - 100.0% | | $ | 275,554,223 | |
| * | Non-income producing security. |
| (a) | Money market rate shown represents the rate at June 30, 2019. |
| | PLC - Public Limited Company |
| | REIT - Real Estate Investment Trust |
See accompanying notes to financial statements.
Global Atlantic BlackRock Disciplined Value Portfolio
PORTFOLIO OF INVESTMENTS (Continued)
June 30, 2019 (Unaudited)
| Description | | Counterparty | | Contracts | | Expiration Date | | Notional Value | | | Unrealized Appreciation | |
| LONG | | | | | | | | | | | | |
| S&P 500 E-mini Future | | Goldman Sachs | | 31 | | Sep-19 | | $ | 4,563,510 | | | $ | 60,379 | |
| NET UNREALIZED APPRECIATION ON FUTURES CONTRACTS | | | | 60,379 | |
See accompanying notes to financial statements.
Global Atlantic BlackRock High Yield Portfolio
PORTFOLIO OF INVESTMENTS
June 30, 2019 (Unaudited)
| Principal Amount | | | | | Coupon Rate (%) | | Maturity | | Value | |
| | | | | CORPORATE BONDS & NOTES - 96.3% | | | | | | | | |
| | | | | ADVERTISING - 0.1% | | | | | | | | |
| $ | 45,000 | | | Outfront Media Capital LLC / Outfront Media Capital Corp. (a) | | 5.00 | | 8/15/2027 | | $ | 46,067 | |
| | | | | | | | | | | | | |
| | | | | AEROSPACE/DEFENSE - 2.3% | | | | | | | | |
| | 300,000 | | | Arconic, Inc. | | 5.90 | | 2/1/2027 | | | 326,640 | |
| | 60,000 | | | BBA US Holdings, Inc. (a) | | 5.38 | | 5/1/2026 | | | 62,250 | |
| | 200,000 | | | Bombardier, Inc. (a) | | 8.75 | | 12/1/2021 | | | 218,000 | |
| | 40,000 | | | Kratos Defense & Security Solutions, Inc. (a) | | 6.50 | | 11/30/2025 | | | 43,000 | |
| | 100,000 | | | TransDigm, Inc. (a) | | 6.25 | | 3/15/2026 | | | 105,250 | |
| | 250,000 | | | TransDigm, Inc. | | 6.38 | | 6/15/2026 | | | 251,875 | |
| | 200,000 | | | TransDigm, Inc. | | 6.50 | | 7/15/2024 | | | 202,250 | |
| | 250,000 | | | TransDigm, Inc. (a) | | 7.50 | | 3/15/2027 | | | 260,938 | |
| | 200,000 | | | TransDigm UK Holdings PLC | | 6.88 | | 5/15/2026 | | | 202,375 | |
| | | | | | | | | | | | 1,672,578 | |
| | | | | AGRICULTURE - 0.6% | | | | | | | | |
| | 450,000 | | | Vector Group, Ltd. (a) | | 6.13 | | 2/1/2025 | | | 417,051 | |
| | | | | | | | | | | | | |
| | | | | AUTO MANUFACTURERS - 1.2% | | | | | | | | |
| | 400,000 | | | Allison Transmission, Inc. (a) | | 4.75 | | 10/1/2027 | | | 397,000 | |
| | 250,000 | | | BCD Acquisition, Inc. (a) | | 9.63 | | 9/15/2023 | | | 262,187 | |
| | 150,000 | | | Jaguar Land Rover Automotive PLC (a) | | 5.63 | | 2/1/2023 | | | 147,000 | |
| | 50,000 | | | JB Poindexter & Co., Inc. (a) | | 7.13 | | 4/15/2026 | | | 51,000 | |
| | | | | | | | | | | | 857,187 | |
| | | | | AUTO PARTS & EQUIPMENT - 0.8% | | | | | | | | |
| | 113,000 | | | Adient US LLC (a) | | 7.00 | | 5/15/2026 | | | 116,107 | |
| | 100,000 | | | American Axle & Manufacturing, Inc. | | 6.25 | | 4/1/2025 | | | 99,500 | |
| | 200,000 | | | IHO Verwaltungs GmbH (a,b) | | 4.75 | | 9/15/2026 | | | 194,750 | |
| | 45,000 | | | Panther BF Aggregator 2 LP / Panther Finance Co., Inc. (a) | | 6.25 | | 5/15/2026 | | | 46,744 | |
| | 15,000 | | | Panther BF Aggregator 2 LP / Panther Finance Co., Inc. (a) | | 8.50 | | 5/15/2027 | | | 15,450 | |
| | 100,000 | | | Tenneco, Inc. | | 5.00 | | 7/15/2026 | | | 80,500 | |
| | 69,000 | | | Titan International, Inc. | | 6.50 | | 11/30/2023 | | | 59,858 | |
| | | | | | | | | | | | 612,909 | |
| | | | | BANKS - 0.4% | | | | | | | | |
| | 100,000 | | | CIT Group, Inc. | | 5.00 | | 8/15/2022 | | | 106,107 | |
| | 95,000 | | | Freedom Mortgage Corp. (a) | | 8.25 | | 4/15/2025 | | | 81,700 | |
| | 150,000 | | | Provident Funding Associates LP / PFG Finance Corp. (a) | | 6.38 | | 6/15/2025 | | | 141,000 | |
| | | | | | | | | | | | 328,807 | |
| | | | | BUILDING MATERIALS - 0.7% | | | | | | | | |
| | 75,000 | | | Builders FirstSource, Inc. (a) | | 6.75 | | 6/1/2027 | | | 79,125 | |
| | 100,000 | | | Griffon Corp. | | 5.25 | | 3/1/2022 | | | 99,500 | |
| | 45,000 | | | Norbord, Inc. (a) | | 5.75 | | 7/15/2027 | | | 45,281 | |
| | 50,000 | | | PGT Escrow Issuer, Inc. (a) | | 6.75 | | 8/1/2026 | | | 52,813 | |
| | 100,000 | | | Standard Industries, Inc. (a) | | 5.38 | | 11/15/2024 | | | 103,500 | |
| | 100,000 | | | Summit Materials LLC / Summit Materials Finance Corp. (a) | | 5.13 | | 6/1/2025 | | | 100,250 | |
| | 30,000 | | | Summit Materials LLC / Summit Materials Finance Corp. (a) | | 6.50 | | 3/15/2027 | | | 31,200 | |
| | | | | | | | | | | | 511,669 | |
| | | | | CHEMICALS - 3.0% | | | | | | | | |
| | 100,000 | | | Cornerstone Chemical Co. (a) | | 6.75 | | 8/15/2024 | | | 93,750 | |
| | 350,000 | | | CVR Partners LP / CVR Nitrogen Finance Corp. (a) | | 9.25 | | 6/15/2023 | | | 365,995 | |
| | 200,000 | | | INEOS Group Holdings SA (a) | | 5.63 | | 8/1/2024 | | | 204,000 | |
| | 25,000 | | | Ingevity Corp. (a) | | 4.50 | | 2/1/2026 | | | 24,250 | |
| | 350,000 | | | NOVA Chemicals Corp. (a) | | 4.88 | | 6/1/2024 | | | 362,250 | |
| | 240,000 | | | Nufarm Australia Ltd. / Nufarm Americas, Inc. (a) | | 5.75 | | 4/30/2026 | | | 228,000 | |
| | 200,000 | | | OCI NV (a) | | 6.63 | | 4/15/2023 | | | 208,000 | |
| | 100,000 | | | Rain CII Carbon LLC / CII Carbon Corp. (a) | | 7.25 | | 4/1/2025 | | | 92,500 | |
| | 100,000 | | | Rayonier AM Products, Inc. (a) | | 5.50 | | 6/1/2024 | | | 85,500 | |
| | 400,000 | | | TPC Group, Inc. (a) | | 8.75 | | 12/15/2020 | | | 398,500 | |
| | 75,000 | | | Tronox Finance PLC (a) | | 5.75 | | 10/1/2025 | | | 72,750 | |
| | 100,000 | | | Valvoline, Inc. | | 4.38 | | 8/15/2025 | | | 99,750 | |
| | | | | | | | | | | | 2,235,245 | |
See accompanying notes to financial statements.
Global Atlantic BlackRock High Yield Portfolio
PORTFOLIO OF INVESTMENTS (Continued)
June 30, 2019 (Unaudited)
| Principal Amount | | | | | Coupon Rate (%) | | Maturity | | Value | |
| | | | COAL - 0.2% | | | | | | | |
| $ | 125,000 | | | SunCoke Energy Partners LP / SunCoke Energy Partners Finance Corp. (a) | | 7.50 | | 6/15/2025 | | $ | 122,031 | |
| | | | | | | | | | | | | |
| | | | | COMMERCIAL SERVICES - 2.4% | | | | | | | | |
| | 200,000 | | | Algeco Global Finance Plc (a) | | 8.00 | | 2/15/2023 | | | 202,250 | |
| | 100,000 | | | Brink’s Co. (The) (a) | | 4.63 | | 10/15/2027 | | | 99,875 | |
| | 125,000 | | | Graham Holdings Co. (a) | | 5.75 | | 6/1/2026 | | | 132,187 | |
| | 50,000 | | | Hertz Corp. (The) | | 6.25 | | 10/15/2022 | | | 50,500 | |
| | 450,000 | | | Hertz Corp. (The) (a) | | 7.63 | | 6/1/2022 | | | 467,437 | |
| | 58,000 | | | Prime Security Services Borrower LLC / Prime Finance Inc. (a) | | 9.25 | | 5/15/2023 | | | 60,912 | |
| | 145,000 | | | Refinitiv US Holdings, Inc. (a) | | 6.25 | | 5/15/2026 | | | 149,133 | |
| | 40,000 | | | Refinitiv US Holdings, Inc. (a) | | 8.25 | | 11/15/2026 | | | 41,140 | |
| | 100,000 | | | RR Donnelley & Sons Co. | | 6.50 | | 11/15/2023 | | | 98,910 | |
| | 100,000 | | | Service Corp. International | | 4.63 | | 12/15/2027 | | | 102,125 | |
| | 20,000 | | | Service Corp. International | | 5.13 | | 6/1/2029 | | | 21,050 | |
| | 150,000 | | | ServiceMaster Co LLC (The) (a) | | 5.13 | | 11/15/2024 | | | 154,313 | |
| | 125,000 | | | Sotheby’s (a) | | 4.88 | | 12/15/2025 | | | 127,031 | |
| | 70,000 | | | United Rentals North America, Inc. | | 5.25 | | 1/15/2030 | | | 71,925 | |
| | | | | | | | | | | | 1,778,788 | |
| | | | | COMPUTERS - 0.7% | | | | | | | | |
| | 500,000 | | | Dell International LLC / EMC Corp. (a) | | 7.13 | | 6/15/2024 | | | 527,864 | |
| | | | | | | | | | | | | |
| | | | | COSMETICS/PERSONAL CARE - 0.5% | | | | | | | | |
| | 70,000 | | | Avon International Capital PLC (a) | | 6.50 | | 8/15/2022 | | | 70,525 | |
| | 200,000 | | | Avon International Operations, Inc. (a) | | 7.88 | | 8/15/2022 | | | 207,500 | |
| | 100,000 | | | Coty, Inc. (a) | | 6.50 | | 4/15/2026 | | | 97,375 | |
| | | | | | | | | | | | 375,400 | |
| | | | | DISTRIBUTION/WHOLESALE - 0.5% | | | | | | | | |
| | 200,000 | | | Global Partners LP / GLP Finance Corp. | | 7.00 | | 6/15/2023 | | | 202,500 | |
| | 50,000 | | | HD Supply, Inc. (a) | | 5.38 | | 10/15/2026 | | | 52,750 | |
| | 84,000 | | | KAR Auction Services, Inc. (a) | | 5.13 | | 6/1/2025 | | | 85,470 | |
| | | | | | | | | | | | 340,720 | |
| | | | | DIVERSIFIED FINANCIAL SERVICES - 5.1% | | | | | | | | |
| | 500,000 | | | Ally Financial, Inc. | | 5.13 | | 9/30/2024 | | | 540,000 | |
| | 200,000 | | | Ally Financial, Inc. | | 5.75 | | 11/20/2025 | | | 221,230 | |
| | 245,000 | | | Credit Acceptance Corp. (a) | | 6.63 | | 3/15/2026 | | | 257,556 | |
| | 200,000 | | | goeasy Ltd. (a) | | 7.88 | | 11/1/2022 | | | 209,500 | |
| | 200,000 | | | Jefferies Finance LLC / JFIN Co-Issuer Corp. (a) | | 7.25 | | 8/15/2024 | | | 196,434 | |
| | 300,000 | | | Ladder Capital Finance Holdings LLLP / Ladder Capital Finance Corp. (a) | | 5.25 | | 10/1/2025 | | | 300,750 | |
| | 525,000 | | | LPL Holdings, Inc. (a) | | 5.75 | | 9/15/2025 | | | 537,469 | |
| | 40,000 | | | Nationstar Mortgage Holdings, Inc. (a) | | 8.13 | | 7/15/2023 | | | 40,800 | |
| | 300,000 | | | Nationstar Mortgage LLC / Nationstar Capital Corp. | | 6.50 | | 7/1/2021 | | | 300,456 | |
| | 100,000 | | | Navient Corp. | | 5.50 | | 1/25/2023 | | | 102,750 | |
| | 150,000 | | | Navient Corp. | | 6.75 | | 6/15/2026 | | | 155,625 | |
| | 100,000 | | | Quicken Loans, Inc. (a) | | 5.75 | | 5/1/2025 | | | 103,125 | |
| | 100,000 | | | Springleaf Finance Corp. | | 5.63 | | 3/15/2023 | | | 106,250 | |
| | 265,000 | | | Springleaf Finance Corp. | | 6.13 | | 3/15/2024 | | | 284,875 | |
| | 45,000 | | | Springleaf Finance Corp. | | 6.63 | | 1/5/2028 | | | 47,250 | |
| | 105,000 | | | Springleaf Finance Corp. | | 6.88 | | 3/15/2025 | | | 114,973 | |
| | 100,000 | | | Springleaf Finance Corp. | | 7.13 | | 3/15/2026 | | | 109,563 | |
| | 110,000 | | | Voyager Aviation Holdings LLC / Voyager Finance Co. | | 8.50 | | 8/15/2021 | | | 111,650 | |
| | | | | | | | | | | | 3,740,256 | |
| | | | | ELECTRIC - 1.9% | | | | | | | | |
| | 180,000 | | | Calpine Corp. (a) | | 5.25 | | 6/1/2026 | | | 183,150 | |
| | 100,000 | | | Calpine Corp. | | 5.38 | | 1/15/2023 | | | 101,161 | |
| | 200,000 | | | Clearway Energy Operating LLC | | 5.00 | | 9/15/2026 | | | 196,340 | |
| | 80,000 | | | Clearway Energy Operating LLC (a) | | 5.75 | | 10/15/2025 | | | 81,200 | |
| | 200,000 | | | Drax Finco PLC (a) | | 6.63 | | 11/1/2025 | | | 204,414 | |
| | 50,000 | | | NextEra Energy Operating Partners LP (a) | | 4.25 | | 7/15/2024 | | | 50,314 | |
| | 400,000 | | | NRG Energy, Inc. | | 7.25 | | 5/15/2026 | | | 440,500 | |
| | 70,000 | | | Talen Energy Supply LLC (a) | | 6.63 | | 1/15/2028 | | | 69,563 | |
See accompanying notes to financial statements.
Global Atlantic BlackRock High Yield Portfolio
PORTFOLIO OF INVESTMENTS (Continued)
June 30, 2019 (Unaudited)
| Principal Amount | | | | | Coupon Rate (%) | | Maturity | | Value | |
| | | | | ELECTRIC - 1.9% (Continued) | | | | | | | | |
| $ | 25,000 | | | Talen Energy Supply LLC (a) | | 7.25 | | 5/15/2027 | | $ | 25,625 | |
| | 40,000 | | | Vistra Operations Co. LLC (a) | | 5.00 | | 7/31/2027 | | | 41,450 | |
| | | | | | | | | | | | 1,393,717 | |
| | | | | ELECTRICAL COMPONENTS & EQUIPMENT - 0.4% | | | | | | | | |
| | 80,000 | | | Energizer Holdings, Inc. (a) | | 6.38 | | 7/15/2026 | | | 82,200 | |
| | 20,000 | | | Energizer Holdings, Inc. (a) | | 7.75 | | 1/15/2027 | | | 21,647 | |
| | 200,000 | | | WESCO Distribution, Inc. | | 5.38 | | 6/15/2024 | | | 205,000 | |
| | | | | | | | | | | | 308,847 | |
| | | | | ELECTRONICS - 0.1% | | | | | | | | |
| | 45,000 | | | Itron, Inc. (a) | | 5.00 | | 1/15/2026 | | | 46,013 | |
| | | | | | | | | | | | | |
| | | | | ENERGY - ALTERNATE SOURCE - 0.1% | | | | | | | | |
| | 100,000 | | | TerraForm Power Operating LLC (a) | | 5.00 | | 1/31/2028 | | | 100,375 | |
| | | | | | | | | | | | | |
| | | | | ENGINEEERING & CONSTRUCTION - 0.8% | | | | | | | | |
| | 150,000 | | | AECOM | | 5.13 | | 3/15/2027 | | | 156,000 | |
| | 229,000 | | | AECOM | | 5.88 | | 10/15/2024 | | | 248,007 | |
| | 45,000 | | | Frontdoor, Inc. (a) | | 6.75 | | 8/15/2026 | | | 47,925 | |
| | 90,000 | | | New Enterprise Stone & Lime Co., Inc. (a) | | 6.25 | | 3/15/2026 | | | 91,350 | |
| | 35,000 | | | TopBuild Corp. (a) | | 5.63 | | 5/1/2026 | | | 35,788 | |
| | | | | | | | | | | | 579,070 | |
| | | | | ENTERTAINMENT - 2.0% | | | | | | | | |
| | 75,000 | | | Boyne USA, Inc. (a) | | 7.25 | | 5/1/2025 | | | 81,188 | |
| | 35,000 | | | Cedar Fair LP (a) | | 5.25 | | 7/15/2029 | | | 35,711 | |
| | 400,000 | | | Churchill Downs, Inc. (a) | | 4.75 | | 1/15/2028 | | | 401,900 | |
| | 200,000 | | | Cirsa Finance International SARL (a) | | 7.88 | | 12/20/2023 | | | 211,500 | |
| | 25,000 | | | Downstream Development Authority of the Quapaw Tribe of Oklahoma (a) | | 10.50 | | 2/15/2023 | | | 26,438 | |
| | 100,000 | | | Eldorado Resorts, Inc. | | 6.00 | | 4/1/2025 | | | 105,125 | |
| | 25,000 | | | Eldorado Resorts, Inc. | | 6.00 | | 9/15/2026 | | | 27,312 | |
| | 5,000 | | | Jacobs Entertainment, Inc. (a) | | 7.88 | | 2/1/2024 | | | 5,338 | |
| | 200,000 | | | Live Nation Entertainment, Inc. (a) | | 4.88 | | 11/1/2024 | | | 205,750 | |
| | 200,000 | | | Merlin Entertainments PLC (a) | | 5.75 | | 6/15/2026 | | | 210,500 | |
| | 100,000 | | | Six Flags Entertainment Corp. (a) | | 4.88 | | 7/31/2024 | | | 101,562 | |
| | 45,000 | | | Stars Group Holdings BV / Stars Group US Co-Borrower LLC (a) | | 7.00 | | 7/15/2026 | | | 47,587 | |
| | 40,000 | | | WMG Acquisition Corp. (a) | | 5.50 | | 4/15/2026 | | | 41,296 | |
| | | | | | | | | | | | 1,501,207 | |
| | | | | ENVIRONMENTAL CONTROL - 0.5% | | | | | | | | |
| | 200,000 | | | Advanced Disposal Services, Inc. (a) | | 5.63 | | 11/15/2024 | | | 209,250 | |
| | 110,000 | | | Tervita Escrow Corp. (a) | | 7.63 | | 12/1/2021 | | | 111,893 | |
| | 65,000 | | | Waste Pro USA, Inc. (a) | | 5.50 | | 2/15/2026 | | | 66,462 | |
| | | | | | | | | | | | 387,605 | |
| | | | | FOOD - 2.0% | | | | | | | | |
| | 200,000 | | | Albertsons Cos. LLC / Safeway, Inc. / New Albertson’s LP / Albertson’s LLC | | 6.63 | | 6/15/2024 | | | 207,250 | |
| | 10,000 | | | Albertsons Cos. LLC / Safeway, Inc. / New Albertson’s LP / Albertson’s LLC (a) | | 7.50 | | 3/15/2026 | | | 10,675 | |
| | 400,000 | | | Pilgrim’s Pride Corp. (a) | | 5.75 | | 3/15/2025 | | | 406,000 | |
| | 100,000 | | | Pilgrim’s Pride Corp. (a) | | 5.88 | | 9/30/2027 | | | 103,625 | |
| | 200,000 | | | Post Holdings, Inc. (a) | | 5.50 | | 3/1/2025 | | | 206,500 | |
| | 70,000 | | | Post Holdings, Inc. (a) | | 5.50 | | 12/15/2029 | | | 70,175 | |
| | 300,000 | | | Post Holdings, Inc. (a) | | 5.75 | | 3/1/2027 | | | 309,750 | |
| | 200,000 | | | Simmons Foods, Inc. (a) | | 5.75 | | 11/1/2024 | | | 182,000 | |
| | | | | | | | | | | | 1,495,975 | |
| | | | | FOREST PRODUCTS & PAPER - 0.3% | | | | | | | | |
| | 25,000 | | | Cascades, Inc. (a) | | 5.50 | | 7/15/2022 | | | 25,094 | |
| | 186,000 | | | Clearwater Paper Corp. (a) | | 5.38 | | 2/1/2025 | | | 168,795 | |
| | | | | | | | | | | | 193,889 | |
| | | | | GAS - 0.9% | | | | | | | | |
| | 290,000 | | | AmeriGas Partners LP / AmeriGas Finance Corp. | | 5.50 | | 5/20/2025 | | | 305,225 | |
| | 200,000 | | | AmeriGas Partners LP / AmeriGas Finance Corp. | | 5.63 | | 5/20/2024 | | | 213,000 | |
| | 100,000 | | | AmeriGas Partners LP / AmeriGas Finance Corp. | | 5.75 | | 5/20/2027 | | | 105,000 | |
| | | | | | | | | | | | 623,225 | |
See accompanying notes to financial statements.
Global Atlantic BlackRock High Yield Portfolio
PORTFOLIO OF INVESTMENTS (Continued)
June 30, 2019 (Unaudited)
| Principal Amount | | | | | Coupon Rate (%) | | Maturity | | Value | |
| | | | | HAND/MACHINE TOOLS - 0.1% | | | | | | | | |
| $ | 55,000 | | | Colfax Corp. (a) | | 6.00 | | 2/15/2024 | | $ | 58,163 | |
| | 25,000 | | | Colfax Corp. (a) | | 6.38 | | 2/15/2026 | | | 26,813 | |
| | | | | | | | | | | | 84,976 | |
| | | | | HEALTHCARE PRODUCTS - 1.6% | | | | | | | | |
| | 100,000 | | | Avantor, Inc. (a) | | 6.00 | | 10/1/2024 | | | 106,400 | |
| | 100,000 | | | Hill-Rom Holdings, Inc. (a) | | 5.75 | | 9/1/2023 | | | 103,355 | |
| | 300,000 | | | Hologic, Inc. (a) | | 4.38 | | 10/15/2025 | | | 304,125 | |
| | 176,000 | | | Kinetic Concepts, Inc. / KCI USA, Inc. (a) | | 7.88 | | 2/15/2021 | | | 180,430 | |
| | 450,000 | | | Teleflex, Inc. | | 4.63 | | 11/15/2027 | | | 462,938 | |
| | | | | | | | | | | | 1,157,248 | |
| | | | | HEALTHCARE SERVICES - 4.6% | | | | | | | | |
| | 40,000 | | | Catalent Pharma Solutions, Inc. (a) | | 5.00 | | 7/15/2027 | | | 40,700 | |
| | 100,000 | | | Centene Corp. | | 4.75 | | 1/15/2025 | | | 103,221 | |
| | 120,000 | | | Centene Corp. (a) | | 5.38 | | 6/1/2026 | | | 126,150 | |
| | 200,000 | | | CHS/Community Health Systems, Inc. | | 6.25 | | 3/31/2023 | | | 192,500 | |
| | 175,000 | | | CHS/Community Health Systems, Inc. (a) | | 8.00 | | 3/15/2026 | | | 168,385 | |
| | 458,000 | | | Encompass Health Corp. | | 5.75 | | 11/1/2024 | | | 466,381 | |
| | 600,000 | | | HCA, Inc. | | 5.38 | | 2/1/2025 | | | 647,625 | |
| | 115,000 | | | HCA, Inc. | | 5.63 | | 9/1/2028 | | | 124,488 | |
| | 650,000 | | | HCA, Inc. | | 5.88 | | 2/15/2026 | | | 718,250 | |
| | 20,000 | | | HCA, Inc. | | 5.88 | | 2/1/2029 | | | 21,925 | |
| | 175,000 | | | Molina Healthcare, Inc. | | 5.38 | | 11/15/2022 | | | 182,000 | |
| | 100,000 | | | RegionalCare Hospital Partners Holdings, Inc. (a) | | 8.25 | | 5/1/2023 | | | 106,437 | |
| | 100,000 | | | Tenet Healthcare Corp. | | 4.63 | | 7/15/2024 | | | 101,250 | |
| | 100,000 | | | Tenet Healthcare Corp. | | 5.13 | | 5/1/2025 | | | 100,500 | |
| | 100,000 | | | WellCare Health Plans, Inc. | | 5.25 | | 4/1/2025 | | | 104,250 | |
| | 170,000 | | | WellCare Health Plans, Inc. (a) | | 5.38 | | 8/15/2026 | | | 180,200 | |
| | | | | | | | | | | | 3,384,262 | |
| | | | | HOME BUILDERS - 3.0% | | | | | | | | |
| | 150,000 | | | Beazer Homes USA, Inc. | | 5.88 | | 10/15/2027 | | | 130,080 | |
| | 200,000 | | | Century Communities, Inc. | | 5.88 | | 7/15/2025 | | | 201,000 | |
| | 110,000 | | | KB Home | | 6.88 | | 6/15/2027 | | | 117,425 | |
| | 100,000 | | | Lennar Corp. | | 4.75 | | 11/29/2027 | | | 105,250 | |
| | 100,000 | | | Mattamy Group Corp. (a) | | 6.88 | | 12/15/2023 | | | 104,125 | |
| | 250,000 | | | Meritage Homes Corp. | | 6.00 | | 6/1/2025 | | | 268,750 | |
| | 400,000 | | | PulteGroup, Inc. | | 5.00 | | 1/15/2027 | | | 418,923 | |
| | 200,000 | | | PulteGroup, Inc. | | 5.50 | | 3/1/2026 | | | 216,000 | |
| | 300,000 | | | Toll Brothers Finance Corp. | | 4.88 | | 3/15/2027 | | | 314,715 | |
| | 100,000 | | | TRI Pointe Group, Inc. / TRI Pointe Homes, Inc. | | 5.88 | | 6/15/2024 | | | 103,220 | |
| | 90,000 | | | William Lyon Homes, Inc. | | 6.00 | | 9/1/2023 | | | 91,350 | |
| | 123,000 | | | Williams Scotsman International, Inc. (a) | | 6.88 | | 8/15/2023 | | | 128,227 | |
| | | | | | | | | | | | 2,199,065 | |
| | | | | HOUSEWARES - 0.1% | | | | | | | | |
| | 100,000 | | | Scotts Miracle-Gro Co. | | 6.00 | | 10/15/2023 | | | 104,038 | |
| | | | | | | | | | | | | |
| | | | | INSURANCE - 0.7% | | | | | | | | |
| | 50,000 | | | Acrisure LLC/Acrisure Finance, Inc. (a) | | 8.13 | | 2/15/2024 | | | 51,625 | |
| | 100,000 | | | CNO Financial Group, Inc. | | 5.25 | | 5/30/2025 | | | 107,750 | |
| | 120,000 | | | Fidelity & Guaranty Life Holdings, Inc. (a) | | 5.50 | | 5/1/2025 | | | 124,500 | |
| | 100,000 | | | Radian Group, Inc. | | 4.50 | | 10/1/2024 | | | 102,429 | |
| | 160,000 | | | Radian Group, Inc. | | 4.88 | | 3/15/2027 | | | 161,000 | |
| | | | | | | | | | | | 547,304 | |
| | | | | INTERNET - 4.0% | | | | | | | | |
| | 305,000 | | | Cogent Communications Group, Inc. | | 5.38 | | 3/1/2022 | | | 315,675 | |
| | 150,000 | | | Match Group, Inc. (a) | | 5.00 | | 12/15/2027 | | | 157,110 | |
| | 155,000 | | | Match Group, Inc. (a) | | 5.63 | | 2/15/2029 | | | 163,525 | |
| | 400,000 | | | Netflix, Inc. | | 4.38 | | 11/15/2026 | | | 409,120 | |
| | 120,000 | | | Netflix, Inc. (a) | | 5.38 | | 11/15/2029 | | | 127,463 | |
| | 600,000 | | | VeriSign, Inc. | | 4.75 | | 7/15/2027 | | | 624,750 | |
| | 200,000 | | | VeriSign, Inc. | | 5.25 | | 4/1/2025 | | | 213,500 | |
See accompanying notes to financial statements.
Global Atlantic BlackRock High Yield Portfolio
PORTFOLIO OF INVESTMENTS (Continued)
June 30, 2019 (Unaudited)
| Principal Amount | | | | | Coupon Rate (%) | | Maturity | | Value | |
| | | | | INTERNET - 4.0% (Continued) | | | | | | | | |
| $ | 400,000 | | | Zayo Group LLC / Zayo Capital, Inc. (a) | | 5.75 | | 1/15/2027 | | $ | 407,552 | |
| | 500,000 | | | Zayo Group LLC / Zayo Capital Inc. | | 6.00 | | 4/1/2023 | | | 511,250 | |
| | | | | | | | | | | | 2,929,945 | |
| | | | | INVESTMENT COMPANIES - 1.0% | | | | | | | | |
| | 200,000 | | | Icahn Enterprises LP / Icahn Enterprises Finance Corp. | | 6.25 | | 2/1/2022 | | | 204,750 | |
| | 90,000 | | | Icahn Enterprises LP / Icahn Enterprises Finance Corp. (a) | | 6.25 | | 5/15/2026 | | | 91,237 | |
| | 400,000 | | | Icahn Enterprises LP / Icahn Enterprises Finance Corp. | | 6.38 | | 12/15/2025 | | | 408,320 | |
| | | | | | | | | | | | 704,307 | |
| | | | | IRON/STEEL - 2.6% | | | | | | | | |
| | 200,000 | | | AK Steel Corp. | | 6.38 | | 10/15/2025 | | | 160,000 | |
| | 200,000 | | | AK Steel Corp. | | 7.50 | | 7/15/2023 | | | 204,440 | |
| | 100,000 | | | Allegheny Technologies, Inc. | | 5.95 | | 1/15/2021 | | | 102,750 | |
| | 200,000 | | | Allegheny Technologies, Inc. | | 7.88 | | 8/15/2023 | | | 214,310 | |
| | 400,000 | | | Big River Steel LLC / BRS Finance Corp. (a) | | 7.25 | | 9/1/2025 | | | 420,220 | |
| | 122,000 | | | Cleveland-Cliffs, Inc. | | 5.75 | | 3/1/2025 | | | 121,390 | |
| | 125,000 | | | Cleveland-Cliffs, Inc. (a) | | 5.88 | | 6/1/2027 | | | 121,562 | |
| | 200,000 | | | Commercial Metals Co. | | 5.38 | | 7/15/2027 | | | 199,000 | |
| | 75,000 | | | Commercial Metals Co. | | 5.75 | | 4/15/2026 | | | 74,869 | |
| | 75,000 | | | Mineral Resources Ltd. (a) | | 8.13 | | 5/1/2027 | | | 78,094 | |
| | 200,000 | | | United States Steel Corp. | | 6.88 | | 8/15/2025 | | | 189,000 | |
| | | | | | | | | | | | 1,885,635 | |
| | | | | LEISURE TIME - 0.4% | | | | | | | | |
| | 200,000 | | | Carlson Travel, Inc. (a) | | 6.75 | | 12/15/2023 | | | 202,500 | |
| | 25,000 | | | Silversea Cruise Finance Ltd. (a) | | 7.25 | | 2/1/2025 | | | 26,867 | |
| | 100,000 | | | Viking Cruises Ltd. (a) | | 5.88 | | 9/15/2027 | | | 101,250 | |
| | | | | | | | | | | | 330,617 | |
| | | | | LODGING - 1.4% | | | | | | | | |
| | 75,000 | | | Boyd Gaming Corp. | | 6.00 | | 8/15/2026 | | | 78,844 | |
| | 100,000 | | | Hilton Domestic Operating Co., Inc. | | 4.25 | | 9/1/2024 | | | 101,500 | |
| | 45,000 | | | Hilton Domestic Operating Co., Inc. (a) | | 4.88 | | 1/15/2030 | | | 46,350 | |
| | 45,000 | | | Hilton Domestic Operating Co., Inc. | | 5.13 | | 5/1/2026 | | | 46,969 | |
| | 400,000 | | | Hilton Worldwide Finance LLC / Hilton Worldwide Finance Corp. | | 4.88 | | 4/1/2027 | | | 413,380 | |
| | 100,000 | | | Jack Ohio Finance LLC / Jack Ohio Finance 1 Corp. (a) | | 6.75 | | 11/15/2021 | | | 102,720 | |
| | 50,000 | | | Station Casinos LLC (a) | | 5.00 | | 10/1/2025 | | | 50,125 | |
| | 100,000 | | | Wyndham Hotels & Resorts, Inc. (a) | | 5.38 | | 4/15/2026 | | | 104,625 | |
| | 100,000 | | | Wynn Las Vegas LLC / Wynn Las Vegas Capital Corp. (a) | | 5.50 | | 3/1/2025 | | | 103,280 | |
| | | | | | | | | | | | 1,047,793 | |
| | | | | MACHINERY - DIVERSIFIED - 0.4% | | | | | | | | |
| | 140,000 | | | Cleaver-Brooks, Inc. (a) | | 7.88 | | 3/1/2023 | | | 134,254 | |
| | 35,000 | | | Mueller Water Products, Inc. (a) | | 5.50 | | 6/15/2026 | | | 36,181 | |
| | 35,000 | | | RBS Global Inc / Rexnord LLC (a) | | 4.88 | | 12/15/2025 | | | 35,438 | |
| | 50,000 | | | Stevens Holding Co., Inc. (a) | | 6.13 | | 10/1/2026 | | | 52,688 | |
| | | | | | | | | | | | 258,561 | |
| | | | | MEDIA - 8.2% | | | | | | | | |
| | 200,000 | | | Altice Financing SA (a) | | 6.63 | | 2/15/2023 | | | 205,000 | |
| | 200,000 | | | Altice Financing SA (a) | | 7.50 | | 5/15/2026 | | | 201,020 | |
| | 200,000 | | | Cablevision Systems Corp. | | 5.88 | | 9/15/2022 | | | 210,000 | |
| | 100,000 | | | CCO Holdings LLC / CCO Holdings Capital Corp. (a) | | 5.00 | | 2/1/2028 | | | 102,120 | |
| | 200,000 | | | CCO Holdings LLC / CCO Holdings Capital Corp. (a) | | 5.13 | | 5/1/2027 | | | 207,072 | |
| | 550,000 | | | CCO Holdings LLC / CCO Holdings Capital Corp. (a) | | 5.38 | | 6/1/2029 | | | 567,875 | |
| | 200,000 | | | CCO Holdings LLC / CCO Holdings Capital Corp. (a) | | 5.50 | | 5/1/2026 | | | 209,310 | |
| | 200,000 | | | CSC Holdings LLC (a) | | 5.13 | | 12/15/2021 | | | 200,000 | |
| | 500,000 | | | CSC Holdings LLC | | 5.25 | | 6/1/2024 | | | 519,375 | |
| | 200,000 | | | CSC Holdings LLC (a) | | 5.38 | | 2/1/2028 | | | 207,750 | |
| | 200,000 | | | CSC Holdings LLC (a) | | 5.50 | | 5/15/2026 | | | 209,740 | |
| | 200,000 | | | CSC Holdings LLC (a) | | 6.50 | | 2/1/2029 | | | 218,250 | |
| | 100,000 | | | DISH DBS Corp. | | 5.88 | | 7/15/2022 | | | 101,500 | |
| | 500,000 | | | DISH DBS Corp. | | 5.88 | | 11/15/2024 | | | 473,125 | |
| | 200,000 | | | DISH DBS Corp. | | 6.75 | | 6/1/2021 | | | 209,750 | |
See accompanying notes to financial statements.
Global Atlantic BlackRock High Yield Portfolio
PORTFOLIO OF INVESTMENTS (Continued)
June 30, 2019 (Unaudited)
| Principal Amount | | | | | Coupon Rate (%) | | Maturity | | Value | |
| | | | | MEDIA - 8.2% (Continued) | | | | | | | | |
| $ | 300,000 | | | DISH DBS Corp. | | 7.75 | | 7/1/2026 | | $ | 291,000 | |
| | 75,000 | | | EW Scripps Co. (The) (a) | | 5.13 | | 5/15/2025 | | | 72,000 | |
| | 171,000 | | | Gray Television Inc. (a) | | 5.88 | | 7/15/2026 | | | 177,412 | |
| | 100,000 | | | Midcontinent Communications / Midcontinent Finance Corp. (a) | | 6.88 | | 8/15/2023 | | | 103,750 | |
| | 200,000 | | | Sirius XM Radio, Inc. (a) | | 3.88 | | 8/1/2022 | | | 200,500 | |
| | 200,000 | | | Univision Communications. Inc. (a) | | 5.13 | | 5/15/2023 | | | 195,500 | |
| | 200,000 | | | Univision Communications. Inc. (a) | | 5.13 | | 2/15/2025 | | | 190,250 | |
| | 400,000 | | | UPC Holding BV (a) | | 5.50 | | 1/15/2028 | | | 402,000 | |
| | 200,000 | | | Virgin Media Finance PLC (a) | | 6.00 | | 10/15/2024 | | | 207,250 | |
| | 200,000 | | | Virgin Media Secured Finance PLC (a) | | 5.50 | | 5/15/2029 | | | 202,940 | |
| | 150,000 | | | Ziggo BV (a) | | 5.50 | | 1/15/2027 | | | 152,581 | |
| | | | | | | | | | | | 6,037,070 | |
| | | | | METAL FABRICATE/HARDWARE - 0.1% | | | | | | | | |
| | 100,000 | | | Grinding Media, Inc. / Moly-Cop AltaSteel Ltd. (a) | | 7.38 | | 12/15/2023 | | | 95,750 | |
| | | | | | | | | | | | | |
| | | | | MINING - 2.0% | | | | | | | | |
| | 500,000 | | | Freeport-McMoRan, Inc. | | 3.55 | | 3/1/2022 | | | 501,875 | |
| | 200,000 | | | Freeport-McMoRan, Inc. | | 6.88 | | 2/15/2023 | | | 210,500 | |
| | 200,000 | | | Hudbay Minerals, Inc. (a) | | 7.25 | | 1/15/2023 | | | 206,000 | |
| | 200,000 | | | Hudbay Minerals, Inc. (a) | | 7.63 | | 1/15/2025 | | | 206,500 | |
| | 250,000 | | | Northwest Acquisitions ULC / Dominion Finco, Inc. (a) | | 7.13 | | 11/1/2022 | | | 172,500 | |
| | 100,000 | | | Novelis Corp. (a) | | 5.88 | | 9/30/2026 | | | 101,250 | |
| | 100,000 | | | Novelis Corp. (a) | | 6.25 | | 8/15/2024 | | | 104,846 | |
| | | | | | | | | | | | 1,503,471 | |
| | | | | OFFICE/BUSINESS EQUIPMENT - 0.6% | | | | | | | | |
| | 200,000 | | | CDW LLC / CDW Finance Corp. | | 5.00 | | 9/1/2025 | | | 208,250 | |
| | 200,000 | | | CDW LLC / CDW Finance Corp. | | 5.50 | | 12/1/2024 | | | 213,800 | |
| | | | | | | | | | | | 422,050 | |
| | | | | OIL & GAS - 6.3% | | | | | | | | |
| | 150,000 | | | Aker BP ASA (a) | | 4.75 | | 6/15/2024 | | | 154,605 | |
| | 95,000 | | | Berry Petroleum Co. LLC (a) | | 7.00 | | 2/15/2026 | | | 92,150 | |
| | 55,000 | | | Brazos Valley Longhorn LLC / Brazos Valley Longhorn Finance Corp. | | 6.88 | | 2/1/2025 | | | 51,700 | |
| | 110,000 | | | Chesapeake Energy Corp. | | 7.00 | | 10/1/2024 | | | 98,726 | |
| | 120,000 | | | Chesapeake Energy Corp. | | 7.50 | | 10/1/2026 | | | 106,800 | |
| | 200,000 | | | Chesapeake Energy Corp. | | 8.00 | | 1/15/2025 | | | 185,500 | |
| | 125,000 | | | Comstock Resources, Inc. | | 9.75 | | 8/15/2026 | | | 95,937 | |
| | 55,000 | | | Covey Park Energy LLC / Covey Park Finance Corp. (a) | | 7.50 | | 5/15/2025 | | | 39,600 | |
| | 500,000 | | | CVR Refining LLC / Coffeyville Finance, Inc. | | 6.50 | | 11/1/2022 | | | 509,750 | |
| | 30,000 | | | Denbury Resources, Inc. (a) | | 7.75 | | 2/15/2024 | | | 24,900 | |
| | 100,000 | | | Denbury Resources, Inc. (a) | | 9.00 | | 5/15/2021 | | | 98,500 | |
| | 175,000 | | | Ensco Rowan PLC | | 7.75 | | 2/1/2026 | | | 130,375 | |
| | 65,000 | | | Extraction Oil & Gas,Inc. (a) | | 5.63 | | 2/1/2026 | | | 52,488 | |
| | 80,000 | | | Hilcorp Energy I LP / Hilcorp Finance Co. (a) | | 6.25 | | 11/1/2028 | | | 80,400 | |
| | 50,000 | | | Indigo Natural Resources LLC (a) | | 6.88 | | 2/15/2026 | | | 44,875 | |
| | 35,000 | | | Jagged Peak Energy LLC | | 5.88 | | 5/1/2026 | | | 34,475 | |
| | 55,000 | | | Matador Resources Co. | | 5.88 | | 9/15/2026 | | | 55,550 | |
| | 100,000 | | | Moss Creek Resources Holdings, Inc. (a) | | 7.50 | | 1/15/2026 | | | 85,250 | |
| | 200,000 | | | Murphy Oil Corp. | | 5.75 | | 8/15/2025 | | | 207,280 | |
| | 80,000 | | | Noble Holding International Ltd. (a) | | 7.88 | | 2/1/2026 | | | 68,826 | |
| | 80,400 | | | Northern Oil and Gas, Inc. (b) | | 9.50 | | 5/15/2023 | | | 83,013 | |
| | 85,000 | | | Oasis Petroleum, Inc. (a) | | 6.25 | | 5/1/2026 | | | 82,238 | |
| | 40,000 | | | Parkland Fuel Corp. (a) | | 5.88 | | 7/15/2027 | | | 40,638 | |
| | 200,000 | | | PBF Holding Co. LLC / PBF Finance Corp. | | 7.25 | | 6/15/2025 | | | 209,500 | |
| | 30,000 | | | PDC Energy, Inc. | | 5.75 | | 5/15/2026 | | | 29,475 | |
| | 250,000 | | | Precision Drilling Corp. (a) | | 7.13 | | 1/15/2026 | | | 241,875 | |
| | 100,000 | | | Precision Drilling Corp. | | 7.75 | | 12/15/2023 | | | 101,970 | |
| | 105,000 | | | Shelf Drilling Holdings Ltd. (a) | | 8.25 | | 2/15/2025 | | | 96,915 | |
| | 25,000 | | | SM Energy Co. | | 6.63 | | 1/15/2027 | | | 23,125 | |
| | 300,000 | | | Southwestern Energy Co. | | 6.20 | | 1/23/2025 | | | 273,750 | |
| | 150,000 | | | Southwestern Energy Co. | | 7.50 | | 4/1/2026 | | | 142,107 | |
See accompanying notes to financial statements.
Global Atlantic BlackRock High Yield Portfolio
PORTFOLIO OF INVESTMENTS (Continued)
June 30, 2019 (Unaudited)
| Principal Amount | | | | | Coupon Rate (%) | | Maturity | | Value | |
| | | | | OIL & GAS - 6.3% (Continued) | | | | | | | | |
| $ | 400,000 | | | Sunoco LP / Sunoco Finance Corp. | | 5.50 | | 2/15/2026 | | $ | 416,500 | |
| | 70,000 | | | Sunoco LP / Sunoco Finance Corp. (a) | | 6.00 | | 4/15/2027 | | | 73,500 | |
| | 33,075 | | | TransoceanGuardian Ltd. (a) | | 5.88 | | 1/15/2024 | | | 33,612 | |
| | 23,625 | | | Transocean Pontus Ltd. (a) | | 6.13 | | 8/1/2025 | | | 24,334 | |
| | 380,000 | | | W&T Offshore, Inc. (a) | | 9.75 | | 11/1/2023 | | | 363,850 | |
| | 70,000 | | | Whiting Petroleum Corp. | | 6.63 | | 1/15/2026 | | | 67,506 | |
| | 100,000 | | | WPX Energy, Inc. | | 8.25 | | 8/1/2023 | | | 114,000 | |
| | | | | | | | | | | | 4,635,595 | |
| | | | | OIL & GAS SERVICES - 0.6% | | | | | | | | |
| | 65,000 | | | Apergy Corp. | | 6.38 | | 5/1/2026 | | | 65,488 | |
| | 125,000 | | | CSI Compressco LP / CSI Compressco Finance, Inc. (a) | | 7.50 | | 4/1/2025 | | | 122,656 | |
| | 46,000 | | | Hi-Crush, Inc. (a) | | 9.50 | | 8/1/2026 | | | 31,970 | |
| | 35,000 | | | Nine Energy Service, Inc. (a) | | 8.75 | | 11/1/2023 | | | 34,125 | |
| | 175,000 | | | SESI LLC | | 7.75 | | 9/15/2024 | | | 112,437 | |
| | 85,000 | | | USA Compression Partners LP / USA Compression Finance Corp. | | 6.88 | | 4/1/2026 | | | 89,879 | |
| | | | | | | | | | | | 456,555 | |
| | | | | PACKAGING & CONTAINERS - 2.9% | | | | | | | | |
| | 500,000 | | | Ardagh Packaging Finance PLC / Ardagh Holdings USA, Inc. (a) | | 7.25 | | 5/15/2024 | | | 526,875 | |
| | 130,000 | | | Berry Global Escrow Corp. (a) | | 4.88 | | 7/15/2026 | | | 132,762 | |
| | 45,000 | | | Berry Global Escrow Corp. (a) | | 5.63 | | 7/15/2027 | | | 46,800 | |
| | 150,000 | | | Berry Global, Inc. (a) | | 4.50 | | 2/15/2026 | | | 147,750 | |
| | 100,000 | | | BWAY Holding Co. (a) | | 5.50 | | 4/15/2024 | | | 100,050 | |
| | 200,000 | | | Crown Americas LLC / Crown Americas Capital Corp. V | | 4.25 | | 9/30/2026 | | | 204,000 | |
| | 55,000 | | | Greif, Inc. (a) | | 6.50 | | 3/1/2027 | | | 56,787 | |
| | 100,000 | | | Plastipak Holdings, Inc. (a) | | 6.25 | | 10/15/2025 | | | 90,500 | |
| | 500,000 | | | Reynolds Group Issuer, Inc. / Reynolds Group Issuer LLC / Reynolds Group Issuer (a) | | 5.13 | | 7/15/2023 | | | 509,375 | |
| | 300,000 | | | Silgan Holdings, Inc. | | 4.75 | | 3/15/2025 | | | 302,250 | |
| | | | | | | | | | | | 2,117,149 | |
| | | | | PHARMARCEUTICALS - 3.1% | | | | | | | | |
| | 60,000 | | | Bausch Health Americas, Inc. (a) | | 8.50 | | 1/31/2027 | | | 65,971 | |
| | 60,000 | | | Bausch Health Cos, Inc. (a) | | 5.50 | | 11/1/2025 | | | 62,550 | |
| | 30,000 | | | Bausch Health Cos, Inc. (a) | | 5.75 | | 8/15/2027 | | | 31,529 | |
| | 300,000 | | | Bausch Health Cos, Inc. (a) | | 5.88 | | 5/15/2023 | | | 303,486 | |
| | 600,000 | | | Bausch Health Cos, Inc. (a) | | 6.13 | | 4/15/2025 | | | 612,732 | |
| | 250,000 | | | Bausch Health Cos, Inc. (a) | | 7.00 | | 3/15/2024 | | | 265,650 | |
| | 30,000 | | | Bausch Health Cos, Inc. (a) | | 7.00 | | 1/15/2028 | | | 31,087 | |
| | 55,000 | | | Bausch Health Cos, Inc. (a) | | 7.25 | | 5/30/2029 | | | 57,200 | |
| | 155,000 | | | Bausch Health Cos, Inc. (a) | | 9.00 | | 12/15/2025 | | | 162,978 | |
| | 50,000 | | | Mallinckrodt International Finance SA / Mallinckrodt CB LLC (a) | | 5.50 | | 4/15/2025 | | | 33,500 | |
| | 200,000 | | | Mallinckrodt International Finance SA / Mallinckrodt CB LLC (a) | | 5.63 | | 10/15/2023 | | | 151,000 | |
| | 300,000 | | | Mallinckrodt International Finance SA / Mallinckrodt CB LLC (a) | | 5.75 | | 8/1/2022 | | | 258,000 | |
| | 195,000 | | | Par Pharmaceutical, Inc. (a) | | 7.50 | | 4/1/2027 | | | 191,587 | |
| | 20,000 | | | Vizient, Inc. (a) | | 6.25 | | 5/15/2027 | | | 21,126 | |
| | | | | | | | | | | | 2,248,396 | |
| | | | | PIPELINES - 2.9% | | | | | | | | |
| | 100,000 | | | Cheniere Corpus Christi Holdings LLC | | 5.88 | | 3/31/2025 | | | 111,375 | |
| | 350,000 | | | Cheniere Energy Partners LP | | 5.25 | | 10/1/2025 | | | 361,812 | |
| | 90,000 | | | Crestwood Midstream Partners LP / Crestwood Midstream Finance Corp. (a) | | 5.63 | | 5/1/2027 | | | 89,775 | |
| | 100,000 | | | Crestwood Midstream Partners LP / Crestwood Midstream Finance Corp. | | 5.75 | | 4/1/2025 | | | 101,250 | |
| | 80,000 | | | DCP Midstream Operating LP | | 5.38 | | 7/15/2025 | | | 84,300 | |
| | 150,000 | | | Genesis Energy LP / Genesis Energy Finance Corp. | | 6.25 | | 5/15/2026 | | | 144,750 | |
| | 100,000 | | | Genesis Energy LP / Genesis Energy Finance Corp. | | 6.50 | | 10/1/2025 | | | 97,750 | |
| | 70,000 | | | Hess Infrastructure Partners LP / Hess Infrastructure Partners Finance Corp. (a) | | 5.63 | | 2/15/2026 | | | 72,012 | |
| | 200,000 | | | Holly Energy Partners LP / Holly Energy Finance Corp. (a) | | 6.00 | | 8/1/2024 | | | 208,000 | |
| | 200,000 | | | NGL Energy Partners LP / NGL Energy Finance Corp. | | 7.50 | | 11/1/2023 | | | 209,000 | |
| | 360,000 | | | NGL Energy Partners LP / NGL Energy Finance Corp. (a) | | 7.50 | | 4/15/2026 | | | 372,600 | |
| | 215,000 | | | NuStar Logistics LP | | 6.00 | | 6/1/2026 | | | 222,525 | |
| | 70,000 | | | Targa Resources Partners LP / Targa Resources Partners Finance Corp. | | 5.88 | | 4/15/2026 | | | 74,200 | |
| | | | | | | | | | | | 2,149,349 | |
See accompanying notes to financial statements.
Global Atlantic BlackRock High Yield Portfolio
PORTFOLIO OF INVESTMENTS (Continued)
June 30, 2019 (Unaudited)
| Principal Amount | | | | | Coupon Rate (%) | | Maturity | | Value | |
| | | | | REAL ESTATE - 0.8% | | | | | | | | |
| $ | 100,000 | | | Five Point Operating Co LP / Five Point Capital Corp. (a) | | 7.88 | | 11/15/2025 | | $ | 100,502 | |
| | 35,000 | | | Greystar Real Estate Partners LLC (a) | | 5.75 | | 12/1/2025 | | | 35,700 | |
| | 175,000 | | | Hunt Cos, Inc. (a) | | 6.25 | | 2/15/2026 | | | 165,375 | |
| | 300,000 | | | Kennedy-Wilson, Inc. | | 5.875 | | 4/1/2024 | | | 306,000 | |
| | | | | | | | | | | | 607,577 | |
| | | | | REAL ESTATE INVESTMENT TRUSTS - 3.7% | | | | | | | | |
| | 90,000 | | | Brookfield Property REIT Inc / BPR Cumulus LLC / BPR Nimbus LLC / GGSI Sellco LL (a) | | 5.75 | | 5/15/2026 | | | 92,700 | |
| | 300,000 | | | CoreCivic, Inc. | | 4.75 | | 10/15/2027 | | | 270,000 | |
| | 300,000 | | | GEO Group, Inc. (The) | | 5.13 | | 4/1/2023 | | | 268,500 | |
| | 200,000 | | | Iron Mountain, Inc. (a) | | 4.88 | | 9/15/2027 | | | 198,250 | |
| | 500,000 | | | MGM Growth Properties Operating Partnership LP / MGP Finance Co-Issuer, Inc. | | 5.63 | | 5/1/2024 | | | 538,750 | |
| | 400,000 | | | MPT Operating Partnership LP / MPT Finance Corp. | | 5.00 | | 10/15/2027 | | | 412,000 | |
| | 700,000 | | | SBA Communications Corp. | | 4.00 | | 10/1/2022 | | | 709,625 | |
| | 100,000 | | | SBA Communications Corp. | | 4.88 | | 9/1/2024 | | | 103,000 | |
| | 145,000 | | | Starwood Property Trust, Inc. | | 4.75 | | 3/15/2025 | | | 146,450 | |
| | | | | | | | | | | | 2,739,275 | |
| | | | | RETAIL - 4.1% | | | | | | | | |
| | 200,000 | | | KFC Holding Co./Pizza Hut Holdings LLC/Taco Bell of America LLC (a) | | 4.75 | | 6/1/2027 | | | 205,000 | |
| | 100,000 | | | KFC Holding Co./Pizza Hut Holdings LLC/Taco Bell of America LLC (a) | | 5.25 | | 6/1/2026 | | | 104,874 | |
| | 200,000 | | | L Brands, Inc. | | 6.88 | | 11/1/2035 | | | 177,872 | |
| | 100,000 | | | L Brands, Inc. | | 7.50 | | 6/15/2029 | | | 99,990 | |
| | 120,000 | | | Michaels Stores, Inc. (a) | | 8.00 | | 7/15/2027 | | | 119,447 | |
| | 400,000 | | | New Red Finance, Inc. (a) | | 4.63 | | 1/15/2022 | | | 400,000 | |
| | 500,000 | | | New Red Finance, Inc. (a) | | 5.00 | | 10/15/2025 | | | 503,900 | |
| | 100,000 | | | QVC, Inc. | | 4.45 | | 2/15/2025 | | | 100,717 | |
| | 300,000 | | | QVC, Inc. | | 5.13 | | 7/2/2022 | | | 312,356 | |
| | 100,000 | | | Sally Holdings LLC / Sally Capital, Inc. | | 5.63 | | 12/1/2025 | | | 98,120 | |
| | 100,000 | | | Staples, Inc. (a) | | 7.50 | | 4/15/2026 | | | 99,411 | |
| | 200,000 | | | Suburban Propane Partners LP/Suburban Energy Finance Corp. | | 5.50 | | 6/1/2024 | | | 201,000 | |
| | 50,000 | | | Superior Plus LP / Superior General Partner, Inc. (a) | | 7.00 | | 7/15/2026 | | | 51,687 | |
| | 500,000 | | | Yum! Brands, Inc. | | 3.88 | | 11/1/2023 | | | 506,550 | |
| | | | | | | | | | | | 2,980,924 | |
| | | | | SEMICONDUCTORS - 0.5% | | | | | | | | |
| | 200,000 | | | Entegris, Inc. (a) | | 4.63 | | 2/10/2026 | | | 201,500 | |
| | 160,000 | | | Qorvo, Inc. | | 5.50 | | 7/15/2026 | | | 169,328 | |
| | | | | | | | | | | | 370,828 | |
| | | | | SOFTWARE - 2.2% | | | | | | | | |
| | 25,000 | | | ACI Worldwide, Inc. (a) | | 5.75 | | 8/15/2026 | | | 26,070 | |
| | 50,000 | | | CDK Global, Inc. | | 5.88 | | 6/15/2026 | | | 52,875 | |
| | 50,000 | | | Dun & Bradstreet Corp. (The) (a) | | 6.88 | | 8/15/2026 | | | 52,812 | |
| | 60,000 | | | Fair Isaac Corp. (a) | | 5.25 | | 5/15/2026 | | | 63,000 | |
| | 200,000 | | | First Data Corp. (a) | | 5.00 | | 1/15/2024 | | | 204,900 | |
| | 200,000 | | | First Data Corp. (a) | | 5.38 | | 8/15/2023 | | | 203,600 | |
| | 200,000 | | | First Data Corp. (a) | | 5.75 | | 1/15/2024 | | | 205,625 | |
| | 200,000 | | | IQVIA, Inc. (a) | | 5.00 | | 10/15/2026 | | | 206,500 | |
| | 145,000 | | | MSCI, Inc. (a) | | 5.38 | | 5/15/2027 | | | 155,150 | |
| | 100,000 | | | Nuance Communications, Inc. | | 5.63 | | 12/15/2026 | | | 104,280 | |
| | 100,000 | | | PTC, Inc. | | 6.00 | | 5/15/2024 | | | 104,750 | |
| | 150,000 | | | Rackspace Hosting, Inc. (a) | | 8.63 | | 11/15/2024 | | | 137,625 | |
| | 100,000 | | | SS&C Technologies, Inc. (a) | | 5.50 | | 9/30/2027 | | | 103,750 | |
| | | | | | | | | | | | 1,620,937 | |
| | | | | TELECOMMUNICATIONS - 8.5% | | | | | | | | |
| | 300,000 | | | Altice France SA/France (a) | | 7.38 | | 5/1/2026 | | | 307,500 | |
| | 200,000 | | | C&W Senior Financing Plc. (a) | | 7.50 | | 10/15/2026 | | | 208,500 | |
| | 500,000 | | | CenturyLink, Inc. | | 5.80 | | 3/15/2022 | | | 521,250 | |
| | 100,000 | | | CenturyLink, Inc. | | 7.50 | | 4/1/2024 | | | 110,625 | |
| | 95,000 | | | CommScope, Inc. (a) | | 5.50 | | 3/1/2024 | | | 97,494 | |
| | 100,000 | | | CommScope, Inc. (a) | | 5.50 | | 6/15/2024 | | | 95,400 | |
| | 65,000 | | | CommScope, Inc. (a) | | 6.00 | | 3/1/2026 | | | 66,625 | |
See accompanying notes to financial statements.
Global Atlantic BlackRock High Yield Portfolio
PORTFOLIO OF INVESTMENTS (Continued)
June 30, 2019 (Unaudited)
| Principal Amount | | | | | Coupon Rate (%) | | Maturity | | Value | |
| | | | | TELECOMMUNICATIONS - 8.5% (Continued) | | | | | | | | |
| $ | 100,000 | | | CommScope Technologies LLC (a) | | 6.00 | | 6/15/2025 | | $ | 93,721 | |
| | 200,000 | | | DKT Finance ApS (a) | | 9.38 | | 6/17/2023 | | | 216,500 | |
| | 195,000 | | | Frontier Communications Corp. (a) | | 8.50 | | 4/1/2026 | | | 189,150 | |
| | 300,000 | | | Frontier Communications Corp. | | 11.00 | | 9/15/2025 | | | 186,000 | |
| | 150,000 | | | Hughes Satellite Systems Corp. | | 5.25 | | 8/1/2026 | | | 154,125 | |
| | 150,000 | | | Hughes Satellite Systems Corp. | | 6.63 | | 8/1/2026 | | | 157,687 | |
| | 200,000 | | | Intelsat Connect Finance SA (a) | | 8.00 | | 2/15/2024 | | | 208,500 | |
| | 100,000 | | | Nokia OYJ | | 4.38 | | 6/12/2027 | | | 102,625 | |
| | 200,000 | | | Sable International Finance Ltd. (a) | | 5.75 | | 9/7/2027 | | | 201,375 | |
| | 100,000 | | | Sprint Capital Corp. | | 6.88 | | 11/15/2028 | | | 102,780 | |
| | 300,000 | | | Sprint Communications, Inc. | | 6.00 | | 11/15/2022 | | | 312,750 | |
| | 300,000 | | | Sprint Corp. | | 7.13 | | 6/15/2024 | | | 318,090 | |
| | 200,000 | | | Sprint Corp. | | 7.25 | | 9/15/2021 | | | 212,500 | |
| | 200,000 | | | Sprint Corp. | | 7.63 | | 2/15/2025 | | | 213,000 | |
| | 50,000 | | | Sprint Corp. | | 7.63 | | 3/1/2026 | | | 53,300 | |
| | 400,000 | | | Sprint Corp. | | 7.88 | | 9/15/2023 | | | 434,500 | |
| | 100,000 | | | Telesat Canada / Telesat LLC (a) | | 8.88 | | 11/15/2024 | | | 108,250 | |
| | 240,000 | | | T-Mobile USA, Inc. | | 4.50 | | 2/1/2026 | | | 245,700 | |
| | 150,000 | | | T-Mobile USA, Inc. | | 4.75 | | 2/1/2028 | | | 154,327 | |
| | 700,000 | | | T-Mobile USA, Inc. | | 6.38 | | 3/1/2025 | | | 726,950 | |
| | 200,000 | | | T-Mobile USA, Inc. | | 6.50 | | 1/15/2026 | | | 216,212 | |
| | 215,000 | | | ViaSat, Inc. (a) | | 5.63 | | 4/15/2027 | | | 223,600 | |
| | | | | | | | | | | | 6,239,036 | |
| | | | | TEXTILES - 0.2% | | | | | | | | |
| | 155,000 | | | Eagle Intermediate Global Holding BV/Ruyi US Finance LLC (a) | | 7.50 | | 5/1/2025 | | | 147,250 | |
| | | | | | | | | | | | | |
| | | | | TRANSPORTATION - 0.6% | | | | | | | | |
| | 100,000 | | | Teekay Offshore Partners LP/Teekay Offshore Finance Corp. (a) | | 8.50 | | 7/15/2023 | | | 98,422 | |
| | 368,000 | | | XPO Logistics, Inc. (a) | | 6.50 | | 6/15/2022 | | | 375,360 | |
| | | | | | | | | | | | 473,782 | |
| | | | | TRUCKING & LEASING - 1.6% | | | | | | | | |
| | 50,000 | | | Avolon Holdings Funding Ltd. (a) | | 5.13 | | 10/1/2023 | | | 52,925 | |
| | 85,000 | | | Fortress Transportation & Infrastructure Investors LLC (a) | | 6.50 | | 10/1/2025 | | | 87,550 | |
| | 145,000 | | | Fortress Transportation & Infrastructure Investors LLC (a) | | 6.75 | | 3/15/2022 | | | 150,619 | |
| | 400,000 | | | Park Aerospace Holdings Ltd. (a) | | 5.25 | | 8/15/2022 | | | 422,320 | |
| | 400,000 | | | Park Aerospace Holdings Ltd. (a) | | 5.50 | | 2/15/2024 | | | 431,192 | |
| | | | | | | | | | | | 1,144,606 | |
| | | | | TOTAL CORPORATE BONDS & NOTES (Cost - $70,187,267) | | | | | 70,819,846 | |
| | | | | | | | | | | | | |
| | | | | | | | | | | | | |
| Shares | | | | | | | | | | | |
| | | | | SHORT-TERM INVESTMENT - 0.9% | | | | | | | | |
| | | | | MONEY MARKET FUND - 0.9% | | | | | | | | |
| | 685,238 | | | Fidelity Investments Money Market Funds - Government Portfolio, Institutional Class to yield 2.25% (c) (Cost - $685,238) | | | 685,238 | |
| | | | | | | | | | | | | |
| | | | | TOTAL INVESTMENTS - 97.2% (Cost - $70,872,505) | | | | $ | 71,505,084 | |
| | | | | OTHER ASSETS LESS LIABILITIES - NET - 2.8% | | | | | 2,047,669 | |
| | | | | TOTAL NET ASSETS - 100.0% | | | | | | $ | 73,552,753 | |
| ^ | - Represents less than 0.05% |
| (a) | 144(a) - Security was purchased pursuant to Rule 144a under the Securities Act of 1933 and may not be resold subject to that rule, except to qualified institutional buyers. As of June 30, 2019, these securities amounted to $37,544,376 or 51.0% of net assets. |
| (b) | PIK - Pay-in-kind security. |
| (c) | Money market rate shown represents the rate at June 30, 2019. |
LP - Limited Partnership
PLC - Public Limited Company
REITS - Real Estate Investment Trusts
See accompanying notes to financial statements.
Global Atlantic BlackRock High Yield Portfolio
PORTFOLIO OF INVESTMENTS (Continued)
June 30, 2019 (Unaudited)
| | | | | | | | | | | | Unrealized | |
| | | Number of | | | | | | | | | Appreciation/ | |
| Description | | Contracts | | Expiration Date | | Counterparty | | Notional Amount | | | Depreciation | |
| SHORT | | | | | | | | | | | | | | |
| U.S. 5 Year Ultra Note Future | | 10 | | September 2019 | | Goldman Sachs | | $ | 1,181,563 | | | $ | (11,281 | ) |
| U.S. 10 Year Note Future | | 15 | | September 2019 | | Goldman Sachs | | | 1,919,531 | | | | (37,153 | ) |
| U.S. 10 Year Ultra Bond Future | | 3 | | September 2019 | | Goldman Sachs | | | 414,375 | | | | (13,266 | ) |
| | | | | | | | | | | | | | (61,700 | ) |
| LONG | | | | | | | | | | | | | | |
| U.S. 2 Year Note Future | | 12 | | September 2019 | | Goldman Sachs | | | 2,582,156 | | | | 16,454 | |
| U.S. Long Bond Future | | 4 | | September 2019 | | Goldman Sachs | | | 622,375 | | | | 19,772 | |
| | | | | | | | | | | | | | 36,226 | |
| TOTAL NET UNREALIZED DEPRECIATION OF FUTURES CONTRACTS | | | $ | (25,474 | ) |
See accompanying notes to financial statements.
Global Atlantic Goldman Sachs Core Fixed Income Portfolio
PORTFOLIO OF INVESTMENTS
June 30, 2019 (Unaudited)
| Principal | | | | | | | | | | |
| Amount | | | | | Coupon Rate (%) | | Maturity | | Value | |
| | | | | ASSET BACKED SECURITIES - 7.7% | | | | | | | | |
| $ | 500,000 | | | ACIS CLO 2014-4 Ltd. 3 Month US LIBOR + 1.42 (a,b) | | 4.00 | | 5/1/2026 | | $ | 500,764 | |
| | 1,500,000 | | | Assurant CLO 2018-1 Ltd. 3 Month US LIBOR + 1.04 (a,b) | | 3.63 | | 4/20/2031 | | | 1,488,219 | |
| | 400,000 | | | Catamaran CLO 2013-1 AR 3 Month US LIBOR + 0.85 (a,b) | | 3.43 | | 1/27/2028 | | | 398,226 | |
| | 350,000 | | | CBAM 2018-5 Ltd. 3 Month US LIBOR + 1.02 (a,b) | | 3.61 | | 4/17/2031 | | | 345,650 | |
| | 109,134 | | | Harben Finance 2017-1 PLC 3 Month BP LIBOR + 0.80 (b) | | 1.60 | | 8/20/2056 | | | 138,610 | |
| | 819,809 | | | Kentucky Higher Education Student Loan 2013-2 Corp. 1 Month US LIBOR + 0.60 (b) | | 3.04 | | 9/1/2028 | | | 817,008 | |
| | 212,380 | | | London Wall Mortgage Capital 2017-FL1 PLC 3 Month BP LIBOR + 0.85 (b) | | 1.66 | | 11/15/2049 | | | 270,011 | |
| | 550,000 | | | OCP CLO 2015-10 Ltd. 3 Month US LIBOR + 0.82 (a,b) | | 3.41 | | 10/26/2027 | | | 548,437 | |
| | 340,105 | | | Pennsylvania Higher Education 2012-1 PLC 1 Month US LIBOR + 0.55 (a,b) | | 2.98 | | 5/25/2057 | | | 338,287 | |
| | 515,636 | | | Ripon Mortgages 1X PLC 3 Month BP LIBOR + 0.80 (b) | | 1.60 | | 8/20/2056 | | | 654,897 | |
| | 41,684 | | | Scholar Funding 2010-A Trust 3 Month US LIBOR + 0.75 (a,b) | | 3.33 | | 10/28/2041 | | | 41,528 | |
| | 200,000 | | | Silverstone Master Issuer 2019-1A PLC 3 Month US LIBOR + 0.57 (a,b) | | 3.15 | | 1/21/2070 | | | 200,516 | |
| | 1,550,000 | | | TICP CLO 2018-10 Ltd. 3 Month US LIBOR + 1.00 (a,b) | | 3.59 | | 4/20/2031 | | | 1,524,386 | |
| | | | | TOTAL ASSET BACKED SECURITIES (Cost - $7,389,866) | | | | | 7,266,539 | |
| | | | | | | | | | | | | |
| | | | | CORPORATE BONDS & NOTES - 40.9% | | | | | | |
| | | | | AEROSPACE/DEFENSE - 2.1% | | | | | | | | |
| | 150,000 | | | Boeing Co. (The) | | 2.60 | | 10/30/2025 | | | 150,426 | |
| | 100,000 | | | Boeing Co. (The) | | 3.45 | | 11/1/2028 | | | 105,176 | |
| | 125,000 | | | General Dynamics Corp. 3 Month US LIBOR + 0.29 (b) | | 2.83 | | 5/11/2020 | | | 125,286 | |
| | 150,000 | | | General Dynamics Corp. | | 2.88 | | 5/11/2020 | | | 150,744 | |
| | 300,000 | | | Lockheed Martin Corp. | | 3.55 | | 1/15/2026 | | | 318,842 | |
| | 350,000 | | | Northrop Grumman Corp. | | 2.93 | | 1/15/2025 | | | 356,474 | |
| | 300,000 | | | Northrop Grumman Corp. | | 3.25 | | 1/15/2028 | | | 307,958 | |
| | 50,000 | | | Northrop Grumman Corp. | | 4.75 | | 6/1/2043 | | | 57,805 | |
| | 50,000 | | | United Technologies Corp. 3 Month US LIBOR + 0.65 (b) | | 3.17 | | 8/16/2021 | | | 50,031 | |
| | 50,000 | | | United Technologies Corp. | | 3.35 | | 8/16/2021 | | | 51,104 | |
| | 275,000 | | | United Technologies Corp. | | 3.95 | | 8/16/2025 | | | 296,560 | |
| | | | | | | | | | | | 1,970,406 | |
| | | | | AGRICULTURE - 0.5% | | | | | | | | |
| | 175,000 | | | Altria Group, Inc. | | 3.80 | | 2/14/2024 | | | 182,423 | |
| | 200,000 | | | Reynolds American, Inc. | | 3.25 | | 6/12/2020 | | | 201,358 | |
| | 75,000 | | | Reynolds American, Inc. | | 4.45 | | 6/12/2025 | | | 79,530 | |
| | | | | | | | | | | | 463,311 | |
| | | | | AUTO MANUFACTURERS - 0.2% | | | | | | | | |
| | 50,000 | | | General Motors Co. | | 4.00 | | 4/1/2025 | | | 50,908 | |
| | 75,000 | | | General Motors Financial Co., Inc. | | 4.30 | | 7/13/2025 | | | 77,306 | |
| | 25,000 | | | General Motors Financial Co., Inc. | | 5.65 | | 1/17/2029 | | | 27,492 | |
| | | | | | | | | | | | 155,706 | |
| | | | | BANKS - 10.9% | | | | | | | | |
| | 200,000 | | | Banco Santander SA | | 4.25 | | 4/11/2027 | | | 210,434 | |
| | 250,000 | | | Bank of America Corp. 3 Month US LIBOR + 0.93 (b) | | 2.82 | | 7/21/2023 | | | 252,499 | |
| | 175,000 | | | Bank of America Corp. | | 3.25 | | 10/21/2027 | | | 179,304 | |
| | 108,000 | | | Bank of America Corp. 3 Month US LIBOR + 1.04 (b) | | 3.42 | | 12/20/2028 | | | 111,132 | |
| | 225,000 | | | Bank of America Corp. 3 Month US LIBOR + 0.94 (b) | | 3.86 | | 7/23/2024 | | | 236,325 | |
| | 25,000 | | | Bank of America Corp. | | 4.18 | | 11/25/2027 | | | 26,485 | |
| | 150,000 | | | Bank of America Corp. | | 4.20 | | 8/26/2024 | | | 159,450 | |
| | 125,000 | | | Bank of America Corp. 3 Month US LIBOR + 1.31 (b) | | 4.27 | | 7/23/2029 | | | 136,524 | |
| | 100,000 | | | Bank of America Corp. | | 6.11 | | 1/29/2037 | | | 127,535 | |
| | 225,000 | | | Barclays PLC 3 Month US LIBOR + 1.40 (b) | | 4.61 | | 2/15/2023 | | | 232,803 | |
| | 252,000 | | | BNP Paribas SA (a) | | 3.38 | | 1/9/2025 | | | 256,396 | |
| | 300,000 | | | BNP Paribas SA (a) | | 3.50 | | 3/1/2023 | | | 308,600 | |
| | 255,000 | | | BPCE SA | | 2.65 | | 2/3/2021 | | | 256,088 | |
See accompanying notes to financial statements.
Global Atlantic Goldman Sachs Core Fixed Income Portfolio
PORTFOLIO OF INVESTMENTS (Continued)
June 30, 2019 (Unaudited)
| Principal | | | | | | | | | | |
| Amount | | | | | Coupon Rate (%) | | Maturity | | Value | |
| | | | | BANKS - 10.9% (Continued) | | | | | | | | |
| $ | 250,000 | | | BPCE SA (a) | | 4.00 | | 9/12/2023 | | $ | 261,165 | |
| | 200,000 | | | Citigroup, Inc. | | 2.70 | | 10/27/2022 | | | 201,690 | |
| | 200,000 | | | Citigroup, Inc. | | 3.40 | | 5/1/2026 | | | 207,011 | |
| | 50,000 | | | Citigroup, Inc. 3 Month US LIBOR + 1.39 (b) | | 3.67 | | 7/24/2028 | | | 52,181 | |
| | 100,000 | | | Citigroup, Inc. | | 4.13 | | 7/25/2028 | | | 105,913 | |
| | 75,000 | | | Citigroup, Inc. | | 4.60 | | 3/9/2026 | | | 81,147 | |
| | 250,000 | | | Cooperatieve Rabobank UA/NY 3 Month US LIBOR + 0.43 (b) | | 3.02 | | 4/26/2021 | | | 250,788 | |
| | 250,000 | | | Credit Suisse Group Funding Guernsey Ltd. | | 2.75 | | 3/26/2020 | | | 250,391 | |
| | 255,000 | | | Credit Suisse Group Funding Guernsey Ltd. | | 4.55 | | 4/17/2026 | | | 277,374 | |
| | 250,000 | | | Deutsche Bank AG | | 2.70 | | 7/13/2020 | | | 248,940 | |
| | 250,000 | | | HSBC Bank USA NA | | 4.88 | | 8/24/2020 | | | 256,911 | |
| | 150,000 | | | Huntington Bancshares, Inc. | | 4.00 | | 5/15/2025 | | | 160,034 | |
| | 225,000 | | | ING Groep NV (a) | | 4.63 | | 1/6/2026 | | | 245,449 | |
| | 200,000 | | | JPMorgan Chase & Co. | | 2.95 | | 10/1/2026 | | | 203,591 | |
| | 275,000 | | | JPMorgan Chase & Co. | | 3.25 | | 9/23/2022 | | | 282,516 | |
| | 225,000 | | | JPMorgan Chase & Co. | | 3.30 | | 4/1/2026 | | | 232,523 | |
| | 125,000 | | | JPMorgan Chase & Co. 3 Month US LIBOR + 0.95 (b) | | 3.51 | | 1/23/2029 | | | 129,954 | |
| | 175,000 | | | JPMorgan Chase & Co. 3 Month US LIBOR + 1.25 (b) | | 3.96 | | 1/29/2027 | | | 187,197 | |
| | 450,000 | | | JPMorgan Chase & Co. 3 Month US LIBOR + 1.00 (b) | | 4.02 | | 12/5/2024 | | | 478,256 | |
| | 275,000 | | | Lloyds Bank PLC 3 Month US LIBOR + 0.49 (b) | | 3.06 | | 5/7/2021 | | | 274,893 | |
| | 400,000 | | | Mizuho Financial Group, Inc. | | 2.60 | | 9/11/2022 | | | 399,761 | |
| | 400,000 | | | Morgan Stanley | | 3.63 | | 1/20/2027 | | | 419,815 | |
| | 275,000 | | | Morgan Stanley | | 3.70 | | 10/23/2024 | | | 290,133 | |
| | 125,000 | | | Morgan Stanley 3 Month US LIBOR + 0.85 (b) | | 3.74 | | 4/24/2024 | | | 130,315 | |
| | 100,000 | | | Morgan Stanley 3 Month US LIBOR + 1.63 (b) | | 4.43 | | 1/23/2030 | | | 110,626 | |
| | 150,000 | | | Royal Bank of Canada | | 3.20 | | 4/30/2021 | | | 152,664 | |
| | 300,000 | | | Royal Bank of Scotland Group PLC 3 Month US LIBOR + 1.55 (b) | | 4.52 | | 6/25/2024 | | | 312,461 | |
| | 225,000 | | | Santander UK PLC | | 2.88 | | 6/18/2024 | | | 226,337 | |
| | 375,000 | | | Standard Chartered PLC 3 Month US LIBOR + 1.15 (a,b) | | 4.25 | | 1/20/2023 | | | 386,895 | |
| | 250,000 | | | Sumitomo Mitsui Banking Corp. | | 2.45 | | 1/16/2020 | | | 250,054 | |
| | 200,000 | | | UBS AG (a) | | 2.20 | | 6/8/2020 | | | 199,730 | |
| | 325,000 | | | Wells Fargo & Co. | | 3.00 | | 10/23/2026 | | | 328,361 | |
| | 125,000 | | | Wells Fargo & Co. | | 3.55 | | 9/29/2025 | | | 130,583 | |
| | 25,000 | | | Wells Fargo & Co. | | 4.15 | | 1/24/2029 | | | 27,235 | |
| | | | | | | | | | | | 10,246,469 | |
| | | | | BEVERAGES - 1.9% | | | | | | | | |
| | 200,000 | | | Anheuser-Busch Cos. LLC/Anheuser-Busch InBev Worldwide, Inc. | | 4.70 | | 2/1/2036 | | | 219,394 | |
| | 175,000 | | | Anheuser-Busch Cos. LLC/Anheuser-Busch InBev Worldwide, Inc. | | 4.90 | | 2/1/2046 | | | 194,851 | |
| | 158,000 | | | Anheuser-Busch InBev Finance, Inc. | | 3.30 | | 2/1/2023 | | | 163,082 | |
| | 100,000 | | | Anheuser-Busch InBev Worldwide, Inc. | | 4.00 | | 4/13/2028 | | | 108,005 | |
| | 125,000 | | | Anheuser-Busch InBev Worldwide, Inc. | | 4.15 | | 1/23/2025 | | | 135,403 | |
| | 175,000 | | | Anheuser-Busch InBev Worldwide, Inc. | | 4.75 | | 1/23/2029 | | | 198,661 | |
| | 175,000 | | | Constellation Brands, Inc. 3 Month US LIBOR + 0.70 (b) | | 3.22 | | 11/15/2021 | | | 175,088 | |
| | 100,000 | | | Constellation Brands, Inc. | | 3.60 | | 2/15/2028 | | | 103,274 | |
| | 125,000 | | | Constellation Brands, Inc. | | 4.25 | | 5/1/2023 | | | 133,003 | |
| | 200,000 | | | Constellation Brands, Inc. | | 4.40 | | 11/15/2025 | | | 217,835 | |
| | 125,000 | | | Keurig Dr. Pepper, Inc. | | 4.06 | | 5/25/2023 | | | 131,235 | |
| | | | | | | | | | | | 1,779,831 | |
| | | | | BIOTECHNOLOGY - 0.6% | | | | | | | | |
| | 175,000 | | | Amgen, Inc. | | 3.13 | | 5/1/2025 | | | 179,200 | |
| | 310,000 | | | Celgene Corp. | | 3.88 | | 8/15/2025 | | | 332,157 | |
| | 25,000 | | | Celgene Corp. | | 3.90 | | 2/20/2028 | | | 26,790 | |
| | | | | | | | | | | | 538,147 | |
See accompanying notes to financial statements.
Global Atlantic Goldman Sachs Core Fixed Income Portfolio
PORTFOLIO OF INVESTMENTS (Continued)
June 30, 2019 (Unaudited)
| Principal | | | | | | | | | | |
| Amount | | | | | Coupon Rate (%) | | Maturity | | Value | |
| | | | | CHEMICALS - 0.5% | | | | | | | | |
| $ | 325,000 | | | DuPont de Nemours, Inc. | | 4.21 | | 11/15/2023 | | $ | 347,891 | |
| | 100,000 | | | Sherwin-Williams Co. (The) | | 4.50 | | 6/1/2047 | | | 106,660 | |
| | | | | | | | | | | | 454,551 | |
| | | | | COMMERCIAL SERVICES - 0.1% | | | | | | | | |
| | 50,000 | | | S&P Global, Inc. | | 2.95 | | 1/22/2027 | | | 50,657 | |
| | | | | | | | | | | | | |
| | | | | COMPUTERS - 1.0% | | | | | | | | |
| | 200,000 | | | Apple, Inc. | | 2.45 | | 8/4/2026 | | | 199,319 | |
| | 175,000 | | | Apple, Inc. | | 2.75 | | 1/13/2025 | | | 178,906 | |
| | 175,000 | | | Apple, Inc. | | 3.25 | | 2/23/2026 | | | 182,843 | |
| | 150,000 | | | Dell International LLC / EMC Corp. (a) | | 5.45 | | 6/15/2023 | | | 161,669 | |
| | 100,000 | | | Dell International LLC / EMC Corp. (a) | | 6.02 | | 6/15/2026 | | | 110,318 | |
| | 50,000 | | | Hewlett Packard Enterprise Co. | | 4.90 | | 10/15/2025 | | | 54,471 | |
| | 60,000 | | | Hewlett Packard Enterprise Co. | | 6.35 | | 10/15/2045 | | | 66,484 | |
| | | | | | | | | | | | 954,010 | |
| | | | | DIVERSIFIED FINANCIAL SERVICES - 1.6% | | | | | | | | |
| | 175,000 | | | AerCap Ireland Capital DAC/AerCap Global Aviation Trust | | 4.88 | | 1/16/2024 | | | 187,916 | |
| | 175,000 | | | Air Lease Corp. | | 3.75 | | 6/1/2026 | | | 179,266 | |
| | 175,000 | | | American Express Co. | | 3.63 | | 12/5/2024 | | | 183,752 | |
| | 250,000 | | | GE Capital International Funding Co. Unlimited Co. | | 3.37 | | 11/15/2025 | | | 253,076 | |
| | 75,000 | | | Nuveen LLC (a) | | 4.00 | | 11/1/2028 | | | 82,295 | |
| | 575,000 | | | Visa, Inc. | | 3.15 | | 12/14/2025 | | | 603,220 | |
| | | | | | | | | | | | 1,489,525 | |
| | | | | ELECTRIC - 2.1% | | | | | | | | |
| | 50,000 | | | Alliant Energy Finance LLC (a) | | 3.75 | | 6/15/2023 | | | 51,927 | |
| | 175,000 | | | Arizona Public Service Co. | | 2.95 | | 9/15/2027 | | | 176,854 | |
| | 50,000 | | | Berkshire Hathaway Energy Co. | | 3.25 | | 4/15/2028 | | | 51,652 | |
| | 74,000 | | | Berkshire Hathaway Energy Co. | | 6.13 | | 4/1/2036 | | | 99,018 | |
| | 300,000 | | | Dominion Energy, Inc. (d) | | 3.07 | | 8/15/2024 | | | 302,421 | |
| | 25,000 | | | Duke Energy Carolinas LLC | | 3.95 | | 3/15/2048 | | | 26,373 | |
| | 200,000 | | | Duke Energy Corp. | | 3.15 | | 8/15/2027 | | | 202,871 | |
| | 175,000 | | | Entergy Corp. | | 2.95 | | 9/1/2026 | | | 175,289 | |
| | 75,000 | | | MidAmerican Energy Co. | | 3.65 | | 4/15/2029 | | | 80,915 | |
| | 150,000 | | | NRG Energy, Inc. (a) | | 3.75 | | 6/15/2024 | | | 154,104 | |
| | 50,000 | | | Sempra Energy 3 Month US LIBOR + 0.50 (b) | | 3.10 | | 1/15/2021 | | | 49,833 | |
| | 125,000 | | | Sempra Energy | | 3.40 | | 2/1/2028 | | | 124,791 | |
| | 100,000 | | | Southern California Edison Co. | | 4.20 | | 3/1/2029 | | | 106,479 | |
| | 350,000 | | | Southern Co. (The) | | 3.25 | | 7/1/2026 | | | 355,456 | |
| | | | | | | | | | | | 1,957,983 | |
| | | | | ENGINEERING & CONSTRUCTION - 0.2% | | | | | | | | |
| | 200,000 | | | Mexico City Airport Trust (a) | | 3.88 | | 4/30/2028 | | | 193,770 | |
| | | | | | | | | | | | | |
| | | | | ENVIRONMENTAL CONTROL - 0.1% | | | | | | | | |
| | 100,000 | | | Waste Management, Inc. | | 3.20 | | 6/15/2026 | | | 104,026 | |
| | | | | | | | | | | | | |
| | | | | FOOD - 0.7% | | | | | | | | |
| | 375,000 | | | General Mills, Inc. 3 Month US LIBOR + 0.54 (b) | | 3.14 | | 4/16/2021 | | | 375,125 | |
| | 50,000 | | | Mars, Inc. (a) | | 2.70 | | 4/1/2025 | | | 51,017 | |
| | 75,000 | | | Mars, Inc. (a) | | 3.20 | | 4/1/2030 | | | 77,930 | |
| | 125,000 | | | Tyson Foods, Inc. | | 3.90 | | 9/28/2023 | | | 131,720 | |
| | | | | | | | | | | | 635,792 | |
See accompanying notes to financial statements.
Global Atlantic Goldman Sachs Core Fixed Income Portfolio
PORTFOLIO OF INVESTMENTS (Continued)
June 30, 2019 (Unaudited)
| Principal | | | | | | | | | | |
| Amount | | | | | Coupon Rate (%) | | Maturity | | Value | |
| | | | | GAS - 0.6% | | | | | | | | |
| $ | 400,000 | | | NiSource, Inc. | | 3.49 | | 5/15/2027 | | $ | 413,753 | |
| | 125,000 | | | NiSource, Inc. | | 3.65 | | 6/15/2023 | | | 129,493 | |
| | | | | | | | | | | | 543,246 | |
| | | | | HAND/MACHINE TOOLS - 0.1% | | | | | | | | |
| | 125,000 | | | Stanley Black & Decker, Inc. | | 4.25 | | 11/15/2028 | | | 138,857 | |
| | | | | | | | | | | | | |
| | | | | HEALTHCARE-PRODUCTS - 0.2% | | | | | | | | |
| | 200,000 | | | Thermo Fisher Scientific, Inc. | | 3.65 | | 12/15/2025 | | | 210,710 | |
| | | | | | | | | | | | | |
| | | | | HEALTHCARE-SERVICES - 0.4% | | | | | | | | |
| | 225,000 | | | Sutter Health | | 4.09 | | 8/15/2048 | | | 241,869 | |
| | 125,000 | | | UnitedHealth Group, Inc. | | 4.75 | | 7/15/2045 | | | 148,053 | |
| | | | | | | | | | | | 389,922 | |
| | | | | INSURANCE - 1.3% | | | | | | | | |
| | 200,000 | | | AIA Group Ltd. (a) | | 3.20 | | 3/11/2025 | | | 204,250 | |
| | 175,000 | | | American International Group, Inc. | | 3.90 | | 4/1/2026 | | | 183,156 | |
| | 75,000 | | | American International Group, Inc. | | 4.20 | | 4/1/2028 | | | 80,156 | |
| | 150,000 | | | Arch Capital Finance LLC | | 5.03 | | 12/15/2046 | | | 179,076 | |
| | 50,000 | | | Great-West Lifeco Finance 2018 LP (a) | | 4.05 | | 5/17/2028 | | | 54,878 | |
| | 100,000 | | | Marsh & McLennan Cos., Inc. | | 4.38 | | 3/15/2029 | | | 110,330 | |
| | 275,000 | | | MetLife, Inc. | | 3.60 | | 11/13/2025 | | | 292,075 | |
| | 75,000 | | | Principal Financial Group, Inc. | | 3.10 | | 11/15/2026 | | | 75,658 | |
| | 50,000 | | | XLIT Ltd. | | 4.45 | | 3/31/2025 | | | 54,012 | |
| | | | | | | | | | | | 1,233,591 | |
| | | | | INTERNET - 0.8% | | | | | | | | |
| | 100,000 | | | Amazon.com, Inc. | | 3.15 | | 8/22/2027 | | | 105,117 | |
| | 75,000 | | | Amazon.com, Inc. | | 3.88 | | 8/22/2037 | | | 82,697 | |
| | 475,000 | | | Amazon.com, Inc. | | 5.20 | | 12/3/2025 | | | 554,839 | |
| | | | | | | | | | | | 742,653 | |
| | | | | LODGING - 0.1% | | | | | | | | |
| | 100,000 | | | Marriott International, Inc. | | 2.30 | | 1/15/2022 | | | 99,670 | |
| | | | | | | | | | | | | |
| | | | | MACHINERY-DIVERSIFIED - 0.1% | | | | | | | | |
| | 125,000 | | | Roper Technologies, Inc. | | 4.20 | | 9/15/2028 | | | 133,843 | |
| | | | | | | | | | | | | |
| | | | | MEDIA - 1.4% | | | | | | | | |
| | 425,000 | | | Comcast Corp. | | 3.70 | | 4/15/2024 | | | 451,073 | |
| | 325,000 | | | Comcast Corp. | | 4.15 | | 10/15/2028 | | | 358,199 | |
| | 125,000 | | | Comcast Corp. | | 4.25 | | 10/15/2030 | | | 139,502 | |
| | 75,000 | | | Fox Corp. (a) | | 4.03 | | 1/25/2024 | | | 79,774 | |
| | 50,000 | | | Fox Corp. (a) | | 4.71 | | 1/25/2029 | | | 55,937 | |
| | 200,000 | | | Walt Disney Co. (The) (a) | | 3.70 | | 9/15/2024 | | | 212,850 | |
| | 25,000 | | | Walt Disney Co. (The) (a) | | 6.15 | | 3/1/2037 | | | 33,965 | |
| | | | | | | | | | | | 1,331,300 | |
| | | | | MINING - 0.3% | | | | | | | | |
| | 250,000 | | | Glencore Funding LLC (a) | | 4.63 | | 4/29/2024 | | | 263,933 | |
| | | | | | | | | | | | | |
| | | | | MISCELLANEOUS MANUFACTURING - 0.1% | | | | | | | | |
| | 25,000 | | | General Electric Co. | | 2.70 | | 10/9/2022 | | | 24,972 | |
| | 75,000 | | | General Electric Co. | | 3.10 | | 1/9/2023 | | | 75,663 | |
| | | | | | | | | | | | 100,635 | |
See accompanying notes to financial statements.
Global Atlantic Goldman Sachs Core Fixed Income Portfolio
PORTFOLIO OF INVESTMENTS (Continued)
June 30, 2019 (Unaudited)
| Principal | | | | | | | | | | |
| Amount | | | | | Coupon Rate (%) | | Maturity | | Value | |
| | | | | OIL & GAS - 0.9% | | | | | | | | |
| $ | 25,000 | | | BP Capital Markets America, Inc. | | 3.22 | | 4/14/2024 | | $ | 25,888 | |
| | 75,000 | | | BP Capital Markets America, Inc. | | 3.41 | | 2/11/2026 | | | 78,601 | |
| | 100,000 | | | BP Capital Markets America, Inc. | | 4.23 | | 11/6/2028 | | | 110,699 | |
| | 175,000 | | | BP Capital Markets PLC | | 3.72 | | 11/28/2028 | | | 187,073 | |
| | 75,000 | | | Marathon Petroleum Corp. | | 3.63 | | 9/15/2024 | | | 77,635 | |
| | 50,000 | | | Marathon Petroleum Corp. | | 3.80 | | 4/1/2028 | | | 50,820 | |
| | 150,000 | | | Phillips 66 Co. | | 3.90 | | 3/15/2028 | | | 157,615 | |
| | 125,000 | | | Pioneer Natural Resources Co. | | 3.95 | | 7/15/2022 | | | 130,046 | |
| | | | | | | | | | | | 818,377 | |
| | | | | OIL & GAS SERVICES - 0.1% | | | | | | | | |
| | 75,000 | | | Halliburton Co. | | 3.80 | | 11/15/2025 | | | 78,640 | |
| | | | | | | | | | | | | |
| | | | | PHARMACEUTICALS - 1.3% | | | | | | | | |
| | 125,000 | | | AbbVie, Inc. | | 3.75 | | 11/14/2023 | | | 130,141 | |
| | 400,000 | | | Cigna Corp. (a) | | 3.75 | | 7/15/2023 | | | 416,453 | |
| | 125,000 | | | CVS Health Corp. | | 3.88 | | 7/20/2025 | | | 130,522 | |
| | 125,000 | | | CVS Health Corp. | | 4.78 | | 3/25/2038 | | | 130,397 | |
| | 50,000 | | | CVS Health Corp. | | 5.05 | | 3/25/2048 | | | 53,256 | |
| | 100,000 | | | CVS Health Corp. | | 5.13 | | 7/20/2045 | | | 106,641 | |
| | 100,000 | | | McKesson Corp. | | 2.85 | | 3/15/2023 | | | 100,757 | |
| | 150,000 | | | Pfizer, Inc. | | 3.45 | | 3/15/2029 | | | 158,785 | |
| | | | | | | | | | | | 1,226,952 | |
| | | | | PIPELINES - 1.8% | | | | | | | | |
| | 175,000 | | | Energy Transfer Operating LP | | 4.20 | | 9/15/2023 | | | 183,470 | |
| | 100,000 | | | Energy Transfer Operating LP | | 5.25 | | 4/15/2029 | | | 111,734 | |
| | 50,000 | | | Energy Transfer Operating LP | | 5.30 | | 4/15/2047 | | | 52,153 | |
| | 300,000 | | | Enterprise Products Operating LLC | | 3.70 | | 2/15/2026 | | | 317,512 | |
| | 25,000 | | | Kinder Morgan Energy Partners LP | | 5.40 | | 9/1/2044 | | | 27,705 | |
| | 100,000 | | | MPLX LP | | 4.50 | | 4/15/2038 | | | 100,961 | |
| | 25,000 | | | MPLX LP | | 4.70 | | 4/15/2048 | | | 25,601 | |
| | 50,000 | | | MPLX LP | | 4.80 | | 2/15/2029 | | | 55,070 | |
| | 100,000 | | | Sabine Pass Liquefaction LLC | | 5.00 | | 3/15/2027 | | | 109,646 | |
| | 100,000 | | | Sabine Pass Liquefaction LLC | | 5.63 | | 4/15/2023 | | | 108,917 | |
| | 275,000 | | | Sabine Pass Liquefaction LLC | | 5.63 | | 3/1/2025 | | | 308,020 | |
| | 100,000 | | | Sunoco Logistics Partners Operations LP | | 5.40 | | 10/1/2047 | | | 106,210 | |
| | 175,000 | | | Williams Cos., Inc. (The) | | 4.00 | | 9/15/2025 | | | 185,189 | |
| | | | | | | | | | | | 1,692,188 | |
| | | | | REAL ESTATE INVESTMENT TRUSTS - 1.8% | | | | | | | | |
| | 75,000 | | | Alexandria Real Estate Equities, Inc. | | 3.80 | | 4/15/2026 | | | 78,840 | |
| | 175,000 | | | American Homes 4 Rent LP | | 4.90 | | 2/15/2029 | | | 190,528 | |
| | 200,000 | | | American Tower Corp. | | 3.38 | | 5/15/2024 | | | 205,740 | |
| | 75,000 | | | Camden Property Trust | | 3.15 | | 7/1/2029 | | | 76,195 | |
| | 100,000 | | | Crown Castle International Corp. | | 3.15 | | 7/15/2023 | | | 101,937 | |
| | 75,000 | | | Crown Castle International Corp. | | 3.65 | | 9/1/2027 | | | 77,234 | |
| | 75,000 | | | CubeSmart LP | | 4.38 | | 12/15/2023 | | | 79,321 | |
| | 150,000 | | | Federal Realty Investment Trust | | 3.25 | | 7/15/2027 | | | 153,123 | |
| | 100,000 | | | Kilroy Realty LP | | 4.75 | | 12/15/2028 | | | 111,121 | |
| | 100,000 | | | Public Storage | | 3.39 | | 5/1/2029 | | | 104,450 | |
| | 350,000 | | | VEREIT Operating Partnership LP | | 4.63 | | 11/1/2025 | | | 376,902 | |
| | 75,000 | | | VEREIT Operating Partnership LP | | 4.88 | | 6/1/2026 | | | 81,104 | |
| | 75,000 | | | WP Carey, Inc. | | 3.85 | | 7/15/2029 | | | 75,790 | |
| | | | | | | | | | | | 1,712,285 | |
See accompanying notes to financial statements.
Global Atlantic Goldman Sachs Core Fixed Income Portfolio
PORTFOLIO OF INVESTMENTS (Continued)
June 30, 2019 (Unaudited)
| Principal | | | | | | | | | | |
| Amount | | | | | Coupon Rate (%) | | Maturity | | Value | |
| | | | | RETAIL - 0.6% | | | | | | | | |
| $ | 50,000 | | | Alimentation Couche-Tard, Inc. (a) | | 3.55 | | 7/26/2027 | | $ | 51,011 | |
| | 75,000 | | | Dollar Tree, Inc. | | 4.00 | | 5/15/2025 | | | 78,180 | |
| | 125,000 | | | Dollar Tree, Inc. | | 4.20 | | 5/15/2028 | | | 129,452 | |
| | 50,000 | | | Home Depot, Inc. (The) | | 3.90 | | 12/6/2028 | | | 55,026 | |
| | 150,000 | | | Starbucks Corp. | | 3.80 | | 8/15/2025 | | | 160,085 | |
| | 75,000 | | | Walmart, Inc. | | 4.05 | | 6/29/2048 | | | 85,934 | |
| | | | | | | | | | | | 559,688 | |
| | | | | SEMICONDUCTORS - 1.3% | | | | | | | | |
| | 225,000 | | | Broadcom Corp. / Broadcom Cayman Finance Ltd. | | 3.13 | | 1/15/2025 | | | 219,894 | |
| | 240,000 | | | Broadcom Corp. / Broadcom Cayman Finance Ltd. | | 3.63 | | 1/15/2024 | | | 242,273 | |
| | 225,000 | | | Broadcom, Inc. (a) | | 3.13 | | 10/15/2022 | | | 226,417 | |
| | 150,000 | | | Broadcom, Inc. (a) | | 3.63 | | 10/15/2024 | | | 150,746 | |
| | 125,000 | | | Broadcom, Inc. (a) | | 4.25 | | 4/15/2026 | | | 126,859 | |
| | 75,000 | | | Microchip Technology, Inc. | | 3.92 | | 6/1/2021 | | | 76,346 | |
| | 75,000 | | | NVIDIA Corp. | | 3.20 | | 9/16/2026 | | | 76,718 | |
| | 75,000 | | | NXP BV/NXP Funding LLC/NXP USA, Inc. (a) | | 3.88 | | 6/18/2026 | | | 77,081 | |
| | | | | | | | | | | | 1,196,334 | |
| | | | | SOFTWARE - 0.7% | | | | | | | | |
| | 150,000 | | | Fiserv, Inc. | | 2.75 | | 7/1/2024 | | | 151,337 | |
| | 150,000 | | | Fiserv, Inc. | | 3.20 | | 7/1/2026 | | | 153,102 | |
| | 50,000 | | | Fiserv, Inc. | | 3.80 | | 10/1/2023 | | | 52,595 | |
| | 100,000 | | | Fiserv, Inc. | | 4.20 | | 10/1/2028 | | | 108,258 | |
| | 150,000 | | | Microsoft Corp. | | 3.70 | | 8/8/2046 | | | 162,125 | |
| | | | | | | | | | | | 627,417 | |
| | | | | SOVEREIGN - 2.4% | | | | | | | | |
| | 440,000 | | | Abu Dhabi Government International Bond | | 3.13 | | 10/11/2027 | | | 456,425 | |
| | 670,000 | | | Kuwait Government International Bond | | 3.50 | | 3/20/2027 | | | 713,181 | |
| | 100,000 | | | Mexico Government International Bond | | 1.63 | | 4/8/2026 | | | 116,727 | |
| | 520,000 | | | Perusahaan Penerbit SBSN Indonesia III | | 4.55 | | 3/29/2026 | | | 555,428 | |
| | 200,000 | | | Qatar Government International Bond (a) | | 4.50 | | 4/23/2028 | | | 223,649 | |
| | 200,000 | | | Qatar Government International Bond (a) | | 5.10 | | 4/23/2048 | | | 238,250 | |
| | | | | | | | | | | | 2,303,660 | |
| | | | | TELECOMMUNICATIONS - 1.9% | | | | | | | | |
| | 100,000 | | | AT&T, Inc. | | 3.20 | | 3/1/2022 | | | 102,129 | |
| | 100,000 | | | AT&T, Inc. | | 3.40 | | 5/15/2025 | | | 102,801 | |
| | 225,000 | | | AT&T, Inc. | | 3.60 | | 2/17/2023 | | | 233,536 | |
| | 150,000 | | | AT&T, Inc. | | 4.25 | | 3/1/2027 | | | 160,768 | |
| | 50,000 | | | AT&T, Inc. | | 4.90 | | 8/15/2037 | | | 53,892 | |
| | 125,000 | | | AT&T, Inc. | | 5.25 | | 3/1/2037 | | | 140,288 | |
| | 25,000 | | | Verizon Communications, Inc. | | 3.38 | | 2/15/2025 | | | 26,095 | |
| | 75,000 | | | Verizon Communications, Inc. | | 3.88 | | 2/8/2029 | | | 80,447 | |
| | 25,000 | | | Verizon Communications, Inc. (a) | | 4.02 | | 12/3/2029 | | | 27,069 | |
| | 313,000 | | | Verizon Communications, Inc. | | 4.33 | | 9/21/2028 | | | 346,865 | |
| | 100,000 | | | Verizon Communications, Inc. | | 5.01 | | 4/15/2049 | | | 119,099 | |
| | 100,000 | | | Verizon Communications, Inc. | | 5.25 | | 3/16/2037 | | | 119,613 | |
| | 275,000 | | | Vodafone Group PLC | | 3.75 | | 1/16/2024 | | | 287,523 | |
| | | | | | | | | | | | 1,800,125 | |
| | | | | TRANSPORTATION - 0.1% | | | | | | | | |
| | 75,000 | | | Burlington Northern Santa Fe LLC | | 3.25 | | 6/15/2027 | | | 78,884 | |
| | 25,000 | | | FedEx Corp. | | 3.40 | | 2/15/2028 | | | 25,761 | |
| | | | | | | | | | | | 104,645 | |
See accompanying notes to financial statements.
Global Atlantic Goldman Sachs Core Fixed Income Portfolio
PORTFOLIO OF INVESTMENTS (Continued)
June 30, 2019 (Unaudited)
| Principal | | | | | | | | | | |
| Amount | | | | | Coupon Rate (%) | | Maturity | | Value | |
| | | | | TRUCKING & LEASING - 0.1% | | | | | | | | |
| $ | 75,000 | | | Avolon Holdings Funding Ltd. (a) | | 3.95 | | 7/1/2024 | | $ | 76,843 | |
| | | | | | | | | | | | | |
| | | | | TOTAL CORPORATE BONDS & NOTES (Cost - $36,481,878) | | | | | 38,379,698 | |
| | | | | | | | | | | | | |
| | | | | MUNICIPAL BONDS - 1.4% | | | | | | | | |
| | 480,000 | | | City of Chicago, IL | | 7.75 | | 1/1/2042 | | | 618,249 | |
| | 25,000 | | | New Jersey Turnpike Authority | | 7.10 | | 1/1/2041 | | | 37,628 | |
| | 175,000 | | | State of California | | 7.60 | | 11/1/2040 | | | 283,969 | |
| | 325,000 | | | State of Illinois | | 5.10 | | 6/1/2033 | | | 342,251 | |
| | | | | TOTAL MUNICIPAL BONDS (Cost - $1,222,648) | | | | | | | 1,282,097 | |
| | | | | | | | | | | | | |
| | | | | MORTGAGE BACKED SECURITIES - 32.5% | | | | | | | | |
| | 725,464 | | | Fannie Mae Pool | | 4.50 | | 6/1/2031 | | | 772,330 | |
| | 1,000,000 | | | Fannie Mae Pool TBA +^ | | 3.50 | | 6/25/2046 | | | 1,022,344 | |
| | 1,000,000 | | | Fannie Mae Pool TBA +^ | | 4.00 | | 5/25/2046 | | | 1,033,438 | |
| | 4,000,000 | | | Fannie Mae Pool TBA +^ | | 4.50 | | 9/25/2044 | | | 4,179,375 | |
| | 360,000 | | | Federal Farm Credit Banks | | 3.29 | | 1/25/2030 | | | 389,317 | |
| | 910,000 | | | Federal Farm Credit Banks | | 3.43 | | 12/6/2028 | | | 994,027 | |
| | 230,000 | | | Federal Farm Credit Banks | | 5.27 | | 5/1/2029 | | | 288,605 | |
| | 1,000,000 | | | Ginnie Mae Pool TBA +^ | | 3.50 | | 12/20/2046 | | | 1,031,992 | |
| | 8,000,000 | | | Ginnie Mae Pool TBA +^ | | 4.50 | | 10/20/2044 | | | 8,337,500 | |
| | 806,712 | | | Ginnie Mae Pool | | 4.50 | | 2/20/2048 | | | 847,684 | |
| | 1,003,141 | | | Ginnie Mae Pool | | 4.50 | | 5/20/2048 | | | 1,045,433 | |
| | 1,248,998 | | | Ginnie Mae Pool | | 4.50 | | 8/20/2048 | | | 1,304,799 | |
| | 5,913,383 | | | Ginnie Mae Pool | | 4.50 | | 9/20/2048 | | | 6,162,694 | |
| | 127,617 | | | Ginnie Mae Pool | | 5.00 | | 11/20/2048 | | | 133,425 | |
| | 1,831,666 | | | Ginnie Mae Pool | | 5.00 | | 1/20/2049 | | | 1,913,781 | |
| | 985,531 | | | Ginnie Mae Pool | | 5.00 | | 2/20/2049 | | | 1,035,055 | |
| | | | | TOTAL MORTGAGE BACKED SECURITIES (Cost - $30,288,718) | | | | | 30,491,799 | |
| | | | | | | | | | | | | |
| | | | | U.S. TREASURY SECURITIES - 17.0% | | | | | | | | |
| | 210,000 | | | United States Treasury Bond | | 2.75 | | 11/15/2042 | | | 220,139 | |
| | 4,930,000 | | | United States Treasury Bond | | 3.00 | | 5/15/2047 | | | 5,399,313 | |
| | 220,000 | | | United States Treasury Bond | | 3.13 | | 11/15/2041 | | | 246,228 | |
| | 260,000 | | | United States Treasury Inflation Indexed Note | | 0.75 | | 7/15/2028 | | | 275,771 | |
| | 3,610,000 | | | United States Treasury Note | | 2.13 | | 9/30/2024 | | | 3,671,201 | |
| | 290,000 | | | United States Treasury Note | | 2.25 | | 2/15/2027 | | | 297,182 | |
| | 5,310,000 | | | United States Treasury Note | | 2.75 | | 6/30/2025 | | | 5,588,152 | |
| | 200,000 | | | United States Treasury Note | | 2.88 | | 8/15/2028 | | | 214,922 | |
| | | | | TOTAL U.S. TREASURY SECURITIES (Cost - $14,721,066) | | | | | 15,912,908 | |
| | | | | | | | | | | | | |
| | | | | SHORT-TERM INVESTMENTS - 15.9% | | | | | | | | |
| | | | | COMMERCIAL PAPER - 1.1% | | | | | | | | |
| | 350,000 | | | VW Credit, Inc. | | 2.73 | | 12/6/2019 | | | 345,880 | |
| | 700,000 | | | VW Credit, Inc. | | 2.86 | | 3/30/2020 | | | 685,280 | |
| | | | | | | | | | | | 1,031,160 | |
| Shares | | | | | | | | | | | |
| | | | | MONEY MARKET FUND - 14.8% | | | | | | | | |
| | 13,855,245 | | | Fidelity Investments Money Market - Government Portfolio, Institutional Class to yield 2.25% (c) | | | 13,855,245 | |
| | | | | | | | | | | | | |
| | | | | TOTAL SHORT-TERM INVESTMENTS (Cost - $14,886,745) | | | | | 14,886,405 | |
See accompanying notes to financial statements.
Global Atlantic Goldman Sachs Core Fixed Income Portfolio
PORTFOLIO OF INVESTMENTS (Continued)
June 30, 2019 (Unaudited)
| | | | | TOTAL INVESTMENTS - 115.4% (Cost - $104,990,922) | | $ | 108,219,446 | |
| | | | | OTHER ASSETS LESS LIABILITIES - NET - (15.4)% | | | (14,405,037 | ) |
| | | | | TOTAL NET ASSETS - 100.0% | | $ | 93,814,409 | |
| | LIBOR- London Interbank Offered Rate |
| | REIT- Real Estate Investments Trusts |
| | TBA- To Be Announced Security |
| + | All or a portion of these TBAs are subject to dollar-roll transactions. |
| (a) | 144(a) - Security was purchased pursuant to Rule 144a under the Securities Act of 1933 and may not be resold subject to that rule, except to qualified institutional buyers. As of June 30, 2019, these securities amounted to $10,447,243 or 12.5% of net assets. |
| (b) | Variable Rate Security - interest rate subject to periodic change. |
| | | | Benchmark | | | Rate | |
| | | | | | 1 Month US LIBOR | | | | 2.40 | % |
| | | | | | 3 Month US LIBOR | | | | 2.32 | % |
| | | | | | 3 Month GBP LIBOR | | | | 0.77 | % |
| (c) | Money market rate shown represents the rate at June 30, 2019. |
See accompanying notes to financial statements.
Global Atlantic Goldman Sachs Core Fixed Income Portfolio
PORTFOLIO OF INVESTMENTS (Continued)
June 30, 2019 (Unaudited)
| | | Number of | | | | | | | | | Unrealized Appreciation/ | |
| Description | | Contracts | | Expiration Date | | Counterparty | | Notional Amount | | | (Depreciation) | |
| SHORT | | | | | | | | | | | | | | |
| Euro 90 Day Eurodollar Future | | 2 | | Sep-19 | | Morgan Stanley | | $ | 489,975 | | | $ | (3,975 | ) |
| Euro 90 Day Eurodollar Future | | 1 | | Mar-20 | | Morgan Stanley | | | 245,725 | | | | (1,575 | ) |
| Euro 90 Day Eurodollar Future | | 4 | | Jun-20 | | Morgan Stanley | | | 983,800 | | | | (6,720 | ) |
| Euro 90 Day Eurodollar Future | | 1 | | Dec-20 | | Morgan Stanley | | | 246,113 | | | | (1,359 | ) |
| Euro-Bobl Future | | 1 | | Sep-19 | | Morgan Stanley | | | 153,100 | | | | (416 | ) |
| Euro Oat Future | | 4 | | Sep-19 | | Morgan Stanley | | | 751,016 | | | | (11,545 | ) |
| Long Gilt Future | | 2 | | Sep-19 | | Morgan Stanley | | | 331,666 | | | | 318 | |
| U.S. 10 Year Note Future | | 56 | | Sep-19 | | Morgan Stanley | | | 7,166,250 | | | | (110,440 | ) |
| U.S. 10 Year Ultra Future | | 9 | | Sep-19 | | Morgan Stanley | | | 1,243,125 | | | | (23,826 | ) |
| | | | | | | | | | | | | | (159,538 | ) |
| LONG | | | | | | | | | | | | | | |
| Australian 3 Year Bond Future | | 2 | | Sep-19 | | Morgan Stanley | | | 161,399 | | | | (237 | ) |
| Australian 10 Year Bond Future | | 2 | | Sep-19 | | Morgan Stanley | | | 201,613 | | | | (448 | ) |
| Euro BTP Future | | 1 | | Sep-19 | | Morgan Stanley | | | 152,941 | | | | 6,303 | |
| Euro-Bond Future | | 2 | | Sep-19 | | Morgan Stanley | | | 393,433 | | | | 3,833 | |
| U.S. 2 Year Note Future | | 56 | | Sep-19 | | Morgan Stanley | | | 12,050,063 | | | | 71,980 | |
| U.S. 5 Year Note Future | | 59 | | Sep-19 | | Morgan Stanley | | | 6,971,219 | | | | 78,338 | |
| U.S. Long Bond Future | | 54 | | Sep-19 | | Morgan Stanley | | | 8,402,063 | | | | 199,112 | |
| U.S. Ultra Bond Future | | 1 | | Sep-19 | | Morgan Stanley | | | 177,563 | | | | 2,396 | |
| | | | | | | | | | | | | | 361,277 | |
| TOTAL NET UNREALIZED APPRECIATION OF FUTURES CONTRACTS | | | $ | 201,739 | |
See accompanying notes to financial statements.
Global Atlantic Goldman Sachs Core Fixed Income Portfolio
PORTFOLIO OF INVESTMENTS (Continued)
June 30, 2019 (Unaudited)
INTEREST RATE SWAPS
| | | | | | | | | | | | | | | | | Premiums | | | Unrealized | |
| | | | | Pay/Receive | | | | Expiration | | Notional | | | | | | Paid/ | | | Appreciation/ | |
| Counterparty | | Floating Rate Index | | Floating Rate | | Fixed Rate | | Date | | Amount | | | Value | | | (Received) | | | (Depreciation) | |
| Credit Suisse | | 3 Month New Zealand Bank Bill Rate* | | Pay | | 1.50% | | 9/18/2021 | | | 3,800,000 | | | $ | 4,084 | | | $ | — | | | $ | 4,084 | |
| Credit Suisse | | 3 Month STIBOR* | | Receive | | 0.25% | | 9/18/2024 | | | 25,370,000 | | | | (6,874 | ) | | | — | | | | (6,874 | ) |
| Credit Suisse | | 3 Month STIBOR* | | Receive | | 0.75% | | 9/18/2029 | | | 810,000 | | | | (629 | ) | | | — | | | | (629 | ) |
| Credit Suisse | | 3 Month STIBOR* | | Pay | | 1.05% | | 7/8/2028 | | | 600,000 | | | | 28,117 | | | | — | | | | 28,117 | |
| Credit Suisse | | 3 Month STIBOR* | | Pay | | 1.10% | | 8/1/2023 | | | 100,000 | | | | (1,826 | ) | | | — | | | | (1,826 | ) |
| Credit Suisse | | 3 Month USD LIBOR* | | Receive | | 1.75% | | 9/18/2021 | | | 1,890,000 | | | | (3,370 | ) | | | — | | | | (3,370 | ) |
| Credit Suisse | | 3 Month USD LIBOR* | | Receive | | 2.00% | | 9/18/2024 | | | 1,430,000 | | | | (3,722 | ) | | | — | | | | (3,722 | ) |
| Credit Suisse | | 3 Month USD LIBOR* | | Pay | | 2.50% | | 5/20/2029 | | | 2,670,000 | | | | 28,728 | | | | — | | | | 28,728 | |
| Credit Suisse | | 3 Month USD LIBOR* | | Pay | | 2.80% | | 8/12/2024 | | | 810,000 | | | | 20,993 | | | | — | | | | 20,993 | |
| Credit Suisse | | 6 Month Bank Bill Swap Rate** | | Pay | | 1.75% | | 9/18/2026 | | | 420,000 | | | | 3,410 | | | | — | | | | 3,410 | |
| Credit Suisse | | 6 Month Bank Bill Swap Rate** | | Pay | | 2.00% | | 9/18/2029 | | | 540,000 | | | | (1,186 | ) | | | — | | | | (1,186 | ) |
| Credit Suisse | | 6 Month EUR LIBOR** | | Pay | | 0.50% | | 9/18/2024 | | | 2,990,000 | | | | 16,877 | | | | — | | | | 16,877 | |
| Credit Suisse | | 6 Month EUR LIBOR** | | Receive | | 0.90% | | 5/20/2029 | | | 2,680,000 | | | | (38,260 | ) | | | — | | | | (38,260 | ) |
| Credit Suisse | | 6 Month EUR LIBOR** | | Receive | | 1.00% | | 9/18/2029 | | | 100,000 | | | | (1,496 | ) | | | — | | | | (1,496 | ) |
| Credit Suisse | | 6 Month EUR LIBOR** | | Pay | | 1.20% | | 2/12/2029 | | | 770,000 | | | | 24,145 | | | | — | | | | 24,145 | |
| Credit Suisse | | 6 Month EUR LIBOR** | | Pay | | 1.20% | | 2/21/2029 | | | 500,000 | | | | 13,665 | | | | — | | | | 13,665 | |
| Credit Suisse | | 6 Month EUR LIBOR** | | Receive | | 1.90% | | 3/8/2028 | | | 380,000 | | | | (11,004 | ) | | | — | | | | (11,004 | ) |
| Credit Suisse | | 6 Month GBP LIBOR** | | Receive | | 1.50% | | 2/12/2029 | | | 1,170,000 | | | | (21,612 | ) | | | — | | | | (21,612 | ) |
| Credit Suisse | | 6 Month GBP LIBOR** | | Receive | | 1.50% | | 9/18/2026 | | | 200,000 | | | | 273 | | | | — | | | | 273 | |
| Credit Suisse | | 6 Month GBP LIBOR** | | Receive | | 1.50% | | 9/18/2029 | | | 200,000 | | | | 402 | | | | — | | | | 402 | |
| Credit Suisse | | 6 Month NOK LIBOR ** | | Receive | | 1.80% | | 9/18/2029 | | | 1,440,000 | | | | 435 | | | | — | | | | 435 | |
| Credit Suisse | | 6 Month NOK LIBOR** | | Receive | | 2.30% | | 2/21/2029 | | | 5,440,000 | | | | (9,337 | ) | | | — | | | | (9,337 | ) |
| Credit Suisse | | Canadian Dollar Offered Rate** | | Pay | | 2.75% | | 9/18/2024 | | | 1,980,000 | | | | 1,242 | | | | — | | | | 1,242 | |
| Credit Suisse | | Sterling Over Night Index Average+ | | Receive | | 0.73% | | 7/11/2019 | | | 4,340,000 | | | | (256 | ) | | | — | | | | (256 | ) |
| Credit Suisse | | U.S. Federal Funds Effective Rate* | | Receive | | 1.39% | | 11/30/2023 | | | 200,000 | | | | 55 | | | | — | | | | 55 | |
| | | | | | | | | | | | | | | | | | | $ | — | | | $ | 42,854 | |
CREDIT DEFAULT SWAPS*
| | | | | | | | | | | | | | | | | | Premiums | | | Unrealized | |
| | | | | Buy/Sell | | Fixed Rate | | Fixed Rate | | Expiration | | Notional | | | | | Paid/ | | | Appreciation/ | |
| Counterparty | | Index | | Protection | | Received | | Paid | | Date | | Amount | | Value | | | (Received) | | | (Depreciation) | |
| JPMorgan | | ITRAXX Europe Series 31^ | | Buy | | — | | 1.00% | | 6/20/2024 | | 260,000 | | | (2,721 | ) | | $ | — | | | $ | (2,721 | ) |
| JPMorgan | | North American Investment Grade CDX Index Series 32# | | Sell | | 1.00% | | — | | 6/20/2024 | | 2,165,000 | | | 11,181 | | | | — | | | | 11,181 | |
| Credit Suisse | | Prudential Financial, Inc. | | Sell | | 1.00% | | — | | 6/20/2024 | | 175,000 | | | 638 | | | | — | | | | 638 | |
| Credit Suisse | | Republic of Indonesia | | Sell | | 1.00% | | — | | 6/20/2024 | | 10,000 | | | 58 | | | | — | | | | 58 | |
| JPMorgan | | The Boeing Company | | Sell | | 1.00% | | — | | 6/20/2024 | | $100,000 | | $ | 529 | | | | — | | | | 529 | |
| | | | | | | | | | | | | | | | | | | $ | — | | | $ | 9,685 | |
| | | | | | | | | | | | | | | | | | | | | | | | | |
| | | | | | | | | | | | | | | | | | | $ | — | | | $ | 52,539 | |
| ^ | The underlying holdings of Series 31 this index can be found at http://www.markit.com/Company/Files/DownloadFiles?CMSID=7585b1678acd4444b53de0b787623ceb. |
| # | The underlying holdings of version 32 of this index can be found at http://www.markit.com/Company/Files/DownloadFiles?CMSID=aa422146a2ab490ebbcbc822e7f121d5. |
| Benchmark | Rate |
| 3 Month EUR LIBOR | -0.34% |
| 3 Month GBP LIBOR | 0.84% |
| 3 Month STIBOR | 0.01% |
| 3 Month USD LIBOR | 2.60% |
| 6 Month EUR EURIBOR | -0.23% |
| 6 Month JPY LIBOR | 0.00% |
| 6 Month NOK LIBOR | 1.34% |
| Canadian Dollar Offered Rate | 2.31% |
| NZD 3 Month Bank Bill Benchmark Rate | 1.97% |
See accompanying notes to financial statements.
Global Atlantic Goldman Sachs Core Fixed Income Portfolio
PORTFOLIO OF INVESTMENTS (Continued)
June 30, 2019 (Unaudited)
Forward Foreign Currency Contracts
| Settlement | | | | Currency Units to | | | | | | | | Unrealized Appreciation/ | |
| Date | | Counterparty | | Receive | | | | In Exchange For | | (Depreciation) | |
| 7/8/2019 | | Morgan Stanley | | 47,887 | | GBP | | 60,689 | | USD | | $ | 276 | |
| 7/8/2019 | | Morgan Stanley | | 1,199,376 | | USD | | 912,684 | | GBP | | | 37,439 | |
| 7/10/2019 | | Morgan Stanley | | 112,313 | | USD | | 99,712 | | EUR | | | (1,316 | ) |
| 9/18/2019 | | Morgan Stanley | | 69,946 | | AUD | | 47,954 | | CHF | | | (335 | ) |
| 9/18/2019 | | Morgan Stanley | | 1,552,104 | | AUD | | 1,082,479 | | USD | | | 9,326 | |
| 9/18/2019 | | Morgan Stanley | | 119,261 | | AUD | | 83,168 | | USD | | | 724 | |
| 9/18/2019 | | Morgan Stanley | | 50,231 | | AUD | | 34,485 | | USD | | | 849 | |
| 9/18/2019 | | Morgan Stanley | | 343,163 | | CAD | | 259,272 | | USD | | | 3,716 | |
| 9/18/2019 | | Morgan Stanley | | 769,811 | | CAD | | 581,727 | | USD | | | 8,229 | |
| 9/18/2019 | | Morgan Stanley | | 96,450 | | CAD | | 72,039 | | USD | | | 1,878 | |
| 9/18/2019 | | Morgan Stanley | | 189,388 | | CAD | | 143,909 | | USD | | | 1,231 | |
| 9/18/2019 | | Morgan Stanley | | 83,441 | | CAD | | 63,376 | | USD | | | 570 | |
| 9/18/2019 | | Morgan Stanley | | 83,479 | | CAD | | 63,460 | | USD | | | 515 | |
| 9/18/2019 | | Morgan Stanley | | 237,067 | | CAD | | 181,335 | | USD | | | 344 | |
| 9/18/2019 | | Morgan Stanley | | 29,353 | | EUR | | 26,180 | | GBP | | | 199 | |
| 9/18/2019 | | Morgan Stanley | | 64,026 | | EUR | | 621,446 | | NOK | | | 321 | |
| 9/18/2019 | | Morgan Stanley | | 33,183 | | EUR | | 322,542 | | NOK | | | 112 | |
| 9/18/2019 | | Morgan Stanley | | 76,991 | | EUR | | 748,079 | | NOK | | | 293 | |
| 9/18/2019 | | Morgan Stanley | | 38,124 | | EUR | | 370,460 | | NOK | | | 142 | |
| 9/18/2019 | | Morgan Stanley | | 71,947 | | EUR | | 765,510 | | SEK | | | (527 | ) |
| 9/18/2019 | | Morgan Stanley | | 126,950 | | EUR | | 143,683 | | USD | | | 1,796 | |
| 9/18/2019 | | Morgan Stanley | | 64,040 | | EUR | | 72,910 | | USD | | | 477 | |
| 9/18/2019 | | Morgan Stanley | | 38,531 | | GBP | | 64,589 | | CAD | | | (287 | ) |
| 9/18/2019 | | Morgan Stanley | | 57,052 | | GBP | | 64,052 | | EUR | | | (533 | ) |
| 9/18/2019 | | Morgan Stanley | | 57,294 | | GBP | | 64,072 | | EUR | | | (248 | ) |
| 9/18/2019 | | Morgan Stanley | | 114,059 | | GBP | | 128,058 | | EUR | | | (1,073 | ) |
| 9/18/2019 | | Morgan Stanley | | 57,318 | | GBP | | 63,936 | | EUR | | | (61 | ) |
| 9/18/2019 | | Morgan Stanley | | 36,131 | | GBP | | 423,952 | | SEK | | | 193 | |
| 9/18/2019 | | Morgan Stanley | | 136,022 | | GBP | | 173,084 | | USD | | | 645 | |
| 9/18/2019 | | Morgan Stanley | | 43,431 | | GBP | | 54,602 | | USD | | | 868 | |
| 9/18/2019 | | Morgan Stanley | | 31,565 | | GBP | | 40,330 | | USD | | | (16 | ) |
| 9/18/2019 | | Morgan Stanley | | 14,497,034 | | JPY | | 134,573 | | USD | | | 773 | |
| 9/18/2019 | | Morgan Stanley | | 7,745,400 | | JPY | | 71,936 | | USD | | | 375 | |
| 9/18/2019 | | Morgan Stanley | | 15,373,985 | | JPY | | 143,020 | | USD | | | 512 | |
| 9/18/2019 | | Morgan Stanley | | 5,855,542 | | JPY | | 54,688 | | USD | | | (20 | ) |
| 9/18/2019 | | Morgan Stanley | | 748,079 | | NOK | | 76,067 | | EUR | | | 766 | |
See accompanying notes to financial statements.
Global Atlantic Goldman Sachs Core Fixed Income Portfolio
PORTFOLIO OF INVESTMENTS (Continued)
June 30, 2019 (Unaudited)
Forward Foreign Currency Contracts
| Settlement | | | | Currency Units to | | | | | | | | Unrealized Appreciation | |
| Date | | Counterparty | | Receive | | | | In Exchange For | | (Depreciation) | |
| 9/18/2019 | | Morgan Stanley | | 3,584,706 | | NOK | | 365,525 | | EUR | | $ | 2,499 | |
| 9/18/2019 | | Morgan Stanley | | 628,439 | | NOK | | 63,965 | | EUR | | | 571 | |
| 9/18/2019 | | Morgan Stanley | | 628,255 | | NOK | | 63,975 | | EUR | | | 538 | |
| 9/18/2019 | | Morgan Stanley | | 269,257 | | NOK | | 31,730 | | USD | | | (79 | ) |
| 9/18/2019 | | Morgan Stanley | | 317,921 | | NOK | | 37,418 | | USD | | | (47 | ) |
| 9/18/2019 | | Morgan Stanley | | 1,909,088 | | NZD | | 1,259,359 | | USD | | | 24,810 | |
| 9/18/2019 | | Morgan Stanley | | 109,945 | | NZD | | 71,754 | | USD | | | 2,201 | |
| 9/18/2019 | | Morgan Stanley | | 157,633 | | NZD | | 102,839 | | USD | | | 3,194 | |
| 9/18/2019 | | Morgan Stanley | | 85,794 | | NZD | | 57,628 | | USD | | | 82 | |
| 9/18/2019 | | Morgan Stanley | | 765,510 | | SEK | | 71,595 | | EUR | | | 931 | |
| 9/18/2019 | | Morgan Stanley | | 1,772,066 | | SEK | | 165,921 | | EUR | | | 1,941 | |
| 9/18/2019 | | Morgan Stanley | | 297,510 | | SEK | | 272,161 | | NOK | | | 256 | |
| 9/18/2019 | | Morgan Stanley | | 327,379 | | SEK | | 34,514 | | USD | | | 972 | |
| 9/18/2019 | | Morgan Stanley | | 34,587 | | USD | | 49,777 | | AUD | | | (428 | ) |
| 9/18/2019 | | Morgan Stanley | | 72,638 | | USD | | 104,084 | | AUD | | | (578 | ) |
| 9/18/2019 | | Morgan Stanley | | 72,221 | | USD | | 103,011 | | AUD | | | (241 | ) |
| 9/18/2019 | | Morgan Stanley | | 144,327 | | USD | | 205,996 | | AUD | | | (578 | ) |
| 9/18/2019 | | Morgan Stanley | | 112,257 | | USD | | 159,895 | | AUD | | | (218 | ) |
| 9/18/2019 | | Morgan Stanley | | 72,446 | | USD | | 103,025 | | AUD | | | (26 | ) |
| 9/18/2019 | | Morgan Stanley | | 34,514 | | USD | | 46,105 | | CAD | | | (819 | ) |
| 9/18/2019 | | Morgan Stanley | | 81,079 | | USD | | 107,059 | | CAD | | | (967 | ) |
| 9/18/2019 | | Morgan Stanley | | 262,115 | | USD | | 344,556 | | CAD | | | (1,940 | ) |
| 9/18/2019 | | Morgan Stanley | | 160,407 | | USD | | 157,504 | | CHF | | | (2,298 | ) |
| 9/18/2019 | | Morgan Stanley | | 189,970 | | USD | | 183,928 | | CHF | | | (31 | ) |
| 9/18/2019 | | Morgan Stanley | | 1,564,399 | | USD | | 1,375,100 | | EUR | | | (11,410 | ) |
| 9/18/2019 | | Morgan Stanley | | 110,715 | | USD | | 96,575 | | EUR | | | 43 | |
| 9/18/2019 | | Morgan Stanley | | 37,297 | | USD | | 29,154 | | GBP | | | 61 | |
| 9/18/2019 | | Morgan Stanley | | 37,425 | | USD | | 29,410 | | GBP | | | (138 | ) |
| 9/18/2019 | | Morgan Stanley | | 72,080 | | USD | | 7,752,876 | | JPY | | | (301 | ) |
| 9/18/2019 | | Morgan Stanley | | 31,612 | | USD | | 3,398,754 | | JPY | | | (119 | ) |
| 9/18/2019 | | Morgan Stanley | | 143,000 | | USD | | 15,296,095 | | JPY | | | 195 | |
| 9/18/2019 | | Morgan Stanley | | 143,946 | | USD | | 15,369,689 | | JPY | | | 454 | |
| 9/18/2019 | | Morgan Stanley | | 72,047 | | USD | | 7,726,006 | | JPY | | | (84 | ) |
| 9/18/2019 | | Morgan Stanley | | 71,725 | | USD | | 617,851 | | NOK | | | (902 | ) |
| 9/18/2019 | | Morgan Stanley | | 72,043 | | USD | | 615,115 | | NOK | | | (263 | ) |
| 9/18/2019 | | Morgan Stanley | | 52,831 | | USD | | 80,324 | | NZD | | | (1,200 | ) |
See accompanying notes to financial statements.
Global Atlantic Goldman Sachs Core Fixed Income Portfolio
PORTFOLIO OF INVESTMENTS (Continued)
June 30, 2019 (Unaudited)
Forward Foreign Currency Contracts
| Settlement | | | | Currency Units to | | | | | | | | Unrealized Appreciation | |
| Date | | Counterparty | | Receive | | | | In Exchange For | | (Depreciation) | |
| 9/18/2019 | | Morgan Stanley | | 144,985 | | USD | | 218,108 | | NZD | | $ | (1,728 | ) |
| 9/18/2019 | | Morgan Stanley | | 72,573 | | USD | | 109,035 | | NZD | | | (770 | ) |
| 9/18/2019 | | Morgan Stanley | | 91,962 | | USD | | 869,133 | | SEK | | | (2,246 | ) |
| 9/18/2019 | | Morgan Stanley | | 77,780 | | USD | | 721,003 | | SEK | | | (372 | ) |
| 9/18/2019 | | Morgan Stanley | | 98,075 | | USD | | 903,152 | | SEK | | | 179 | |
| 9/18/2019 | | Morgan Stanley | | 66,201 | | USD | | 610,188 | | SEK | | | 61 | |
| NET UNREALIZED APPRECIATION ON FORWARD FOREIGN CURRENCY CONTRACTS | | $ | 79,358 | |
See accompanying notes to financial statements.
Global Atlantic Goldman Sachs Global Equity Insights Portfolio
PORTFOLIO OF INVESTMENTS
June 30, 2019 (Unaudited)
| Shares | | | | | Value | |
| | | | | COMMON STOCKS - 98.9% | | | | |
| | | | | ADVERSTISING - 0.1% | | | | |
| | 795 | | | Interpublic Group of Cos, Inc. | | $ | 17,959 | |
| | | | | | | | | |
| | | | | AEROSPACE/DEFENSE - 2.7% | | | | |
| | 807 | | | Boeing Co. | | | 293,756 | |
| | 4,700 | | | CAE, Inc. | | | 126,640 | |
| | 1,175 | | | HEICO Corp. | | | 157,227 | |
| | 872 | | | L3Harris Technologies, Inc. * | | | 164,921 | |
| | 3,044 | | | Leonardo SpA | | | 38,634 | |
| | 234 | | | Spirit AeroSystems Holdings, Inc. | | | 19,041 | |
| | | | | | | | 800,219 | |
| | | | | AGRICULTURE - 2.4% | | | | |
| | 5,130 | | | British American Tobacco PLC | | | 179,481 | |
| | 5,586 | | | Imperial Brands PLC | | | 131,295 | |
| | 2,983 | | | Philip Morris International, Inc. | | | 234,255 | |
| | 3,445 | | | Swedish Match AB | | | 145,550 | |
| | | | | | | | 690,581 | |
| | | | | AIRLINES - 0.3% | | | | |
| | 14,421 | | | International Consolidated Airlines Group SA | | | 87,528 | |
| | 128 | | | Southwest Airlines Co. | | | 6,500 | |
| | | | | | | | 94,028 | |
| | | | | APPAREL - 1.8% | | | | |
| | 667 | | | adidas AG | | | 206,226 | |
| | 401 | | | Kering SA | | | 237,508 | |
| | 822 | | | Ralph Lauren Corp. | | | 93,371 | |
| | | | | | | | 537,105 | |
| | | | | AUTO MANUFACTURERS - 1.4% | | | | |
| | 4,835 | | | General Motors Co. | | | 186,293 | |
| | 3,668 | | | Peugeot SA | | | 90,518 | |
| | 7,753 | | | Volvo AB | | | 123,128 | |
| | | | | | | | 399,939 | |
| | | | | AUTO PARTS & EQUIPMENT - 0.1% | | | | |
| | 744 | | | Allison Transmission Holdings, Inc. | | | 34,484 | |
| | | | | | | | | |
| | | | | BANKS - 7.5% | | | | |
| | 1,222 | | | ABN AMRO Group NV - ADR | | | 26,183 | |
| | 4,607 | | | Australia & New Zealand Banking Group Ltd. | | | 91,202 | |
| | 24,259 | | | Banco Bilbao Vizcaya Argentaria SA | | | 135,838 | |
See accompanying notes to financial statements.
Global Atlantic Goldman Sachs Global Equity Insights Portfolio
PORTFOLIO OF INVESTMENTS (Continued)
June 30, 2019 (Unaudited)
| Shares | | | | | Value | |
| | | | | BANKS (Continued) - 7.5% | | | | |
| | 3,052 | | | Banco Santander SA * | | $ | 14,182 | |
| | 3,686 | | | BNP Paribas SA | | | 175,314 | |
| | 4,546 | | | Citigroup, Inc. | | | 318,356 | |
| | 1,922 | | | Citizens Financial Group, Inc. | | | 67,962 | |
| | 2,228 | | | Comerica, Inc. | | | 161,842 | |
| | 10,671 | | | DNB ASA | | | 198,625 | |
| | 91 | | | Erste Group Bank AG | | | 3,383 | |
| | 3,986 | | | Fifth Third Bancorp | | | 111,209 | |
| | 26,614 | | | Lloyds Banking Group PLC | | | 19,168 | |
| | 1,732 | | | Mediobanca Banca di Credito Finanziario SpA | | | 17,882 | |
| | 2,792 | | | Popular, Inc. | | | 151,438 | |
| | 1,216 | | | Signature Bank | | | 146,941 | |
| | 1,524 | | | State Street Corp. | | | 85,435 | |
| | 747 | | | SVB Financial Group * | | | 167,769 | |
| | 3,181 | | | Western Alliance Bancorp * | | | 142,254 | |
| | 3,497 | | | Zions Bancorp NA | | | 160,792 | |
| | | | | | | | 2,195,775 | |
| | | | | BEVERAGES - 2.5% | | | | |
| | 1,135 | | | Carlsberg A/S | | | 150,698 | |
| | 24,066 | | | Coca-Cola Amatil Ltd. | | | 172,599 | |
| | 300 | | | Cott Corp. | | | 4,013 | |
| | 312 | | | Davide Campari-Milano SpA | | | 3,061 | |
| | 5,031 | | | Diageo PLC | | | 216,676 | |
| | 3,075 | | | Monster Beverage Corp. * | | | 196,277 | |
| | | | | | | | 743,324 | |
| | | | | BIOTECHNOLOGY - 2.6% | | | | |
| | 982 | | | Alexion Pharmaceuticals, Inc. * | | | 128,622 | |
| | 539 | | | Biogen, Inc. * | | | 126,056 | |
| | 531 | | | BioMarin Pharmaceutical, Inc. * | | | 45,480 | |
| | 3,288 | | | Gilead Sciences, Inc. | | | 222,137 | |
| | 1,593 | | | Incyte Corp. * | | | 135,341 | |
| | 512 | | | Vertex Pharmaceuticals, Inc. * | | | 93,891 | |
| | | | | | | | 751,527 | |
| | | | | BUILDING MATERIALS - 0.3% | | | | |
| | 100 | | | AGC, Inc. | | | 3,457 | |
| | 1,111 | | | Johnson Controls International PLC | | | 45,895 | |
| | 847 | | | Masco Corp. | | | 33,236 | |
| | | | | | | | 82,588 | |
See accompanying notes to financial statements.
Global Atlantic Goldman Sachs Global Equity Insights Portfolio
PORTFOLIO OF INVESTMENTS (Continued)
June 30, 2019 (Unaudited)
| Shares | | | | | Value | |
| | | | | CHEMICALS - 2.8% | | | | |
| | 1,487 | | | Air Liquide SA | | $ | 208,372 | |
| | 412 | | | Air Products & Chemicals, Inc. | | | 93,264 | |
| | 899 | | | Akzo Nobel NV | | | 84,605 | |
| | 57 | | | Arkema SA | | | 5,308 | |
| | 2,623 | | | CF Industries Holdings, Inc. | | | 122,520 | |
| | 1,073 | | | Covestro AG | | | 54,633 | |
| | 482 | | | Eastman Chemical Co. | | | 37,514 | |
| | 443 | | | Sherwin-Williams Co. | | | 203,022 | |
| | | | | | | | 809,238 | |
| | | | | COMMERCIAL SERVICES - 2.2% | | | | |
| | 2,692 | | | Adecco Group AG | | | 161,962 | |
| | 200 | | | Benesse Holdings, Inc. | | | 4,656 | |
| | 23 | | | Bright Horizons Family Solutions, Inc. * | | | 3,470 | |
| | 696 | | | Experian PLC | | | 21,117 | |
| | 838 | | | Intertek Group PLC | | | 58,680 | |
| | 2,636 | | | PayPal Holdings, Inc. * | | | 301,717 | |
| | 80 | | | Randstad NV | | | 4,400 | |
| | 514 | | | Wirecard AG | | | 86,660 | |
| | | | | | | | 642,662 | |
| | | | | COMPUTERS - 4.0% | | | | |
| | 4,551 | | | Apple, Inc. | | | 900,734 | |
| | 2,300 | | | Fujitsu Ltd. | | | 160,364 | |
| | 378 | | | Leidos Holdings, Inc. | | | 30,183 | |
| | 200 | | | NET One Systems Co., Ltd. * | | | 5,504 | |
| | 600 | | | Nomura Research Institute Ltd. | | | 9,618 | |
| | 5,200 | | | NTT Data Corp. * | | | 69,259 | |
| | 37 | | | Teleperformance | | | 7,424 | |
| | | | | | | | 1,183,086 | |
| | | | | COSMETICS/PERSONAL CARE - 1.2% | | | | |
| | 1,786 | | | Colgate-Palmolive Co. | | | 128,003 | |
| | 1,500 | | | Kao Corp. | | | 114,303 | |
| | 473 | | | Procter & Gamble Co. | | | 51,864 | |
| | 1,059 | | | Unilever PLC - ADR | | | 65,626 | |
| | | | | | | | 359,796 | |
| | | | | DIVERSIFIED FINANCIAL SERVICES - 3.5% | | | | |
| | 6,405 | | | Ally Financial, Inc. | | | 198,491 | |
| | 2,658 | | | ASX Ltd. | | | 153,641 | |
| | 3,500 | | | ORIX Corp. | | | 52,237 | |
See accompanying notes to financial statements.
Global Atlantic Goldman Sachs Global Equity Insights Portfolio
PORTFOLIO OF INVESTMENTS (Continued)
June 30, 2019 (Unaudited)
| Shares | | | | | Value | |
| | | | | DIVERSIFIED FINANCIAL SERVICES - 3.5% (Continued) | | | | |
| | 24,600 | | | Singapore Exchange Ltd. | | $ | 144,005 | |
| | 4,093 | | | Synchrony Financial | | | 141,904 | |
| | 1,884 | | | Visa, Inc. | | | 326,968 | |
| | | | | | | | 1,017,246 | |
| | | | | ELECTRIC - 4.2% | | | | |
| | 7,350 | | | AES Corp | | | 123,186 | |
| | 2,449 | | | Ameren Corp. | | | 183,944 | |
| | 803 | | | American Electric Power Co., Inc. | | | 70,672 | |
| | 1,500 | | | CLP Holdings Ltd. | | | 16,550 | |
| | 1,267 | | | CMS Energy Corp. | | | 73,372 | |
| | 1,205 | | | DTE Energy Co. | | | 154,095 | |
| | 11,796 | | | E.ON SE | | | 128,301 | |
| | 3,372 | | | Enel SpA | | | 23,578 | |
| | 4,835 | | | Exelon Corp. | | | 231,790 | |
| | 700 | | | FirstEnergy Corp. | | | 29,967 | |
| | 3,356 | | | NRG Energy, Inc. | | | 117,863 | |
| | 1,926 | | | PPL Corp. | | | 59,725 | |
| | 400 | | | Shikoku Electric Power Co., Inc. | | | 3,698 | |
| | 3,342 | | | Terna Rete Elettrica Nazionale SpA | | | 21,313 | |
| | | | | | | | 1,238,054 | |
| | | | | ELECTRICAL COMPONENTS & EQUIPMENT - 1.0% | | | | |
| | 688 | | | AMETEK, Inc. | | | 62,498 | |
| | 2,586 | | | Schneider Electric SE | | | 234,888 | |
| | | | | | | | 297,386 | |
| | | | | ELECTRONICS - 1.5% | | | | |
| | 572 | | | Agilent Technologies, Inc. | | | 42,711 | |
| | 261 | | | Allegion PLC | | | 28,854 | |
| | 737 | | | Halma PLC | | | 18,947 | |
| | 766 | | | Jabil, Inc. | | | 24,206 | |
| | 2,082 | | | Keysight Technologies, Inc. * | | | 186,984 | |
| | 3,325 | | | National Instruments Corp. | | | 139,617 | |
| | | | | | | | 441,319 | |
| | | | | ENGINEERING & CONSTRUCTION - 0.7% | | | | |
| | 3,296 | | | ACS Actividades de Construccion y Servicios SA | | | 131,785 | |
| | 1,359 | | | AECOM * | | | 51,438 | |
| | 372 | | | Fluor Corp. | | | 12,533 | |
| | | | | | | | 195,756 | |
See accompanying notes to financial statements.
Global Atlantic Goldman Sachs Global Equity Insights Portfolio
PORTFOLIO OF INVESTMENTS (Continued)
June 30, 2019 (Unaudited)
| Shares | | | | | Value | |
| | | | | ENTERTAINMENT - 0.5% | | | | |
| | 186 | | | Cinemark Holdings, Inc. | | $ | 6,715 | |
| | 29 | | | Madison Square Garden Co. | | | 8,118 | |
| | 11,800 | | | Sega Sammy Holdings, Inc. | | | 143,366 | |
| | | | | | | | 158,199 | |
| | | | | ENVIRONMENTAL CONTROL - 0.4% | | | | |
| | 1,095 | | | Waste Management, Inc. | | | 126,330 | |
| | | | | | | | | |
| | | | | FOOD - 1.1% | | | | |
| | 713 | | | Austevoll Seafood ASA | | | 7,489 | |
| | 428 | | | Koninklijke Ahold Delhaize NV | | | 9,640 | |
| | 2,381 | | | Kroger Co. | | | 51,692 | |
| | 355 | | | Lamb Weston Holdings, Inc. | | | 22,493 | |
| | 4,296 | | | Mondelez International, Inc. | | | 231,554 | |
| | 288 | | | Mowi ASA | | | 6,737 | |
| | 152 | | | US Foods Holding Corp. * | | | 5,436 | |
| | | | | | | | 335,041 | |
| | | | | GAS - 0.1% | | | | |
| | 1,500 | | | Osaka Gas Co, Ltd. | | | 26,132 | |
| | | | | | | | | |
| | | | | HAND/MACHINE TOOLS - 0.0% ^ | | | | |
| | 500 | | | Techtronic Industries Co. Ltd. | | | 3,827 | |
| | | | | | | | | |
| | | | | HEALTHCARE - PRODUCTS - 1.3% | | | | |
| | 582 | | | Align Technology, Inc. * | | | 159,293 | |
| | 68 | | | Cooper Cos, Inc. | | | 22,909 | |
| | 47 | | | Hill-Rom Holdings, Inc. | | | 4,917 | |
| | 668 | | | Sonova Holding AG | | | 151,961 | |
| | 139 | | | Thermo Fisher Scientific, Inc. | | | 40,822 | |
| | | | | | | | 379,902 | |
| | | | | HEALTHCARE - SERVICES - 2.5% | | | | |
| | 756 | | | Anthem, Inc. | | | 213,351 | |
| | 835 | | | Encompass Health Corp. | | | 52,906 | |
| | 1,681 | | | Evotec SE | | | 47,054 | |
| | 1,346 | | | HCA Healthcare, Inc. | | | 181,939 | |
| | 528 | | | Lonza Group AG | | | 178,383 | |
| | 494 | | | Universal Health Services, Inc. | | | 64,413 | |
| | | | | | | | 738,046 | |
See accompanying notes to financial statements.
Global Atlantic Goldman Sachs Global Equity Insights Portfolio
PORTFOLIO OF INVESTMENTS (Continued)
June 30, 2019 (Unaudited)
| Shares | | | | | Value | |
| | | | | HOME BUILDERS - 0.8% | | | | |
| | 4,900 | | | Daiwa House Industry Co. Ltd. | | $ | 142,852 | |
| | 3,058 | | | Persimmon PLC | | | 77,722 | |
| | | | | | | | 220,574 | |
| | | | | HOME FURNISHINGS - 0.0% ^ | | | | |
| | 385 | | | Electrolux AB | | | 9,847 | |
| | | | | | | | | |
| | | | | INSURANCE - 4.0% | | | | |
| | 14,000 | | | AIA Group Ltd. | | | 150,976 | |
| | 245 | | | Allstate Corp. | | | 24,914 | |
| | 114 | | | Aon PLC | | | 22,000 | |
| | 3,041 | | | Athene Holding Ltd. * | | | 130,945 | |
| | 3,322 | | | Brighthouse Financial, Inc. * | | | 121,884 | |
| | 1,917 | | | Insurance Australia Group Ltd. * | | | 11,112 | |
| | 31,096 | | | Legal & General Group PLC | | | 106,657 | |
| | 108 | | | NN Group NV | | | 4,354 | |
| | 2,148 | | | Progressive Corp. | | | 171,690 | |
| | 625 | | | Reinsurance Group of America, Inc. | | | 97,519 | |
| | 178 | | | SCOR SE | | | 7,816 | |
| | 1,504 | | | Storebrand ASA | | | 11,057 | |
| | 3,268 | | | Unum Group | | | 109,641 | |
| | 3,502 | | | Voya Financial, Inc. | | | 193,661 | |
| | | | | | | | 1,164,226 | |
| | | | | INTERNET - 8.4% | | | | |
| | 248 | | | Alphabet, Inc. - Class A * | | | 268,066 | |
| | 250 | | | Alphabet, Inc. - Class C * | | | 270,700 | |
| | 324 | | | Amazon.com, Inc. * | | | 613,536 | |
| | 32 | | | Booking Holdings, Inc. * | | | 59,991 | |
| | 707 | | | CDW Corp. | | | 78,477 | |
| | 4,569 | | | eBay, Inc. | | | 180,476 | |
| | 1,902 | | | Facebook, Inc. * | | | 367,086 | |
| | 321 | | | GoDaddy, Inc. * | | | 22,518 | |
| | 575 | | | Match Group, Inc. * | | | 38,680 | |
| | 314 | | | Netflix, Inc. * | | | 115,338 | |
| | 901 | | | Palo Alto Networks, Inc. * | | | 183,588 | |
| | 776 | | | VeriSign, Inc. * | | | 162,308 | |
| | 33,400 | | | Yahoo Japan Corp. | | | 97,962 | |
| | | | | | | | 2,458,726 | |
See accompanying notes to financial statements.
Global Atlantic Goldman Sachs Global Equity Insights Portfolio
PORTFOLIO OF INVESTMENTS (Continued)
June 30, 2019 (Unaudited)
| Shares | | | | | Value | |
| | | | | IRON/STEEL - 0.1% | | | | |
| | 1,400 | | | Labrador Iron Ore Royalty Corp. | | $ | 37,519 | |
| | | | | | | | | |
| | | | | LEISURE TIME - 0.5% | | | | |
| | 2,905 | | | Carnival Corp. | | | 135,228 | |
| | 174 | | | Carnival PLC - ADR | | | 7,877 | |
| | | | | | | | 143,105 | |
| | | | | LODGING - 0.8% | | | | |
| | 836 | | | Hilton Worldwide Holdings, Inc. | | | 81,711 | |
| | 2,671 | | | Las Vegas Sands Corp. | | | 157,829 | |
| | | | | | | | 239,540 | |
| | | | | MACHINERY - CONSTRUCTION & MINING - 0.9% | | | | |
| | 265 | | | Caterpillar, Inc. | | | 36,117 | |
| | 6,000 | | | Hitachi Ltd. | | | 219,918 | |
| | | | | | | | 256,035 | |
| | | | | MACHINERY - DIVERSIFIED - 0.3% | | | | |
| | 2,122 | | | Atlas Copco AB | | | 67,881 | |
| | 132 | | | Curtiss-Wright Corp. | | | 16,781 | |
| | | | | | | | 84,662 | |
| | | | | MEDIA - 1.6% | | | | |
| | 12,712 | | | News Corp. | | | 171,485 | |
| | 10,882 | | | Pearson PLC | | | 113,483 | |
| | 2,456 | | | Wolters Kluwer NV * | | | 179,057 | |
| | | | | | | | 464,025 | |
| | | | | MINING - 0.7% | | | | |
| | 5,489 | | | Alcoa Corp. * | | | 128,497 | |
| | 900 | | | Kirkland Lake Gold Ltd. | | | 38,858 | |
| | 765 | | | Rio Tinto PLC - ADR | | | 47,690 | |
| | | | | | | | 215,045 | |
| | | | | MISCELLANEOUS MANUFACTURER - 1.1% | | | | |
| | 557 | | | Eaton Corp PLC | | | 46,387 | |
| | 819 | | | Ingersoll-Rand PLC | | | 103,743 | |
| | 1,038 | | | Parker-Hannifin Corp. | | | 176,470 | |
| | | | | | | | 326,600 | |
| | | | | OIL & GAS - 4.1% | | | | |
| | 3,425 | | | ConocoPhillips | | | 208,925 | |
| | 1,137 | | | Eni SpA | | | 18,912 | |
| | 318 | | | Helmerich & Payne, Inc. | | | 16,097 | |
| | 8,027 | | | Marathon Petroleum Corp. | | | 114,064 | |
| | 1,218 | | | Occidental Petroleum Corp. | | | 61,241 | |
See accompanying notes to financial statements.
Global Atlantic Goldman Sachs Global Equity Insights Portfolio
PORTFOLIO OF INVESTMENTS (Continued)
June 30, 2019 (Unaudited)
| Shares | | | | | Value | |
| | | | | OIL & GAS - 4.1% (Continued) | | | | |
| | 108 | | | OMV AG | | $ | 5,270 | |
| | 2,310 | | | Phillips 66 | | | 216,077 | |
| | 683 | | | Royal Dutch Shell PLC - Class A | | | 22,362 | |
| | 173 | | | Royal Dutch Shell PLC - Class B | | | 5,683 | |
| | 4,200 | | | Suncor Energy, Inc. | | | 131,295 | |
| | 4,305 | | | TechnipFMC PLC * | | | 111,672 | |
| | 2,148 | | | Valero Energy Corp. | | | 183,890 | |
| | 4,244 | | | Woodside Petroleum Ltd. | | | 108,288 | |
| | | | | | | | 1,203,776 | |
| | | | | OIL & GAS SERVICES - 0.2% | | | | |
| | 950 | | | Apergy Corp | | | 31,863 | |
| | 482 | | | TGS NOPEC Geophysical Co. ASA | | | 13,523 | |
| | | | | | | | 45,386 | |
| | | | | PACKAGING & CONTAINERS - 0.6% | | | | |
| | 954 | | | Ball Corp. | | | 66,770 | |
| | 480 | | | Berry Global Group, Inc. * | | | 25,243 | |
| | 1,025 | | | Crown Holdings, Inc. | | | 62,628 | |
| | 650 | | | Sealed Air Corp. | | | 27,807 | |
| | | | | | | | 182,448 | |
| | | | | PHARMACEUTICALS - 4.9% | | | | |
| | 1,685 | | | AbbVie, Inc. | | | 122,533 | |
| | 5,700 | | | Astellas Pharma, Inc. | | | 81,209 | |
| | 4,486 | | | Bristol-Myers Squibb Co. | | | 203,440 | |
| | 79 | | | Eli Lilly & Co. | | | 8,752 | |
| | 589 | | | Grifols SA | | | 17,440 | |
| | 346 | | | Johnson & Johnson | | | 48,191 | |
| | 635 | | | McKesson Corp. | | | 85,338 | |
| | 398 | | | Merck & Co., Inc. | | | 33,372 | |
| | 1,034 | | | Merck KGaA | | | 108,285 | |
| | 57 | | | Novartis AG | | | 5,215 | |
| | 3,033 | | | Novo Nordisk A/S | | | 154,797 | |
| | 100 | | | Otsuka Holdings Co. Ltd. | | | 3,263 | |
| | 2,957 | | | Pfizer, Inc. | | | 128,097 | |
| | 984 | | | Roche Holding AG | | | 277,185 | |
| | 2,000 | | | Shionogi & Co, Ltd. | | | 115,259 | |
| | 37 | | | Siegfried Holding AG | | | 12,903 | |
| | 488 | | | UCB SA | | | 40,524 | |
| | | | | | | | 1,445,803 | |
See accompanying notes to financial statements.
Global Atlantic Goldman Sachs Global Equity Insights Portfolio
PORTFOLIO OF INVESTMENTS (Continued)
June 30, 2019 (Unaudited)
| Shares | | | | | Value | |
| | | | | PIPELINES - 0.6% | | | | |
| | 6,218 | | | Kinder Morgan, Inc. | | $ | 129,832 | |
| | 2,066 | | | Williams Cos, Inc. | | | 57,931 | |
| | | | | | | | 187,763 | |
| | | | | REAL ESTATE - 0.5% | | | | |
| | 500 | | | Mitsui Fudosan Co. Ltd. | | | 12,124 | |
| | 3,600 | | | Sumitomo Realty & Development Co. Ltd. | | | 128,576 | |
| | | | | | | | 140,700 | |
| | | | | REAL ESTATE INVESTMENT TRUSTS - 2.7% | | | | |
| | 4,403 | | | American Homes 4 Rent | | | 107,037 | |
| | 431 | | | American Tower Corp. | | | 88,118 | |
| | 1,485 | | | Camden Property Trust | | | 155,019 | |
| | 7 | | | Daiwa House REIT Investment Corp. * | | | 16,899 | |
| | 3,179 | | | Duke Realty Corp. | | | 100,488 | |
| | 575 | | | Equity LifeStyle Properties, Inc. | | | 69,771 | |
| | 639 | | | Host Hotels & Resorts, Inc. | | | 11,643 | |
| | 2 | | | Japan Retail Fund Investment Corp. | | | 4,047 | |
| | 377 | | | Lamar Advertising Co. | | | 30,428 | |
| | 565 | | | Prologis, Inc. | | | 45,257 | |
| | 2,299 | | | STORE Capital Corp. | | | 76,304 | |
| | 630 | | | Sun Communities, Inc. | | | 80,760 | |
| | | | | | | | 785,771 | |
| | | | | RETAIL - 3.3% | | | | |
| | 600 | | | Alimentation Couche-Tard, Inc. | | | 37,839 | |
| | 164 | | | AutoNation, Inc. | | | 6,878 | |
| | 136 | | | AutoZone, Inc. * | | | 149,528 | |
| | 72 | | | Casey’s General Stores, Inc. | | | 11,231 | |
| | 217 | | | Chipotle Mexican Grill, Inc. * | | | 159,035 | |
| | 90 | | | Dollar General Corp. | | | 12,164 | |
| | 1,051 | | | Lowe’s Cos, Inc. | | | 106,056 | |
| | 2,640 | | | Starbucks Corp. | | | 221,311 | |
| | 2,202 | | | Target Corp. | | | 190,715 | |
| | 701 | | | Yum! Brands, Inc. | | | 77,580 | |
| | | | | | | | 972,337 | |
| | | | | SEMICONDUCTORS - 1.6% | | | | |
| | 1,092 | | | ASML Holding NV | | | 228,494 | |
| | 838 | | | BE Semiconductor Industries NV | | | 21,606 | |
| | 1,862 | | | Infineon Technologies AG | | | 32,973 | |
| | 127 | | | Lam Research Corp. | | | 23,856 | |
See accompanying notes to financial statements.
Global Atlantic Goldman Sachs Global Equity Insights Portfolio
PORTFOLIO OF INVESTMENTS (Continued)
June 30, 2019 (Unaudited)
| Shares | | | | | Value | |
| | | | | SEMICONDUCTORS - 1.6% (Continued) | | | | |
| | 365 | | | Qorvo, Inc. | | $ | 24,313 | |
| | 643 | | | STMicroelectronics NV | | | 11,423 | |
| | 985 | | | Xilinx, Inc. | | | 116,151 | |
| | | | | | | | 458,816 | |
| | | | | SOFTWARE - 6.3% | | | | |
| | 617 | | | Cadence Design Systems, Inc. | | | 43,690 | |
| | 2,002 | | | Citrix Systems, Inc. | | | 196,476 | |
| | 648 | | | Dassault Systemes SE | | | 103,533 | |
| | 1,425 | | | Fidelity National Information Services, Inc. | | | 174,819 | |
| | 188 | | | Intuit, Inc. | | | 49,130 | |
| | 1,400 | | | Konami Holdings Corp. | | | 65,621 | |
| | 211 | | | Lectra | | | 5,418 | |
| | 1,185 | | | Microsoft Corp. | | | 158,743 | |
| | 475 | | | MSCI, Inc. | | | 113,425 | |
| | 3,500 | | | Open Text Corp. | | | 144,741 | |
| | 2,385 | | | Oracle Corp. | | | 135,873 | |
| | 1,289 | | | salesforce.com, Inc. | | | 195,580 | |
| | 790 | | | ServiceNow, Inc. * | | | 216,910 | |
| | 148 | | | SimCorp A/S | | | 14,339 | |
| | 504 | | | Smartsheet, Inc. | | | 24,394 | |
| | 227 | | | Temenos AG | | | 40,662 | |
| | 400 | | | TIS, Inc. * | | | 20,382 | |
| | 614 | | | Veeva Systems, Inc. | | | 99,536 | |
| | 300 | | | Vmware, Inc. | | | 50,163 | |
| | | | | | | | 1,853,435 | |
| | | | | TELECOMMUNICATIONS - 2.9% | | | | |
| | 3,800 | | | KDDI Corp. | | | 96,764 | |
| | 845 | | | Motorola Solutions, Inc. | | | 140,887 | |
| | 2,400 | | | SoftBank Group Corp. | | | 115,055 | |
| | 14,560 | | | Telefonaktiebolaget LM Ericsson | | | 138,253 | |
| | 14,443 | | | Telefonica SA | | | 118,769 | |
| | 284 | | | Telenor ASA | | | 6,032 | |
| | 2,312 | | | Telephone & Data Systems, Inc. | | | 70,285 | |
| | 3,007 | | | Verizon Communications, Inc. | | | 171,790 | |
| | | | | | | | 857,835 | |
| | | | | TRANSPORTATION - 3.3% | | | | |
| | 2,989 | | | Aurizon Holdings Ltd. | | | 11,327 | |
| | 400 | | | Canadian Pacific Railway Ltd. | | | 94,411 | |
See accompanying notes to financial statements.
Global Atlantic Goldman Sachs Global Equity Insights Portfolio
PORTFOLIO OF INVESTMENTS (Continued)
June 30, 2019 (Unaudited)
| Shares | | | | | Value | |
| | | | | TRANSPORTATION - 3.3% (Continued) | | | | |
| | 800 | | | Central Japan Railway Co. | | $ | 160,238 | |
| | 1,893 | | | CSX Corp. | | | 146,461 | |
| | 1,300 | | | East Japan Railway Co. | | | 121,626 | |
| | 893 | | | Norfolk Southern Corp. | | | 178,002 | |
| | 1,462 | | | Union Pacific Corp. | | | 247,240 | |
| | | | | | | | 959,305 | |
| | | | | | | | | |
| | | | | TOTAL COMMON STOCKS (Cost - $27,675,165) | | | 29,012,828 | |
| | | | | | | | | |
| | | | | TOTAL INVESTMENTS - 98.9% (Cost - $27,675,165) | | $ | 29,012,828 | |
| | | | | OTHER ASSETS LESS LIABILITIES - NET - 1.1% | | | 314,063 | |
| | | | | TOTAL NET ASSETS - 100.0% | | $ | 29,326,891 | |
| * | Non-income producing security. |
| ^ | Represents less than 0.05% |
| | ADR - American Depository Receipt |
| | PLC - Public Limited Company |
| | REIT - Real Estate Investment Trust |
See accompanying notes to financial statements.
Global Atlantic Goldman Sachs Large Cap Growth Insights Portfolio
PORTFOLIO OF INVESTMENTS
June 30, 2019 (Unaudited)
| Shares | | | | | Value | |
| | | | | COMMON STOCKS - 99.1% | | | | |
| | | | | ADVERTISING - 1.2% | | | | |
| | 3,083 | | | Boeing Co. | | $ | 1,122,243 | |
| | | | | | | | | |
| | | | | AEROSPACE/DEFENSE - 2.5% | | | | |
| | 5,790 | | | HEICO Corp. | | | 774,760 | |
| | 4,264 | | | L3Harris Technologies, Inc. * | | | 806,450 | |
| | 7,481 | | | Spirit AeroSystems Holdings, Inc. | | | 608,729 | |
| | | | | | | | 2,189,939 | |
| | | | | AIRLINES - 0.5% | | | | |
| | 7,697 | | | Delta Air Lines, Inc. | | | 436,805 | |
| | | | | | | | | |
| | | | | AUTO MANUFACTURERS - 0.7% | | | | |
| | 16,532 | | | General Motors Co. | | | 636,978 | |
| | | | | | | | | |
| | | | | AUTO PARTS & EQUIPMENT - 0.8% | | | | |
| | 15,117 | | | Allison Transmission Holdings, Inc. | | | 700,673 | |
| | | | | | | | | |
| | | | | BANKS - 2.0% | | | | |
| | 1,164 | | | CIT Group, Inc. | | | 61,157 | |
| | 4,246 | | | Popular, Inc. | | | 230,303 | |
| | 4,479 | | | Signature Bank | | | 541,242 | |
| | 878 | | | SVB Financial Group * | | | 197,190 | |
| | 6,466 | | | Western Alliance Bancorp * | | | 289,160 | |
| | 9,655 | | | Zions Bancorp NA | | | 443,937 | |
| | | | | | | | 1,762,989 | |
| | | | | BEVERAGES - 1.0% | | | | |
| | 3,857 | | | Coca-Cola Co. | | | 217,921 | |
| | 9,320 | | | Monster Beverage Corp. * | | | 594,896 | |
| | 779 | | | PepsiCo, Inc. | | | 102,150 | |
| | | | | | | | 914,967 | |
| | | | | BIOTECHNOLOGY - 4.1% | | | | |
| | 6,165 | | | Alexion Pharmaceuticals, Inc. * | | | 807,492 | |
| | 1,701 | | | Biogen, Inc. * | | | 397,813 | |
| | 5,285 | | | BioMarin Pharmaceutical, Inc. * | | | 452,660 | |
| | 1,300 | | | Exelixis, Inc. * | | | 27,781 | |
| | 10,296 | | | Gilead Sciences, Inc. | | | 695,598 | |
| | 9,005 | | | Incyte Corp. * | | | 765,065 | |
| | 2,741 | | | Vertex Pharmaceuticals, Inc. * | | | 502,645 | |
| | | | | | | | 3,649,054 | |
See accompanying notes to financial statements.
Global Atlantic Goldman Sachs Large Cap Growth Insights Portfolio
PORTFOLIO OF INVESTMENTS (Continued)
June 30, 2019 (Unaudited)
| Shares | | | | | Value | |
| | | | | CHEMICALS - 1.3% | | | | |
| | 945 | | | Air Products & Chemicals, Inc. | | $ | 213,920 | |
| | 1,991 | | | Sherwin-Williams Co. | | | 912,455 | |
| | | | | | | | 1,126,375 | |
| | | | | COMMERCIAL SERVICES - 2.8% | | | | |
| | 1,120 | | | CoStar Group, Inc. * | | | 620,547 | |
| | 13,562 | | | PayPal Holdings, Inc. * | | | 1,552,307 | |
| | 2,354 | | | Verisk Analytics, Inc. | | | 344,767 | |
| | | | | | | | 2,517,621 | |
| | | | | COMPUTERS - 6.8% | | | | |
| | 30,587 | | | Apple, Inc. | | | 6,053,779 | |
| | | | | | | | | |
| | | | | DISTRIBUTION/WHOLESALE - 0.1% | | | | |
| | 2,769 | | | HD Supply Holdings, Inc. * | | | 111,535 | |
| | | | | | | | | |
| | | | | DIVERSIFIED FINANCIAL SERVICES - 6.7% | | | | |
| | 21,806 | | | Ally Financial, Inc. | | | 675,768 | |
| | 7,329 | | | Mastercard, Inc. | | | 1,938,740 | |
| | 20,531 | | | Synchrony Financial | | | 711,810 | |
| | 15,040 | | | Visa, Inc. | | | 2,610,192 | |
| | | | | | | | 5,936,510 | |
| | | | | ELECTRIC - 1.4% | | | | |
| | 30,338 | | | AES Corp. | | | 508,465 | |
| | 10,206 | | | Exelon Corp. | | | 489,276 | |
| | 8,236 | | | NRG Energy, Inc. | | | 289,248 | |
| | | | | | | | 1,286,989 | |
| | | | | ELECTRICAL COMPONENTS & EQUIPMENT - 0.8% | | | | |
| | 7,901 | | | AMETEK, Inc. | | | 717,727 | |
| | | | | | | | | |
| | | | | ELECTRONICS - 2.3% | | | | |
| | 3,731 | | | Allegion PLC | | | 412,462 | |
| | 3,078 | | | Jabil, Inc. | | | 97,265 | |
| | 8,803 | | | Keysight Technologies, Inc. * | | | 790,597 | |
| | 112 | | | Mettler-Toledo International, Inc. * | | | 94,080 | |
| | 16,133 | | | National Instruments Corp. | | | 677,425 | |
| | | | | | | | 2,071,829 | |
| | | | | ENVIRONMENTAL CONTROL - 0.5% | | | | |
| | 3,765 | | | Waste Management, Inc. | | | 434,368 | |
See accompanying notes to financial statements.
Global Atlantic Goldman Sachs Large Cap Growth Insights Portfolio
PORTFOLIO OF INVESTMENTS (Continued)
June 30, 2019 (Unaudited)
| Shares | | | | | Value | |
| | | | | FOOD - 0.9% | | | | |
| | 741 | | | Campbell Soup Co. | | $ | 29,692 | |
| | 873 | | | Lamb Weston Holdings, Inc. | | | 55,313 | |
| | 12,586 | | | Mondelez International, Inc. | | | 678,385 | |
| | | | | | | | 763,390 | |
| | | | | HEALTHCARE PRODUCTS - 2.4% | | | | |
| | 2,981 | | | Align Technology, Inc. * | | | 815,900 | |
| | 99 | | | Cooper Cos, Inc. | | | 33,352 | |
| | 3,772 | | | Hill-Rom Holdings, Inc. | | | 394,627 | |
| | 4,420 | | | Hologic, Inc. * | | | 212,248 | |
| | 1,645 | | | Thermo Fisher Scientific, Inc. | | | 483,104 | |
| | 1,668 | | | West Pharmaceutical Services, Inc. | | | 208,750 | |
| | | | | | | | 2,147,981 | |
| | | | | HEALTHCARE - SERVICES - 2.2% | | | | |
| | 2,874 | | | Anthem, Inc. | | | 811,072 | |
| | 5,256 | | | Encompass Health Corp. | | | 333,020 | |
| | 1,321 | | | Molina Healthcare, Inc. * | | | 189,088 | |
| | 2,408 | | | UnitedHealth Group, Inc. | | | 587,576 | |
| | | | | | | | 1,920,756 | |
| | | | | HOME FURNISHINGS - 0.1% | | | | |
| | 730 | | | Tempur Sealy International, Inc. * | | | 53,560 | |
| | | | | | | | | |
| | | | | INSURANCE - 1.6% | | | | |
| | 9,558 | | | Progressive Corp. | | | 763,971 | |
| | 12,009 | | | Voya Financial, Inc. | | | 664,098 | |
| | | | | | | | 1,428,069 | |
| | | | | INTERNET - 19.0% | | | | |
| | 2,011 | | | Alphabet, Inc. - Class A * | | | 2,173,710 | |
| | 2,003 | | | Alphabet, Inc. - Class C * | | | 2,168,848 | |
| | 2,699 | | | Amazon.com, Inc. * | | | 5,110,907 | |
| | 311 | | | Booking Holdings, Inc. * | | | 583,035 | |
| | 909 | | | CDW Corp. | | | 100,899 | |
| | 22,212 | | | eBay, Inc. | | | 877,374 | |
| | 15,235 | | | Facebook, Inc. * | | | 2,940,355 | |
| | 1,385 | | | GoDaddy, Inc. * | | | 97,158 | |
| | 2,676 | | | Netflix, Inc. * | | | 982,948 | |
| | 3,784 | | | Palo Alto Networks, Inc. * | | | 771,028 | |
| | 1,698 | | | RingCentral, Inc. * | | | 195,134 | |
| | 4,639 | | | Twitter, Inc. * | | | 161,901 | |
| | 3,649 | | | VeriSign, Inc. * | | | 763,225 | |
| | | | | | | | 16,926,522 | |
See accompanying notes to financial statements.
Global Atlantic Goldman Sachs Large Cap Growth Insights Portfolio
PORTFOLIO OF INVESTMENTS (Continued)
June 30, 2019 (Unaudited)
| Shares | | | | | Value | |
| | | | | LODGING - 0.8% | | | | |
| | 12,428 | | | Las Vegas Sands Corp. | | $ | 734,371 | |
| | | | | | | | | |
| | | | | MACHINERY - CONSTRUCTION & MINING - 0.3% | | | | |
| | 2,111 | | | Caterpillar, Inc. | | | 287,708 | |
| | | | | | | | | |
| | | | | MACHINERY - DIVERSIFIED - 0.4% | | | | |
| | 2,573 | | | Cummins, Inc. | | | 327,105 | |
| | | | | | | | | |
| | | | | MEDIA - 0.1% | | | | |
| | 552 | | | Nexstar Media Group, Inc. | | | 55,752 | |
| | 762 | | | World Wrestling Entertainment, Inc. | | | 55,024 | |
| | | | | | | | 110,776 | |
| | | | | MINING - 0.3% | | | | |
| | 10,063 | | | Alcoa Corp. * | | | 235,575 | |
| | | | | | | | | |
| | | | | MISCELLANEOUS MANUFACTURER - 0.3% | | | | |
| | 2,323 | | | Ingersoll-Rand PLC | | | 294,254 | |
| | | | | | | | | |
| | | | | OIL & GAS - 0.7% | | | | |
| | 1,707 | | | ConocoPhillips | | | 104,127 | |
| | 4,305 | | | TechnipFMC PLC * | | | 111,672 | |
| | 4,887 | | | Valero Energy Corp. | | | 418,376 | |
| | | | | | | | 634,175 | |
| | | | | PACKAGING & CONTAINERS - 0.9% | | | | |
| | 6,715 | | | Berry Global Group, Inc. * | | | 353,142 | |
| | 9,753 | | | Sealed Air Corp. | | | 417,233 | |
| | | | | | | | 770,375 | |
| | | | | PHARMACEUTICALS - 3.6% | | | | |
| | 16,317 | | | AbbVie, Inc. | | | 1,186,572 | |
| | 7,759 | | | Bristol-Myers Squibb Co. | | | 351,871 | |
| | 275 | | | Cigna Corp. | | | 43,326 | |
| | 2,249 | | | Johnson & Johnson | | | 313,241 | |
| | 4,339 | | | McKesson Corp. | | | 583,118 | |
| | 5,050 | | | Merck & Co, Inc. | | | 423,443 | |
| | 3,417 | | | PRA Health Sciences, Inc. * | | | 338,796 | |
| | | | | | | | 3,240,367 | |
| | | | | REAL ESTATE INVESTMENT TRUSTS - 1.9% | | | | |
| | 3,129 | | | Duke Realty Corp. | | | 98,908 | |
| | 6,051 | | | Equity LifeStyle Properties, Inc. | | | 734,228 | |
See accompanying notes to financial statements.
Global Atlantic Goldman Sachs Large Cap Growth Insights Portfolio
PORTFOLIO OF INVESTMENTS (Continued)
June 30, 2019 (Unaudited)
| Shares | | | | | Value | |
| | | | | REAL ESTATE INVESTMENT TRUSTS - 1.9% (Continued) | | | | |
| | 5,249 | | | Lamar Advertising Co. | | $ | 423,647 | |
| | 5,026 | | | Prologis, Inc. | | | 402,583 | |
| | | | | | | | 1,659,366 | |
| | | | | RETAIL - 7.6% | | | | |
| | 2,837 | | | Advance Auto Parts, Inc. | | | 437,295 | |
| | 767 | | | AutoZone, Inc. * | | | 843,293 | |
| | 1,080 | | | Chipotle Mexican Grill, Inc. * | | | 791,510 | |
| | 11,738 | | | Lowe’s Cos, Inc. | | | 1,184,482 | |
| | 15,762 | | | Starbucks Corp. | | | 1,321,328 | |
| | 7,590 | | | Target Corp. | | | 657,370 | |
| | 12,211 | | | Walgreens Boots Alliance, Inc. | | | 667,575 | |
| | 7,829 | | | Yum! Brands, Inc. | | | 866,435 | |
| | | | | | | | 6,769,288 | |
| | | | | SEMICONDUCTORS - 2.5% | | | | |
| | 2,254 | | | Analog Devices, Inc. | | | 254,409 | |
| | 6,193 | | | Cree, Inc. * | | | 347,923 | |
| | 6,660 | | | NXP Semiconductors NV | | | 650,083 | |
| | 12,124 | | | Teradyne, Inc. | | | 580,861 | |
| | 2,967 | | | Xilinx, Inc. | | | 349,869 | |
| | | | | | | | 2,183,145 | |
| | | | | SOFTWARE - 13.9% | | | | |
| | 103 | | | Adobe, Inc. * | | | 30,349 | |
| | 11,243 | | | Cadence Design Systems, Inc. * | | | 796,117 | |
| | 7,573 | | | Citrix Systems, Inc. | | | 743,214 | |
| | 497 | | | Fair Isaac Corp. * | | | 156,068 | |
| | 3,103 | | | Fidelity National Information Services, Inc. | | | 380,676 | |
| | 2,456 | | | HubSpot, Inc. * | | | 418,797 | |
| | 1,702 | | | Intuit, Inc. | | | 444,784 | |
| | 41,861 | | | Microsoft Corp. | | | 5,607,700 | |
| | 593 | | | MongoDB, Inc. * | | | 90,189 | |
| | 590 | | | MSCI, Inc. | | | 140,886 | |
| | 21,460 | | | Oracle Corp. | | | 1,222,576 | |
| | 1,052 | | | Pluralsight ,Inc. * | | | 31,897 | |
| | 2,667 | | | salesforce.com, Inc. * | | | 404,664 | |
| | 3,593 | | | ServiceNow, Inc. * | | | 986,530 | |
| | 3,403 | | | Smartsheet, Inc. * | | | 164,705 | |
| | 1,148 | | | Veeva Systems, Inc. * | | | 186,102 | |
| | 1,485 | | | Vmware, Inc. | | | 248,307 | |
| | 1,417 | | | Workday, Inc. * | | | 291,307 | |
| | | | | | | | 12,344,868 | |
See accompanying notes to financial statements.
Global Atlantic Goldman Sachs Large Cap Growth Insights Portfolio
PORTFOLIO OF INVESTMENTS (Continued)
June 30, 2019 (Unaudited)
| Shares | | | | | Value | |
| | | | | TELECOMMUNICATIONS - 1.7% | | | | |
| | 352 | | | Arista Networks, Inc. * | | $ | 91,386 | |
| | 12,045 | | | Cisco Systems, Inc. | | | 659,223 | |
| | 4,830 | | | Motorola Solutions, Inc. | | | 805,306 | |
| | | | | | | | 1,555,915 | |
| | | | | TRANSPORTATION - 2.4% | | | | |
| | 3,396 | | | Norfolk Southern Corp. | | | 676,925 | |
| | 8,485 | | | Union Pacific Corp. | | | 1,434,894 | |
| | | | | | | | 2,111,819 | |
| | | | | | | | | |
| | | | | TOTAL COMMON STOCKS (Cost - $78,391,457) | | | 88,169,766 | |
| | | | | | | | | |
| | | | | SHORT-TERM INVESTMENT - 0.3% | | | | |
| | | | | MONEY MARKET FUND - 0.3% | | | | |
| | 254,573 | | | Fidelity Investments Money Market Funds - Government Portfolio, Institutional Class to yield 2.25% (a)(Cost - $254,573) | | | 254,573 | |
| | | | | | | | | |
| | | | | TOTAL INVESTMENTS - 99.4% (Cost - $78,646,030) | | $ | 88,424,339 | |
| | | | | OTHER ASSETS LESS LIABILITIES - NET - 0.6% | | | 512,758 | |
| | | | | TOTAL NET ASSETS - 100.0% | | $ | 88,937,097 | |
| * | Non-income producing security. |
| | ADR - American Depository Receipt |
| | PLC - Public Limited Company |
| | REIT - Real Estate Investment Trust |
| (a) | Money market rate shown represents the rate at June 30, 2019. |
See accompanying notes to financial statements.
Global Atlantic Goldman Sachs Mid Cap Value Insights Portfolio
PORTFOLIO OF INVESTMENTS
June 30, 2019 (Unaudited)
| Shares | | | | | Value | |
| | | | | COMMON STOCKS - 98.9% | | | | |
| | | | | AEROSPACE/DEFENSE - 2.2% | | | | |
| | 525 | | | HEICO Corp. | | $ | 70,250 | |
| | 5,325 | | | L3Harris Technologies, Inc. * | | | 1,007,117 | |
| | 6,231 | | | Spirit AeroSystems Holdings, Inc. | | | 507,016 | |
| | 4,627 | | | Teledyne Technologies, Inc. * | | | 1,267,196 | |
| | | | | | | | 2,851,579 | |
| | | | | AIRLINES - 1.5% | | | | |
| | 19,880 | | | American Airlines Group, Inc. | | | 648,287 | |
| | 3,772 | | | Copa Holdings SA | | | 368,034 | |
| | 48,191 | | | JetBlue Airways Corp. * | | | 891,052 | |
| | | | | | | | 1,907,373 | |
| | | | | APPAREL - 0.6% | | | | |
| | 7,200 | | | Ralph Lauren Corp. | | | 817,848 | |
| | | | | | | | | |
| | | | | AUTO MANUFACTURERS - 0.6% | | | | |
| | 19,915 | | | General Motors Co. | | | 767,325 | |
| | | | | | | | | |
| | | | | AUTO PARTS & EQUIPMENT - 0.5% | | | | |
| | 4,731 | | | Lear Corp. | | | 658,886 | |
| | | | | | | | | |
| | | | | BANKS - 10.1% | | | | |
| | 14,226 | | | CIT Group, Inc. | | | 747,434 | |
| | 39,111 | | | Citizens Financial Group, Inc. | | | 1,382,965 | |
| | 16,681 | | | Comerica, Inc. | | | 1,211,708 | |
| | 56,030 | | | Fifth Third Bancorp | | | 1,563,237 | |
| | 15,257 | | | First Hawaiian, Inc. | | | 394,699 | |
| | 5,640 | | | Northern Trust Corp. | | | 507,600 | |
| | 20,251 | | | Popular, Inc. | | | 1,098,414 | |
| | 57,738 | | | Regions Financial Corp. | | | 862,606 | |
| | 4,206 | | | Signature Bank | | | 508,253 | |
| | 14,141 | | | State Street Corp. | | | 792,744 | |
| | 4,332 | | | SVB Financial Group * | | | 972,924 | |
| | 25,934 | | | Synovus Financial Corp. | | | 907,690 | |
| | 3,554 | | | Umpqua Holdings Corp. | | | 58,961 | |
| | 22,233 | | | Western Alliance Bancorp * | | | 994,260 | |
| | 26,155 | | | Zions Bancorp NA | | | 1,202,607 | |
| | | | | | | | 13,206,102 | |
See accompanying notes to financial statements.
Global Atlantic Goldman Sachs Mid Cap Value Insights Portfolio
PORTFOLIO OF INVESTMENTS (Continued)
June 30, 2019 (Unaudited)
| Shares | | | | | Value | |
| | | | | BEVERAGES - 0.1% | | | | |
| | 2,423 | | | Molson Coors Brewing Co | | $ | 135,688 | |
| | | | | | | | | |
| | | | | BIOTECHNOLOGY - 1.7% | | | | |
| | 4,884 | | | Alexion Pharmaceuticals, Inc. * | | | 639,706 | |
| | 831 | | | Biogen, Inc. * | | | 194,346 | |
| | 1,000 | | | BioMarin Pharmaceutical, Inc. * | | | 85,650 | |
| | 7,686 | | | Exelixis, Inc. * | | | 164,250 | |
| | 12,122 | | | Gilead Sciences, Inc. | | | 818,962 | |
| | 4,298 | | | Incyte Corp. * | | | 365,158 | |
| | | | | | | | 2,268,072 | |
| | | | | BUILDING MATERIALS - 0.9% | | | | |
| | 152 | | | Eagle Materials, Inc. | | | 14,090 | |
| | 28,708 | | | Masco Corp. | | | 1,126,502 | |
| | | | | | | | 1,140,592 | |
| | | | | CHEMICALS - 2.4% | | | | |
| | 21,425 | | | Axalta Coating Systems Ltd. * | | | 637,822 | |
| | 1,259 | | | CF Industries Holdings, Inc. | | | 58,808 | |
| | 16,507 | | | Eastman Chemical Co. | | | 1,284,740 | |
| | 11,835 | | | Huntsman Corp. | | | 241,907 | |
| | 30,339 | | | Olin Corp. | | | 664,727 | |
| | 496 | | | Sherwin-Williams Co. | | | 227,312 | |
| | | | | | | | 3,115,316 | |
| | | | | COMMERCIAL SERVICES - 1.4% | | | | |
| | 347 | | | Bright Horizons Family Solutions, Inc. * | | | 52,352 | |
| | 88 | | | Graham Holdings Co. | | | 60,723 | |
| | 6,778 | | | IHS Markit Ltd. * | | | 431,894 | |
| | 3,804 | | | ManpowerGroup, Inc. | | | 367,466 | |
| | 8,406 | | | PayPal Holdings, Inc. * | | | 962,151 | |
| | | | | | | | 1,874,586 | |
| | | | | COMPUTERS - 1.0% | | | | |
| | 16,111 | | | Leidos Holdings, Inc. | | | 1,286,463 | |
| | | | | | | | | |
| | | | | DISTRIBUTION/WHOLESALE - 1.6% | | | | |
| | 29,039 | | | HD Supply Holdings, Inc. * | | | 1,169,691 | |
| | 11,189 | | | LKQ Corp. * | | | 297,739 | |
| | 11,561 | | | WESCO International, Inc. * | | | 585,565 | |
| | | | | | | | 2,052,995 | |
See accompanying notes to financial statements.
Global Atlantic Goldman Sachs Mid Cap Value Insights Portfolio
PORTFOLIO OF INVESTMENTS (Continued)
June 30, 2019 (Unaudited)
| Shares | | | | | Value | |
| | | | | DIVERSIFIED FINANCIAL SERVICES - 2.7% | | | | |
| | 42,897 | | | Ally Financial, Inc. | | $ | 1,329,378 | |
| | 1,107 | | | Cboe Global Markets, Inc. | | | 114,718 | |
| | 30,303 | | | Jefferies Financial Group, Inc. | | | 582,727 | |
| | 42,669 | | | Synchrony Financial | | | 1,479,334 | |
| | | | | | | | 3,506,157 | |
| | | | | ELECTRIC - 10.8% | | | | |
| | 77,143 | | | AES Corp. | | | 1,292,917 | |
| | 20,090 | | | Ameren Corp. | | | 1,508,960 | |
| | 25,364 | | | CMS Energy Corp. | | | 1,468,829 | |
| | 12,528 | | | Consolidated Edison, Inc. | | | 1,098,455 | |
| | 12,797 | | | DTE Energy Co. | | | 1,636,480 | |
| | 18,015 | | | Exelon Corp. | | | 863,639 | |
| | 38,125 | | | FirstEnergy Corp. | | | 1,632,131 | |
| | 35,093 | | | NRG Energy, Inc. | | | 1,232,466 | |
| | 52,794 | | | PPL Corp. | | | 1,637,142 | |
| | 3,802 | | | Sempra Energy | | | 522,547 | |
| | 54,162 | | | Vistra Energy Corp. | | | 1,226,228 | |
| | | | | | | | 14,119,794 | |
| | | | | ELECTRICAL COMPONENTS & EQUIPMENT - 0.9% | | | | |
| | 12,281 | | | AMETEK, Inc. | | | 1,115,606 | |
| | | | | | | | | |
| | | | | ELECTRONICS - 3.2% | | | | |
| | 9,313 | | | Agilent Technologies, Inc. | | | 695,402 | |
| | 3,211 | | | Allegion PLC | | | 354,976 | |
| | 31,201 | | | Jabil, Inc. | | | 985,952 | |
| | 11,149 | | | Keysight Technologies, Inc. * | | | 1,001,292 | |
| | 26,838 | | | National Instruments Corp. | | | 1,126,928 | |
| | | | | | | | 4,164,550 | |
| | | | | ENGINEERING COMPONENTS & EQUIPMENT - 0.9% | | | | |
| | 1,360 | | | AECOM * | | | 51,476 | |
| | 33,143 | | | Fluor Corp. | | | 1,116,588 | |
| | | | | | | | 1,168,064 | |
| | | | | ENTERTAINMENT - 0.2% | | | | |
| | 7,934 | | | Cinemark Holdings, Inc. | | | 286,417 | |
| | | | | | | | | |
| | | | | FOOD - 3.0% | | | | |
| | 2,102 | | | Campbell Soup Co. | | | 84,227 | |
| | 7,637 | | | Ingredion, Inc. | | | 629,976 | |
| | 48,938 | | | Kroger Co. | | | 1,062,444 | |
See accompanying notes to financial statements.
Global Atlantic Goldman Sachs Mid Cap Value Insights Portfolio
PORTFOLIO OF INVESTMENTS (Continued)
June 30, 2019 (Unaudited)
| Shares | | | | | Value | |
| | | | | FOOD - 3.0% (Continued) | | | | |
| | 18,789 | | | Lamb Weston Holdings, Inc. | | $ | 1,190,471 | |
| | 27,990 | | | US Foods Holding Corp. * | | | 1,000,922 | |
| | | | | | | | 3,968,040 | |
| | | | | FOOD SERVICE - 1.0% | | | | |
| | 34,724 | | | Aramark | | | 1,252,147 | |
| | | | | | | | | |
| | | | | FOREST PRODUCTS & PAPER - 0.7% | | | | |
| | 20,690 | | | Domtar Corp. | | | 921,326 | |
| | | | | | | | | |
| | | | | GAS - 0.3% | | | | |
| | 8,086 | | | UGI Corp. | | | 431,873 | |
| | | | | | | | | |
| | | | | HEALTHCARE PRODUCTS - 2.4% | | | | |
| | 2,646 | | | Align Technology, Inc. * | | | 724,210 | |
| | 1,459 | | | Cooper Cos, Inc. | | | 491,523 | |
| | 7,895 | | | Hill-Rom Holdings, Inc. | | | 825,975 | |
| | 12,709 | | | Hologic, Inc. * | | | 610,286 | |
| | 3,396 | | | West Pharmaceutical Services, Inc. | | | 425,009 | |
| | | | | | | | 3,077,003 | |
| | | | | HEALTHCARE - SERVICES - 1.8% | | | | |
| | 3,427 | | | Anthem, Inc. | | | 967,134 | |
| | 4,338 | | | Encompass Health Corp. | | | 274,856 | |
| | 258 | | | Molina Healthcare, Inc. * | | | 36,930 | |
| | 7,755 | | | Universal Health Services, Inc. | | | 1,011,174 | |
| | | | | | | | 2,290,094 | |
| | | | | HOME BUILDERS - 0.3% | | | | |
| | 3,127 | | | DR Horton, Inc. | | | 134,868 | |
| | 5,911 | | | Toll Brothers, Inc. | | | 216,461 | |
| | | | | | | | 351,329 | |
| | | | | HOME FURNISHINGS - 0.3% | | | | |
| | 4,120 | | | Whirlpool Corp. | | | 586,523 | |
| | | | | | | | | |
| | | | | INSURANCE - 6.1% | | | | |
| | 2,061 | | | American National Insurance Co. | | | 240,045 | |
| | 25,535 | | | Athene Holding Ltd. * | | | 1,099,537 | |
| | 28,037 | | | Brighthouse Financial, Inc. * | | | 1,028,678 | |
| | 6,732 | | | First American Financial Corp. | | | 361,508 | |
| | 9,815 | | | Mercury General Corp. | | | 613,438 | |
See accompanying notes to financial statements.
Global Atlantic Goldman Sachs Mid Cap Value Insights Portfolio
PORTFOLIO OF INVESTMENTS (Continued)
June 30, 2019 (Unaudited)
| Shares | | | | | Value | |
| | | | | INSURANCE - 6.1% (Continued) | | | | |
| | 1,336 | | | Old Republic International Corp. | | $ | 29,900 | |
| | 7,656 | | | Progressive Corp. | | | 611,944 | |
| | 4,215 | | | Reinsurance Group of America, Inc. | | | 657,666 | |
| | 33,779 | | | Unum Group | | | 1,133,285 | |
| | 21,830 | | | Voya Financial, Inc. | | | 1,207,199 | |
| | 1,021 | | | White Mountains Insurance Group Ltd. | | | 1,042,911 | |
| | | | | | | | 8,026,111 | |
| | | | | INTERNET - 1.6% | | | | |
| | 12,849 | | | eBay, Inc. | | | 507,536 | |
| | 1,866 | | | Palo Alto Networks, Inc. * | | | 380,216 | |
| | 5,580 | | | VeriSign, Inc. * | | | 1,167,113 | |
| | | | | | | | 2,054,865 | |
| | | | | LODGING - 0.7% | | | | |
| | 15,005 | | | Las Vegas Sands Corp. | | | 886,645 | |
| | 3,162 | | | MGM Resorts International | | | 90,338 | |
| | | | | | | | 976,983 | |
| | | | | MACHINERY - CONSTRUCTION & MINING - 0.4% | | | | |
| | 5,480 | | | Oshkosh Corp. | | | 457,525 | |
| | | | | | | | | |
| | | | | MACHINERY - DIVERSIFIED - 2.0% | | | | |
| | 3,112 | | | Crane Co. | | | 259,665 | |
| | 4,939 | | | Cummins, Inc. | | | 846,248 | |
| | 8,536 | | | Curtiss-Wright Corp. | | | 1,085,182 | |
| | 2,480 | | | IDEX Corp. | | | 426,907 | |
| | | | | | | | 2,618,002 | |
| | | | | MEDIA - 1.3% | | | | |
| | 3,555 | | | John Wiley & Sons, Inc. | | | 163,032 | |
| | 87,223 | | | News Corp. | | | 1,176,638 | |
| | 3,560 | | | Nexstar Media Group, Inc. | | | 359,560 | |
| | | | | | | | 1,699,230 | |
| | | | | MINING - 0.8% | | | | |
| | 47,261 | | | Alcoa Corp. * | | | 1,106,380 | |
| | | | | | | | | |
| | | | | MISCELLANEOUS MANUFACTURER - 1.6% | | | | |
| | 5,511 | | | Ingersoll-Rand PLC | | | 698,078 | |
| | 8,293 | | | Parker-Hannifin Corp. | | | 1,409,893 | |
| | | | | | | | 2,107,971 | |
See accompanying notes to financial statements.
Global Atlantic Goldman Sachs Mid Cap Value Insights Portfolio
PORTFOLIO OF INVESTMENTS (Continued)
June 30, 2019 (Unaudited)
| Shares | | | | | Value | |
| | | | | OIL & GAS - 4.8% | | | | |
| | 17,506 | | | Antero Resources Corp. * | | $ | 96,808 | |
| | 9,150 | | | ConocoPhillips | | | 558,150 | |
| | 16,242 | | | Helmerich & Payne, Inc. | | | 822,170 | |
| | 20,223 | | | HollyFrontier Corp. | | | 935,920 | |
| | 78,194 | | | Marathon Oil Corp. | | | 1,111,137 | |
| | 17,769 | | | Occidental Petroleum Corp. | | | 893,425 | |
| | 13,256 | | | PBF Energy, Inc. | | | 414,913 | |
| | 25,385 | | | TechnipFMC PLC * | | | 658,487 | |
| | 9,761 | | | Valero Energy Corp. | | | 835,639 | |
| | | | | | | | 6,326,649 | |
| | | | | OIL & GAS SERVICES - 0.3% | | | | |
| | 11,277 | | | Apergy Corp. * | | | 378,231 | |
| | | | | | | | | |
| | | | | PACKAGING & CONTAINERS - 1.4% | | | | |
| | 15,363 | | | Berry Global Group, Inc. * | | | 807,940 | |
| | 23,602 | | | Sealed Air Corp. | | | 1,009,694 | |
| | | | | | | | 1,817,634 | |
| | | | | PHARMACEUTICALS - 2.9% | | | | |
| | 9,304 | | | AbbVie, Inc. | | | 676,587 | |
| | 12,202 | | | Alkermes PLC * | | | 275,033 | |
| | 10,431 | | | Cardinal Health, Inc. | | | 491,300 | |
| | 1,665 | | | Elanco Animal Health, Inc. * | | | 56,277 | |
| | 3,842 | | | Herbalife Nutrition Ltd. * | | | 164,284 | |
| | 12,180 | | | McKesson Corp. | | | 1,636,870 | |
| | 24,337 | | | Mylan NV * | | | 463,376 | |
| | | | | | | | 3,763,727 | |
| | | | | PIPELINES - 1.2% | | | | |
| | 19,750 | | | Equitrans Midstream Corp. | | | 389,273 | |
| | 43,680 | | | Williams Cos, Inc. | | | 1,224,787 | |
| | | | | | | | 1,614,060 | |
| | | | | REAL ESTATE INVESTMENT TRUSTS - 11.8% | | | | |
| | 9,525 | | | American Homes 4 Rent | | | 231,553 | |
| | 11,086 | | | Apartment Investment & Management Co. | | | 555,630 | |
| | 56,208 | | | Brandywine Realty Trust | | | 804,899 | |
| | 11,780 | | | Camden Property Trust | | | 1,229,714 | |
| | 20,780 | | | Columbia Property Trust, Inc. | | | 430,977 | |
| | 34,721 | | | CubeSmart | | | 1,161,070 | |
| | 28,546 | | | Douglas Emmett, Inc. | | | 1,137,273 | |
See accompanying notes to financial statements.
Global Atlantic Goldman Sachs Mid Cap Value Insights Portfolio
PORTFOLIO OF INVESTMENTS (Continued)
June 30, 2019 (Unaudited)
| Shares | | | | | Value | |
| | | | | REAL ESTATE INVESTMENT TRUSTS - 11.8% (Continued) | | | | |
| | 41,684 | | | Duke Realty Corp. | | $ | 1,317,631 | |
| | 41,492 | | | Healthcare Trust of America, Inc. | | | 1,138,126 | |
| | 5,846 | | | Highwoods Properties, Inc. | | | 241,440 | |
| | 70,405 | | | Host Hotels & Resorts, Inc. | | | 1,282,779 | |
| | 38,685 | | | Iron Mountain, Inc. | | | 1,210,841 | |
| | 4,799 | | | Lamar Advertising Co. | | | 387,327 | |
| | 69,313 | | | Paramount Group, Inc. | | | 971,075 | |
| | 2,658 | | | Park Hotels & Resorts, Inc. | | | 73,254 | |
| | 1,361 | | | Prologis, Inc. | | | 109,016 | |
| | 37,209 | | | Retail Properties of America, Inc. | | | 437,578 | |
| | 33,290 | | | STORE Capital Corp. | | | 1,104,895 | |
| | 9,459 | | | Sun Communities, Inc. | | | 1,212,549 | |
| | 6,986 | | | UDR, Inc. | | | 313,602 | |
| | | | | | | | 15,351,229 | |
| | | | | | | | | |
| | | | | RETAIL - 4.6% | | | | |
| | 6,322 | | | Advance Auto Parts, Inc. | | | 974,473 | |
| | 24,205 | | | AutoNation, Inc. * | | | 1,015,158 | |
| | 285 | | | AutoZone, Inc. * | | | 313,349 | |
| | 8,041 | | | Best Buy Co, Inc. | | | 560,699 | |
| | 201 | | | Chipotle Mexican Grill, Inc. * | | | 147,309 | |
| | 1,969 | | | Lowe’s Cos, Inc. | | | 198,692 | |
| | 2,431 | | | Macy’s, Inc. | | | 52,169 | |
| | 1,956 | | | Penske Automotive Group, Inc. | | | 92,519 | |
| | 7,793 | | | Starbucks Corp. | | | 653,287 | |
| | 10,935 | | | Target Corp. | | | 947,080 | |
| | 17,434 | | | Walgreens Boots Alliance, Inc. | | | 953,117 | |
| | 524 | | | Yum! Brands, Inc. | | | 57,991 | |
| | | | | | | | 5,965,843 | |
| | | | | SEMICONDUCTORS - 1.4% | | | | |
| | 5,898 | | | Cree, Inc. * | | | 331,350 | |
| | 9,904 | | | NXP Semiconductors NV | | | 966,729 | |
| | 6,113 | | | Qorvo, Inc. * | | | 407,187 | |
| | 2,709 | | | Teradyne, Inc. | | | 129,788 | |
| | | | | | | | 1,835,054 | |
See accompanying notes to financial statements.
Global Atlantic Goldman Sachs Mid Cap Value Insights Portfolio
PORTFOLIO OF INVESTMENTS (Continued)
June 30, 2019 (Unaudited)
| | | | | SOFTWARE - 1.5% | | | | |
| | 10,390 | | | Citrix Systems, Inc. | | $ | 1,019,675 | |
| | 7,931 | | | Nuance Communications, Inc. * | | | 126,658 | |
| | 2,910 | | | ServiceNow, Inc. * | | | 798,999 | |
| | | | | | | | 1,945,332 | |
| | | | | TELECOMMUNICATIONS - 1.2% | | | | |
| | 7,165 | | | Motorola Solutions, Inc. | | | 1,194,620 | |
| | 12,285 | | | Telephone & Data Systems, Inc. | | | 373,466 | |
| | | | | | | | 1,568,086 | |
| | | | | TOYS/GAMES/HOBBIES - 0.1% | | | | |
| | 15,276 | | | Mattel, Inc. * | | | 171,244 | |
| | | | | | | | | |
| | | | | TRANSPORTATION - 0.1% | | | | |
| | 498 | | | Union Pacific Corp. | | | 84,217 | |
| | | | | | | | | |
| | | | | TOTAL COMMON STOCKS (Cost - $125,512,920) | | | 129,190,121 | |
| | | | | | | | | |
| | | | | SHORT-TERM INVESTMENT - 0.6% | | | | |
| | | | | MONEY MARKET FUND - 0.6% | | | | |
| | 828,037 | | | Fidelity Investments Money Market Funds - Government Portfolio, Institutional Class to yield 2.25% (a)(Cost - $828,037) | | | 828,037 | |
| | | | | | | | | |
| | | | | TOTAL INVESTMENTS - 99.5% (Cost - $126,340,957) | | $ | 130,018,158 | |
| | | | | OTHER ASSETS LESS LIABILITIES - NET - 0.5% | | | 586,330 | |
| | | | | TOTAL NET ASSETS - 100.0% | | $ | 130,604,488 | |
| * | Non-income producing security. |
| (a) | Money market rate shown represents the rate at June 30, 2019. |
| | PLC - Public Limited Company |
| | REIT - Real Estate Investment Trust |
See accompanying notes to financial statements.
| Global Atlantic Portfolios |
| |
| Statements of Assets and Liabilities |
| June 30, 2019 (Unaudited) |
| | | Global Atlantic | | | Global Atlantic | | | Global Atlantic | | | Global Atlantic BlackRock | |
| | | BlackRock Allocation | | | BlackRock Disciplined | | | BlackRock Disciplined | | | Disciplined International | |
| | | Portfolio | | | Core Portfolio | | | Growth Portfolio | | | Core Portfolio | |
| Assets: | | | | | | | | | | | | |
| Investments in securities, at cost | | $ | 78,200,404 | | | $ | 518,386,091 | | | $ | 15,026,086 | | | $ | 144,465,353 | |
| Investments in securities, at value | | $ | 82,876,854 | | | $ | 570,373,643 | | | $ | 17,350,324 | | | $ | 144,501,140 | |
| Foreign Cash (cost: $-, $-, $- and $3,651,641, respectively) | | | — | | | | — | | | | — | | | | 3,665,783 | |
| Deposits with broker + | | | — | | | | 354,643 | | | | 10,396 | | | | 213,078 | |
| Unrealized appreciation on futures contracts | | | — | | | | 136,280 | | | | 4,933 | | | | 95,745 | |
| Receivable for securities sold | | | 111,737 | | | | 9,142,328 | | | | 939,186 | | | | 462,820 | |
| Receivable for portfolio shares sold | | | 90,210 | | | | — | | | | — | | | | — | |
| Interest and dividends receivable | | | 119 | | | | 564,568 | | | | 7,873 | | | | 796,184 | |
| Total Assets | | | 83,078,920 | | | | 580,571,462 | | | | 18,312,712 | | | | 149,734,750 | |
| Liabilities: | | | | | | | | | | | | | | | | |
| | | | | | | | | | | | | | | | | |
| Unrealized depreciation on forward foreign exchange contracts | | | — | | | | — | | | | — | | | | 51 | |
| Payable for Portfolio shares redeemed | | | 3,373 | | | | 189,252 | | | | 16,114 | | | | 129,476 | |
| Payable for securities purchased | | | — | | | | 8,453,908 | | | | 883,533 | | | | 557,034 | |
| Accrued distribution (12b-1) fees | | | 3,116 | | | | 7,124 | | | | 3,537 | | | | 8,739 | |
| Accrued investment advisory fees - net | | | 13,291 | | | | 174,941 | | | | 5,463 | | | | 65,484 | |
| Administrative service fees payable | | | 6,290 | | | | 32,378 | | | | 2,949 | | | | 10,398 | |
| Accrued expenses and other liabilities | | | 3,787 | | | | 26,501 | | | | 463 | | | | 6,454 | |
| Total Liabilities | | | 29,857 | | | | 8,884,104 | | | | 912,059 | | | | 777,636 | |
| Net Assets | | $ | 83,049,063 | | | $ | 571,687,358 | | | $ | 17,400,653 | | | $ | 148,957,114 | |
| | | | | | | | | | | | | | | | | |
| Net Assets: | | | | | | | | | | | | | | | | |
| Paid in capital | | $ | 76,174,441 | | | $ | 503,699,686 | | | $ | 14,014,822 | | | $ | 155,769,483 | |
| Accumulated earnings (losses) | | | 6,874,622 | | | | 67,987,672 | | | | 3,385,831 | | | | (6,812,369 | ) |
| Net Assets | | | 83,049,063 | | | | 571,687,358 | | | | 17,400,653 | | | | 148,957,114 | |
| | | | | | | | | | | | | | | | | |
| Class I Shares: | | | | | | | | | | | | | | | | |
| Net assets | | $ | 67,707,045 | | | $ | 536,614,663 | | | $ | — | | | $ | 105,527,347 | |
| Total shares outstanding at end of period | | | | | | | | | | | | | | | | |
| ($0 par value, unlimited shares authorized) | | | 6,215,372 | | | | 46,585,165 | | | | — | | | | 10,887,459 | |
| | | | | | | | | | | | | | | | | |
| Net asset value, offering and redemption price per share | | | | | | | | | | | | | | | | |
| (Net assets ÷ Total shares of beneficial interest outstanding) | | $ | 10.89 | | | $ | 11.52 | | | $ | — | | | $ | 9.69 | |
| | | | | | | | | | | | | | | | | |
| Class II Shares: | | | | | | | | | | | | | | | | |
| Net assets | | $ | 15,342,018 | | | $ | 35,072,695 | | | $ | 17,400,653 | | | $ | 43,429,767 | |
| Total shares outstanding at end of period | | | | | | | | | | | | | | | | |
| ($0 par value, unlimited shares authorized) | | | 1,411,468 | | | | 3,052,648 | | | | 1,459,497 | | | | 4,492,484 | |
| | | | | | | | | | | | | | | | | |
| Net asset value, offering and redemption price per share | | | | | | | | | | | | | | | | |
| (Net assets ÷ Total shares of beneficial interest outstanding) | | $ | 10.87 | | | $ | 11.49 | | | $ | 11.92 | | | $ | 9.67 | |
| + | Collateral for futures contracts and foreign currency contracts. |
See accompanying notes to financial statements.
| Global Atlantic Portfolios |
| |
| Statements of Assets and Liabilities (Continued) |
| June 30, 2019 (Unaudited) |
| | | Global Atlantic BlackRock | | | Global Atlantic BlackRock | | | Global Atlantic BlackRock | | | Global Atlantic | |
| | | Disciplined Mid Cap | | | Disciplined Small Cap | | | Disciplined U.S. Core | | | BlackRock Disciplined | |
| | | Growth Portfolio | | | Portfolio | | | Portfolio | | | Value Portfolio | |
| Assets: | | | | | | | | | | | | |
| Investments in securities, at cost | | $ | 167,004,904 | | | $ | 17,592,835 | | | $ | 22,364,681 | | | | 258,635,000 | |
| Investments in securities, at value | | $ | 194,139,043 | | | $ | 17,760,890 | | | $ | 24,644,881 | | | | 274,727,013 | |
| Cash | | | 1,058 | | | | — | | | | — | | | | — | |
| Deposits with broker + | | | 128,848 | | | | 19,523 | | | | 22,714 | | | | 169,069 | |
| Unrealized appreciation on futures contracts | | | 46,442 | | | | 10,030 | | | | 7,946 | | | | 60,379 | |
| Receivable for portfolio shares sold | | | — | | | | — | | | | — | | | | 239 | |
| Receivable for securities sold | | | 31,779,773 | | | | 346,011 | | | | 746,922 | | | | 14,154,267 | |
| Interest and dividends receivable | | | 95,211 | | | | 20,302 | | | | 17,950 | | | | 295,808 | |
| Total Assets | | | 226,190,375 | | | | 18,156,756 | | | | 25,440,413 | | | | 289,406,775 | |
| Liabilities: | | | | | | | | | | | | | | | | |
| Payable for Portfolio shares redeemed | | | 158,321 | | | | 1,013 | | | | 873 | | | | 297,236 | |
| Payable for securities purchased | | | 31,057,709 | | | | 380,567 | | | | 562,347 | | | | 13,427,544 | |
| Accrued investment advisory fees - net | | | 82,826 | | | | 6,757 | | | | 6,860 | | | | 97,296 | |
| Accrued distribution (12b-1) fees | | | 10,250 | | | | 1,696 | | | | 702 | | | | 1,548 | |
| Administrative service fees payable | | | 12,449 | | | | 3,048 | | | | 3,467 | | | | 16,804 | |
| Accrued expenses and other liabilities | | | 8,300 | | | | 636 | | | | 1,211 | | | | 12,124 | |
| Total Liabilities | | | 31,329,855 | | | | 393,717 | | | | 575,460 | | | | 13,852,552 | |
| Net Assets | | $ | 194,860,520 | | | $ | 17,763,039 | | | $ | 24,864,953 | | | | 275,554,223 | |
| Net Assets: | | | | | | | | | | | | | | | | |
| Paid in capital | | $ | 158,855,447 | | | $ | 16,604,426 | | | $ | 21,729,720 | | | | 252,084,280 | |
| Accumulated earnings | | | 36,005,073 | | | | 1,158,613 | | | | 3,135,233 | | | | 23,469,943 | |
| Net Assets | | $ | 194,860,520 | | | $ | 17,763,039 | | | $ | 24,864,953 | | | $ | 275,554,223 | |
| | | | | | | | | | | | | | | | | |
| Class I Shares: | | | | | | | | | | | | | | | | |
| Net assets | | $ | 144,385,487 | | | $ | 9,293,584 | | | $ | 21,398,236 | | | | 267,934,921 | |
| Total shares outstanding at end of period | | | | | | | | | | | | | | | | |
| ($0 par value, unlimited shares authorized) | | | 11,613,398 | | | | 858,670 | | | | 1,871,922 | | | | 24,529,263 | |
| Net asset value, offering and redemption price per share | | | | | | | | | | | | | | | | |
| (Net assets ÷ Total shares of beneficial interest outstanding) | | $ | 12.43 | | | $ | 10.82 | | | $ | 11.43 | | | | 10.92 | |
| | | | | | | | | | | | | | | | | |
| Class II Shares: | | | | | | | | | | | | | | | | |
| Net assets | | $ | 50,475,033 | | | $ | 8,469,455 | | | $ | 3,466,717 | | | | 7,619,302 | |
| Total shares outstanding at end of period | | | | | | | | | | | | | | | | |
| ($0 par value, unlimited shares authorized) | | | 4,066,779 | | | | 784,172 | | | | 304,006 | | | | 698,019 | |
| Net asset value, offering and redemption price per share | | | | | | | | | | | | | | | | |
| (Net assets ÷ Total shares of beneficial interest outstanding) | | $ | 12.41 | | | $ | 10.80 | | | $ | 11.40 | | | | 10.92 | |
| + | Collateral for futures contracts and foreign currency contracts. |
See accompanying notes to financial statements.
| Global Atlantic Portfolios |
| |
| Statements of Assets and Liabilities (Continued) |
| June 30, 2019 (Unaudited) |
| | | Global Atlantic | | | Global Atlantic Goldman | | | Global Atlantic Goldman | | | Global Atlantic Goldman | |
| | | BlackRock High | | | Sachs Core Fixed | | | Sachs Global Equity | | | Sachs Large Cap Growth | |
| | | Yield Portfolio | | | Income Portfolio | | | Insights Portfolio | | | Insights Portfolio | |
| Assets: | | | | | | | | | | | | | | | | |
| Investments in securities, at cost | | $ | 70,872,505 | | | $ | 104,990,922 | | | $ | 27,675,165 | | | $ | 78,646,030 | |
| Investments in securities, at value | | $ | 71,505,084 | | | $ | 108,219,446 | | | $ | 29,012,828 | | | $ | 88,424,339 | |
| Foreign cash (Cost: $0, $32,481, $147,377, and $0, respectively) | | | — | | | | 33,557 | | | | 216,609 | | | | — | |
| Deposits with broker + | | | 47,813 | | | | 220,660 | | | | — | | | | — | |
| Unrealized appreciation on futures contracts | | | — | | | | 201,739 | | | | — | | | | — | |
| Unrealized appreciation on swap contracts | | | — | | | | 52,539 | | | | — | | | | — | |
| Unrealized appreciation on forward foreign currency contracts | | | — | | | | 79,358 | | | | — | | | | — | |
| Interest and dividends receivable | | | 1,064,950 | | | | 558,153 | | | | 53,949 | | | | 36,646 | |
| Receivable for Portfolio shares sold | | | 1,766,386 | | | | 104,326 | | | | 175 | | | | — | |
| Receivable for securities sold | | | 19,953 | | | | 5,330,200 | | | | 86,672 | | | | 16,828,885 | |
| Total Assets | | | 74,404,186 | | | | 114,799,978 | | | | 29,370,233 | | | | 105,289,870 | |
| Liabilities: | | | | | | | | | | | | | | | | |
| Due to Custodian | | | — | | | | — | | | | 16,932 | | | | — | |
| Unrealized depreciation on futures contracts | | | 25,474 | | | | — | | | | — | | | | — | |
| Payable for securities purchased | | | 787,918 | | | | 20,949,283 | | | | — | | | | 16,250,782 | |
| Payable for portfolio shares redeemed | | | 200 | | | | — | | | | 4,064 | | | | 66,007 | |
| Accrued investment advisory fees - net | | | 27,668 | | | | 24,038 | | | | 14,599 | | | | 25,101 | |
| Accrued distribution (12b-1) fees | | | 187 | | | | — | | | | 2,639 | | | | 814 | |
| Administrative service fees payable | | | 7,047 | | | | 8,288 | | | | 3,665 | | | | 6,669 | |
| Accrued expenses and other liabilities | | | 2,939 | | | | 3,960 | | | | 1,443 | | | | 3,400 | |
| Total Liabilities | | | 851,433 | | | | 20,985,569 | | | | 43,342 | | | | 16,352,773 | |
| Net Assets | | $ | 73,552,753 | | | $ | 93,814,409 | | | $ | 29,326,891 | | | $ | 88,937,097 | |
| | | | | | | | | | | | | | | | | |
| Net Assets: | | | | | | | | | | | | | | | | |
| Paid in capital | | $ | 70,182,134 | | | $ | 87,076,023 | | | $ | 28,732,282 | | | $ | 75,870,711 | |
| Accumulated earnings/(losses) | | | 3,370,619 | | | | 6,738,386 | | | | 594,609 | | | | 13,066,386 | |
| Net Assets | | $ | 73,552,753 | | | $ | 93,814,409 | | | $ | 29,326,891 | | | $ | 88,937,097 | |
| | | | | | | | | | | | | | | | | |
| Class I Shares: | | | | | | | | | | | | | | | | |
| Net assets | | $ | 72,636,383 | | | $ | 93,814,398 | | | $ | 16,273,691 | | | $ | 84,944,568 | |
| Total shares outstanding at end of period | | | | | | | | | | | | | | | | |
| ($0 par value, unlimited shares authorized) | | | 6,965,301 | | | | 8,852,873 | | | | 1,564,336 | | | | 7,294,591 | |
| | | | | | | | | | | | | | | | | |
| Net asset value, offering and redemption price per share | | | | | | | | | | | | | | | | |
| (Net assets ÷ Total shares of beneficial interest outstanding) | | $ | 10.43 | | | $ | 10.60 | | | $ | 10.40 | | | $ | 11.64 | |
| | | | | | | | | | | | | | | | | |
| Class II Shares: | | | | | | | | | | | | | | | | |
| Net assets | | $ | 916,370 | | | $ | 11 | | | $ | 13,053,200 | | | $ | 3,992,529 | |
| Total shares outstanding at end of period | | | | | | | | | | | | | | | | |
| ($0 par value, unlimited shares authorized) | | | 88,192 | | | | 1 | | | | 1,258,254 | | | | 343,815 | |
| | | | | | | | | | | | | | | | | |
| Net asset value, offering and redemption price per share | | | | | | | | | | | | | | | | |
| (Net assets ÷ Total shares of beneficial interest outstanding) | | $ | 10.39 | | | $ | 10.60 | (a) | | $ | 10.37 | | | $ | 11.61 | |
| (a) | NAV may not recalculate due to rounding of net assets. |
| + | Collateral for forward foreign currency contracts, futures contracts, and swap contracts. |
See accompanying notes to financial statements.
| Global Atlantic Portfolios |
| |
| Statements of Assets and Liabilities (Continued) |
| June 30, 2019 (Unaudited) |
| | | Global Atlantic Goldman | |
| | | Sachs Mid Cap Value | |
| | | Insights Portfolio | |
| Assets: | | | | |
| Investments in securities, at cost | | $ | 126,340,957 | |
| Investments in securities, at value | | $ | 130,018,158 | |
| Interest and dividends receivable | | | 186,126 | |
| Receivable for Portfolio shares sold | | | 3,476 | |
| Receivable for securities sold | | | 27,484,546 | |
| Total Assets | | | 157,692,306 | |
| Liabilities: | | | | |
| Payable for securities purchased | | | 26,991,375 | |
| Payable for Portfolio shares redeemed | | | 9,800 | |
| Accrued investment advisory fees - net | | | 56,025 | |
| Accrued distribution (12b-1) fees | | | 15,976 | |
| Administrative service fees payable | | | 8,872 | |
| Accrued expenses and other liabilities | | | 5,770 | |
| Total Liabilities | | | 27,087,818 | |
| Net Assets | | $ | 130,604,488 | |
| | | | | |
| Net Assets: | | | | |
| Paid in capital | | $ | 128,297,658 | |
| Accumulated earnings | | | 2,306,830 | |
| Net Assets | | $ | 130,604,488 | |
| | | | | |
| Class I Shares: | | | | |
| Net assets | | $ | 51,369,925 | |
| Total shares outstanding at end of period | | | | |
| ($0 par value, unlimited shares authorized) | | | 4,985,068 | |
| | | | | |
| Net asset value, offering and redemption price per share | | | | |
| (Net assets ÷ Total shares of beneficial interest outstanding) | | $ | 10.30 | |
| | | | | |
| Class II Shares: | | | | |
| Net assets | | $ | 79,234,563 | |
| Total shares outstanding at end of period | | | | |
| ($0 par value, unlimited shares authorized) | | | 7,713,060 | |
| | | | | |
| Net asset value, offering and redemption price per share | | | | |
| (Net assets ÷ Total shares of beneficial interest outstanding) | | $ | 10.27 | |
See accompanying notes to financial statements.
| Global Atlantic Portfolios |
| |
| Statements of Operations |
| For the Six Months Ended June 30, 2019 (Unaudited) |
| | | Global Atlantic | | | Global Atlantic | | | Global Atlantic | | | Global Atlantic BlackRock | |
| | | BlackRock Allocation | | | BlackRock Disciplined | | | BlackRock Disciplined | | | Disciplined International | |
| | | Portfolio | | | Core Portfolio | | | Growth Portfolio | | | Core Portfolio | |
| Investment Income: | | | | | | | | | | | | | | | | |
| Dividend income | | $ | 950,933 | | | $ | 5,637,283 | * | | $ | 120,136 | ** | | $ | 2,856,346 | *** |
| Interest income | | | 637 | | | | 90,306 | | | | 3,460 | | | | 6,106 | |
| Total Investment Income | | | 951,570 | | | | 5,727,589 | | | | 123,596 | | | | 2,862,452 | |
| Expenses: | | | | | | | | | | | | | | | | |
| Investment advisory fees | | | 88,791 | | | | 1,091,609 | | | | 38,859 | | | | 439,345 | |
| Distribution fees (12b-1) - Class II Shares | | | 18,293 | | | | 42,787 | | | | 21,589 | | | | 53,899 | |
| Administrative service fees | | | 31,397 | | | | 193,228 | | | | 9,374 | | | | 53,639 | |
| Legal fees | | | 9,885 | | | | 68,579 | | | | 2,116 | | | | 17,931 | |
| Trustees fees | | | 3,505 | | | | 24,314 | | | | 750 | | | | 6,358 | |
| Custody fees | | | — | | | | 9 | | | | 18 | | | | 1,969 | |
| Miscellaneous Expense | | | 515 | | | | 3,597 | | | | 112 | | | | 937 | |
| Total Expenses | | | 152,386 | | | | 1,424,123 | | | | 72,818 | | | | 574,078 | |
| Expenses waived | | | (8,375 | ) | | | (37,097 | ) | | | (4,546 | ) | | | (12,773 | ) |
| Net Expenses | | | 144,011 | | | | 1,387,026 | | | | 68,272 | | | | 561,305 | |
| Net Investment Income | | | 807,559 | | | | 4,340,563 | | | | 55,324 | | | | 2,301,147 | |
| | | | | | | | | | | | | | | | | |
| Net Realized and Unrealized Gain (Loss) on Investments, Futures Contracts, Forward Foreign Currency Contracts and Foreign Currency Translations | | | | | | | | | | | | | | | | |
| Net realized gain/(loss) on: | | | | | | | | | | | | | | | | |
| Investments | | | 54,306 | | | | 12,231,230 | | | | 496,107 | | | | (3,387,663 | ) |
| Futures contracts | | | — | | | | 1,057,062 | | | | 34,593 | | | | 359,712 | |
| Futures commissions | | | — | | | | (1,904 | ) | | | (59 | ) | | | (1,200 | ) |
| Foreign currency translations | | | — | | | | (66 | ) | | | — | | | | (13,499 | ) |
| Forward foreign currency contracts | | | — | | | | — | | | | — | | | | 4,291 | |
| | | | 54,306 | | | | 13,286,322 | | | | 530,641 | | | | (3,038,359 | ) |
| Net change in unrealized depreciation on: | | | | | | | | | | | | | | | | |
| Investments | | | 9,174,684 | | | | 74,938,708 | | | | 2,652,204 | | | | 19,562,049 | |
| Futures contracts | | | — | | | | 332,438 | | | | 3,251 | | | | 202,700 | |
| Foreign currency translations | | | — | | | | 1,297 | | | | — | | | | 2,558 | |
| Forward foreign currency contracts | | | — | | | | — | | | | — | | | | 12,987 | |
| | | | 9,174,684 | | | | 75,272,443 | | | | 2,655,455 | | | | 19,780,294 | |
| Net Realized and Unrealized Gain on Investments, Futures Contracts, Forward Foreign Currency Contracts and Foreign Currency Translations | | | 9,228,990 | | | | 88,558,765 | | | | 3,186,096 | | | | 16,741,935 | |
| Net Increase in Net Assets Resulting from Operations | | $ | 10,036,549 | | | $ | 92,899,328 | | | $ | 3,241,420 | | | $ | 19,043,082 | |
| * | Foreign Taxes Withheld $36,339 |
| ** | Foreign Taxes Withheld $47 |
| *** | Foreign Taxes Withheld $346,579 |
See accompanying notes to financial statements.
| Global Atlantic Portfolios |
| |
| Statements of Operations (Continued) |
| For the Six Months Ended June 30, 2019 (Unaudited) |
| | | Global Atlantic BlackRock | | | Global Atlantic BlackRock | | | Global Atlantic BlackRock | | | Global Atlantic | |
| | | Disciplined Mid Cap | | | Disciplined Small Cap | | | Disciplined U.S. Core | | | BlackRock Disciplined | |
| | | Growth Portfolio | | | Portfolio | | | Portfolio | | | Value Portfolio | |
| Investment Income: | | | | | | | | | | | | | | | | |
| Dividend income | | $ | 988,966 | * | | $ | 136,243 | ** | | $ | 238,728 | *** | | $ | 3,599,360 | **** |
| Interest income | | | 28,500 | | | | 4,699 | | | | 5,345 | | | | 41,714 | |
| Total Investment Income | | | 1,017,466 | | | | 140,942 | | | | 244,073 | | | | 3,641,074 | |
| Expenses: | | | | | | | | | | | | | | | | |
| Investment advisory fees | | | 519,902 | | | | 48,334 | | | | 46,761 | | | | 611,611 | |
| Distribution fees (12b-1) - Class II Shares | | | 60,569 | | | | 10,391 | | | | 4,110 | | | | 9,484 | |
| Administrative service fees | | | 67,839 | | | | 9,767 | | | | 11,829 | | | | 95,728 | |
| Legal fees | | | 23,170 | | | | 2,192 | | | | 2,938 | | | | 33,292 | |
| Trustees fees | | | 8,214 | | | | 777 | | | | 1,042 | | | | 11,804 | |
| Miscellaneous Expense | | | 1,171 | | | | 117 | | | | 152 | | | | 1,784 | |
| Total Expenses | | | 680,865 | | | | 71,578 | | | | 66,832 | | | | 763,703 | |
| Expenses waived | | | (24,162 | ) | | | (4,766 | ) | | | (5,125 | ) | | | (19,984 | ) |
| Net Expenses | | | 656,703 | | | | 66,812 | | | | 61,707 | | | | 743,719 | |
| Net Investment Income | | | 360,763 | | | | 74,130 | | | | 182,366 | | | | 2,897,355 | |
| | | | | | | | | | | | | | | | | |
| Net Realized and Unrealized Gain (Loss) on Investments, Futures Contracts, Foreign Currency Translations and Payments from Affiliate | | | | | | | | | | | | | | | | |
| Net realized gain (loss) on: | | | | | | | | | | | | | | | | |
| Investments | | | 7,958,139 | | | | 310,413 | | | | 453,914 | | | | 4,863,417 | |
| Futures contracts | | | 294,480 | | | | 54,559 | | | | 51,030 | | | | 517,579 | |
| Futures commissions | | | (726 | ) | | | (205 | ) | | | (90 | ) | | | (976 | ) |
| | | | 8,251,893 | | | | 364,767 | | | | 504,854 | | | | 5,380,020 | |
| Net change in unrealized appreciation (depreciation) on: | | | | | | | | | | | | | | | | |
| Investments | | | 33,274,866 | | | | 2,399,537 | | | | 3,256,142 | | | | 32,237,067 | |
| Futures contracts | | | 133,387 | | | | 19,831 | | | | 22,970 | | | | 167,131 | |
| | | | 33,408,253 | | | | 2,419,368 | | | | 3,279,112 | | | | 32,404,198 | |
| | | | | | | | | | | | | | | | | |
| Net Realized and Unrealized Gain on Investments, Futures Contracts, Foreign Currency Translations and Payments From Affiliate | | | 41,660,146 | | | | 2,784,135 | | | | 3,783,966 | | | | 37,784,218 | |
| | | | | | | | | | | | | | | | | |
| Net Increase in Net Assets Resulting from Operations | | $ | 42,020,909 | | | $ | 2,858,265 | | | $ | 3,966,332 | | | $ | 40,681,573 | |
| * | Foreign Taxes Withheld $50 |
| ** | Foreign Taxes Withheld $20 |
| *** | Foreign Taxes Withheld $56 |
| **** | Foreign Taxes Withheld $243 |
See accompanying notes to financial statements.
| Global Atlantic Portfolios |
| |
| Statements of Operations (Continued) |
| For the Six Months Ended June 30, 2019 (Unaudited) |
| | | Global Atlantic | | | Global Atlantic Goldman | | | Global Atlantic Goldman | | | Global Atlantic Goldman | |
| | | BlackRock High | | | Sachs Core Fixed | | | Sachs Global Equity | | | Sachs Large Cap Growth | |
| | | Yield Portfolio | | | Income Portfolio | | | Insights Portfolio | | | Insights Portfolio | |
| Investment Income: | | | | | | | | | | | | | | | | |
| Dividend income | | $ | — | | | $ | — | | | $ | 397,663 | * | | $ | 591,620 | |
| Interest income | | | 2,130,156 | | | | 1,487,446 | | | | 241 | | | | 6,341 | |
| Total Investment Income | | | 2,130,156 | | | | 1,487,446 | | | | 397,904 | | | | 597,961 | |
| Expenses: | | | | | | | | | | | | | | | | |
| Investment advisory fees | | | 181,728 | | | | 155,939 | | | | 91,475 | | | | 162,018 | |
| Distribution fees (12b-1) - Class II Shares | | | 1,194 | | | | — | | | | 16,161 | | | | 4,733 | |
| Administrative service fees | | | 29,669 | | | | 36,468 | | | | 13,537 | | | | 33,175 | |
| Legal fees | | | 8,900 | | | | 11,226 | | | | 3,556 | | | | 10,728 | |
| Trustees fees | | | 3,156 | | | | 3,981 | | | | 1,261 | | | | 3,803 | |
| Custody fees | | | 373 | | | | 108 | | | | 620 | | | | — | |
| Miscellaneous Expense | | | 481 | | | | 583 | | | | 192 | | | | 557 | |
| Total Expenses | | | 225,501 | | | | 208,305 | | | | 126,802 | | | | 215,014 | |
| Expenses waived | | | (9,474 | ) | | | (10,968 | ) | | | (5,434 | ) | | | (8,752 | ) |
| Net Expenses | | | 216,027 | | | | 197,337 | | | | 121,368 | | | | 206,262 | |
| Net Investment Income | | | 1,914,129 | | | | 1,290,109 | | | | 276,536 | | | | 391,699 | |
| | | | | | | | | | | | | | | | | |
| Net Realized and Unrealized Gain/(Loss) on Investments, Futures Contracts, Swap Contracts, Foreign Currency Translations and Forward Foreign Currrency Contracts | | | | | | | | | | | | | | | | |
| Net realized gain/(loss) on: | | | | | | | | | | | | | | | | |
| Investments | | | (1,544,144 | ) | | | 437,214 | | | | (551,151 | ) | | | 1,598,926 | |
| Options | | | — | | | | (3,061 | ) | | | — | | | | — | |
| Futures contracts | | | (58,023 | ) | | | 434,517 | | | | — | | | | (4,281 | ) |
| Futures commissions | | | (436 | ) | | | (6,719 | ) | | | — | | | | — | |
| Swap Contracts | | | — | | | | 77,434 | | | | — | | | | — | |
| Forward foreign currency contracts | | | — | | | | 16,422 | | | | — | | | | — | |
| Foreign currency translations | | | — | | | | 7,980 | | | | 4,553 | | | | — | |
| | | | (1,602,603 | ) | | | 963,787 | | | | (546,598 | ) | | | 1,594,645 | |
| Net change in unrealized appreciation (depreciation) on: | | | | | | | | | | | | | | | | |
| Investments | | | 6,987,474 | | | | 3,723,111 | | | | 4,094,171 | | | | 13,298,467 | |
| Futures contracts | | | (22,090 | ) | | | 27,122 | | | | — | | | | — | |
| Swap contracts | | | — | | | | (19,021 | ) | | | — | | | | — | |
| Forward foreign currency contracts | | | — | | | | 91,661 | | | | — | | | | — | |
| Foreign currency translations | | | — | | | | 2,049 | | | | 929 | | | | — | |
| | | | 6,965,384 | | | | 3,824,922 | | | | 4,095,100 | | | | 13,298,467 | |
| | | | | | | | | | | | | | | | | |
| Net Realized and Unrealized Gain on Investments, Futures Contracts, Swap Contracts, Foreign Currency Translations and Forward Foreign Currency Contracts | | | 5,362,781 | | | | 4,788,709 | | | | 3,548,502 | | | | 14,893,112 | |
| Net Increase in Net Assets Resulting from Operations | | $ | 7,276,910 | | | $ | 6,078,818 | | | $ | 3,825,038 | | | $ | 15,284,811 | |
| * | Foreign Taxes Withheld $28,935. |
See accompanying notes to financial statements.
| Global Atlantic Portfolios |
| |
| Statements of Operations (Continued) |
| For the Six Months Ended June 30, 2019 (Unaudited) |
| | | Global Atlantic Goldman | |
| | | Sachs Mid Cap Value | |
| | | Insights Portfolio | |
| Investment Income: | | | | |
| Dividend income | | $ | 1,489,104 | * |
| Interest income | | | 10,300 | |
| Total Investment Income | | | 1,499,404 | |
| Expenses: | | | | |
| Investment advisory fees | | | 361,118 | |
| Distribution fees (12b-1) - Class II Shares | | | 99,273 | |
| Administrative service fees | | | 47,975 | |
| Legal fees | | | 16,075 | |
| Trustees fees | | | 5,701 | |
| Custody fees | | | 2,433 | |
| Miscellaneous expense | | | 873 | |
| Total Expenses | | | 533,448 | |
| Expenses waived | | | (11,391 | ) |
| Net Expenses | | | 522,057 | |
| Net Investment Income | | | 977,347 | |
| | | | | |
| Net Realized and Unrealized Gain (Loss) on Investments and Futures Contracts | | | | |
| Net Realized Loss on: | | | | |
| Investments | | | (3,056,817 | ) |
| Net change in unrealized appreciation on: | | | | |
| Investments | | | 18,471,397 | |
| | | | | |
| Net Realized and Unrealized Gain on Investments | | | 15,414,580 | |
| | | | | |
| Net Increase in Net Assets Resulting from Operations | | $ | 16,391,927 | |
| * | Foreign Taxes Withheld $1,761. |
See accompanying notes to financial statements.
| Global Atlantic Portfolios |
| |
| Statements of Changes in Net Assets |
| | | Global Atlantic BlackRock | | | Global Atlantic BlackRock | |
| | | Allocation Portfolio | | | Disciplined Core Portfolio | |
| | | Six months ended | | | Year ended | | | Six months ended | | | Year ended | |
| | | June 30, 2019 | | | December 31, | | | June 30, 2019 | | | December 31, | |
| | | (Unaudited) | | | 2018 | | | (Unaudited) | | | 2018 | |
| | | | | | | | | | | | | | | | | |
| Increase/(Decrease) in Net Assets: | | | | | | | | | | | | | | | | |
| From Operations: | | | | | | | | | | | | | | | | |
| Net investment income | | $ | 807,559 | | | $ | 1,766,322 | | | $ | 4,340,563 | | | $ | 8,338,625 | |
| Net realized gain/(loss) on investments, futures contracts, forward foreign currency contracts, foreign currency translations and payments from affiliate | | | 54,306 | | | | (488,644 | ) | | | 13,286,322 | | | | (4,103,445 | ) |
| Net change in unrealized appreciation (depreciation) on investments, futures contracts, forward foreign currency contracts and foreign currency translations | | | 9,174,684 | | | | (5,623,615 | ) | | | 75,272,443 | | | | (32,111,695 | ) |
| Net increase (decrease) in net assets resulting from operations | | | 10,036,549 | | | | (4,345,937 | ) | | | 92,899,328 | | | | (27,876,515 | ) |
| | | | | | | | | | | | | | | | | |
| From Distributions to Shareholders: | | | | | | | | | | | | | | | | |
| Total distributions paid | | | — | | | | (361,277 | ) | | | — | | | | (8,261,415 | ) |
| | | | | | | | | | | | | | | | | |
| From Shares of Beneficial Interest: | | | | | | | | | | | | | | | | |
| Proceeds from shares sold | | | | | | | | | | | | | | | | |
| Class I | | | 643,517 | | | | 4,710,096 | | | | 297,007 | | | | 275,178,625 | |
| Class II | | | 928,513 | | | | 8,539,942 | | | | 122,525 | | | | 5,280,712 | |
| Reinvestment of distributions | | | | | | | | | | | | | | | | |
| Class I | | | — | | | | 319,042 | | | | — | | | | 7,813,964 | |
| Class II | | | — | | | | 42,236 | | | | — | | | | 447,452 | |
| Cost of shares redeemed | | | | | | | | | | | | | | | | |
| Class I | | | (4,639,807 | ) | | | (12,957,720 | ) | | | (37,408,408 | ) | | | (78,346,434 | ) |
| Class II | | | (1,187,464 | ) | | | (2,903,952 | ) | | | (3,155,446 | ) | | | (7,914,091 | ) |
| Net increase (decrease) in net assets from share transactions of beneficial interest | | | (4,255,241 | ) | | | (2,250,356 | ) | | | (40,144,322 | ) | | | 202,460,228 | |
| Total increase (decrease) in net assets | | | 5,781,308 | | | | (6,957,570 | ) | | | 52,755,006 | | | | 166,322,298 | |
| | | | | | | | | | | | | | | | | |
| Net Assets: | | | | | | | | | | | | | | | | |
| Beginning of period | | | 77,267,755 | | | | 84,225,325 | | | | 518,932,352 | | | | 352,610,054 | |
| End of period | | $ | 83,049,063 | | | $ | 77,267,755 | | | $ | 571,687,358 | | | $ | 518,932,352 | |
| | | | | | | | | | | | | | | | | |
| Share Activity: | | | | | | | | | | | | | | | | |
| Class I | | | | | | | | | | | | | | | | |
| Shares Sold | | | 60,767 | | | | 458,954 | | | | 27,790 | | | | 26,048,710 | |
| Shares Reinvested | | | — | | | | 32,456 | | | | — | | | | 761,595 | |
| Shares Redeemed | | | (445,527 | ) | | | (1,270,339 | ) | | | (3,403,546 | ) | | | (7,300,038 | ) |
| Net increase (decrease) in shares of beneficial interest outstanding | | | (384,760 | ) | | | (778,929 | ) | | | (3,375,756 | ) | | | 19,510,267 | |
| | | | | | | | | | | | | | | | | |
| Share Activity: | | | | | | | | | | | | | | | | |
| Class II | | | | | | | | | | | | | | | | |
| Shares Sold | | | 88,529 | | | | 831,755 | | | | 10,692 | | | | 489,813 | |
| Shares Reinvested | | | — | | | | 4,301 | | | | — | | | | 43,654 | |
| Shares Redeemed | | | (114,330 | ) | | | (285,815 | ) | | | (294,151 | ) | | | (735,161 | ) |
| Net increase (decrease) in shares of beneficial interest outstanding | | | (25,801 | ) | | | 550,241 | | | | (283,459 | ) | | | (201,694 | ) |
See accompanying notes to financial statements.
| Global Atlantic Portfolios |
| |
| Statements of Changes in Net Assets |
| | | Global Atlantic BlackRock | | | Global Atlantic BlackRock Disciplined | |
| | | Disciplined Growth Portfolio | | | International Core Portfolio | |
| | | Six months ended | | | Year ended | | | Six months ended | | | Year ended | |
| | | June 30, 2019 | | | December 31, | | | June 30, 2019 | | | December 31, | |
| | | (Unaudited) | | | 2018 | | | (Unaudited) | | | 2018 | |
| | | | | | | | | | | | | | | | | |
| Increase/(Decrease) in Net Assets: | | | | | | | | | | | | | | | | |
| From Operations: | | | | | | | | | | | | | | | | |
| Net investment income | | $ | 55,324 | | | $ | 147,181 | | | $ | 2,301,147 | | | $ | 3,320,882 | |
| Net realized gain (loss) on investments, futures contracts, forward foreign currency contracts and payments from affiliate | | | 530,641 | | | | 427,787 | | | | (3,038,359 | ) | | | (6,606,793 | ) |
| Net change in unrealized appreciation (depreciation) on investments, futures contracts, foreign currency translations and forward foreign currency contracts | | | 2,655,455 | | | | (793,512 | ) | | | 19,780,294 | | | | (21,191,740 | ) |
| Net increase (decrease) in net assets resulting from operations | | | 3,241,420 | | | | (218,544 | ) | | | 19,043,082 | | | | (24,477,651 | ) |
| | | | | | | | | | | | | | | | | |
| From Distributions to Shareholders: | | | | | | | | | | | | | | | | |
| Total distributions paid | | | — | | | | (283,113 | ) | | | — | | | | (3,135,099 | ) |
| | | | | | | | | | | | | | | | | |
| From Shares of Beneficial Interest: | | | | | | | | | | | | | | | | |
| Proceeds from shares sold | | | | | | | | | | | | | | | | |
| Class I | | | — | | | | — | | | | 333,231 | | | | 60,436,711 | |
| Class II | | | 333,919 | | | | 701,973 | | | | 359,833 | | | | 47,547,508 | |
| Reinvestment of distributions | | | | | | | | | | | | | | | | |
| Class I | | | — | | | | — | | | | — | | | | 2,260,346 | |
| Class II | | | — | | | | 283,113 | | | | — | | | | 874,754 | |
| Cost of shares redeemed | | | | | | | | | | | | | | | | |
| Class I | | | — | | | | — | | | | (6,990,935 | ) | | | (11,619,140 | ) |
| Class II | | | (1,981,309 | ) | | | (5,210,960 | ) | | | (3,534,611 | ) | | | (4,308,815 | ) |
| Net increase (decrease) in net assets from share transactions of beneficial interest | | | (1,647,390 | ) | | | (4,225,874 | ) | | | (9,832,482 | ) | | | 95,191,364 | |
| Total increase (decrease) in net assets | | | 1,594,030 | | | | (4,727,531 | ) | | | 9,210,600 | | | | 67,578,614 | |
| | | | | | | | | | | | | | | | | |
| Net Assets: | | | | | | | | | | | | | | | | |
| Beginning of period | | | 15,806,623 | | | | 20,534,154 | | | | 139,746,514 | | | | 72,167,900 | |
| End of period | | $ | 17,400,653 | | | $ | 15,806,623 | | | $ | 148,957,114 | | | $ | 139,746,514 | |
| | | | | | | | | | | | | | | | | |
| Share Activity: | | | | | | | | | | | | | | | | |
| Class I | | | | | | | | | | | | | | | | |
| Shares Sold | | | — | | | | — | | | | 35,799 | | | | 5,956,019 | |
| Shares Reinvested | | | — | | | | — | | | | — | | | | 259,512 | |
| Shares Redeemed | | | — | | | | — | | | | (756,781 | ) | | | (1,184,435 | ) |
| Net increase (decrease) in shares of beneficial interest outstanding | | | — | | | | — | | | | (720,982 | ) | | | 5,031,096 | |
| | | | | | | | | | | | | | | | | |
| Share Activity: | | | | | | | | | | | | | | | | |
| Class II | | | | | | | | | | | | | | | | |
| Shares Sold | | | 30,176 | | | | 63,002 | | | | 38,507 | | | | 4,680,473 | |
| Shares Reinvested | | | — | | | | 27,118 | | | | — | | | | 100,546 | |
| Shares Redeemed | | | (175,572 | ) | | | (475,123 | ) | | | (381,296 | ) | | | (445,806 | ) |
| Net increase (decrease) in shares of beneficial interest outstanding | | | (145,396 | ) | | | (385,003 | ) | | | (342,789 | ) | | | 4,335,213 | |
See accompanying notes to financial statements.
| Global Atlantic Portfolios |
| |
| Statements of Changes in Net Assets |
| | | Global Atlantic BlackRock | | | Global Atlantic BlackRock | |
| | | Disciplined Mid Cap Growth Portfolio | | | Disciplined Small Cap Portfolio | |
| | | Six months ended | | | Year ended | | | Six months ended | | | Year ended | |
| | | June 30, 2019 | | | December 31, | | | June 30, 2019 | | | December 31, | |
| | | (Unaudited) | | | 2018 | | | (Unaudited) | | | 2018 | |
| | | | | | | | | | | | | | | | | |
| Increase/(Decrease) in Net Assets: | | | | | | | | | | | | | | | | |
| From Operations: | | | | | | | | | | | | | | | | |
| Net investment income | | $ | 360,763 | | | $ | 1,723,701 | | | $ | 74,130 | | | $ | 110,139 | |
| Net realized gain on investments, futures contracts, foreign currency translations and payments from affiliate | | | 8,251,893 | | | | 45,574 | | | | 364,767 | | | | 457,116 | |
| Net change in unrealized appreciation (depreciation) on investments and futures contracts | | | 33,408,253 | | | | (8,548,365 | ) | | | 2,419,368 | | | | (2,442,580 | ) |
| Net increase (decrease) in net assets resulting from operations | | | 42,020,909 | | | | (6,779,090 | ) | | | 2,858,265 | | | | (1,875,325 | ) |
| | | | | | | | | | | | | | | | | |
| From Distributions to Shareholders: | | | | | | | | | | | | | | | | |
| Total distributions paid | | | — | | | | (2,125,079 | ) | | | — | | | | (104,521 | ) |
| | | | | | | | | | | | | | | | | |
| From Shares of Beneficial Interest: | | | | | | | | | | | | | | | | |
| Proceeds from shares sold | | | | | | | | | | | | | | | | |
| Class I | | | 312,515 | | | | 60,544,967 | | | | 124,562 | | | | 154,274 | |
| Class II | | | 264,314 | | | | 34,653,907 | | | | 286,445 | | | | 5,930,065 | |
| Reinvestment of distributions | | | | | | | | | | | | | | | | |
| Class I | | | — | | | | 1,648,223 | | | | — | | | | 65,101 | |
| Class II | | | — | | | | 476,857 | | | | — | | | | 39,420 | |
| Cost of shares redeemed | | | | | | | | | | | | | | | | |
| Class I | | | (13,386,625 | ) | | | (23,194,442 | ) | | | (1,183,838 | ) | | | (1,925,214 | ) |
| Class II | | | (3,788,694 | ) | | | (7,045,289 | ) | | | (668,064 | ) | | | (1,470,068 | ) |
| Net increase (decrease) in net assets from share transactions of beneficial interest | | | (16,598,490 | ) | | | 67,084,223 | | | | (1,440,895 | ) | | | 2,793,578 | |
| Total increase in net assets | | | 25,422,419 | | | | 58,180,054 | | | | 1,417,370 | | | | 813,732 | |
| | | | | | | | | | | | | | | | | |
| Net Assets: | | | | | | | | | | | | | | | | |
| Beginning of period | | | 169,438,101 | | | | 111,258,047 | | | | 16,345,669 | | | | 15,531,937 | |
| End of period | | $ | 194,860,520 | | | $ | 169,438,101 | | | $ | 17,763,039 | | | $ | 16,345,669 | |
| | | | | | | | | | | | | | | | | |
| Share Activity: | | | | | | | | | | | | | | | | |
| Class I | | | | | | | | | | | | | | | | |
| Shares Sold | | | 26,130 | | | | 5,651,636 | | | | 12,002 | | | | 14,058 | |
| Shares Reinvested | | | — | | | | 160,177 | | | | — | | | | 6,523 | |
| Shares Redeemed | | | (1,144,521 | ) | | | (2,110,745 | ) | | | (112,684 | ) | | | (182,058 | ) |
| Net increase (decrease) in shares of beneficial interest outstanding | | | (1,118,391 | ) | | | 3,701,068 | | | | (100,682 | ) | | | (161,477 | ) |
| | | | | | | | | | | | | | | | | |
| Share Activity: | | | | | | | | | | | | | | | | |
| Class II | | | | | | | | | | | | | | | | |
| Shares Sold | | | 23,380 | | | | 3,246,172 | | | | 27,609 | | | | 556,716 | |
| Shares Reinvested | | | — | | | | 46,342 | | | | — | | | | 3,950 | |
| Shares Redeemed | | | (327,695 | ) | | | (641,559 | ) | | | (64,195 | ) | | | (138,711 | ) |
| Net increase (decrease) in shares of beneficial interest outstanding | | | (304,315 | ) | | | 2,650,955 | | | | (36,586 | ) | | | 421,955 | |
See accompanying notes to financial statements.
| Global Atlantic Portfolios |
| |
| Statements of Changes in Net Assets |
| | | Global Atlantic BlackRock | | | Global Atlantic BlackRock | |
| | | Disciplined U.S. Core Portfolio | | | Disciplined Value Portfolio | |
| | | Six months ended | | | Year ended | | | Six months ended | | | Year ended | |
| | | June 30, 2019 | | | December 31, | | | June 30, 2019 | | | December 31, | |
| | | (Unaudited) | | | 2018 | | | (Unaudited) | | | 2018 | |
| | | | | | | | | | | | | |
| Increase/(Decrease) in Net Assets: | | | | | | | | | | | | | | | | |
| From Operations: | | | | | | | | | | | | | | | | |
| Net investment income | | $ | 182,366 | | | $ | 364,690 | | | $ | 2,897,355 | | | $ | 5,777,992 | |
| Net realized gain (loss) on investments, futures contracts, foreign currency translations and payments from affiliate | | | 504,854 | | | | 54,199 | | | | 5,380,020 | | | | (2,539,434 | ) |
| Net change in unrealized appreciation (depreciation) on investments and futures contracts | | | 3,279,112 | | | | (1,588,092 | ) | | | 32,404,198 | | | | (25,151,739 | ) |
| Net increase(decrease) in net assets resulting from operations | | | 3,966,332 | | | | (1,169,203 | ) | | | 40,681,573 | | | | (21,913,181 | ) |
| | | | | | | | | | | | | | | | | |
| From Distributions to Shareholders: | | | | | | | | | | | | | | | | |
| Total distributions paid | | | — | | | | (520,852 | ) | | | — | | | | (6,273,213 | ) |
| | | | | | | | | | | | | | | | | |
| From Shares of Beneficial Interest: | | | | | | | | | | | | | | | | |
| Proceeds from shares sold | | | | | | | | | | | | | | | | |
| Class I | | | 502,605 | | | | 464,122 | | | | 706,922 | | | | 5,139,697 | |
| Class II | | | 259,095 | | | | 3,681,529 | | | | 62,208 | | | | 132,447 | |
| Reinvestment of distributions | | | | | | | | | | | | | | | | |
| Class I | | | — | | | | 450,406 | | | | — | | | | 6,102,375 | |
| Class II | | | — | | | | 70,446 | | | | — | | | | 170,839 | |
| Cost of shares redeemed | | | | | | | | | | | | | | | | |
| Class I | | | (1,498,079 | ) | | | (3,743,802 | ) | | | (20,471,721 | ) | | | (45,420,543 | ) |
| Class II | | | (293,006 | ) | | | (640,775 | ) | | | (726,609 | ) | | | (1,820,772 | ) |
| Net increase (decrease) in net assets from share transactions of beneficial interest | | | (1,029,385 | ) | | | 281,926 | | | | (20,429,200 | ) | | | (35,695,957 | ) |
| Total increase (decrease) in net assets | | | 2,936,947 | | | | (1,408,129 | ) | | | 20,252,373 | | | | (63,882,351 | ) |
| | | | | | | | | | | | | | | | | |
| Net Assets: | | | | | | | | | | | | | | | | |
| Beginning of period | | | 21,928,006 | | | | 23,336,135 | | | | 255,301,850 | | | | 319,184,201 | |
| End of period | | $ | 24,864,953 | | | $ | 21,928,006 | | | $ | 275,554,223 | | | $ | 255,301,850 | |
| | | | | | | | | | | | | | | | | |
| Share Activity: | | | | | | | | | | | | | | | | |
| Class I | | | | | | | | | | | | | | | | |
| Shares Sold | | | 45,823 | | | | 43,680 | | | | 69,347 | | | | 488,141 | |
| Shares Reinvested | | | — | | | | 44,157 | | | | — | | | | 616,402 | |
| Shares Redeemed | | | (137,178 | ) | | | (347,902 | ) | | | (1,958,756 | ) | | | (4,342,073 | ) |
| Net decrease in shares of beneficial interest outstanding | | | (91,355 | ) | | | (260,065 | ) | | | (1,889,409 | ) | | | (3,237,530 | ) |
| | | | | | | | | | | | | | | | | |
| Share Activity: | | | | | | | | | | | | | | | | |
| Class II | | | | | | | | | | | | | | | | |
| Shares Sold | | | 23,944 | | | | 340,460 | | | | 5,833 | | | | 12,505 | |
| Shares Reinvested | | | — | | | | 6,913 | | | | — | | | | 17,239 | |
| Shares Redeemed | | | (27,230 | ) | | | (61,079 | ) | | | (69,730 | ) | | | (181,213 | ) |
| Net increase (decrease) in shares of beneficial interest outstanding | | | (3,286 | ) | | | 286,294 | | | | (63,897 | ) | | | (151,469 | ) |
See accompanying notes to financial statements.
| Global Atlantic Portfolios |
| |
| Statements of Changes in Net Assets |
| | | Global Atlantic BlackRock | | | Global Atlantic Goldman Sachs | |
| | | High Yield Portfolio | | | Core Fixed Income Portfolio | |
| | | Six months ended | | | Year ended | | | Six months ended | | | Year ended | |
| | | June 30, 2019 | | | December 31, | | | June 30, 2019 | | | December 31, | |
| | | (Unaudited) | | | 2018 | | | (Unaudited) | | | 2018 | |
| | | | | | | | | | | | | | | | | |
| Increase/(Decrease) in Net Assets: | | | | | | | | | | | | | | | | |
| From Operations: | | | | | | | | | | | | | | | | |
| Net investment income | | $ | 1,914,129 | | | $ | 4,220,540 | | | $ | 1,290,109 | | | $ | 2,165,503 | |
| Net realized loss on investments, futures contracts, swap contracts, payments from affiliate, foreign currency translations and forward foreign currency contracts | | | (1,602,603 | ) | | | (1,733,564 | ) | | | 963,787 | | | | (1,229,099 | ) |
| Net change in unrealized depreciation on investments, futures contracts, forward foreign currency contracts, foreign currency translations and swap contracts | | | 6,965,384 | | | | (5,876,562 | ) | | | 3,824,922 | | | | (186,486 | ) |
| Net increase (decrease) in net assets resulting from operations | | | 7,276,910 | | | | (3,389,586 | ) | | | 6,078,818 | | | | 749,918 | |
| | | | | | | | | | | | | | | | | |
| From Distributions to Shareholders: | | | | | | | | | | | | | | | | |
| Total distributions paid | | | — | | | | (483,027 | ) | | | — | | | | (47,084 | ) |
| | | | | | | | | | | | | | | | | |
| From Shares of Beneficial Interest: | | | | | | | | | | | | | | | | |
| Proceeds from shares sold | | | | | | | | | | | | | | | | |
| Class I | | | 4,648,360 | | | | 8,510,950 | | | | 2,637,859 | | | | 71,228,815 | |
| Class II | | | 17,429 | | | | 43,566 | | | | — | | | | — | |
| Reinvestment of distributions | | | | | | | | | | | | | | | | |
| Class I | | | — | | | | 475,788 | | | | — | | | | 47,084 | |
| Class II | | | — | | | | 7,239 | | | | — | | | | — | |
| Cost of shares redeemed | | | | | | | | | | | | | | | | |
| Class I | | | (8,445,471 | ) | | | (18,991,102 | ) | | | (7,661,825 | ) | | | (14,478,734 | ) |
| Class II | | | (270,408 | ) | | | (322,915 | ) | | | — | | | | — | |
| Net increase (decrease) in net assets from share transactions of beneficial interest | | | (4,050,090 | ) | | | (10,276,474 | ) | | | (5,023,966 | ) | | | 56,797,165 | |
| Total increase (decrease) in net assets | | | 3,226,820 | | | | (14,149,087 | ) | | | 1,054,852 | | | | 57,499,999 | |
| | | | | | | | | | | | | | | | | |
| Net Assets: | | | | | | | | | | | | | | | | |
| Beginning of period | | | 70,325,933 | | | | 84,475,020 | | | | 92,759,557 | | | | 35,259,558 | |
| End of period | | $ | 73,552,753 | | | $ | 70,325,933 | | | $ | 93,814,409 | | | $ | 92,759,557 | |
| | | | | | | | | | | | | | | | | |
| Share Activity: | | | | | | | | | | | | | | | | |
| Class I | | | | | | | | | | | | | | | | |
| Shares Sold | | | 456,781 | | | | 861,033 | | | | 256,563 | | | | 7,289,283 | |
| Shares Reinvested | | | — | | | | 48,649 | | | | — | | | | 4,829 | |
| Shares Redeemed | | | (834,327 | ) | | | (1,938,480 | ) | | | (751,038 | ) | | | (1,478,494 | ) |
| Net increase (decrease) in shares of beneficial interest outstanding | | | (377,546 | ) | | | (1,028,798 | ) | | | (494,475 | ) | | | 5,815,618 | |
| | | | | | | | | | | | | | | | | |
| Share Activity: | | | | | | | | | | | | | | | | |
| Class II | | | | | | | | | | | | | | | | |
| Shares Sold | | | 1,716 | | | | 4,390 | | | | — | | | | — | |
| Shares Reinvested | | | — | | | | 742 | | | | — | | | | — | |
| Shares Redeemed | | | (27,307 | ) | | | (32,950 | ) | | | — | | | | — | |
| Net decrease in shares of beneficial interest outstanding | | | (25,591 | ) | | | (27,818 | ) | | | — | | | | — | |
See accompanying notes to financial statements.
| Global Atlantic Portfolios |
| |
| Statements of Changes in Net Assets |
| | | Global Atlantic Goldman Sachs | | | Global Atlantic Goldman Sachs | |
| | | Global Equity Insights Portfolio | | | Large Cap Growth Insights Portfolio | |
| | | Six months ended | | | Year ended | | | Six months ended | | | Year ended | |
| | | June 30, 2019 | | | December 31, | | | June 30, 2019 | | | December 31, | |
| | | (Unaudited) | | | 2018 | | | (Unaudited) | | | 2018 | |
| | | | | | | | | | | | | | | | | |
| Increase/(Decrease) in Net Assets: | | | | | | | | | | | | | | | | |
| From Operations: | | | | | | | | | | | | | | | | |
| Net investment income | | $ | 276,536 | | | $ | 392,332 | | | $ | 391,699 | | | $ | 756,082 | |
| Net realized gain (loss) on investments, foreign currency translations, payments from affiliate and futures contracts | | | (546,598 | ) | | | (537,574 | ) | | | 1,594,645 | | | | 1,091,018 | |
| Net change in unrealized appreciation (depreciation) on investments and foreign currency translations | | | 4,095,100 | | | | (3,311,680 | ) | | | 13,298,467 | | | | (5,347,626 | ) |
| Net increase (decrease) in net assets resulting from operations | | | 3,825,038 | | | | (3,456,922 | ) | | | 15,284,811 | | | | (3,500,526 | ) |
| | | | | | | | | | | | | | | | | |
| From Distributions to Shareholders: | | | | | | | | | | | | | | | | |
| Total distributions paid | | | — | | | | (406,910 | ) | | | — | | | | (1,225,121 | ) |
| | | | | | | | | | | | | | | | | |
| From Shares of Beneficial Interest: | | | | | | | | | | | | | | | | |
| Proceeds from shares sold | | | | | | | | | | | | | | | | |
| Class I | | | 297,688 | | | | 762,193 | | | | 44,585 | | | | 11,264,824 | |
| Class II | | | 174,232 | | | | 11,946,181 | | | | 325,157 | | | | 4,150,216 | |
| Reinvestment of distributions | | | | | | | | | | | | | | | | |
| Class I | | | — | | | | 239,600 | | | | — | | | | 1,181,346 | |
| Class II | | | — | | | | 167,310 | | | | — | | | | 43,775 | |
| Cost of shares redeemed | | | | | | | | | | | | | | | | |
| Class I | | | (1,452,344 | ) | | | (3,663,162 | ) | | | (7,681,372 | ) | | | (15,403,543 | ) |
| Class II | | | (962,396 | ) | | | (2,600,439 | ) | | | (221,268 | ) | | | (522,157 | ) |
| Net increase (decrease) in net assets from share transactions of beneficial interest | | | (1,942,820 | ) | | | 6,851,683 | | | | (7,532,898 | ) | | | 714,461 | |
| Total increase (decrease) in net assets | | | 1,882,218 | | | | 2,987,851 | | | | 7,751,913 | | | | (4,011,186 | ) |
| | | | | | | | | | | | | | | | | |
| Net Assets: | | | | | | | | | | | | | | | | |
| Beginning of period | | | 27,444,673 | | | | 24,456,822 | | | | 81,185,184 | | | | 85,196,370 | |
| End of period | | $ | 29,326,891 | | | $ | 27,444,673 | | | $ | 88,937,097 | | | $ | 81,185,184 | |
| | | | | | | | | | | | | | | | | |
| Share Activity: | | | | | | | | | | | | | | | | |
| Class I | | | | | | | | | | | | | | | | |
| Shares Sold | | | 29,000 | | | | 71,956 | | | | 4,021 | | | | 1,025,070 | |
| Shares Reinvested | | | — | | | | 24,881 | | | | — | | | | 115,141 | |
| Shares Redeemed | | | (143,437 | ) | | | (354,007 | ) | | | (697,481 | ) | | | (1,423,308 | ) |
| Net decrease in shares of beneficial interest outstanding | | | (114,437 | ) | | | (257,170 | ) | | | (693,460 | ) | | | (283,097 | ) |
| | | | | | | | | | | | | | | | | |
| Share Activity: | | | | | | | | | | | | | | | | |
| Class II | | | | | | | | | | | | | | | | |
| Shares Sold | | | 17,527 | | | | 1,129,288 | | | | 29,588 | | | | 376,728 | |
| Shares Reinvested | | | — | | | | 17,392 | | | | — | | | | 4,271 | |
| Shares Redeemed | | | (95,809 | ) | | | (251,916 | ) | | | (19,986 | ) | | | (48,588 | ) |
| Net increase (decrease) in shares of beneficial interest outstanding | | | (78,282 | ) | | | 894,764 | | | | 9,602 | | | | 332,411 | |
See accompanying notes to financial statements.
| Global Atlantic Portfolios |
| |
| Statements of Changes in Net Assets |
| | | Global Atlantic Goldman Sachs | |
| | | Mid Cap Value Insights Portfolio | |
| | | Six months ended | | | Year ended | |
| | | June 30, 2019 | | | December 31, | |
| | | (Unaudited) | | | 2018 | |
| | | | | | | | | |
| Increase/(Decrease) in Net Assets: | | | | | | | | |
| From Operations: | | | | | | | | |
| Net investment income | | $ | 977,347 | | | $ | 1,736,542 | |
| Net realized loss on investments, futures contracts and payments from affiliate | | | (3,056,817 | ) | | | (252,318 | ) |
| Net change in unrealized appreciation (depreciation) on investments | | | 18,471,397 | | | | (16,219,628 | ) |
| Net increase (decrease) in net assets resulting from operations | | | 16,391,927 | | | | (14,735,404 | ) |
| From Distributions to Shareholders: | | | | | | | | |
| Total distributions paid | | | — | | | | (1,157,852 | ) |
| | | | | | | | | |
| From Shares of Beneficial Interest: | | | | | | | | |
| Proceeds from shares sold | | | | | | | | |
| Class I | | | 302,466 | | | | 608,534 | |
| Class II | | | 130,361 | | | | 79,279,639 | |
| Reinvestment of distributions | | | | | | | | |
| Class I | | | — | | | | 516,181 | |
| Class II | | | — | | | | 641,671 | |
| Cost of shares redeemed | | | | | | | | |
| Class I | | | (4,519,146 | ) | | | (11,691,655 | ) |
| Class II | | | (5,865,081 | ) | | | (9,860,791 | ) |
| Net increase (decrease) in net assets from share transactions of beneficial interest | | | (9,951,400 | ) | | | 59,493,579 | |
| Total increase in net assets | | | 6,440,527 | | | | 43,600,323 | |
| | | | | | | | | |
| Net Assets: | | | | | | | | |
| Beginning of period | | | 124,163,961 | | | | 80,563,638 | |
| End of period | | $ | 130,604,488 | | | $ | 124,163,961 | |
| | | | | | | | | |
| Share Activity: | | | | | | | | |
| Class I | | | | | | | | |
| Shares Sold | | | 29,313 | | | | 58,962 | |
| Shares Reinvested | | | — | | | | 53,380 | |
| Shares Redeemed | | | (447,580 | ) | | | (1,130,804 | ) |
| Net decrease in shares of beneficial interest outstanding | | | (418,267 | ) | | | (1,018,462 | ) |
| | | | | | | | | |
| Share Activity: | | | | | | | | |
| Class II | | | | | | | | |
| Shares Sold | | | 12,803 | | | | 7,862,414 | |
| Shares Reinvested | | | — | | | | 66,494 | |
| Shares Redeemed | | | (581,339 | ) | | | (950,389 | ) |
| Net increase (decrease) in shares of beneficial interest outstanding | | | (568,536 | ) | | | 6,978,519 | |
See accompanying notes to financial statements.
| Global Atlantic Portfolios |
| Financial Highlights |
| Global Atlantic BlackRock Allocation Portfolio |
| |
| Selected data based on a share outstanding throughout each period indicated. |
| | | Class I Shares | |
| | | Six months ended | | | Year ended | | | Period Ended | |
| | | June 30, 2019 | | | December 31, | | | December 31, | |
| | | (Unaudited) | | | 2018 | | | 2017(a) | |
| Net asset value, beginning of period | | $ | 9.62 | | | $ | 10.19 | | | $ | 10.00 | |
| Income from investment operations: | | | | | | | �� | | | | | |
| Net investment income (b,c) | | | 0.11 | | | | 0.21 | | | | 0.06 | |
| Net realized and unrealized gain (loss) on investments | | | 1.16 | | | | (0.73 | ) | | | 0.13 | |
| Total income (loss) from investment operations | | | 1.27 | | | | (0.52 | ) | | | 0.19 | |
| Less distributions from: | | | | | | | | | | | | |
| Net investment income | | | — | | | | (0.05 | ) | | | — | |
| Net realized gain | | | — | | | | (0.00 | ) (j) | | | — | |
| Total distributions from net investment income and net realized gains | | | — | | | | (0.05 | ) | | | — | |
| Net asset value, end of period | | $ | 10.89 | | | $ | 9.62 | | | $ | 10.19 | |
| Total return (d) | | | 13.20 | % | | | (5.14 | )% (i) | | | 1.90 | % (i) |
| Ratios and Supplemental Data: | | | | | | | | | | | | |
| Net assets, end of period (in 000’s) | | $ | 67,707 | | | $ | 63,462 | | | $ | 75,191 | |
| Ratio of net expenses to average net assets (e) | | | 0.31 | % (g) | | | 0.31 | % | | | 0.31 | % (g) |
| Ratio of gross expenses to average net assets (e,f,) | | | 0.33 | % (g) | | | 0.32 | % | | | 0.32 | % (g) |
| Ratio of net investment income to average net assets (c,e) | | | 2.04 | % (g) | | | 2.06 | % | | | 4.15 | % (g) |
| Portfolio turnover rate | | | 37 | % (h) | | | 54 | % | | | 2 | % (h) |
| | | | | | | | | | | | | |
| (a) | Global Atlantic BlackRock Allocation Portfolio inception date is November 1, 2017. Commenced operations on November 6, 2017. |
| (b) | Net investment income has been calculated using the average shares method, which more appropriately presents the per share data for the period. |
| (c) | Recognition of net investment income by the Portfolio is affected by the timing of the declaration of dividends by the underlying investment companies in which the Portfolio invests. |
| (d) | Total returns are historical and assume changes in share price and reinvestment of dividends and capital gains distributions. Total return does not reflect the deduction of taxes that a shareholder may pay on Portfolio distributions or on the redemption of Portfolio shares, as well as other charges and expenses of the insurance contract or separate account. Total returns for periods of less than one year are not annualized. Total returns would have been lower absent fee waivers by the Adviser. |
| (e) | Does not include the expenses of the investment companies in which the Portfolio invests. |
| (f) | Represents the ratio of expenses to average net assets absent fee waivers and/or expense reimbursements by the Adviser. |
| (i) | For the period ended December 31, 2017 and the year ended December 31, 2018, the Portfolio received reimbursements from a related party. The reimbursements had no impact on the Portfolio’s total return. |
| (j) | Less than $0.005 per share |
See accompanying notes to financial statements.
| Global Atlantic Portfolios |
| Financial Highlights |
| Global Atlantic BlackRock Allocation Portfolio |
| |
| Selected data based on a share outstanding throughout each period indicated. |
| | | Class II Shares | |
| | | Six months ended | | | Year ended | | | Period Ended | |
| | | June 30, 2019 | | | December 31, | | | December 31, | |
| | | (Unaudited) | | | 2018 | | | 2017(a) | |
| Net asset value, beginning of period | | $ | 9.61 | | | $ | 10.18 | | | $ | 10.00 | |
| Income from investment operations: | | | | | | | | | | | | |
| Net investment income (b,c) | | | 0.09 | | | | 0.20 | | | | 0.14 | |
| Net realized and unrealized gain (loss) on investments | | | 1.17 | | | | (0.74 | ) | | | 0.04 | |
| Total income (loss) from investment operations | | | 1.26 | | | | (0.54 | ) | | | 0.18 | |
| Less distributions from: | | | | | | | | | | | | |
| Net investment income | | | — | | | | (0.03 | ) | | | — | |
| Net realized gain | | | — | | | | (0.00 | ) (j) | | | — | |
| Total distributions from net investment income and net realized gains | | | — | | | | (0.03 | ) | | | — | |
| Net asset value, end of period | | $ | 10.87 | | | $ | 9.61 | | | $ | 10.18 | |
| Total return (d) | | | 13.11 | % | | | (5.33 | )% (i) | | | 1.80 | % (i) |
| Ratios and Supplemental Data: | | | | | | | | | | | | |
| Net assets, end of period (in 000’s) | | $ | 15,342 | | | $ | 13,806 | | | $ | 9,034 | |
| Ratio of net expenses to average net assets (e) | | | 0.56 | % (g) | | | 0.56 | % | | | 0.56 | % (g) |
| Ratio of gross expenses to average net assets (e,f,) | | | 0.58 | % (g) | | | 0.57 | % | | | 0.56 | % (g) |
| Ratio of net investment income to average net assets (c,e) | | | 1.81 | % (g) | | | 1.99 | % | | | 9.11 | % (g) |
| Portfolio turnover rate | | | 37 | % (h) | | | 54 | % | | | 2 | % (h) |
| | | | | | | | | | | | | |
| (a) | Global Atlantic BlackRock Allocation Portfolio inception date is November 1, 2017. Commenced operations on November 6, 2017. |
| (b) | Net investment income has been calculated using the average shares method, which more appropriately presents the per share data for the period. |
| (c) | Recognition of net investment income by the Portfolio is affected by the timing of the declaration of dividends by the underlying investment companies in which the Portfolio invests. |
| (d) | Total returns are historical and assume changes in share price and reinvestment of dividends and capital gains distributions. Total return does not reflect the deduction of taxes that a shareholder may pay on Portfolio distributions or on the redemption of Portfolio shares, as well as other charges and expenses of the insurance contract or separate account. Total returns for periods of less than one year are not annualized. Total returns would have been lower absent fee waivers by the Adviser. |
| (e) | Does not include the expenses of the investment companies in which the Portfolio invests. |
| (f) | Represents the ratio of expenses to average net assets absent fee waivers and/or expense reimbursements by the Adviser. |
| (i) | For the period ended December 31, 2017 and the year ended December 31, 2018, the Portfolio received reimbursements from a related party. The reimbursements had no impact on the Portfolio’s total return. |
| (j) | Less than $0.005 per share |
See accompanying notes to financial statements.
| Global Atlantic Portfolios |
| Financial Highlights |
| Global Atlantic BlackRock Disciplined Core Portfolio |
| |
| Selected data based on a share outstanding throughout each period indicated. |
| | | Class I Shares | |
| | | Six months ended | | | Year ended | | | Period Ended | |
| | | June 30, 2019 | | | December 31, | | | December 31, | |
| | | (Unaudited) | | | 2018 | | | 2017(a) | |
| Net asset value, beginning of period | | $ | 9.74 | | | $ | 10.38 | | | $ | 10.00 | |
| Income from investment operations: | | | | | | | | | | | | |
| Net investment income (b) | | | 0.09 | | | | 0.16 | | | | 0.03 | |
| Net realized and unrealized gain (loss) on investments | | | 1.69 | | | | (0.64 | ) | | | 0.35 | |
| Total income (loss) from investment operations | | | 1.78 | | | | (0.48 | ) | | | 0.38 | |
| Less distributions from: | | | | | | | | | | | | |
| Net investment income | | | — | | | | (0.12 | ) | | | — | |
| Net realized gain | | | — | | | | (0.04 | ) | | | — | |
| Total distributions from net investment income and net realized gains | | | — | | | | (0.16 | ) | | | — | |
| Net asset value, end of period | | $ | 11.52 | | | $ | 9.74 | | | $ | 10.38 | |
| Total return (c) | | | 18.28 | % | | | (4.75 | )% (g) | | | 3.80 | % (g) |
| Ratios and Supplemental Data: | | | | | | | | | | | | |
| Net assets, end of period (in 000’s) | | $ | 536,615 | | | $ | 486,491 | | | $ | 315,936 | |
| Ratio of net expenses to average net assets | | | 0.48 | % (d) | | | 0.48 | % | | | 0.48 | % (d) |
| Ratio of gross expenses to average net assets (e) | | | 0.49 | % (d) | | | 0.49 | % | | | 0.48 | % (d) |
| Ratio of net investment income to average net assets | | | 1.57 | % (d) | | | 1.51 | % | | | 1.67 | % (d) |
| Portfolio turnover rate | | | 72 | % (f) | | | 156 | % | | | 18 | % (f) |
| | | | | | | | | | | | | |
| (a) | Global Atlantic BlackRock Disciplined Core Portfolio inception date is November 1, 2017. Commenced operations on November 6, 2017. |
| (b) | Net investment income has been calculated using the average shares method, which more appropriately presents the per share data for the period. |
| (c) | Total returns are historical and assume changes in share price and reinvestment of dividends and capital gains distributions. Total return does not reflect the deduction of taxes that a shareholder may pay on Portfolio distributions or on the redemption of Portfolio shares, as well as other charges and expenses of the insurance contract or separate account. Total returns for periods of less than one year are not annualized. Total returns would have been lower absent fee waivers by the adviser. |
| (e) | Represents the ratio of expenses to average net assets absent fee waivers and/or expense reimbursements by the Adviser. |
| (g) | For the period ended December 31, 2017 and the year ended December 31, 2018, the Portfolio received reimbursements from a related party. The reimbursements had no impact on the Portfolio’s total return. |
See accompanying notes to financial statements.
| Global Atlantic Portfolios |
| Financial Highlights |
| Global Atlantic BlackRock Disciplined Core Portfolio |
| |
| Selected data based on a share outstanding throughout each period indicated. |
| | | Class II Shares | |
| | | Six months ended | | | Year ended | | | Period Ended | |
| | | June 30, 2019 | | | December 31, | | | December 31, | |
| | | (Unaudited) | | | 2018 | | | 2017(a) | |
| Net asset value, beginning of period | | $ | 9.72 | | | $ | 10.37 | | | $ | 10.00 | |
| Income from investment operations: | | | | | | | | | | | | |
| Net investment income (b) | | | 0.07 | | | | 0.13 | | | | 0.02 | |
| Net realized and unrealized gain (loss) on investments | | | 1.70 | | | | (0.65 | ) | | | 0.35 | |
| Total income (loss) from investment operations | | | 1.77 | | | | (0.52 | ) | | | 0.37 | |
| Less distributions from: | | | | | | | | | | | | |
| Net investment income | | | — | | | | (0.09 | ) | | | — | |
| Net realized gain | | | — | | | | (0.04 | ) | | | — | |
| Total distributions from net investment income and net realized gains | | | — | | | | (0.13 | ) | | | — | |
| Net asset value, end of period | | $ | 11.49 | | | $ | 9.72 | | | $ | 10.37 | |
| Total return (c) | | | 18.21 | % | | | (5.06 | )% (g) | | | 3.70 | % (g) |
| Ratios and Supplemental Data: | | | | | | | | | | | | |
| Net assets, end of period (in 000’s) | | $ | 35,073 | | | $ | 32,442 | | | $ | 36,674 | |
| Ratio of net expenses to average net assets | | | 0.73 | % (d) | | | 0.73 | % | | | 0.72 | % (d) |
| Ratio of gross expenses to average net assets (e) | | | 0.74 | % (d) | | | 0.74 | % | | | 0.72 | % (d) |
| Ratio of net investment income to average net assets | | | 1.31 | % (d) | | | 1.24 | % | | | 1.00 | % (d) |
| Portfolio turnover rate | | | 72 | % (f) | | | 156 | % | | | 18 | % (f) |
| | | | | | | | | | | | | |
| (a) | Global Atlantic BlackRock Disciplined Core Portfolio inception date is November 1, 2017. Commenced operations on November 6, 2017. |
| (b) | Net investment income has been calculated using the average shares method, which more appropriately presents the per share data for the period. |
| (c) | Total returns are historical and assume changes in share price and reinvestment of dividends and capital gains distributions. Total return does not reflect the deduction of taxes that a shareholder may pay on Portfolio distributions or on the redemption of Portfolio shares, as well as other charges and expenses of the insurance contract or separate account. Total returns for periods of less than one year are not annualized. Total returns would have been lower absent fee waivers by the Adviser. |
| (e) | Represents the ratio of expenses to average net assets absent fee waivers and/or expense reimbursements by the Adviser. |
| (g) | For the period ended December 31, 2017 and the year ended December 31, 2018, the Portfolio received reimbursements from a related party. The reimbursements had no impact on the Portfolio’s total return. |
See accompanying notes to financial statements.
| Global Atlantic Portfolios |
| Financial Highlights |
| Global Atlantic BlackRock Disciplined Growth Portfolio |
| |
| Selected data based on a share outstanding throughout each period indicated. |
| | | Class II Shares | |
| | | Six months ended | | | Year ended | | | Period Ended | |
| | | June 30, 2019 | | | December 31, | | | December 31, | |
| | | (Unaudited) | | | 2018 | | | 2017(a) | |
| Net asset value, beginning of period | | $ | 9.85 | | | $ | 10.32 | | | $ | 10.00 | |
| Income from investment operations: | | | | | | | | | | | | |
| Net investment income (b) | | | 0.04 | | | | 0.08 | | | | 0.02 | |
| Net realized and unrealized gain (loss) on investments | | | 2.03 | | | | (0.38 | ) | | | 0.30 | |
| Total income (loss) from investment operations | | | 2.07 | | | | (0.30 | ) | | | 0.32 | |
| Less distributions from: | | | | | | | | | | | | |
| Net investment income | | | — | | | | (0.08 | ) | | | — | |
| Net realized gain | | | — | | | | (0.09 | ) | | | — | |
| Total distributions from net investment income and net realized gains | | | — | | | | (0.17 | ) | | | — | |
| Net asset value, end of period | | | 11.92 | | | | 9.85 | | | $ | 10.32 | |
| Total return (c) | | | 21.02 | % | | | (2.98 | )% | | | 3.20 | % (g) |
| Ratios and Supplemental Data: | | | | | | | | | | | | |
| Net assets, end of period (in 000’s) | | $ | 17,401 | | | $ | 15,807 | | | $ | 20,534 | |
| Ratio of net expenses to average net assets | | | 0.79 | % (d) | | | 0.79 | % | | | 0.79 | % (d) |
| Ratio of gross expenses to average net assets (e) | | | 0.84 | % (d) | | | 0.81 | % | | | 0.80 | % (d) |
| Ratio of net investment income to average net assets | | | 0.64 | % (d) | | | 0.75 | % | | | 1.14 | % (d) |
| Portfolio turnover rate | | | 80 | % (f) | | | 156 | % | | | 23 | % (f) |
| | | | | | | | | | | | | |
| (a) | Global Atlantic BlackRock Disciplined Growth Portfolio inception date is November 1, 2017. Commenced operations on November 6, 2017. |
| (b) | Net investment income has been calculated using the average shares method, which more appropriately presents the per share data for the period. |
| (c) | Total returns are historical and assume changes in share price and reinvestment of dividends and capital gains distributions. Total return does not reflect the deduction of taxes that a shareholder may pay on Portfolio distributions or on the redemption of Portfolio shares, as well as other charges and expenses of the insurance contract or separate account. Total returns for periods of less than one year are not annualized. Total returns would have been lower absent fee waivers by the Adviser. |
| (e) | Represents the ratio of expenses to average net assets absent fee waivers and/or expense reimbursements by the Adviser. |
| (g) | For the period ended December 31, 2017, the Portfolio received reimbursements from a related party. The reimbursements had no impact on the Portfolio’s total return. |
See accompanying notes to financial statements.
| Global Atlantic Portfolios |
| Financial Highlights |
| Global Atlantic BlackRock Disciplined International Core Portfolio |
| |
| Selected data based on a share outstanding throughout each period indicated. |
| | | Class I Shares | |
| | | Six months ended | | | Year ended | | | Period Ended | |
| | | June 30, 2019 | | | December 31, | | | December 31, | |
| | | (Unaudited) | | | 2018 | | | 2017(a) | |
| Net asset value, beginning of period | | $ | 8.50 | | | $ | 10.20 | | | $ | 10.00 | |
| Income from investment operations: | | | | | | | | | | | | |
| Net investment income (b,c) | | | 0.15 | | | | 0.23 | | | | 0.03 | |
| Net realized and unrealized gain (loss) on investments | | | 1.04 | | | | (1.74 | ) | | | 0.17 | |
| Total income (loss) from investment operations | | | 1.19 | | | | (1.51 | ) | | | 0.20 | |
| Less distributions from: | | | | | | | | | | | | |
| Net investment income | | | — | | | | (0.19 | ) | | | — | |
| Net realized gain | | | — | | | | 0.00 | | | | — | |
| Total distributions from net investment income and net realized gains | | | — | | | | (0.19 | ) | | | — | |
| Net asset value, end of period | | $ | 9.69 | | | $ | 8.50 | | | $ | 10.20 | |
| Total return (d) | | | 14.00 | % | | | (14.80 | )% (j) | | | 2.00 | % (i) |
| Ratios and Supplemental Data: | | | | | | | | | | | | |
| Net assets, end of period (in 000’s) | | $ | 105,527 | | | $ | 98,694 | | | $ | 67,071 | |
| Ratio of net expenses to average net assets (e) | | | 0.69 | % (g) | | | 0.69 | % | | | 0.69 | % (g) |
| Ratio of gross expenses to average net assets (e,f) | | | 0.71 | % (g) | | | 0.70 | % | | | 0.69 | % (g) |
| Ratio of net investment income to average net assets (c,e) | | | 3.22 | % (g) | | | 2.30 | % | | | 1.99 | % (g) |
| Portfolio turnover rate | | | 30 | % (h) | | | 67 | % | | | 4 | % (h) |
| | | | | | | | | | | | | |
| (a) | Global Atlantic BlackRock Disciplined International Core Portfolio inception date is November 1, 2017. Commenced operations on November 6, 2017. |
| (b) | Net investment income has been calculated using the average shares method, which more appropriately presents the per share data for the period. |
| (c) | Recognition of net investment income by the Portfolio is affected by the timing of the declaration of dividends by the underlying investment companies in which the Portfolio invests. |
| (d) | Total returns are historical and assume changes in share price and reinvestment of dividends and capital gains distributions. Total return does not reflect the deduction of taxes that a shareholder may pay on Portfolio distributions or on the redemption of Portfolio shares, as well as other charges and expenses of the insurance contract or separate account. Total returns for periods of less than one year are not annualized. Total returns would have been lower absent fee waivers by the Adviser. |
| (e) | Does not include the expenses of the investment companies in which the Portfolio invests. |
| (f) | Represents the ratio of expenses to average net assets absent fee waivers and/or expense reimbursements by the Adviser. |
| (i) | For the period ended December 31, 2017, 0.13% of the Portfolio’s total return consisted of a reimbursement from an affiliate. Excluding this item, total return would have been 1.87%. |
| (j) | For the year ended December 31, 2018, 0.10% of the Portfolio’s total return consisted of a reimbursement from an affiliate. Excluding this item, total return would have been (14.90)%. |
See accompanying notes to financial statements.
| Global Atlantic Portfolios |
| Financial Highlights |
| Global Atlantic BlackRock Disciplined International Core Portfolio |
| |
| Selected data based on a share outstanding throughout each period indicated. |
| | | Class II Shares | |
| | | Six months ended | | | Year ended | | | Period Ended | |
| | | June 30, 2019 | | | December 31, | | | December 31, | |
| | | (Unaudited) | | | 2018 | | | 2017(a) | |
| Net asset value, beginning of period | | $ | 8.49 | | | $ | 10.19 | | | $ | 10.00 | |
| Income from investment operations: | | | | | | | | | | | | |
| Net investment income (b,c) | | | 0.14 | | | | 0.22 | | | | 0.05 | |
| Net realized and unrealized gain (loss) on investments | | | 1.04 | | | | (1.74 | ) | | | 0.14 | |
| Total income (loss) from investment operations | | | 1.18 | | | | (1.52 | ) | | | 0.19 | |
| Less distributions from: | | | | | | | | | | | | |
| Net investment income | | | — | | | | (0.18 | ) | | | — | |
| Net realized gain | | | — | | | | 0.00 | | | | — | |
| Total distributions from net investment income and net realized gains | | | — | | | $ | (0.18 | ) | | $ | — | |
| Net asset value, end of period | | $ | 9.67 | | | $ | 8.49 | | | $ | 10.19 | |
| Total return (d) | | | 13.90 | % | | | (14.95 | )% (j) | | | 1.90 | % (i) |
| Ratios and Supplemental Data: | | | | | | | | | | | | |
| Net assets, end of period (in 000’s) | | $ | 43,430 | | | $ | 41,052 | | | $ | 5,097 | |
| Ratio of net expenses to average net assets (e) | | | 0.94 | % (g) | | | 0.94 | % | | | 0.93 | % (g) |
| Ratio of gross expenses to average net assets (e,f) | | | 0.96 | % (g) | | | 0.95 | % | | | 0.93 | % (g) |
| Ratio of net investment income to average net assets (c,e) | | | 2.96 | % (g) | | | 2.23 | % | | | 3.34 | % (g) |
| Portfolio turnover rate | | | 30 | % (h) | | | 67 | % | | | 4 | % (h) |
| | | | | | | | | | | | | |
| (a) | Global Atlantic BlackRock Disciplined International Core Portfolio inception date is November 1, 2017. Commenced operations on November 6, 2017. |
| (b) | Net investment income has been calculated using the average shares method, which more appropriately presents the per share data for the period. |
| (c) | Recognition of net investment income by the Portfolio is affected by the timing of the declaration of dividends by the underlying investment companies in which the Portfolio invests. |
| (d) | Total returns are historical and assume changes in share price and reinvestment of dividends and capital gains distributions. Total return does not reflect the deduction of taxes that a shareholder may pay on Portfolio distributions or on the redemption of Portfolio shares, as well as other charges and expenses of the insurance contract or separate account. Total returns for periods of less than one year are not annualized. Total returns would have been lower absent fee waivers by the Adviser. |
| (e) | Does not include the expenses of the investment companies in which the Portfolio invests. |
| (f) | Represents the ratio of expenses to average net assets absent fee waivers and/or expense reimbursements by the Adviser. |
| (i) | For the period ended December 31, 2017, the Portfolio received a reimbursement from a related party. This reimbursement had no impact on the Portfolio’s total return. |
| (j) | For the year ended December 31, 2018, 0.10% of the Portfolio’s total return consisted of a reimbursement from an affiliate. Excluding this item, total return would have been (15.05)%. |
See accompanying notes to financial statements.
| Global Atlantic Portfolios |
| Financial Highlights |
| Global Atlantic BlackRock Disciplined Mid Cap Growth Portfolio |
| |
| Selected data based on a share outstanding throughout each period indicated. |
| | | Class I Shares | |
| | | Six months ended | | | Year ended | | | Period Ended | |
| | | June 30, 2019 | | | December 31, | | | December 31, | |
| | | (Unaudited) | | | 2018 | | | 2017(a) | |
| Net asset value, beginning of period | | $ | 9.91 | | | $ | 10.35 | | | $ | 10.00 | |
| Income from investment operations: | | | | | | | | | | | | |
| Net investment income (b) | | | 0.03 | | | | 0.11 | | | | 0.01 | |
| Net realized and unrealized gain (loss) on investments | | | 2.49 | | | | (0.43 | ) | | | 0.34 | |
| Total income (loss) from investment operations | | | 2.52 | | | | (0.32 | ) | | | 0.35 | |
| Less distributions from: | | | | | | | | | | | | |
| Net investment income | | | — | | | | (0.09 | ) | | | — | |
| net realized gain | | | — | | | | (0.03 | ) | | | — | |
| Total distributions from net investment income and net realized gains | | | — | | | | (0.12 | ) | | | — | |
| Net asset value, end of period | | $ | 12.43 | | | $ | 9.91 | | | $ | 10.35 | |
| Total return (c) | | | 25.53 | % | | | (3.07 | )% (g) | | | 3.50 | % (g) |
| Ratios and Supplemental Data: | | | | | | | | | | | | |
| Net assets, end of period (in 000’s) | | $ | 144,385 | | | $ | 126,149 | | | $ | 93,457 | |
| Ratio of net expenses to average net assets | | | 0.63 | % (d) | | | 0.63 | % | | | 0.63 | % (d) |
| Ratio of gross expenses to average net assets (e) | | | 0.66 | % (d) | | | 0.65 | % | | | 0.64 | % (d) |
| Ratio of net investment income to average net assets | | | 0.45 | % (d) | | | 0.99 | % | | | 0.79 | % (d) |
| Portfolio turnover rate | | | 87 | % (f) | | | 168 | % | | | 26 | % (f) |
| | | | | | | | | | | | | |
| (a) | Global Atlantic BlackRock Disciplined Mid Cap Growth Portfolio inception date is November 1, 2017. Commenced operations on November 6, 2017. |
| (b) | Net investment income has been calculated using the average shares method, which more appropriately presents the per share data for the period. |
| (c) | Total returns are historical and assume changes in share price and reinvestment of dividends and capital gains distributions. Total return does not reflect the deduction of taxes that a shareholder may pay on Portfolio distributions or on the redemption of Portfolio shares, as well as other charges and expenses of the insurance contract or separate account. Total returns for periods of less than one year are not annualized. Total returns would have been lower absent fee waivers by the Adviser. |
| (e) | Represents the ratio of expenses to average net assets absent fee waivers and/or expense reimbursements by the Adviser. |
| (g) | For the period ended December 31, 2017 and the year ended December 31, 2018, the Portfolio received reimbursements from a related party. The reimbursements had no impact on the Portfolio’s total return. |
See accompanying notes to financial statements.
| Global Atlantic Portfolios |
| Financial Highlights |
| Global Atlantic BlackRock Disciplined Mid Cap Growth Portfolio |
| |
| Selected data based on a share outstanding throughout each period indicated. |
| | | Class II Shares | |
| | | Six months ended | | | Year ended | | | Period Ended | |
| | | June 30, 2019 | | | December 31, | | | December 31, | |
| | | (Unaudited) | | | 2018 | | | 2017(a) | |
| Net asset value, beginning of period | | $ | 9.90 | | | $ | 10.35 | | | $ | 10.00 | |
| Income from investment operations: | | | | | | | | | | | | |
| Net investment income (b) | | | 0.01 | | | | 0.08 | | | | 0.01 | |
| Net realized and unrealized gain (loss) on investments | | | 2.50 | | | | (0.43 | ) | | | 0.34 | |
| Total income (loss) from investment operations | | | 2.51 | | | | (0.35 | ) | | | 0.35 | |
| Less distributions from: | | | | | | | | | | | | |
| Net investment income | | | — | | | | (0.07 | ) | | | — | |
| net realized gain | | | — | | | | (0.03 | ) | | | — | |
| Total distributions from net investment income and net realized gains | | | — | | | | (0.10 | ) | | | — | |
| Net asset value, end of period | | $ | 12.41 | | | $ | 9.90 | | | $ | 10.35 | |
| Total return (c) | | | 25.45 | % | | | (3.35 | )% (g) | | | 3.50 | % (g) |
| Ratios and Supplemental Data: | | | | | | | | | | | | |
| Net assets, end of period (in 000’s) | | $ | 50,475 | | | $ | 43,290 | | | $ | 17,801 | |
| Ratio of net expenses to average net assets | | | 0.88 | % (d) | | | 0.88 | % | | | 0.88 | % (d) |
| Ratio of gross expenses to average net assets (e) | | | 0.91 | % (d) | | | 0.90 | % | | | 0.89 | % (d) |
| Ratio of net investment income to average net assets | | | 0.20 | % (d) | | | 0.77 | % | | | 0.41 | % (d) |
| Portfolio turnover rate | | | 87 | % (f) | | | 168 | % | | | 26 | % (f) |
| | | | | | | | | | | | | |
| (a) | Global Atlantic BlackRock Disciplined Mid Cap Growth Portfolio inception date is November 1, 2017. Commenced operations on November 6, 2017. |
| (b) | Net investment income has been calculated using the average shares method, which more appropriately presents the per share data for the period. |
| (c) | Total returns are historical and assume changes in share price and reinvestment of dividends and capital gains distributions. Total return does not reflect the deduction of taxes that a shareholder may pay on Portfolio distributions or on the redemption of Portfolio shares, as well as other charges and expenses of the insurance contract or separate account. Total returns for periods of less than one year are not annualized. Total returns would have been lower absent fee waivers by the Adviser. |
| (e) | Represents the ratio of expenses to average net assets absent fee waivers and/or expense reimbursements by the Adviser. |
| (g) | For the period ended December 31, 2017 and the year ended December 31, 2018, the Portfolio received reimbursements from a related party. The reimbursements had no impact on the Portfolio’s total return. |
See accompanying notes to financial statements.
| Global Atlantic Portfolios |
| Financial Highlights |
| Global Atlantic BlackRock Disciplined Small Cap Portfolio |
| |
| Selected data based on a share outstanding throughout each period indicated. |
| | | Class I Shares | |
| | | Six months ended | | | Year ended | | | Period Ended | |
| | | June 30, 2019 | | | December 31, | | | December 31, | |
| | | (Unaudited) | | | 2018 | | | 2017(a) | |
| Net asset value, beginning of period | | $ | 9.19 | | | $ | 10.22 | | | $ | 10.00 | |
| Income from investment operations: | | | | | | | | | | | | |
| Net investment income (b) | | | 0.05 | | | | 0.07 | | | | 0.01 | |
| Net realized and unrealized gain (loss) on investments | | | 1.58 | | | | (1.04 | ) | | | 0.21 | |
| Total income from investment operations | | | 1.63 | | | | (0.97 | ) | | | 0.22 | |
| Less distributions from: | | | | | | | | | | | | |
| Net investment income | | | — | | | | (0.03 | ) | | | — | |
| Net realized gain | | | — | | | | (0.03 | ) | | | — | |
| Total distributions from net investment income and net realized gains | | | — | | | | (0.06 | ) | | | — | |
| Net asset value, end of period | | $ | 10.82 | | | $ | 9.19 | | | $ | 10.22 | |
| Total return (c) | | | 18.50 | % | | | (9.49 | )% (g) | | | 2.20 | % (g) |
| Ratios and Supplemental Data: | | | | | | | | | | | | |
| Net assets, end of period (in 000’s) | | $ | 9,294 | | | $ | 8,813 | | | $ | 11,457 | |
| Ratio of net expenses to average net assets | | | 0.63 | % (d) | | | 0.63 | % | | | 0.63 | % (d) |
| Ratio of gross expenses to average net assets (e) | | | 0.68 | % (d) | | | 0.65 | % | | | 0.64 | % (d) |
| Ratio of net investment income to average net assets | | | 0.94 | % (d) | | | 0.67 | % | | | 0.89 | % (d) |
| Portfolio turnover rate | | | 21 | % (f) | | | 40 | % | | | 15 | % (f) |
| | | | | | | | | | | | | |
| (a) | Global Atlantic BlackRock Disciplined Small Cap Portfolio inception date is November 1, 2017. Commenced operations on November 6, 2017. |
| (b) | Net investment income has been calculated using the average shares method, which more appropriately presents the per share data for the period. |
| (c) | Total returns are historical and assume changes in share price and reinvestment of dividends and capital gains distributions. Total return does not reflect the deduction of taxes that a shareholder may pay on Portfolio distributions or on the redemption of Portfolio shares, as well as other charges and expenses of the insurance contract or separate account. Total returns for periods of less than one year are not annualized. Total returns would have been lower absent fee waivers by the Adviser. |
| (e) | Represents the ratio of expenses to average net assets absent fee waivers and/or expense reimbursements by the Adviser. |
| (g) | For the period ended December 31, 2017 and the year ended December 31, 2018, the Portfolio received reimbursements from a related party. The reimbursements had no impact on the Portfolio’s total return. |
See accompanying notes to financial statements.
| Global Atlantic Portfolios |
| Financial Highlights |
| Global Atlantic BlackRock Disciplined Small Cap Portfolio |
| |
| Selected data based on a share outstanding throughout each period indicated. |
| | | Class II Shares | |
| | | Six months ended | | | Year ended | | | Period Ended | |
| | | June 30, 2019 | | | December 31, | | | December 31, | |
| | | (Unaudited) | | | 2018 | | | 2017(a) | |
| Net asset value, beginning of period | | $ | 9.18 | | | $ | 10.22 | | | $ | 10.00 | |
| Income from investment operations: | | | | | | | | | | | | |
| Net investment income (b) | | | 0.04 | | | | 0.05 | | | | 0.01 | |
| Net realized and unrealized gain (loss) on investments | | | 1.58 | | | | (1.05 | ) | | | 0.21 | |
| Total income (loss) from investment operations | | | 1.62 | | | | (1.00 | ) | | | 0.22 | |
| Less distributions from: | | | | | | | | | | | | |
| Net investment income | | | — | | | | (0.01 | ) | | | — | |
| Net realized gain | | | — | | | | (0.03 | ) | | | — | |
| Total distributions from net investment income and net realized gains | | | — | | | | (0.04 | ) | | | — | |
| Net asset value, end of period | | $ | 10.80 | | | $ | 9.18 | | | $ | 10.22 | |
| Total return (c) | | | 18.41 | % | | | (9.75 | )% (g) | | | 2.20 | % (g) |
| Ratios and Supplemental Data: | | | | | | | | | | | | |
| Net assets, end of period (in 000’s) | | $ | 8,469 | | | $ | 7,533 | | | $ | 4,075 | |
| Ratio of net expenses to average net assets | | | 0.88 | % (d) | | | 0.88 | % | | | 0.87 | % (d) |
| Ratio of gross expenses to average net assets (e) | | | 0.93 | % (d) | | | 0.90 | % | | | 0.87 | % (d) |
| Ratio of net investment income to average net assets | | | 0.70 | % (d) | | | 0.44 | % | | | 0.75 | % (d) |
| Portfolio turnover rate | | | 21 | % (f) | | | 40 | % | | | 15 | % (f) |
| | | | | | | | | | | | | |
| (a) | Global Atlantic BlackRock Disciplined Small Cap Portfolio inception date is November 1, 2017. Commenced operations on November 6, 2017. |
| (b) | Net investment income has been calculated using the average shares method, which more appropriately presents the per share data for the period. |
| (c) | Total returns are historical and assume changes in share price and reinvestment of dividends and capital gains distributions. Total return does not reflect the deduction of taxes that a shareholder may pay on Portfolio distributions or on the redemption of Portfolio shares, as well as other charges and expenses of the insurance contract or separate account. Total returns for periods of less than one year are not annualized. Total returns would have been lower absent fee waivers by the Adviser. |
| (e) | Represents the ratio of expenses to average net assets absent fee waivers and/or expense reimbursements by the Adviser. |
| (g) | For the period ended December 31, 2017 and the year ended December 31, 2018, the Portfolio received reimbursements from a related party. The reimbursements had no impact on the Portfolio’s total return. |
See accompanying notes to financial statements.
| Global Atlantic Portfolios |
| Financial Highlights |
| Global Atlantic BlackRock Disciplined U.S. Core Portfolio |
| |
| Selected data based on a share outstanding throughout each period indicated. |
| | | Class I Shares | |
| | | Six months ended | | | Year ended | | | Period Ended | |
| | | June 30, 2019 | | | December 31, | | | December 31, | |
| | | (Unaudited) | | | 2018 | | | 2017(a) | |
| Net asset value, beginning of period | | $ | 9.66 | | | $ | 10.40 | | | $ | 10.00 | |
| Income from investment operations: | | | | | | | | | | | | |
| Net investment income (b) | | | 0.08 | | | | 0.16 | | | | 0.03 | |
| Net realized and unrealized gain (loss) on investments | | | 1.69 | | | | (0.67 | ) | | | 0.37 | |
| Total income (loss) from investment operations | | | 1.77 | | | | (0.51 | ) | | | 0.40 | |
| Less distributions from: | | | | | | | | | | | | |
| Net investment income | | | — | | | | (0.14 | ) | | | — | |
| net realized gain | | | — | | | | (0.09 | ) | | | — | |
| Total distributions from net investment income and net realized gains | | | — | | | | (0.23 | ) | | | — | |
| Net asset value, end of period | | $ | 11.43 | | | $ | 9.66 | | | $ | 10.40 | |
| Total return (c) | | | 18.32 | % | | | (5.03 | )% (g) | | | 4.00 | % (g) |
| Ratios and Supplemental Data: | | | | | | | | | | | | |
| Net assets, end of period (in 000’s) | | $ | 21,398 | | | $ | 18,963 | | | $ | 23,118 | |
| Ratio of net expenses to average net assets | | | 0.48 | % (d) | | | 0.48 | % | | | 0.48 | % (d) |
| Ratio of gross expenses to average net assets (e) | | | 0.52 | % (d) | | | 0.50 | % | | | 0.49 | % (d) |
| Ratio of net investment income to average net assets | | | 1.55 | % (d) | | | 1.48 | % | | | 1.88 | % (d) |
| Portfolio turnover rate | | | 78 | % (f) | | | 172 | % | | | 24 | % (f) |
| | | | | | | | | | | | | |
| (a) | Global Atlantic BlackRock Disciplined U.S. Core Portfolio inception date is November 1, 2017. Commenced operations on November 6, 2017. |
| (b) | Net investment income has been calculated using the average shares method, which more appropriately presents the per share data for the period. |
| (c) | Total returns are historical and assume changes in share price and reinvestment of dividends and capital gains distributions. Total return does not reflect the deduction of taxes that a shareholder may pay on Portfolio distributions or on the redemption of Portfolio shares, as well as other charges and expenses of the insurance contract or separate account. Total returns for periods of less than one year are not annualized. Total returns would have been lower absent fee waivers by the Adviser. |
| (e) | Represents the ratio of expenses to average net assets absent fee waivers and/or expense reimbursements by the Adviser. |
| (g) | For the period ended December 31, 2017 and the year ended December 31, 2018, the Portfolio received reimbursements from a related party. The reimbursements had no impact on the Portfolio’s total return. |
See accompanying notes to financial statements.
| Global Atlantic Portfolios |
| Financial Highlights |
| Global Atlantic BlackRock Disciplined U.S. Core Portfolio |
| |
| Selected data based on a share outstanding throughout each period indicated. |
| | | Class II Shares | |
| | | Six months ended | | | Year ended | | | Period Ended | |
| | | June 30, 2019 | | | December 31, | | | December 31, | |
| | | (Unaudited) | | | 2018 | | | 2017(a) | |
| Net asset value, beginning of period | | $ | 9.65 | | | $ | 10.39 | | | $ | 10.00 | |
| Income from investment operations: | | | | | | | | | | | | |
| Net investment income (b) | | | 0.07 | | | | 0.14 | | | | 0.02 | |
| Net realized and unrealized gain (loss) on investments | | | 1.68 | | | | (0.67 | ) | | | 0.37 | |
| Total income (loss) from investment operations | | | 1.75 | | | | (0.53 | ) | | | 0.39 | |
| Less distributions from: | | | | | | | | | | | | |
| Net investment income | | | — | | | | (0.12 | ) | | | — | |
| net realized gain | | | — | | | | (0.09 | ) | | | — | |
| Total distributions from net investment income and net realized gains | | | — | | | | (0.21 | ) | | | — | |
| Net asset value, end of period | | $ | 11.40 | | | $ | 9.65 | | | $ | 10.39 | |
| Total return (c) | | | 18.13 | % | | | (5.17 | )% (g) | | | 3.90 | % (g) |
| Ratios and Supplemental Data: | | | | | | | | | | | | |
| Net assets, end of period (in 000’s) | | $ | 3,467 | | | $ | 2,965 | | | $ | 218 | |
| Ratio of net expenses to average net assets | | | 0.73 | % (d) | | | 0.73 | % | | | 0.72 | % (d) |
| Ratio of gross expenses to average net assets (e) | | | 0.77 | % (d) | | | 0.75 | % | | | 0.72 | % (d) |
| Ratio of net investment income to average net assets | | | 1.31 | % (d) | | | 1.25 | % | | | 0.98 | % (d) |
| Portfolio turnover rate | | | 78 | % (f) | | | 172 | % | | | 24 | % (f) |
| | | | | | | | | | | | | |
| (a) | Global Atlantic BlackRock Disciplined U.S. Core Portfolio inception date is November 1, 2017. Commenced operations on November 6, 2017. |
| (b) | Net investment income has been calculated using the average shares method, which more appropriately presents the per share data for the period. |
| (c) | Total returns are historical and assume changes in share price and reinvestment of dividends and capital gains distributions. Total return does not reflect the deduction of taxes that a shareholder may pay on Portfolio distributions or on the redemption of Portfolio shares, as well as other charges and expenses of the insurance contract or separate account. Total returns for periods of less than one year are not annualized. Total returns would have been lower absent fee waivers by the Adviser. |
| (e) | Represents the ratio of expenses to average net assets absent fee waivers and/or expense reimbursements by the Adviser. |
| (g) | For the period ended December 31, 2017 and the year ended December 31, 2018, the Portfolio received reimbursements from a related party. The reimbursements had no impact on the Portfolio’s total return. |
See accompanying notes to financial statements.
| Global Atlantic Portfolios |
| Financial Highlights |
| Global Atlantic BlackRock Disciplined Value Portfolio |
| |
| Selected data based on a share outstanding throughout the period indicated. |
| | | Class I Shares | |
| | | Six months ended | | | Year ended | | | Period Ended | |
| | | June 30, 2019 | | | December 31, | | | December 31, | |
| | | (Unaudited) | | | 2018 | | | 2017(a) | |
| Net asset value, beginning of period | | $ | 9.39 | | | $ | 10.44 | | | $ | 10.00 | |
| Income from investment operations: | | | | | | | | | | | | |
| Net investment income (b) | | | 0.11 | | | | 0.20 | | | | 0.03 | |
| Net realized and unrealized gain (loss) on investments | | | 1.42 | | | | (1.02 | ) | | | 0.41 | |
| Total income (loss) from investment operations | | | 1.53 | | | | (0.82 | ) | | | 0.44 | |
| Less distributions from: | | | | | | | | | | | | |
| Net investment income | | | — | | | | (0.16 | ) | | | — | |
| Net realized gain | | | — | | | | (0.07 | ) | | | — | |
| Total distributions from net investment income and net realized gains | | | — | | | | (0.23 | ) | | | — | |
| Net asset value, end of period | | $ | 10.92 | | | $ | 9.39 | | | $ | 10.44 | |
| Total return (c) | | | 16.40 | % | | | (7.97 | )% (g) | | | 4.40 | % (g) |
| Ratios and Supplemental Data: | | | | | | | | | | | | |
| Net assets, end of period (in 000’s) | | $ | 267,935 | | | $ | 248,141 | | | $ | 309,640 | |
| Ratio of net expenses to average net assets | | | 0.54 | % (d) | | | 0.54 | % | | | 0.54 | % (d) |
| Ratio of gross expenses to average net assets (e) | | | 0.55 | % (d) | | | 0.55 | % | | | 0.54 | % (d) |
| Ratio of net investment income to average net assets | | | 2.14 | % (d) | | | 1.93 | % | | | 1.99 | % (d) |
| Portfolio turnover rate | | | 76 | % (f) | | | 140 | % | | | 17 | % (f) |
| | | | | | | | | | | | | |
| (a) | Global Atlantic BlackRock Disciplined Value Portfolio inception date is November 1, 2017. Commenced operations on November 6, 2017. |
| (b) | Net investment income has been calculated using the average shares method, which more appropriately presents the per share data for the period. |
| (c) | Total returns are historical and assume changes in share price and reinvestment of dividends and capital gains distributions. Total return does not reflect the deduction of taxes that a shareholder may pay on Portfolio distributions or on the redemption of Portfolio shares, as well as other charges and expenses of the insurance contract or separate account. Total returns for periods of less than one year are not annualized. Total returns would have been lower absent fees waived by the adviser. |
| (e) | Represents the ratio of expenses to average net assets absent fee waivers and/or expense reimbursements by the Adviser. |
| (g) | For the period ended December 31, 2017 and the year ended December 31, 2018, the Portfolio received reimbursements from a related party. The reimbursements had no impact on the Portfolio’s total return. |
See accompanying notes to financial statements.
| Global Atlantic Portfolios |
| Financial Highlights |
| Global Atlantic BlackRock Disciplined Value Portfolio |
| |
| Selected data based on a share outstanding throughout the period indicated. |
| | | Class II Shares | |
| | | Six months ended | | | Year ended | | | Period Ended | |
| | | June 30, 2019 | | | December 31, | | | December 31, | |
| | | (Unaudited) | | | 2018 | | | 2017(a) | |
| Net asset value, beginning of period | | $ | 9.40 | | | $ | 10.45 | | | $ | 10.00 | |
| Income from investment operations: | | | | | | | | | | | | |
| Net investment income (b) | | | 0.10 | | | | 0.18 | | | | 0.02 | |
| Net realized and unrealized gain (loss) on investments | | | 1.42 | | | | (1.02 | ) | | | 0.43 | |
| Total income (loss) from investment operations | | | 1.52 | | | | (0.84 | ) | | | 0.45 | |
| Less distributions from: | | | | | | | | | | | | |
| Net investment income | | | — | | | | (0.14 | ) | | | — | |
| Net realized gain | | | — | | | | (0.07 | ) | | | — | |
| Total distributions from net investment income and net realized gains | | | — | | | | (0.21 | ) | | | — | |
| Net asset value, end of period | | $ | 10.92 | | | $ | 9.40 | | | $ | 10.45 | |
| Total return (c) | | | 16.17 | % | | | (8.16 | )% (g) | | | 4.50 | % (g) |
| Ratios and Supplemental Data: | | | | | | | | | | | | |
| Net assets, end of period (in 000’s) | | $ | 7,619 | | | $ | 7,160 | | | $ | 9,545 | |
| Ratio of net expenses to average net assets | | | 0.79 | % (d) | | | 0.79 | % | | | 0.78 | % (d) |
| Ratio of gross expenses to average net assets (e) | | | 0.80 | % (d) | | | 0.80 | % | | | 0.78 | % (d) |
| Ratio of net investment income to average net assets | | | 1.89 | % (d) | | | 1.68 | % | | | 1.34 | % (d) |
| Portfolio turnover rate | | | 76 | % (f) | | | 140 | % | | | 17 | % (f) |
| | | | | | | | | | | | | |
| (a) | Global Atlantic BlackRock Disciplined Value Portfolio inception date is November 1, 2017. Commenced operations on November 6, 2017. |
| (b) | Net investment income has been calculated using the average shares method, which more appropriately presents the per share data for the period. |
| (c) | Total returns are historical and assume changes in share price and reinvestment of dividends and capital gains distributions. Total return does not reflect the deduction of taxes that a shareholder may pay on Portfolio distributions or on the redemption of Portfolio shares, as well as other charges and expenses of the insurance contract or separate account. Total returns for periods of less than one year are not annualized. Total returns would have been lower absent fees waived by the Adviser. |
| (e) | Represents the ratio of expenses to average net assets absent fee waivers and/or expense reimbursements by the Adviser. |
| (g) | For the period ended December 31, 2017 and the year ended December 31, 2018, the Portfolio received reimbursements from a related party. The reimbursements had no impact on the Portfolio’s total return. |
See accompanying notes to financial statements.
| Global Atlantic Portfolios |
| Financial Highlights |
| Global Atlantic BlackRock High Yield Portfolio |
| |
| Selected data based on a share outstanding throughout the period indicated. |
| | | Class I Shares | |
| | | Six Months Ended | | | Year Ended | | | Period Ended | |
| | | June 30, 2019 | | | December 31, | | | December 31, | |
| | | (Unaudited) | | | 2018 | | | 2017(a) | |
| Net asset value, beginning of period | | $ | 9.43 | | | $ | 9.92 | | | $ | 10.00 | |
| Income from investment operations: | | | | | | | | | | | | |
| Net investment income (b) | | | 0.26 | | | | 0.52 | | | | 0.07 | |
| Net realized and unrealized gain/(loss) on investments | | | 0.74 | | | | (0.95 | ) | | | (0.15 | ) |
| Total gain/(loss) from investment operations | | | 1.00 | | | | (0.43 | ) | | | (0.08 | ) |
| Less distributions from: | | | | | | | | | | | | |
| Net investment income | | | — | | | | (0.06 | ) | | | — | |
| Net realized gain | | | — | | | | — | | | | — | |
| Total distributions from net investment income and net realized gains | | | — | | | | (0.06 | ) | | | — | |
| Net asset value, end of period | | $ | 10.43 | | | $ | 9.43 | | | $ | 9.92 | |
| Total return (c) | | | 10.60 | % | | | (4.32 | )% | | | (0.80 | )% (g) |
| Ratios and Supplemental Data: | | | | | | | | | | | | |
| Net assets, end of period (in 000’s) | | $ | 72,636 | | | $ | 69,255 | | | $ | 83,070 | |
| Ratio of net expenses to average net assets | | | 0.59 | % (d) | | | 0.59 | % | | | 0.59 | % (d) |
| Ratio of gross expenses to average net assets (e) | | | 0.62 | % (d) | | | 0.60 | % | | | 0.59 | % (d) |
| Ratio of net investment income to average net assets | | | 5.27 | % (d) | | | 5.24 | % | | | 4.54 | % (d) |
| Portfolio turnover rate | | | 25 | % (f) | | | 36 | % | | | 3 | % (f) |
| | | | | | | | | | | | | |
| (a) | Global Atlantic BlackRock High Yield Portfolio inception date is November 1, 2017. Commenced operations on November 6, 2017. |
| (b) | Net investment income has been calculated using the average shares method, which more appropriately presents the per share data for the period. |
| (c) | Total returns are historical and assume changes in share price and reinvestment of dividends and capital gains distributions. Total return does not reflect the deduction of taxes that a shareholder may pay on Portfolio distributions or on the redemption of Portfolio shares, as well as other charges and expenses of the insurance contract or separate account. Total returns for periods of less than one year are not annualized. Total returns would have been lower absent fee waivers by the Adviser. |
| (e) | Represents the ratio of expenses to average net assets absent fee waivers and/or expense reimbursements by the Adviser. |
| (g) | For the period ended December 31, 2017, the Portfolio received a reimbursement from a related party. This reimbursement had no impact on the Portfolio’s total return. |
See accompanying notes to financial statements.
| Global Atlantic Portfolios |
| Financial Highlights |
| Global Atlantic BlackRock High Yield Portfolio |
| |
| Selected data based on a share outstanding throughout the period indicated. |
| | | Class II Shares | |
| | | Six Months Ended | | | Year Ended | | | Period Ended | |
| | | June 30, 2019 | | | December 31, | | | December 31, | |
| | | (Unaudited) | | | 2018 | | | 2017(a) | |
| Net asset value, beginning of period | | $ | 9.41 | | | $ | 9.92 | | | $ | 10.00 | |
| Income from investment operations: | | | | | | | | | | | | |
| Net investment income (b) | | | 0.25 | | | | 0.49 | | | | 0.07 | |
| Net realized and unrealized gain/(loss) on investments | | | 0.73 | | | | (0.94 | ) | | | (0.15 | ) |
| Total gain/(loss) from investment operations | | | 0.98 | | | | (0.45 | ) | | | (0.08 | ) |
| Less distributions from: | | | | | | | | | | | | |
| Net investment income | | | — | | | | (0.06 | ) | | | — | |
| Net realized gain | | | — | | | | — | | | | — | |
| Total distributions from net investment income and net realized gains | | | — | | | | (0.06 | ) | | | — | |
| Net asset value, end of period | | $ | 10.39 | | | $ | 9.41 | | | $ | 9.92 | |
| Total return (c) | | | 10.41 | % | | | (4.56 | )% | | | (0.80 | )% (g) |
| Ratios and Supplemental Data: | | | | | | | | | | | | |
| Net assets, end of period (in 000’s) | | $ | 916 | | | $ | 1,071 | | | $ | 1,405 | |
| Ratio of net expenses to average net assets | | | 0.84 | % (d) | | | 0.84 | % | | | 0.83 | % (d) |
| Ratio of gross expenses to average net assets (e) | | | 0.87 | % (d) | | | 0.85 | % | | | 0.83 | % (d) |
| Ratio of net investment income to average net assets | | | 5.02 | % (d) | | | 4.99 | % | | | 4.31 | % (d) |
| Portfolio turnover rate | | | 25 | % (f) | | | 36 | % | | | 3 | % (f) |
| | | | | | | | | | | | | |
| (a) | Global Atlantic BlackRock High Yield Portfolio inception date is November 1, 2017. Commenced operations on November 6, 2017. |
| (b) | Net investment income has been calculated using the average shares method, which more appropriately presents the per share data for the period. |
| (c) | Total returns are historical and assume changes in share price and reinvestment of dividends and capital gains distributions. Total return does not reflect the deduction of taxes that a shareholder may pay on Portfolio distributions or on the redemption of Portfolio shares, as well as other charges and expenses of the insurance contract or separate account. Total returns for periods of less than one year are not annualized. Total returns would have been lower absent fee waivers by the Adviser. |
| (e) | Represents the ratio of expenses to average net assets absent fee waivers and/or expense reimbursements by the Adviser. |
| (g) | For the period ended December 31, 2017, the Portfolio received a reimbursement from a related party. This reimbursement had no impact on the Portfolio’s total return. |
See accompanying notes to financial statements.
| Global Atlantic Portfolios |
| Financial Highlights |
| Global Atlantic Goldman Sachs Core Fixed Income Portfolio |
| |
| Selected data based on a share outstanding throughout the period indicated. |
| | | Class I Shares | |
| | | Six Months Ended | | | Year Ended | | | Period Ended | |
| | | June 30, 2019 | | | December 31, | | | December 31, | |
| | | (Unaudited) | | | 2018 | | | 2017(a) | |
| Net asset value, beginning of period | | $ | 9.92 | | | $ | 9.98 | | | $ | 10.00 | |
| Income from investment operations: | | | | | | | | | | | | |
| Net investment income (b) | | | 0.14 | | | | 0.25 | | | | 0.03 | |
| Net realized and unrealized gain/(loss) on investments | | | 0.54 | | | | (0.31 | ) | | | (0.05 | ) |
| Total gain/(loss) from investment operations | | | 0.68 | | | | (0.06 | ) | | | (0.02 | ) |
| Less distributions from: | | | | | | | | | | | | |
| Net investment income | | | — | | | | (0.00 | ) (h) | | | — | |
| Net asset value, end of period | | $ | 10.60 | | | $ | 9.92 | | | $ | 9.98 | |
| Total return (c) | | | 6.85 | % | | | (0.55 | )% (g) | | | (0.20 | )% (g) |
| Ratios and Supplemental Data: | | | | | | | | | | | | |
| Net assets, end of period (in 000’s) | | $ | 93,814 | | | $ | 92,760 | | | $ | 35,260 | |
| Ratio of net expenses to average net assets | | | 0.43 | % (d) | | | 0.43 | % | | | 0.43 | % (d) |
| Ratio of gross expenses to average net assets (e) | | | 0.45 | % (d) | | | 0.44 | % | | | 0.44 | % (d) |
| Ratio of net investment income to average net assets | | | 2.81 | % (d) | | | 2.51 | % | | | 1.64 | % (d) |
| Portfolio turnover rate | | | 71 | % (f,i) | | | 248 | % (i) | | | 69 | % (f) |
| | | | | | | | | | | | | |
| (a) | Global Atlantic Goldman Sachs Core Fixed Income Portfolio inception date is November 1, 2017. Commenced operations on November 6, 2017. |
| (b) | Net investment income has been calculated using the average shares method, which more appropriately presents the per share data for the period. |
| (c) | Total returns are historical and assume changes in share price and reinvestment of dividends and capital gains distributions. Total return does not reflect the deduction of taxes that a shareholder may pay on Portfolio distributions or on the redemption of Portfolio shares, as well as other charges and expenses of the insurance contract or separate account. Total returns for periods of less than one year are not annualized. Total returns would have been lower absent fee waivers by the Adviser. |
| (e) | Represents the ratio of expenses to average net assets absent fee waivers and/or expense reimbursements by the Adviser. |
| (g) | For the period ended December 31, 2017 and the year ended December 31, 2018, the Portfolio received a reimbursement from a related party. This reimbursement had no impact on the Portfolio’s total |
| (h) | Represents less than $0.005 per share. |
| (i) | The portfolio turnover rate excludes mortgage dollar roll transactions for the six months ended June 30, 2019 and the year ended December 31, 2018. If these were included in the calculation, the portfolio turnover would be 234% and 486%, respectively. See Note 3 in the accompanying notes to financial statements. |
See accompanying notes to financial statements.
| Global Atlantic Portfolios |
| Financial Highlights |
| Global Atlantic Goldman Sachs Core Fixed Income Portfolio |
| |
| Selected data based on a share outstanding throughout the period indicated. |
| | | Class II Shares | |
| | | Six Months Ended | | | Year Ended | | | Period Ended | |
| | | June 30, 2019 | | | December 31, | | | December 31, | |
| | | (Unaudited) | | | 2018 | | | 2017(a) | |
| Net asset value, beginning of period | | $ | 9.92 | | | $ | 9.98 | | | $ | 10.00 | |
| Income from investment operations: | | | | | | | | | | | | |
| Net realized and unrealized gain/(loss) on investments | | | 0.68 | | | | (0.06 | ) | | | (0.02 | ) |
| Total gain/(loss) from investment operations | | | 0.68 | | | | (0.06 | ) | | | (0.02 | ) |
| Less distributions from: | | | | | | | | | | | | |
| Net investment income | | | — | | | | (0.00 | ) (h) | | | — | |
| Net asset value, end of period | | $ | 10.60 | | | $ | 9.92 | | | $ | 9.98 | |
| Total return (b) | | | 6.85 | % | | | (0.60 | )% (g) | | | (0.20 | )% (g) |
| Ratios and Supplemental Data: | | | | | | | | | | | | |
| Net assets, end of period (in 000’s) (f) | | $ | 10 | | | $ | 10 | | | $ | 10 | |
| Ratio of net expenses to average net assets (d) | | | 0.68 | % (c) | | | 0.68 | % | | | 0.68 | % (c) |
| Ratio of gross expenses to average net assets | | | 0.68 | % (c) | | | 0.68 | % | | | 0.68 | % (c) |
| Ratio of net investment income to average net assets | | | 0.00 | % (c) | | | 0.00 | % | | | 0.00 | % (c) |
| Portfolio turnover rate | | | 71 | % (e,i) | | | 248 | % (i) | | | 69 | % (e) |
| | | | | | | | | | | | | |
| (a) | Global Atlantic Goldman Sachs Core Fixed Income Portfolio inception date is November 1, 2017. Commenced operations on November 6, 2017. |
| (b) | Total returns are historical and assume changes in share price and reinvestment of dividends and capital gains distributions. Total return does not reflect the deduction of taxes that a shareholder may pay on Portfolio distributions or on the redemption of Portfolio shares, as well as other charges and expenses of the insurance contract or separate account. Total returns for periods of less than one year are not annualized. Total returns would have been lower absent fee waivers by the Adviser. |
| (d) | Represents the ratio of expenses to average net assets per the prospectus and does not represent the operating expense for the period. |
| (f) | Represents actual net assets. |
| (g) | For the period ended December 31, 2017 and the year ended December 31, 2018, the Portfolio received a reimbursement from a related party. This reimbursement had no impact on the Portfolio’s total |
| (h) | Represents less than $0.005 per share. |
| (i) | The portfolio turnover rate excludes mortgage dollar roll transactions for the six months ended June 30, 2019 and the year ended December 31, 2018. If these were included in the calculation, the portfolio turnover would be 234% and 486%, respectively. See Note 3 in the accompanying notes to financial statements. |
See accompanying notes to financial statements.
| Global Atlantic Portfolios |
| Financial Highlights |
| Global Atlantic Goldman Sachs Global Equity Insights Portfolio |
| |
| Selected data based on a share outstanding throughout each period indicated. |
| | | Class I Shares | |
| | | Six Months Ended | | | Year Ended | | | Period Ended | |
| | | June 30, 2019 | | | December 31, | | | December 31, | |
| | | (Unaudited) | | | 2018 | | | 2017(a) | |
| Net asset value, beginning of period | | $ | 9.11 | | | $ | 10.29 | | | $ | 10.00 | |
| Income from investment operations: | | | | | | | | | | | | |
| Net investment income (b) | | | 0.10 | | | | 0.14 | | | | 0.02 | |
| Net realized and unrealized gain (loss) on investments | | | 1.19 | | | | (1.18 | ) | | | 0.27 | |
| Total income (loss) from investment operations | | | 1.29 | | | | (1.04 | ) | | | 0.29 | |
| Less distributions from: | | | | | | | | | | | | |
| Net investment income | | | — | | | | (0.12 | ) | | | — | |
| net realized gain | | | — | | | | (0.02 | ) | | | — | |
| Total distributions from net investment income and net realized gains | | | — | | | | (0.14 | ) | | | — | |
| Net asset value, end of period | | $ | 10.40 | | | $ | 9.11 | | | $ | 10.29 | |
| Total return (c) | | | 14.16 | % | | | (10.20 | )% (g) | | | 2.90 | % (g) |
| Ratios and Supplemental Data: | | | | | | | | | | | | |
| Net assets, end of period (in 000’s) | | $ | 16,274 | | | $ | 15,290 | | | $ | 19,915 | |
| Ratio of net expenses to average net assets | | | 0.72 | % (d) | | | 0.72 | % | | | 0.72 | % (d) |
| Ratio of gross expenses to average net assets (e) | | | 0.76 | % (d) | | | 0.74 | % | | | 0.73 | % (d) |
| Ratio of net investment income to average net assets | | | 2.01 | % (d) | | | 1.32 | % | | | 1.15 | % (d) |
| Portfolio turnover rate | | | 70 | % (f) | | | 138 | % | | | 11 | % (f) |
| | | | | | | | | | | | | |
| (a) | Global Atlantic Goldman Sachs Global Equity Insights Portfolio inception date is November 1, 2017. Commenced operations on November 6, 2017. |
| (b) | Net investment income has been calculated using the average shares method, which more appropriately presents the per share data for the period. |
| (c) | Total returns are historical and assume changes in share price and reinvestment of dividends and capital gains distributions. Total return does not reflect the deduction of taxes that a shareholder may pay on Portfolio distributions or on the redemption of Portfolio shares, as well as other charges and expenses of the insurance contract or separate account. Total returns for periods of less than one year are not annualized. Total returns would have been lower absent fee waivers by the Adviser. |
| (e) | Represents the ratio of expenses to average net assets absent fee waivers and/or expense reimbursements by the Adviser. |
| (g) | For the period ended December 31, 2017 and the year ended December 31, 2018, the Portfolio received reimbursements from a related party. The reimbursements had no impact on the Portfolio’s total return. |
See accompanying notes to financial statements.
| Global Atlantic Portfolios |
| Financial Highlights |
| Global Atlantic Goldman Sachs Global Equity Insights Portfolio |
| |
| Selected data based on a share outstanding throughout each period indicated. |
| | | Class II Shares | |
| | | Six Months Ended | | | Year Ended | | | Period Ended | |
| | | June 30, 2019 | | | December 31, | | | December 31, | |
| | | (Unaudited) | | | 2018 | | | 2017(a) | |
| Net asset value, beginning of period | | $ | 9.09 | | | $ | 10.28 | | | $ | 10.00 | |
| Income from investment operations: | | | | | | | | | | | | |
| Net investment income (b) | | | 0.09 | | | | 0.12 | | | | 0.01 | |
| Net realized and unrealized gain (loss) on investments | | | 1.19 | | | | (1.19 | ) | | | 0.27 | |
| Total income (loss) from investment operations | | | 1.28 | | | | (1.07 | ) | | | 0.28 | |
| Less distributions from: | | | | | | | | | | | | |
| Net investment income | | | — | | | | (0.10 | ) | | | — | |
| net realized gain | | | — | | | | (0.02 | ) | | | — | |
| Total distributions from net investment income and net realized gains | | | — | | | | (0.12 | ) | | | — | |
| Net asset value, end of period | | $ | 10.37 | | | $ | 9.09 | | | $ | 10.28 | |
| Total return (c) | | | 14.08 | % | | | (10.47 | )% (g) | | | 2.80 | % (g) |
| Ratios and Supplemental Data: | | | | | | | | | | | | |
| Net assets, end of period (in 000’s) | | $ | 13,053 | | | $ | 12,154 | | | $ | 4,542 | |
| Ratio of net expenses to average net assets | | | 0.97 | % (d) | | | 0.97 | % | | | 0.96 | % (d) |
| Ratio of gross expenses to average net assets (e) | | | 1.01 | % (d) | | | 0.99 | % | | | 0.96 | % (d) |
| Ratio of net investment income to average net assets | | | 1.77 | % (d) | | | 1.12 | % | | | 0.74 | % (d) |
| Portfolio turnover rate | | | 70 | % (f) | | | 138 | % | | | 11 | % (f) |
| | | | | | | | | | | | | |
| (a) | Global Atlantic Goldman Sachs Global Equity Insights Portfolio inception date is November 1, 2017. Commenced operations on November 6, 2017. |
| (b) | Net investment income has been calculated using the average shares method, which more appropriately presents the per share data for the period. |
| (c) | Total returns are historical and assume changes in share price and reinvestment of dividends and capital gains distributions. Total return does not reflect the deduction of taxes that a shareholder may pay on Portfolio distributions or on the redemption of Portfolio shares, as well as other charges and expenses of the insurance contract or separate account. Total returns for periods of less than one year are not annualized. Total returns would have been lower absent fee waivers by the Adviser. |
| (e) | Represents the ratio of expenses to average net assets absent fee waivers and/or expense reimbursements by the Adviser. |
| (g) | For the period ended December 31, 2017 and the year ended December 31, 2018, the Portfolio received reimbursements from a related party. The reimbursements had no impact on the Portfolio’s total return. |
See accompanying notes to financial statements.
| Global Atlantic Portfolios |
| Financial Highlights |
| Global Atlantic Goldman Sachs Large Cap Growth Insights Portfolio |
| |
| Selected data based on a share outstanding throughout each period indicated. |
| | | Class I Shares | |
| | | Six Months Ended | | | Year Ended | | | Period Ended | |
| | | June 30, 2019 | | | December 31, | | | December 31, | |
| | | (Unaudited) | | | 2018 | | | 2017(a) | |
| Net asset value, beginning of period | | $ | 9.76 | | | $ | 10.30 | | | $ | 10.00 | |
| Income from investment operations: | | | | | | | | | | | | |
| Net investment income (b) | | | 0.05 | | | | 0.09 | | | | 0.02 | |
| Net realized and unrealized gain (loss) on investments | | | 1.83 | | | | (0.48 | ) | | | 0.28 | |
| Total income (loss) from investment operations | | | 1.88 | | | | (0.39 | ) | | | 0.30 | |
| Less distributions from: | | | | | | | | | | | | |
| Net investment income | | | — | | | | (0.09 | ) | | | — | |
| net realized gain | | | — | | | | (0.06 | ) | | | — | |
| Total distributions from net investment income and net realized gains | | | — | | | | (0.15 | ) | | | — | |
| Net asset value, end of period | | $ | 11.64 | | | $ | 9.76 | | | $ | 10.30 | |
| Total return (c) | | | 19.36 | % | | | (3.89 | )% (g) | | | 3.00 | % (g) |
| Ratios and Supplemental Data: | | | | | | | | | | | | |
| Net assets, end of period (in 000’s) | | $ | 84,945 | | | $ | 77,930 | | | $ | 85,178 | |
| Ratio of net expenses to average net assets | | | 0.46 | % (d) | | | 0.46 | % | | | 0.46 | % (d) |
| Ratio of gross expenses to average net assets (e) | | | 0.48 | % (d) | | | 0.47 | % | | | 0.47 | % (d) |
| Ratio of net investment income to average net assets | | | 0.90 | % (d) | | | 0.81 | % | | | 1.41 | % (d) |
| Portfolio turnover rate | | | 104 | % (f) | | | 192 | % | | | 21 | % (f) |
| | | | | | | | | | | | | |
| (a) | Global Atlantic Goldman Sachs Large Cap Growth Insights Portfolio inception date is November 1, 2017. Commenced operations on November 6, 2017. |
| (b) | Net investment income has been calculated using the average shares method, which more appropriately presents the per share data for the period. |
| (c) | Total returns are historical and assume changes in share price and reinvestment of dividends and capital gains distributions. Total return does not reflect the deduction of taxes that a shareholder may pay on Portfolio distributions or on the redemption of Portfolio shares, as well as other charges and expenses of the insurance contract or separate account. Total returns for periods of less than one year are not annualized. Total returns would have been lower absent fee waivers by the Adviser. |
| (e) | Represents the ratio of expenses to average net assets absent fee waivers and/or expense reimbursements by the Adviser. |
| (g) | For the period ended December 31, 2017 and the year ended December 31, 2018, the Portfolio received reimbursements from a related party. The reimbursements had no impact on the Portfolio’s total return |
See accompanying notes to financial statements.
| Global Atlantic Portfolios |
| Financial Highlights |
| Global Atlantic Goldman Sachs Large Cap Growth Insights Portfolio |
| |
| Selected data based on a share outstanding throughout the period indicated. |
| | | Class II Shares | |
| | | Six Months Ended | | | Year Ended | | | Period Ended | |
| | | June 30, 2019 | | | December 31, | | | December 31, | |
| | | (Unaudited) | | | 2018 | | | 2017(a) | |
| Net asset value, beginning of period | | $ | 9.74 | | | $ | 10.29 | | | $ | 10.00 | |
| Income from investment operations: | | | | | | | | | | | | |
| Net investment income (b) | | | 0.04 | | | | 0.06 | | | | 0.02 | |
| Net realized and unrealized gain (loss) on investments | | | 1.83 | | | | (0.48 | ) | | | 0.27 | |
| Total income (loss) from investment operations | | | 1.87 | | | | (0.42 | ) | | | 0.29 | |
| Less distributions from: | | | | | | | | | | | | |
| Net investment income | | | — | | | | (0.07 | ) | | | — | |
| net realized gain | | | — | | | | (0.06 | ) | | | — | |
| Total distributions from net investment income and net realized gains | | | — | | | | (0.13 | ) | | | — | |
| Net asset value, end of period | | $ | 11.61 | | | $ | 9.74 | | | $ | 10.29 | |
| Total return (c) | | �� | 19.20 | % | | | (4.13 | )% (g) | | | 2.90 | % (g) |
| Ratios and Supplemental Data: | | | | | | | | | | | | |
| Net assets, end of period (in 000’s) | | $ | 3,993 | | | $ | 3,255 | | | $ | 19 | |
| Ratio of net expenses to average net assets | | | 0.71 | % (d) | | | 0.71 | % | | | 0.71 | % (d) |
| Ratio of gross expenses to average net assets (e) | | | 0.73 | % (d) | | | 0.72 | % | | | 0.72 | % (d) |
| Ratio of net investment income to average net assets | | | 0.66 | % (d) | | | 0.57 | % | | | 1.16 | % (d) |
| Portfolio turnover rate | | | 104 | % (f) | | | 192 | % | | | 21 | % (f) |
| | | | | | | | | | | | | |
| (a) | Global Atlantic Goldman Sachs Large Cap Growth Insights Portfolio inception date is November 1, 2017. Commenced operations on November 6, 2017. |
| (b) | Net investment income has been calculated using the average shares method, which more appropriately presents the per share data for the period. |
| (c) | Total returns are historical and assume changes in share price and reinvestment of dividends and capital gains distributions. Total return does not reflect the deduction of taxes that a shareholder may pay on Portfolio distributions or on the redemption of Portfolio shares, as well as other charges and expenses of the insurance contract or separate account. Total returns for periods of less than one year are not annualized. Total returns would have been lower absent fee waivers by the Adviser. |
| (e) | Represents the ratio of expenses to average net assets absent fee waivers and/or expense reimbursements by the Adviser. |
| (g) | For the period ended December 31, 2017 and the year ended December 31, 2018, the Portfolio received reimbursements from a related party. The reimbursements had no impact on the Portfolio’s total return |
See accompanying notes to financial statements.
| Global Atlantic Portfolios |
| Financial Highlights |
| Global Atlantic Goldman Sachs Mid Cap Value Insights Portfolio |
| |
| Selected data based on a share outstanding throughout the period indicated. |
| | | Class I Shares | |
| | | Six Months Ended | | | Year Ended | | | Period Ended | |
| | | June 30, 2019 | | | December 31, | | | December 31, | |
| | | (Unaudited) | | | 2018 | | | 2017(a) | |
| Net asset value, beginning of period | | $ | 9.08 | | | $ | 10.43 | | | $ | 10.00 | |
| Income from investment operations: | | | | | | | | | | | | |
| Net investment income (b) | | | 0.08 | | | | 0.14 | | | | 0.04 | |
| Net realized and unrealized gain (loss) on investments | | | 1.14 | | | | (1.39 | ) | | | 0.39 | |
| Total income (loss) from investment operations | | | 1.22 | | | | (1.25 | ) | | | 0.43 | |
| Less distributions from: | | | | | | | | | | | | |
| Net investment income | | | — | | | | (0.08 | ) | | | — | |
| Net realized gain | | | — | | | | (0.02 | ) | | | — | |
| Total distributions from net investment income and net realized gains | | | — | | | | (0.10 | ) | | | — | |
| Net asset value, end of period | | $ | 10.30 | | | $ | 9.08 | | | $ | 10.43 | |
| Total return (c) | | | 13.55 | % | | | (12.10 | )% (g) | | | 4.30 | % (g) |
| Ratios and Supplemental Data: | | | | | | | | | | | | |
| Net assets, end of period (in 000’s) | | $ | 51,370 | | | $ | 49,080 | | | $ | 66,982 | |
| Ratio of net expenses to average net assets | | | 0.64 | % (d) | | | 0.64 | % | | | 0.64 | % (d) |
| Ratio of gross expenses to average net assets (e) | | | 0.66 | % (d) | | | 0.65 | % | | | 0.64 | % (d) |
| Ratio of net investment income to average net assets | | | 1.64 | % (d) | | | 1.33 | % | | | 2.56 | % (d) |
| Portfolio turnover rate | | | 107 | % (f) | | | 205 | % | | | 12 | % (f) |
| | | | | | | | | | | | | |
| (a) | Global Atlantic Goldman Sachs Mid Cap Value Insights Portfolio inception date is November 1, 2017. Commenced operations on November 6, 2017. |
| (b) | Net investment income has been calculated using the average shares method, which more appropriately presents the per share data for the period. |
| (c) | Total returns are historical and assume changes in share price and reinvestment of dividends and capital gains distributions. Total return does not reflect the deduction of taxes that a shareholder may pay on Portfolio distributions or on the redemption of Portfolio shares, as well as other charges and expenses of the insurance contract or separate account. Total returns for periods of less than one year are not annualized. Total returns would have been lower absent fee waivers by the Adviser. |
| (e) | Represents the ratio of expenses to average net assets absent fee waivers and/or expense reimbursements by the Adviser. |
| (g) | For the period ended December 31, 2017 and the year ended December 31, 2018, the Portfolio received reimbursements from a related party. The reimbursements had no impact on the Portfolio’s total return. |
See accompanying notes to financial statements.
| Global Atlantic Portfolios |
| Financial Highlights |
| Global Atlantic Goldman Sachs Mid Cap Value Insights Portfolio |
| |
| Selected data based on a share outstanding throughout the period indicated. |
| | | Class II Shares | |
| | | Six Months Ended | | | Year Ended | | | Period Ended | |
| | | June 30, 2019 | | | December 31, | | | December 31, | |
| | | (Unaudited) | | | 2018 | | | 2017(a) | |
| Net asset value, beginning of period | | $ | 9.07 | | | $ | 10.42 | | | $ | 10.00 | |
| Income from investment operations: | | | | | | | | | | | | |
| Net investment income (b) | | | 0.07 | | | | 0.13 | | | | 0.04 | |
| Net realized and unrealized gain (loss) on investments | | | 1.13 | | | | (1.40 | ) | | | 0.38 | |
| Total income (loss) from investment operations | | | 1.20 | | | | (1.27 | ) | | | 0.42 | |
| Less distributions from: | | | | | | | | | | | | |
| Net investment income | | | — | | | | (0.06 | ) | | | — | |
| Net realized gain | | | — | | | | (0.02 | ) | | | — | |
| Total distributions from net investment income and net realized gains | | | — | | | | (0.08 | ) | | | — | |
| Net asset value, end of period | | $ | 10.27 | | | $ | 9.07 | | | $ | 10.42 | |
| Total return (c) | | | 13.23 | % | | | (12.26 | )% (g) | | | 4.20 | % (g) |
| Ratios and Supplemental Data: | | | | | | | | | | | | |
| Net assets, end of period (in 000’s) | | $ | 79,235 | | | $ | 75,084 | | | $ | 13,581 | |
| Ratio of net expenses to average net assets | | | 0.89 | % (d) | | | 0.89 | % | | | 0.88 | % (d) |
| Ratio of gross expenses to average net assets (e) | | | 0.90 | % (d) | | | 0.90 | % | | | 0.88 | % (d) |
| Ratio of net investment income to average net assets | | | 1.39 | % (d) | | | 1.22 | % | | | 2.69 | % (d) |
| Portfolio turnover rate | | | 107 | % (f) | | | 205 | % | | | 12 | % (f) |
| | | | | | | | | | | | | |
| (a) | Global Atlantic Goldman Sachs Mid Cap Value Insights Portfolio inception date is November 1, 2017. Commenced operations on November 6, 2017. |
| (b) | Net investment income has been calculated using the average shares method, which more appropriately presents the per share data for the period. |
| (c) | Total returns are historical and assume changes in share price and reinvestment of dividends and capital gains distributions. Total return does not reflect the deduction of taxes that a shareholder may pay on Portfolio distributions or on the redemption of Portfolio shares, as well as other charges and expenses of the insurance contract or separate account. Total returns for periods of less than one year are not annualized. Total returns would have been lower absent fee waivers by the Adviser. |
| (e) | Represents the ratio of expenses to average net assets absent fee waivers and/or expense reimbursements by the Adviser. |
| (g) | For the period ended December 31, 2017 and the year ended December 31, 2018, the Portfolio received reimbursements from a related party. The reimbursements had no impact on the Portfolio’s total return. |
See accompanying notes to financial statements.
Global Atlantic Portfolios
NOTES TO FINANCIAL STATEMENTS
June 30, 2019 (Unaudited)
The Global Atlantic Portfolios (each, a “Portfolio” and collectively, the “Portfolios”) are comprised of twenty-three different actively managed portfolios, thirteen of which are discussed in this report. Each Portfolio is a series of shares of beneficial interest of Forethought Variable Insurance Trust (the “Trust”), a statutory trust organized under the laws of the State of Delaware, and registered under the Investment Company Act of 1940, as amended (the “1940 Act”), as an open-end management investment company.
| Portfolio Name | Commencement Date * | Investment Objective |
| Global Atlantic BlackRock Allocation | November 6, 2017 | Total return. |
| Portfolio | | |
| Global Atlantic BlackRock Disciplined | November 6, 2017 | Long-term capital appreciation. |
| Core Portfolio | | |
| Global Atlantic BlackRock Disciplined | November 6, 2017 | Long-term capital appreciation. |
| Growth Portfolio | | |
| Global Atlantic BlackRock Disciplined | November 6, 2017 | Long-term capital appreciation. |
| International Core Portfolio | | |
| Global Atlantic BlackRock Disciplined | November 6, 2017 | Long-term capital appreciation. |
| Mid Cap Growth Portfolio | | |
| Global Atlantic BlackRock Disciplined | November 6, 2017 | Long-term capital appreciation. |
| Small Cap Portfolio | | |
| Global Atlantic BlackRock Disciplined | November 6, 2017 | Long-term capital appreciation. |
| U.S. Core Portfolio | | |
| Global Atlantic BlackRock Disciplined | November 6, 2017 | Long-term capital appreciation. |
| Value Portfolio | | |
| Global Atlantic BlackRock High Yield | November 6, 2017 | Total return. |
| Portfolio | | |
| Global Atlantic Goldman Sachs Core | November 6, 2017 | Total return consisting of capital |
| Fixed Income Portfolio | | appreciation and income. |
| Global Atlantic Goldman Sachs Global | November 6, 2017 | Long-term capital appreciation. |
| Equity Insights Portfolio | | |
| Global Atlantic Goldman Sachs Large Cap | November 6, 2017 | Long-term capital appreciation. |
| Growth Insights Portfolio | | |
| Global Atlantic Goldman Sachs Mid Cap | November 6, 2017 | Long-term capital appreciation. |
| Value Insights Portfolio | | |
| * | The Portfolios’ inception date is November 1, 2017. The Portfolios commenced operations on November 6, 2017. |
The Global Atlantic BlackRock Allocation Portfolio is a non-diversified series of the Trust; all other Portfolios in this report are diversified. Certain of the Portfolios operate as “fund of funds.” A “fund of funds” typically invests in multiple underlying funds and the level of its interest in any particular underlying fund may fluctuate. The Portfolios are intended to be funding vehicles for variable annuity and variable life insurance contracts offered by separate accounts of insurance companies. The assets of each Portfolio are segregated and a shareholder’s interest is limited to the Portfolio in which shares are held. Each Portfolio pays its own expenses.
The Portfolios currently offer Class I and Class II shares at net asset value, except the Global Atlantic BlackRock Disciplined Growth Portfolio, which only offers Class II shares. All classes of shares have equal voting privileges except that each class has exclusive voting rights with respect to its service and/or distribution plans. Each Portfolio’s income, expenses (other than class specific distribution fees) and realized and unrealized gains and losses are allocated proportionately each day based upon the relative net assets of each class.
References herein to a Portfolio’s investment in a particular instrument include direct investments and indirect investments through investment companies such as open-end funds (mutual funds), exchange-traded funds and closed-end funds, as applicable.
Global Atlantic Portfolios
NOTES TO FINANCIAL STATEMENTS (Continued)
June 30, 2019 (Unaudited)
| 2. | SIGNIFICANT ACCOUNTING POLICIES |
The following is a summary of significant accounting policies followed by the Portfolios in preparation of their financial statements. The policies are in conformity with U.S. generally accepted accounting principles (“GAAP”). The preparation of the financial statements requires management to make estimates and assumptions that affect the reported amounts of assets and liabilities and disclosure of contingent assets and liabilities at the date of the financial statements and the reported amounts of income and expenses for the period. Actual results could differ from those estimates. Each Portfolio is an investment company and accordingly follows the investment company accounting and reporting guidance of the Financial Accounting Standards Board (FASB) Accounting Standard Codification Topic 946 “Financial Services – Investment Companies”.
Securities Valuation –Securities listed on an exchange are valued at the last reported sale price at the close of the regular trading session of the primary exchange on the business day the value is being determined, or in the case of securities listed on NASDAQ at the NASDAQ Official Closing Price. In the absence of a sale such securities shall be valued at the mean between the current bid and ask prices on the day of valuation. Futures and future options are valued at the final settle price or, in the absence of a settle price, at the last sale price on the day of valuation. Short-term debt obligations having 60 days or less remaining until maturity, at time of purchase, may be valued at amortized cost to the extent it is determined that amortized cost approximates fair value. Investments in open-end investment companies are valued at net asset value, as discussed in more detail below.
Valuation of Investment Companies– The Portfolios may invest in one or more portfolios of open-end investment companies (the “Underlying Fund” or “Underlying Funds”). Each Underlying Fund is valued at its respective net asset value as reported by such investment company. Each Underlying Fund values securities in its portfolio for which market quotations are readily available at their market values (generally the last reported sale price) and all other securities and assets at their fair value based on the methods established by each Underlying Fund’s board(s) of trustees.
Exchange-Traded Funds– The Portfolios may invest in passive exchange-traded funds (“ETFs”). An ETF is a type of index fund that is bought and sold on a securities exchange. An ETF trades like common stock and represents a fixed portfolio of securities designed to track the performance and dividend yield of a particular domestic or foreign market index. A Portfolio may purchase an ETF to temporarily gain exposure to a portion of the U.S. or a foreign market while awaiting an opportunity to purchase securities directly. The risks of owning an ETF generally reflect the risks of owning the underlying securities it is designed to track, although the lack of liquidity in an ETF could result in it being more volatile than the underlying securities, which may result in a Portfolio paying significantly more or receiving significantly less for ETF shares than the value of the relevant underlying securities. Additionally, an ETF has fees and expenses that increase the cost of investing in the ETF versus the costs of owning the underlying securities directly.
Illiquid Securities– The Portfolios may hold securities, such as private placements, interests in commodity pools, other non-traded securities or temporarily illiquid securities, for which market quotations are not readily available or are determined to be unreliable. These securities will be valued at their fair market value as determined using the valuation procedures approved by the Board of Trustees (the “Board”). The Board has delegated execution of these procedures to a Fair Value Committee composed of one or more representatives from each of the (i) Trust, (ii) administrator, and (iii) Global Atlantic Investment Advisors, LLC (the “Adviser”) and/or Sub-Adviser. The Fair Value Committee may also include the Trust’s Chief Compliance Officer and may enlist third party consultants or advisers (such as an accounting firm or fair value pricing specialist) on an as-needed basis to assist in determining a security-specific fair value or valuation method. The Board reviews and approves the execution of this process and the resultant fair value prices at least quarterly to assure the process produces reliable results.
Global Atlantic Portfolios
NOTES TO FINANCIAL STATEMENTS (Continued)
June 30, 2019 (Unaudited)
Fair Value Committee and Valuation Process– The Fair Value Committee is composed of one or more representatives from each of the (i) Trust, (ii) administrator, and (iii) Adviser and/or Sub-Adviser. The applicable investments are valued collectively via inputs from each of these groups. For example, fair value determinations are required for the following securities: (i) securities for which market quotations are not readily available on a particular business day (including without limitation securities for which there is a short and temporary lapse in the provision of a price by the regular pricing source); (ii) securities for which, in the opinion of the Adviser or relevant Sub-Adviser, the prices or values available do not represent the fair value of the instrument (factors which may cause the Adviser or Sub-Adviser to make such a judgment include, but are not limited to, the following: the availability of only a bid price or an ask price; the spread between bid and ask prices; the frequency of sales; the thinness of the market; the size of reported trades; and actions of the securities markets or regulators, such as the suspension or limitation of trading); (iii) securities determined to be illiquid; (iv) securities with respect to which an event that will affect the value thereof has occurred (a “significant event”) subsequent to the determination of the closing price reported on the principal exchange on which the securities are traded, but prior to the relevant Portfolio’s calculation of its net asset value (“NAV”); and (v) mutual funds that do not provide timely NAV information. Specifically, interests in commodity pools or managed futures pools are valued on a daily basis by reference to the closing market prices of each futures contract or other asset held by a pool, as adjusted for pool expenses. Restricted or illiquid securities, such as private placements or non-traded securities are valued via inputs from the Adviser or Sub-Adviser valuation based upon the current bid for the security from two or more independent dealers or other parties reasonably familiar with the facts and circumstances of the security (who should take into consideration all relevant factors as may be appropriate under the circumstances). If the Adviser or Sub-Adviser is unable to obtain a current bid from such independent dealers or other independent parties, the fair value team shall determine the fair value of restricted or illiquid securities using the following factors: (i) the type of security; (ii) the cost at date of purchase; (iii) the size and nature of the Portfolio’s holdings; (iv) the discount from market value of unrestricted securities of the same class at the time of purchase and subsequent thereto; (v) information as to any transactions or offers with respect to the security; (vi) the nature and duration of restrictions on disposition of the security and the existence of any registration rights, as well as any estimation of the cost of registration or otherwise qualifying the security for public sale, including commissions; (vii) how the yield of the security compares to similar securities of companies of similar or equal creditworthiness; (viii) the level of recent trades of similar or comparable securities; (ix) the liquidity characteristics of the security; (x) current market conditions; (xi) the market value of any securities into which the security is convertible or exchangeable; (xii) the security’s embedded option values; and (xiii) information about the financial condition of the issuer and its prospects.
Each Portfolio utilizes various methods to measure the fair value of all of its investments on a recurring basis. GAAP establishes a hierarchy that prioritizes inputs to valuation methods. The three levels of input are:
Level 1 –Unadjusted quoted prices in active markets for identical assets and liabilities that the Portfolio has the ability to access.
Level 2 –Observable inputs other than quoted prices included in Level 1 that are observable for the asset or liability, either directly or indirectly. These inputs may include quoted prices for the identical instrument in an inactive market, prices for similar instruments, interest rates, prepayment speeds, credit risk, yield curves, default rates and similar data.
Level 3 –Unobservable inputs for the asset or liability, to the extent relevant observable inputs are not available, representing the Portfolio’s own assumptions about the assumptions a market participant would use in valuing the asset or liability, and would be based on the best information available.
The availability of observable inputs can vary from security to security and is affected by a wide variety of factors, including, for example, the type of security, whether the security is new and not yet established in the marketplace, the liquidity of markets, and other characteristics particular to the security. To the extent that valuation is based on models or inputs that are less observable or unobservable in the market, the determination of fair value requires more judgment. Accordingly, the degree of judgment exercised in determining fair value is greatest for instruments categorized in Level 3.
The inputs used to measure fair value may fall into different levels of the fair value hierarchy. In such cases, for disclosure purposes, the level in the fair value hierarchy within which the fair value measurement falls in its entirety is determined based on the lowest level input that is significant to the fair value measurement in its entirety.
Global Atlantic Portfolios
NOTES TO FINANCIAL STATEMENTS (Continued)
June 30, 2019 (Unaudited)
The inputs or methodology used for valuing securities are not necessarily an indication of the risk associated with investing in those securities. The following tables summarize the inputs used as of June 30, 2019 for each Portfolio’s investments measured at fair value:
| Global Atlantic BlackRock Allocation Portfolio | |
| | | | | | | | | | | | | |
| Assets | | Level 1 | | | Level 2 | | | Level 3 | | | Total | |
| Exchange Traded Funds | | $ | 82,843,589 | | | $ | — | | | $ | — | | | $ | 82,843,589 | |
| Short-Term Investment | | | 33,265 | | | | — | | | | — | | | | 33,265 | |
| Total | | $ | 82,876,854 | | | $ | — | | | $ | — | | | $ | 82,876,854 | |
| | | | | | | | | | | | | | | | | |
| Global Atlantic BlackRock Disciplined Core Portfolio | |
| | |
| Assets | | Level 1 | | | Level 2 | | | Level 3 | | | Total | |
| Common Stocks | | $ | 562,866,113 | | | $ | — | | | $ | — | | | $ | 562,866,113 | |
| Short-Term Investment | | | 7,507,530 | | | | — | | | | — | | | | 7,507,530 | |
| Futures Contract * | | | 136,280 | | | | — | | | | — | | | | 136,280 | |
| Total | | $ | 570,509,923 | | | $ | — | | | $ | — | | | $ | 570,509,923 | |
| | | | | | | | | | | | | | | | | |
| Global Atlantic BlackRock Disciplined Growth Portfolio | |
| | |
| Assets | | Level 1 | | | Level 2 | | | Level 3 | | | Total | |
| Common Stocks | | $ | 17,020,404 | | | $ | — | | | $ | — | | | $ | 17,020,404 | |
| Short-Term Investment | | | 329,920 | | | | — | | | | — | | | | 329,920 | |
| Futures Contract * | | | 4,933 | | | | — | | | | — | | | | 4,933 | |
| Total | | $ | 17,355,257 | | | $ | — | | | $ | — | | | $ | 17,355,257 | |
| | | | | | | | | | | | | | | | | |
| Global Atlantic BlackRock Disciplined International Core Portfolio | |
| | |
| Assets | | Level 1 | | | Level 2 | | | Level 3 | | | Total | |
| Common Stocks | | $ | 134,223,529 | | | $ | — | | | $ | — | | | $ | 134,223,529 | |
| Exchange Traded Funds | | | 9,358,815 | | | | — | | | | — | | | | 9,358,815 | |
| Short-Term Investment | | | 918,626 | | | | — | | | | — | | | | 918,626 | |
| Right | | | 170 | | | | — | | | | — | | | | 170 | |
| Futures Contracts * | | | 95,745 | | | | — | | | | — | | | | 95,745 | |
| Total | | $ | 144,596,885 | | | $ | — | | | $ | — | | | $ | 144,596,885 | |
| | | | | | | | | | | | | | | | | |
| Liabilities | | Level 1 | | | Level 2 | | | Level 3 | | | Total | |
| Forward Foreign Exchange Contracts | | $ | 51 | | | $ | — | | | $ | — | | | $ | 51 | |
| Total | | $ | 51 | | | $ | — | | | $ | — | | | $ | 51 | |
| | | | | | | | | | | | | | | | | |
| Global Atlantic BlackRock Disciplined Mid Cap Growth Portfolio | |
| | |
| Assets | | Level 1 | | | Level 2 | | | Level 3 | | | Total | |
| Common Stocks | | $ | 191,372,743 | | | $ | — | | | $ | — | | | $ | 191,372,743 | |
| Short-Term Investment | | | 2,766,300 | | | | — | | | | — | | | | 2,766,300 | |
| Futures Contract* | | | 46,442 | | | | — | | | | — | | | | 46,442 | |
| Total | | $ | 194,185,485 | | | $ | — | | | $ | — | | | $ | 194,185,485 | |
Global Atlantic Portfolios
NOTES TO FINANCIAL STATEMENTS (Continued)
June 30, 2019 (Unaudited)
| Global Atlantic BlackRock Disciplined Small Cap Portfolio | |
| | |
| Assets | | Level 1 | | | Level 2 | | | Level 3 | | | Total | |
| Common Stocks | | $ | 17,308,588 | | | $ | — | | | $ | — | | | $ | 17,308,588 | |
| Short-Term Investment | | | 452,302 | | | | — | | | | — | | | | 452,302 | |
| Futures Contracts* | | | 10,030 | | | | — | | | | — | | | | 10,030 | |
| Total | | $ | 17,770,920 | | | $ | — | | | $ | — | | | $ | 17,770,920 | |
| | | | | | | | | | | | | | | | | |
| Global Atlantic BlackRock Disciplined U.S. Core Portfolio | |
| | |
| Assets | | Level 1 | | | Level 2 | | | Level 3 | | | Total | |
| Common Stocks | | $ | 24,184,302 | | | $ | — | | | $ | — | | | $ | 24,184,302 | |
| Short-Term Investment | | | 460,579 | | | | — | | | | — | | | | 460,579 | |
| Futures Contract * | | | 7,946 | | | | — | | | | — | | | | 7,946 | |
| Total | | $ | 24,652,827 | | | $ | — | | | $ | — | | | $ | 24,652,827 | |
| | | | | | | | | | | | | | | | | |
| Global Atlantic BlackRock Disciplined Value Portfolio | |
| | |
| Assets | | Level 1 | | | Level 2 | | | Level 3 | | | Total | |
| Common Stocks | | $ | 271,395,909 | | | $ | — | | | $ | — | | | $ | 271,395,909 | |
| Short-Term Investment | | | 3,331,104 | | | | — | | | | — | | | | 3,331,104 | |
| Futures Contract * | | | 60,379 | | | | — | | | | — | | | | 60,379 | |
| Total | | $ | 274,787,392 | | | $ | — | | | $ | — | | | $ | 274,787,392 | |
| | | | | | | | | | | | | | | | | |
| Global Atlantic BlackRock High Yield Portfolio | |
| | |
| Assets | | Level 1 | | | Level 2 | | | Level 3 | | | Total | |
| Corporate Bonds & Notes | | $ | — | | | $ | 70,819,846 | | | $ | — | | | $ | 70,819,846 | |
| Short-Term Investment | | | 685,238 | | | | — | | | | — | | | | 685,238 | |
| Total | | $ | 685,238 | | | $ | 70,819,846 | | | $ | — | | | $ | 71,505,084 | |
| | | | | | | | | | | | | | | | | |
| Liabilities | | Level 1 | | | Level 2 | | | Level 3 | | | Total | |
| Futures Contracts * | | $ | 25,475 | | | $ | — | | | $ | — | | | $ | 25,475 | |
| Total | | $ | 25,475 | | | $ | — | | | $ | — | | | $ | 25,475 | |
| | | | | | | | | | | | | | | | | |
| Global Atlantic Goldman Sachs Core Fixed Income Portfolio | |
| | |
| Assets | | Level 1 | | | Level 2 | | | Level 3 | | | Total | |
| Asset Backed Securities | | $ | — | | | $ | 7,266,539 | | | $ | — | | | $ | 7,266,539 | |
| Corporate Bonds & Notes | | | — | | | | 38,379,698 | | | | — | | | | 38,379,698 | |
| Municipal Bonds | | | — | | | | 1,282,097 | | | | — | | | | 1,282,097 | |
| Mortgage Backed Securities | | | — | | | | 30,491,799 | | | | — | | | | 30,491,799 | |
| U.S. Treasury Securities | | | — | | | | 15,912,908 | | | | — | | | | 15,912,908 | |
| Short-Term Investments | | | 13,855,245 | | | | 1,031,160 | | | | — | | | | 14,886,405 | |
| Futures Contracts * | | | 201,739 | | | | — | | | | — | | | | 201,739 | |
| Swap Contracts | | | — | | | | 52,539 | | | | — | | | | 52,539 | |
| Forward Foreign Exchange Contracts * | | | — | | | | 79,358 | | | | — | | | | 79,358 | |
| Total | | $ | 14,056,984 | | | $ | 94,496,098 | | | $ | — | | | $ | 108,553,082 | |
Global Atlantic Portfolios
NOTES TO FINANCIAL STATEMENTS (Continued)
June 30, 2019 (Unaudited)
| Global Atlantic Goldman Sachs Global Equity Insights Portfolio | |
| | | | | | | | | | | | | |
| Assets | | Level 1 | | | Level 2 | | | Level 3 | | | Total | |
| Common Stocks | | $ | 29,012,828 | | | $ | — | | | $ | — | | | $ | 29,012,828 | |
| Total | | $ | 29,012,828 | | | $ | — | | | $ | — | | | $ | 29,012,828 | |
| | | | | | | | | | | | | | | | | |
| Global Atlantic Goldman Sachs Large Cap Growth Insights Portfolio | |
| | | | | | | | | | | | | |
| Assets | | Level 1 | | | Level 2 | | | Level 3 | | | Total | |
| Common Stocks | | $ | 88,169,766 | | | $ | — | | | $ | — | | | $ | 88,169,766 | |
| Short-Term Investment | | | 254,573 | | | | — | | | | — | | | | 254,573 | |
| Total | | $ | 88,424,339 | | | $ | — | | | $ | — | | | $ | 88,424,339 | |
| | | | | | | | | | | | | | | | | |
| Global Atlantic Goldman Sachs Mid Cap Value Insights Portfolio | |
| | | | | | | | | | | | | |
| Assets | | Level 1 | | | Level 2 | | | Level 3 | | | Total | |
| Common Stocks | | $ | 129,190,121 | | | $ | — | | | $ | — | | | $ | 129,190,121 | |
| Short-Term Investment | | | 828,037 | | | | — | | | | — | | | | 828,037 | |
| Total | | $ | 130,018,158 | | | $ | — | | | $ | — | | | $ | 130,018,158 | |
| * | Cumulative net appreciation/(depreciation) on futures contracts and forward foreign exchange contracts is reported in the above table. |
The Portfolios did not hold any Level 3 securities during the period.
Security Transactions and Related Income –Security transactions are accounted for on a trade date basis. Interest income is recognized on an accrual basis. Discounts are accreted and premiums are amortized on securities purchased over the lives of the respective securities. Dividend income is recorded on the ex-dividend date. Realized gains or losses from sales of securities are determined by comparing the identified cost of the security lot sold with the net sales proceeds.
Dividends and Distributions to Shareholders –Dividends from net investment income and distributions from net realized capital gains, if any, are declared and paid annually. Dividends and distributions to shareholders are recorded on ex-date and are determined in accordance with Federal income tax regulations, which may differ from GAAP. These “book/tax” differences are considered either temporary (e.g., deferred losses, capital loss carryforwards) or permanent in nature. To the extent these differences are permanent in nature, such amounts are reclassified within the composition of net assets based on their Federal tax-basis treatment; temporary differences do not require reclassification. These reclassifications have no effect on net assets, results from operations or net asset values per share of the Portfolios.
Cash and Cash Equivalents –Cash and cash equivalents include cash and overnight investments in interest-bearing demand deposits with a financial institution with original maturities of three months or less. The Portfolios maintain deposits with a financial institution which are generally an amount that is in excess of federally insured limits.
Federal Income Tax –It is each Portfolio’s policy to qualify as a regulated investment company by complying with the provisions of the Internal Revenue Code that are applicable to regulated investment companies and to distribute substantially all of their taxable income and net realized gains to shareholders. Therefore, no Federal income tax provision is required.
Each Portfolio will recognize the tax benefits of uncertain tax positions only where the position is “more likely than not” to be sustained assuming examination by tax authorities. Management has analyzed each Portfolio’s tax positions, and has concluded that no liability for unrecognized tax benefits should be recorded related to uncertain tax positions taken in each Portfolio’s 2017 and 2018 tax returns, or is expected to be taken in each Portfolio’s December 31, 2019 tax returns. Each Portfolio identified its major tax jurisdictions as U.S. Federal and foreign jurisdictions where the Portfolios make significant investments; however, the Portfolios are not aware of any tax positions for which it is reasonably possible that the total amounts of unrecognized tax benefits will change materially in the next twelve months.
Global Atlantic Portfolios
NOTES TO FINANCIAL STATEMENTS (Continued)
June 30, 2019 (Unaudited)
Foreign Currency Translation– The accounting records of the Portfolios are maintained in U.S. dollars. Foreign currencies, as well as investment securities and other assets and liabilities denominated in foreign currencies, are translated into U.S. dollars using exchange rates deemed appropriate by the investment adviser. Purchases and sales of securities, income receipts and expense payments are translated into U.S. dollars on the respective dates of such transactions.
Net realized gains and losses on foreign currency transactions represent net gains and losses from currency realized between the trade and settlement dates on securities transactions and the difference between income accrued versus income received. The effects of changes in foreign currency exchange rates on investments in securities are included with the net realized and unrealized gain or loss on investments.
Forward Foreign Currency Contracts –As foreign securities are purchased, a Portfolio may enter into forward currency exchange contracts in order to hedge against foreign currency exchange rate risks. A forward involves an obligation to purchase or sell a specific currency at a future date, which may be any fixed number of days from the date of the contract agreed upon by the parties, at a price set at the time of the contract. The market value of the contract fluctuates with changes in currency exchange rates. The contract is marked-to-market daily and the change in market value is recorded by a Portfolio as an unrealized gain or loss. As foreign securities are sold, a portion of the contract is generally closed and a Portfolio records a realized gain or loss equal to the difference between the value of the contract at the time it was opened and the value at the time it was closed. Realized gains and losses from contract transactions are included as a component of net realized gains/(losses) from forward foreign currency contracts in the Statements of Operations.
For the six months ended June 30, 2019, realized gains/(losses) and the change in unrealized appreciation/(depreciation) on forward foreign currency contracts subject to currency risk, as disclosed in the Statements of Operations, is as follows:
| | | | | | Change in Unrealized | |
| | | | | | Appreciation/ | |
| | | Realized Gain/(Loss) | | | Depreciation | |
| Global Atlantic BlackRock Disciplined International Core Portfolio | | $ | 4,291 | | | $ | 12,987 | |
| Global Atlantic Goldman Sachs Core Fixed Income Portfolio | | | 16,422 | | | | 7,980 | |
Futures Contracts– The Portfolios are subject to equity price risk in the normal course of pursuing their investment objectives. The Portfolios may sell futures contracts to hedge against market risk, foreign currency exchange rate risks, and to reduce return volatility. Futures are standardized, exchange-traded contracts that provide for the future sale by one party and purchase by another party of a specified amount of a specific financial instrument (e.g., units of a securities index) for a specified price, date, time and place designated at the time the contract is made. Brokerage fees are incurred when a futures contract is bought or sold and initial and variation margin deposits must be maintained. Entering into a contract to buy is commonly referred to as buying or purchasing a contract or holding a long position. Entering into a contract to sell is commonly referred to as selling a contract or holding a short position. The Portfolios may also buy or sell hedge instruments based on one or more market indices in an attempt to maintain the Portfolios’ volatility at a targeted level. Initial margin deposits required upon entering into futures contracts are satisfied by the segregation of specific securities or cash as collateral for the account of the broker (the Portfolio’s agent in acquiring the futures position). During the period the futures contracts are open, changes in the value of the contracts are recognized as unrealized gains or losses by “marking to market” on a daily basis to reflect the market value of the contracts at the end of each day’s trading. Variation margin payments are received or made depending upon whether unrealized gains or losses are incurred. When the contracts are closed, a Portfolio recognizes a realized gain or loss equal to the difference between the proceeds from, or cost of, the closing transaction and the Portfolio’s basis in the contract. If a Portfolio were unable to liquidate a futures contract and/or enter into an offsetting closing transaction, the Portfolio would continue to be subject to market risk with respect to the value of the contracts and continue to be required to maintain the margin deposits on the futures contracts. Each Portfolio segregates liquid securities having a value at least equal to the amount of the current obligation under any open futures contract. These amounts are disclosed on the Statements of Assets and Liabilities as Deposits with Brokers when applicable. Risks may exceed amounts recognized in the Statements of Assets and Liabilities. With futures, there is minimal counterparty credit risk to a Portfolio since futures are exchange traded and the exchange’s clearinghouse, as counterparty to all exchange traded futures, guarantees the futures against default.
Global Atlantic Portfolios
NOTES TO FINANCIAL STATEMENTS (Continued)
June 30, 2019 (Unaudited)
For the six months ended June 30, 2019, realized gains/(losses) and the change in unrealized appreciation/(depreciation) on futures contracts, as disclosed in the Statements of Operations, is as follows:
| | | | | | | | Change in | |
| | | | | | | | Unrealized | |
| | | | | | | | Appreciation/ | |
| | | Risk Type | | Realized Gain/(Loss) | | | (Depreciation) | |
| Global Atlantic BlackRock Disciplined Core Portfolio | | Equity | | $ | 1,057,062 | | | $ | 332,438 | |
| Global Atlantic BlackRock Disciplined Growth Portfolio | | Equity | | | 34,593 | | | | 3,251 | |
| Global Atlantic BlackRock Disciplined International Core Portfolio | | Equity | | | 359,712 | | | | 202,700 | |
| Global Atlantic BlackRock Disciplined Mid Cap Growth Portfolio | | Equity | | | 294,480 | | | | 133,387 | |
| Global Atlantic BlackRock Disciplined Small Cap Portfolio | | Equity | | | 54,559 | | | | 19,831 | |
| Global Atlantic BlackRock Disciplined U.S. Core Portfolio | | Equity | | | 51,030 | | | | 22,970 | |
| Global Atlantic BlackRock Disciplined Value Portfolio | | Equity | | | 517,579 | | | | 167,131 | |
| Global Atlantic BlackRock High Yield Portfolio | | Interest Rate | | | (58,023 | ) | | | (22,090 | ) |
| Global Atlantic Goldman Sachs Core Fixed Income Portfolio | | Interest Rate | | | 434,517 | | | | 27,122 | |
| Global Atlantic Goldman Sachs Large Cap Growth Insights Portfolio | | Equity | | | (4,281 | ) | | | — | |
Swap Agreements –Certain Portfolios are subject to equity price risk and/or interest rate risk in the normal course of pursuing their investment objectives. These Portfolios may enter into various swap transactions for investment purposes or to manage interest rate, equity, foreign exchange (currency), or credit risk. These are two-party contracts entered into primarily to exchange the returns (or differentials in rates of returns) earned or realized on particular pre-determined investments or instruments. In a standard over-the-counter (“OTC”) swap, two parties agree to exchange the returns, differentials in rates of return or some other amount earned or realized on the “notional amount” (i.e., the return or increase in value of a particular dollar amount invested in a “basket” of securities, representing a particular index or industry sectors) of predetermined investments or instruments.
Certain Portfolios may enter into credit default swaps (“CDS”). CDS are two-party contracts that transfer credit exposure between the parties. One party (the “buyer”) receives credit protection and the other party (the “seller”) takes on credit risk. The buyer typically makes predetermined periodic payments to the seller in exchange for the seller’s commitment to purchase the underlying reference obligation if a defined credit event occurs, such as a default, bankruptcy or failure to pay interest or principal on a reference debt instrument, with respect to a specified issuer or one of the reference issuers in a CDS portfolio. If the defined credit event occurs, the seller must pay the agreed-upon value of a reference obligation to the counterparty or perform pursuant to the agreement. The buyer must then surrender the reference obligation to the seller. As a seller of credit protection in a CDS, a Portfolio would be liable for the notional amount of the swap.
The swaps in which a Portfolio may invest may be centrally-cleared or bi-laterally traded. The gross returns to be exchanged or “swapped” between the parties are calculated with respect to a notional amount. Changes in the value of swap agreements are recognized as unrealized gains or losses in the Statements of Operations by “marking to market” on a daily basis to reflect the value of the swap agreement at the end of each trading day. Payments received or paid at the beginning of a swap agreement are reflected as such on the Statements of Assets and Liabilities and may be referred to as upfront payments. A Portfolio amortizes upfront payments and/or accrues for the fixed payment stream on swap agreements on a daily basis with the net amount recorded as a component of unrealized gain or loss on the Statements of Operations. Realized gains and losses from the decrease in notional value of the swap are recognized on trade date. A liquidation payment received or made at the termination of the swap agreement is recorded as a realized gain or loss on the Statements of Operations. A Portfolio segregates cash or liquid securities having a value at least equal to the amount of its current obligation under any swap transaction. Swap agreements involve, to varying degrees, lack of liquidity and elements of credit, market and counterparty risk in excess of amounts recognized on the Statements of Assets and Liabilities. Each Portfolio’s maximum risk of loss from the counterparty credit risk is the discounted net value of the cash flow to be received from the counterparty over the contract’s remaining life, to be the extent that amount is positive.
Swaps may involve greater risks than direct investments in securities because swaps may be leveraged and, when traded in the OTC markets, are subject to counterparty risk, credit risk and pricing risk, each of which individually and collectively, may have a considerable impact on the performance of a Portfolio. CDS in particular may involve greater risks than investing
Global Atlantic Portfolios
NOTES TO FINANCIAL STATEMENTS (Continued)
June 30, 2019 (Unaudited)
in a referenced instrument directly. Swaps, especially those that are not exchange-traded, may also be considered illiquid. It may not be possible for a Portfolio to liquidate a swap position at an advantageous time or price, which may result in significant losses. Although central clearing and exchange-trading of swaps may decrease counterparty risk and increase market liquidity, exchange-trading and clearing does not make the contracts risk free, but rather, the primary credit risk on such contracts is the creditworthiness of the clearing broker or the clearinghouse.
The Portfolios use cash and certain securities as collateral to swap agreements as indicated on the Portfolio of Investments and Statements of Assets and Liabilities. Such collateral is held for the benefit of the counterparty in a segregated account to prevent non-payment by the Portfolios. If the counterparty defaults, a Portfolio may seek return of this collateral and incur certain costs exercising their rights to the collateral.
For the six months ended June 30, 2019, the change in unrealized depreciation on swap contracts for the Global Atlantic Goldman Sachs Core Fixed Income Portfolio was $19,021. For the six months ended June 30, 2019, the Global Atlantic Goldman Sachs Core Fixed Income Portfolio had realized gains of $77,434 from swap contracts.
Offsetting of Financial Assets/Liabilities and Derivative Assets/Liabilities
The following tables present certain of the Portfolios’ asset/liability derivatives available for offset under a master netting arrangement net of collateral pledged as of June 30, 2019.
Global Atlantic BlackRock Disciplined Core Portfolio
| Liabilities | | | | | | | | | | | | | | | |
| | | | | | | | | | | | Gross Amounts Not Offset | | | | |
| | | | | | | | | | | | in the Statement of Assets & | | | | |
| | | | | | | | | | | | Liabilities | | | | |
| | | Gross | | | Gross Amounts | | | Net Amounts of | | | | | | | | | | |
| | | Amounts of | | | Offset in the | | | Liabilities Presented in | | | | | | Cash | | | | |
| | | Recognized | | | Statement of Assets | | | the Statement of Assets | | | Financial | | | Collateral | | | | |
| Description | | Liabilities | | | & Liabilities | | | & Liabilities | | | Instruments | | | Pledged | | | Net Amount | |
| Futures Contracts | | $ | 136,280 | (1) | | $ | — | (1) | | $ | 136,280 | | | $ | — | | | $ | — | (2) | | $ | — | |
| Total | | $ | 136,280 | | | $ | — | | | $ | 136,280 | | | $ | — | | | $ | — | | | $ | — | |
| (1) | Gross unrealized depreciation as presented in the Portfolio of Investments. |
| (2) | The amount is limited to the net derivative balance and, accordingly, does not include excess collateral pledged of $354,643. |
Global Atlantic BlackRock Disciplined Growth Portfolio
| Assets | | | | | | | | | | | | | | | | | | |
| | | | | | | | | | | | Gross Amounts Not | | | | |
| | | | | | | | | | | | Offset in the Statement of | | | | |
| | | | | | | | | | | | Assets & Liabilities | | | | |
| | | | | | Gross Amounts | | | Net Amounts of Assets | | | | | | | | | | |
| | | Gross Amounts | | | Offset in the | | | Presented in the | | | | | | Cash | | | | |
| | | of Recognized | | | Statement of Assets | | | Statement of Assets & | | | Financial | | | Collateral | | | | |
| Description | | Assets | | | & Liabilities | | | Liabilities | | | Instruments | | | Pledged | | | Net Amount | |
| Futures Contracts | | $ | 4,933 | (1) | | $ | — | (1) | | $ | 4,933 | | | $ | — | | | $ | — | (2) | | $ | — | |
| Total | | $ | 4,933 | | | $ | — | | | $ | 4,933 | | | $ | — | | | $ | — | | | $ | — | |
| (1) | Gross unrealized appreciation as presented in the Portfolio of Investments. |
| (2) | The amount is limited to the net derivative balance and, accordingly, does not include collateral pledged of $10,396. |
Global Atlantic Portfolios
NOTES TO FINANCIAL STATEMENTS (Continued)
June 30, 2019 (Unaudited)
Global Atlantic BlackRock Disciplined International Core Portfolio
| Assets | | | | | | | | | | | | | | | |
| | | | | | | | | | | | Gross Amounts Not Offset | | | | |
| | | | | | | | | | | | in the Statement of Assets | | | | |
| | | | | | | | | | | | & Liabilities | | | | |
| | | | | | Gross Amounts | | | Net Amounts of | | | | | | | | | | |
| | | Gross Amounts | | | Offset in the | | | Liabilities Presented in | | | | | | Cash | | | | |
| | | of Recognized | | | Statement of Assets | | | the Statement of Assets | | | Financial | | | Collateral | | | | |
| Description | | Liabilities | | | & Liabilities | | | & Liabilities | | | Instruments | | | Pledged | | | Net Amount | |
| Futures Contracts | | $ | 95,745 | (1) | | $ | — | (1) | | $ | 95,745 | | | $ | — | | | $ | — | (2) | | $ | — | |
| Total | | $ | 95,745 | | | $ | — | | | $ | 95,745 | | | $ | — | | | $ | — | | | $ | — | |
| | | | | | | | | | | | | | | | | | | | | | | | | |
| Liabilities | | | | | | | | | | | | | | | | | | | | | | | | |
| | | | | | | | | | | | Gross Amounts Not Offset | | | | |
| | | | | | | | | | | | in the Statement of Assets | | | | |
| | | | | | | | | | | | & Liabilities | | | | |
| | | | | | Gross Amounts | | | Net Amounts of | | | | | | | | | | |
| | | Gross Amounts | | | Offset in the | | | Liabilities Presented in | | | | | | Cash | | | | |
| | | of Recognized | | | Statement of Assets | | | the Statement of Assets | | | Financial | | | Collateral | | | | |
| Description | | Liabilities | | | & Liabilities | | | & Liabilities | | | Instruments | | | Pledged | | | Net Amount | |
| Forward Foreign Currency Contracts | | $ | 51 | (1) | | $ | — | (1) | | $ | 51 | | | $ | — | | | $ | — | (2) | | $ | — | |
| Total | | $ | 51 | | | $ | — | | | $ | 51 | | | $ | — | | | $ | — | | | $ | — | |
| (1) | Gross unrealized depreciation as presented in the Portfolio of Investments. |
| (2) | The amount is limited to the net derivative balance and, accordingly, does not include excess collateral pledged of $213,078. |
Global Atlantic BlackRock Disciplined Mid Cap Growth Portfolio
| Assets | | | | | | | | | | | | | | | | | | |
| | | | | | | | | | | | Gross Amounts Not Offset | | | | |
| | | | | | | | | | | | in the Statement of Assets & | | | | |
| | | | | | | | | | | | Liabilities | | | | |
| | | | | | Gross Amounts | | | Net Amounts of Assets | | | | | | | | | | |
| | | Gross Amounts | | | Offset in the | | | Presented in the | | | | | | Cash | | | | |
| | | of Recognized | | | Statement of Assets | | | Statement of Assets & | | | Financial | | | Collateral | | | | |
| Description | | Assets | | | & Liabilities | | | Liabilities | | | Instruments | | | Pledged | | | Net Amount | |
| Futures Contracts | | $ | 46,442 | (1) | | $ | — | (1) | | $ | 46,442 | | | $ | — | | | $ | — | (2) | | $ | — | |
| Total | | $ | 46,442 | | | $ | — | | | $ | 46,442 | | | $ | — | | | $ | — | | | $ | — | |
| (1) | Gross unrealized appreciation as presented in the Portfolio of Investments. |
| (2) | The amount is limited to the net derivative balance and, accordingly, does not include collateral pledged of $128,848. |
Global Atlantic Portfolios
NOTES TO FINANCIAL STATEMENTS (Continued)
June 30, 2019 (Unaudited)
Global Atlantic BlackRock Disciplined Small Cap Portfolio
| Assets | | | | | | | | | | | | | | | | | | |
| | | | | | | | | | | | Gross Amounts Not Offset | | | | |
| | | | | | | | | | | | in the Statement of Assets & | | | | |
| | | | | | | | | | | | Liabilities | | | | |
| | | | | | Gross Amounts | | | Net Amounts of Assets | | | | | | | | | | |
| | | Gross Amounts | | | Offset in the | | | Presented in the | | | | | | Cash | | | | |
| | | of Recognized | | | Statement of Assets | | | Statement of Assets & | | | Financial | | | Collateral | | | | |
| Description | | Assets | | | & Liabilities | | | Liabilities | | | Instruments | | | Pledged | | | Net Amount | |
| Futures Contracts | | $ | 10,030 | (1) | | $ | — | (1) | | $ | 10,030 | | | $ | — | | | $ | — | (2) | | $ | — | |
| Total | | $ | 10,030 | | | $ | — | | | $ | 10,030 | | | $ | — | | | $ | — | | | $ | — | |
| (1) | Gross unrealized appreciation as presented in the Portfolio of Investments. |
| (2) | The amount is limited to the net derivative balance and, accordingly, does not include collateral pledged of $19.523. |
Global Atlantic BlackRock Disciplined U.S. Core Portfolio
| Assets | | | | | | | | | | | | | | | | | | |
| | | | | | | | | | | | Gross Amounts Not Offset | | | | |
| | | | | | | | | | | | in the Statement of Assets & | | | | |
| | | | | | | | | | | | Liabilities | | | | |
| | | | | | Gross Amounts | | | Net Amounts of Assets | | | | | | | | | | |
| | | Gross Amounts | | | Offset in the | | | Presented in the | | | | | | Cash | | | | |
| | | of Recognized | | | Statement of Assets | | | Statement of Assets & | | | Financial | | | Collateral | | | | |
| Description | | Assets | | | & Liabilities | | | Liabilities | | | Instruments | | | Pledged | | | Net Amount | |
| Futures Contracts | | $ | 7,946 | (1) | | $ | — | (1) | | $ | 7,946 | | | $ | — | | | $ | — | (2) | | $ | — | |
| Total | | $ | 7,946 | | | $ | — | | | $ | 7,946 | | | $ | — | | | $ | — | | | $ | — | |
| (1) | Gross unrealized appreciation as presented in the Portfolio of Investments. |
| (2) | The amount is limited to the net derivative balance and, accordingly, does not include collateral pledged of $22,714. |
Global Atlantic BlackRock Disciplined Value Portfolio
| Assets | | | | | | | | | | | | | | | | | | |
| | | | | | | | | | | | Gross Amounts Not Offset | | | | |
| | | | | | | | | | | | in the Statement of Assets & | | | | |
| | | | | | | | | | | | Liabilities | | | | |
| | | | | | Gross Amounts | | | Net Amounts of Assets | | | | | | | | | | |
| | | Gross Amounts | | | Offset in the | | | Presented in the | | | | | | Cash | | | | |
| | | of Recognized | | | Statement of Assets | | | Statement of Assets & | | | Financial | | | Collateral | | | | |
| Description | | Assets | | | & Liabilities | | | Liabilities | | | Instruments | | | Pledged | | | Net Amount | |
| Futures Contracts | | $ | 60,379 | (1) | | $ | — | (1) | | $ | 60,379 | | | $ | — | | | $ | — | (2) | | $ | — | |
| Total | | $ | 60,379 | | | $ | — | | | $ | 60,379 | | | $ | — | | | $ | — | | | $ | — | |
| (1) | Gross unrealized appreciation and appreciation as presented in the Portfolio of Investments. |
| (2) | The amount is limited to the net derivative balance and, accordingly, does not include collateral pledged of $169,069. |
Global Atlantic Portfolios
NOTES TO FINANCIAL STATEMENTS (Continued)
June 30, 2019 (Unaudited)
Global Atlantic BlackRock High Yield Portfolio
| Liabilities | | | | | | | | | | | | | | | |
| | | | | | | | | | | | Gross Amounts Not Offset | | | | |
| | | | | | | | | | | | in the Statement of Assets & | | | | |
| | | | | | | | | | | | Liabilities | | | | |
| | | | | | Gross Amounts | | | Net Amounts of | | | | | | | | | | |
| | | Gross Amounts | | | Offset in the | | | Liabilities Presented in | | | | | | Cash | | | | |
| | | of Recognized | | | Statement of Assets | | | the Statement of Assets | | | Financial | | | Collateral | | | | |
| Description | | Liabilities | | | & Liabilities | | | & Liabilities | | | Instruments | | | Pledged | | | Net Amount | |
| Futures Contracts | | $ | 25,474 | (1) | | $ | — | (1) | | $ | 25,474 | | | $ | — | | | $ | 25,474 | (2) | | $ | — | |
| Total | | $ | 25,474 | | | $ | — | | | $ | 25,474 | | | $ | — | | | $ | 25,474 | | | $ | — | |
| (1) | Gross unrealized appreciation and depreciation as presented in the Portfolio of Investments. |
| (2) | The amount is limited to the net derivative balance and, accordingly, does not include excess collateral pledged of $22,339. |
Global Atlantic Goldman Sachs Core Fixed Income Portfolio
| Assets | | | | | | | | | | | | | | | | | | |
| | | | | | | | | | | | Gross Amounts Not Offset | | | | |
| | | | | | | | | | | | in the Statement of Assets & | | | | |
| | | | | | | | | | | | Liabilities | | | | |
| | | | | | Gross Amounts | | | Net Amounts of Assets | | | | | | | | | | |
| | | Gross Amounts | | | Offset in the | | | Presented in the | | | | | | Cash | | | | |
| | | of Recognized | | | Statement of Assets | | | Statement of Assets & | | | Financial | | | Collateral | | | | |
| Description | | Assets | | | & Liabilities | | | Liabilities | | | Instruments | | | Pledged | | | Net Amount | |
| Futures Contracts | | $ | 361,962 | (1) | | $ | 160,223 | (1) | | $ | 201,739 | | | $ | — | | | $ | — | (2) | | $ | — | |
| Forward Exchange Contracts | | | 12,516,383 | | | | 12,437,025 | | | | 79,358 | | | | — | | | | — | | | | — | |
| Swap Contracts | | | 154,832 | | | | 102,293 | | | | 52,539 | | | | — | | | | — | | | | — | |
| Total | | $ | 13,033,177 | | | $ | 12,699,541 | | | $ | 333,636 | | | $ | — | | | $ | — | | | $ | — | |
| (1) | Gross unrealized appreciation and depreciation as presented in the Portfolio of Investments. |
| (2) | The amount is limited to the net derivative balance and, accordingly, does not include collateral pledged of $245,553 for swap contracts. |
Impact of Derivatives on the Statements of Assets and Liabilities and Statements of Operations
The following is a summary of the location of derivative investments on the Global Atlantic Goldman Sachs Core Fixed Income Portfolio’s Statement of Assets and Liabilities as of June 30, 2019:
| Location on the Statements of Assets and Liabilities |
| Derivatives Investment Type | Liability Derivatives |
| Interest Rate Contracts | Unrealized appreciation on futures contracts and swap contracts |
| | |
| Currency Contracts | Unrealized depreciation on forward foreign currency contracts |
Global Atlantic Portfolios
NOTES TO FINANCIAL STATEMENTS (Continued)
June 30, 2019 (Unaudited)
The following table sets forth the fair value of the Global Atlantic Goldman Sachs Core Fixed Income Portfolio’s derivative contracts by primary risk exposure as of June 30, 2019:
Global Atlantic Goldman Sachs Core Fixed Income Portfolio
| Derivatives Investment Fair Value |
| | | | | | | | | | | | Total as of | |
| | | Interest Rate | | | Currency | | | Credit | | | June 30, 2019 | |
| Futures Contracts | | $ | 201,739 | | | $ | — | | | $ | — | | | $ | 201,739 | |
| Swap Contracts | | | 42,854 | | | | — | | | | 9,685 | | | | 52,539 | |
| Forward Foreign Currency Contracts | | | — | | | | 79,358 | | | | — | | | | 79,358 | |
| Total | | $ | 244,593 | | | $ | 79,358 | | | $ | 9,685 | | | $ | 333,636 | |
The following is a summary of the location of derivative investments on the Global Atlantic Goldman Sachs Core Fixed Income Portfolio’s Statement of Operations for the six months ended June 30, 2019:
| Derivative Investment Type | | Location of Gain/(Loss) on Derivatives |
| Futures Contracts | | Net realized loss on: |
| | | Futures contracts |
| | | Net change in unrealized appreciation on: |
| | | Futures contracts |
| | | |
| Currency Contracts | | Net realized loss on: |
| | | Forward foreign currency contracts |
| | | Net change in unrealized appreciation on: |
| | | Forward foreign currency contracts |
| | | |
| Swap Contracts | | Net realized gain on: |
| | | Swap contracts |
| | | Net change in unrealized appreciation on: |
| | | Swap contracts |
The following is a summary of the Global Atlantic Goldman Sachs Core Fixed Income Portfolio’s realized and unrealized gain/(loss) on derivative investments recognized in the Statement of Operations categorized by primary risk exposure for the six months ended June 30, 2019:
| Net change in unrealized appreciation on derivatives recognized in the |
| Statement of Operations |
| | | | | | | | | | | | Total as of | |
| | | Interest Rate | | | Currency | | | Credit | | | June 30, 2019 | |
| Futures Contracts | | $ | 27,122 | | | $ | — | | | $ | — | | | $ | 27,122 | |
| Swap Contracts | | | (28,706 | ) | | | — | | | | 9,685 | | | | (19,021 | ) |
| Forward Foreign Currency Contracts | | | — | | | | 91,661 | | | | — | | | | 91,661 | |
| Total | | $ | (1,584 | ) | | $ | 91,661 | | | $ | 9,685 | | | $ | 99,762 | |
| | | | | | | | | | | | | | | | | |
| Realized gain/(loss) on derivatives recognized in the Statement of Operations |
| | | | | | | | | | | | Total as of | |
| | | Interest Rate | | | Currency | | | Credit | | | June 30, 2019 | |
| Futures Contracts | | $ | 434,517 | | | $ | — | | | $ | — | | | $ | 434,517 | |
| Swap Contracts | | | 81,797 | | | | — | | | | (4,363 | ) | | | 77,434 | |
| Forward Foreign Currency Contracts | | | — | | | | 16,422 | | | | — | | | | 16,422 | |
| Total | | $ | 516,314 | | | $ | 16,422 | | | $ | (4,363 | ) | | $ | 528,373 | |
Global Atlantic Portfolios
NOTES TO FINANCIAL STATEMENTS (Continued)
June 30, 2019 (Unaudited)
The notional value of the derivative instruments outstanding as of June 30, 2019, as disclosed in the Portfolios of Investments, and the amounts of realized and changes in unrealized gains and losses on derivative instruments during the period as disclosed above and within in the Statements of Operations serve as indicators of the volume of derivative activity for the Portfolios.
Short Sales –A Portfolio may make short sales of securities: (i) to offset potential declines in long positions in similar securities; (ii) to increase the flexibility of the Portfolio; (iii) for investment return; (iv) as part of a risk arbitrage strategy; and (v) as part of its overall portfolio management strategies involving the use of derivative instruments. A short sale is a transaction in which a Portfolio sells a security it does not own or have the right to acquire (or that it owns but does not wish to deliver) in anticipation that the market price of that security will decline.
When a Portfolio makes a short sale, the broker-dealer through which the short sale is made must borrow the security sold short and deliver it to the party purchasing the security. The Portfolio is required to make a margin deposit in connection with such short sales; the Portfolio may have to pay a fee to borrow particular securities and will often be obligated to pay over any dividends and accrued interest on borrowed securities.
If the price of the security sold short increases between the time of the short sale and the time a Portfolio covers its short position, the Portfolio will incur a loss; conversely, if the price declines, the Portfolio will realize a capital gain. Any gain will be decreased, and any loss increased, by the transaction costs described above. The successful use of short selling may be adversely affected by imperfect correlation between movements in the price of the security sold short and the securities being hedged.
To the extent a Portfolio sells securities short, it will provide collateral to the broker-dealer and (except in the case of short sales “against the box”) will maintain additional asset coverage in the form of cash, U.S. government securities or other liquid securities with its custodian in a segregated account in an amount at least equal to the difference between the current market value of the securities sold short and any amounts required to be deposited as collateral with the selling broker (not including the proceeds of the short sale). A Portfolio does not intend to enter into short sales (other than short sales “against the box”) if immediately after such sales the aggregate of the value of all collateral plus the amount in such segregated account exceeds 10% of the value of the Portfolio’s net assets. This percentage may be varied by action of the Board of Trustees. A short sale is “against the box” to the extent a Portfolio contemporaneously owns, or has the right to obtain at no added cost, securities identical to those sold short.
When-Issued and Delayed-Delivery Transactions –The Portfolios may engage in when-issued or delayed-delivery transactions. The Portfolios record when-issued securities on the trade date and maintain security positions such that sufficient liquid assets will be available to make payment for the securities purchased. Securities purchased on a when-issued or delayed-delivery basis are marked to market daily and begin earning interest on the settlement date. Losses may occur on these transactions due to changes in market conditions or the failure of counterparties to perform under the contract.
Real Estate Investment Trusts –Certain Portfolios may invest in real estate investment trusts (“REITs”). REITs are pooled investment vehicles that own, and typically operate, income-producing real estate. If a REIT meets certain requirements, including distributing to shareholders substantially all of its taxable income (other than net capital gains), then it is not taxed on the income distributed to shareholders. REITs are subject to management fees and other expenses, and so a Portfolio that invests in REITs will bear its proportionate share of the costs of the REITs’ operations. Along with the risks common to different types of real estate-related securities, such as loss to casualty or condemnation, increases in property taxes and operating expenses, zoning law amendments, changes in interest rates, overbuilding and increased competition, variations in market value, and possible environmental liabilities, REITs involve additional risk factors. These include poor performance by the REIT’s manager, changes to the tax laws, and failure by the REIT to qualify for tax free distribution of income or exemption under the 1940 Act. In addition, REITs are not diversified and are heavily dependent on cash flow.
Global Atlantic Portfolios
NOTES TO FINANCIAL STATEMENTS (Continued)
June 30, 2019 (Unaudited)
Distributions from a Portfolio’s investments in REITs may be characterized as ordinary income, a net capital gain or a return of capital. The Portfolios record distributions that represent a net capital gain as a realized gain and distributions that represent a return of capital as a reduction of the cost of investment. REITs report information on the source of their distributions annually in the following calendar year. As a result, a Portfolio estimates the source of REIT distributions for accounting purposes and then makes adjustments when the actual source information is reported by the REIT. These estimates are based on the most recent REIT distribution information available.
Mortgage Dollar Roll Transactions –A mortgage dollar roll transaction involves a sale by a Portfolio of mortgage related securities that it holds with an agreement by the Portfolio to repurchase similar securities at an agreed upon price and date. The securities purchased will bear the same interest rate as those sold, but generally will be collateralized by pools of mortgages with different prepayment histories than those securities sold. The Portfolios account for mortgage dollar rolls as purchases and sales transactions.
Credit Risk –There is a risk that security issuers will not make interest and/or principal payments on their securities. In addition, the credit quality of securities may be lowered if an issuer’s financial condition changes. Lower credit quality will lead to greater volatility in the price of a security and in shares of a Portfolio or an underlying fund. Lower credit quality also will affect liquidity and make it difficult to sell the security. This means that, compared to issuers of higher rated securities, issuers of lower rated securities are less likely to have the capacity to pay interest and repay principal when due in the event of adverse business, financial or economic conditions and/or may be in default or not current in the payment of interest or principal. Default, or the market’s perception that an issuer is likely to default, tends to reduce the value and liquidity of fixed income securities, thereby reducing the value of your investment in Portfolio shares. In addition, default may cause a Portfolio to directly or indirectly incur expenses in seeking recovery of principal or interest.
A Portfolio could lose money on a debt security if an issuer or borrower is unable or fails to meet its obligations, including failing to make interest payments and/or to repay principal when due. Changes in an issuer’s financial strength, the market’s perception of the issuer’s financial strength or in a security’s credit rating, which reflects a third party’s assessment of the credit risk presented by a particular issuer, may affect debt securities’ value. A Portfolio may incur substantial losses on debt securities that are inaccurately perceived to present a different amount of credit risk by the market, the Sub-Adviser or the rating agencies than such securities actually do.
Derivatives Risk –The use of derivatives is a highly specialized activity that involves investment techniques and risks different from those associated with investments in more traditional securities and instruments. The use of derivatives may increase costs, reduce a Portfolio’s returns and/or increase volatility. Volatility is defined as the characteristic of a security, an index or a market to fluctuate significantly in price within a short time period. Many types of derivatives are also subject to counterparty risk, which is the risk that the other party in the transaction will not fulfill its contractual obligation. A risk of a Portfolio’s use of derivatives is that the fluctuations in their values may not correlate perfectly with, and may be more sensitive to market events than, the overall securities markets. The possible lack of a liquid secondary market for derivatives and the resulting inability to sell or otherwise close-out a derivatives position at an advantageous time or price could expose a Portfolio to losses and could make derivatives more difficult to value accurately. Derivatives typically give rise to a form of leverage and may expose a Portfolio to greater risk and increase its costs. The Dodd-Frank Wall Street Reform and Consumer Protection Act (the “Dodd-Frank Act”) and related regulatory developments require the clearing and exchange-trading of many standardized over-the-counter (“OTC”) derivative instruments deemed to be “swaps.” The Commodity Futures Trading Commission (“CFTC”) has implemented mandatory exchange-trading and clearing requirements under the Dodd-Frank Act and the CFTC continues to approve contracts for central clearing. Uncleared swaps are subject to margin requirements that are being implemented on a phase-in basis. The regulation of the derivatives markets has increased over the past several years, and there can be no assurance that any new governmental regulation will not adversely affect a Portfolio’s ability to achieve its investment result.
Market Risk –The market prices of securities may go up or down, sometimes rapidly or unpredictably, due to general market conditions, such as real or perceived adverse economic or political conditions, inflation, changes in interest rates or currency rates, limited dealer capacity, lack of liquidity in the markets or adverse investor sentiment. Each Portfolio has exposure to instruments that may be more volatile and carry more risk than some other forms of investment. Adverse market conditions may be prolonged and may not have the same impact on all types of securities. Market prices of securities also may go down due to events or conditions that affect particular sectors, industries or issuers. When market prices fall, the value of your investment will go down.
Global Atlantic Portfolios
NOTES TO FINANCIAL STATEMENTS (Continued)
June 30, 2019 (Unaudited)
A Portfolio may experience a substantial or complete loss on any individual security. Since the global financial crisis that began in 2008, the U.S. and many foreign economies continue to experience its after-effects, which have resulted, and may continue to result, in slower growth and an unusually high degree of volatility in the financial markets, both domestic and foreign. Additionally, the U.S. and foreign governmental market support activities implemented since the financial crisis are being reduced, and the Federal Reserve has started to raise interest rates. Further reduction or withdrawal of Federal Reserve or other U.S. or non-U.S. governmental support could negatively affect the markets generally and increase market volatility. These and other changes in market conditions could reduce the value and liquidity of the securities in which a Portfolio invests. This environment could make identifying investment risks and opportunities especially difficult.
Policy and legislative changes in the U.S. and abroad affect many aspects of financial regulation and may, in some cases, contribute to decreased liquidity and increased volatility in the financial markets. Economies and financial markets around the world are becoming increasingly interconnected. As a result, whether or not a Portfolio has exposure to securities of issuers located in or with significant exposure to countries experiencing economic and financial difficulties, the value and liquidity of the Portfolio’s investments may be negatively affected.
In addition, market prices of securities in broad market segments may be adversely affected by a prominent issuer having experienced losses or by the lack of earnings or such an issuer’s failure to meet the market’s expectations with respect to new products or services, or even by factors wholly unrelated to the value or condition of the issuer, such as changes in interest rates. An increase in interest rates or other adverse conditions (e.g., inflation/deflation, increased selling of fixed income investments across other pooled investment vehicles or accounts, changes in investor perception or changes in government intervention in the markets) may lead to increased redemptions and increased portfolio turnover, which could reduce liquidity for certain Portfolio investments, adversely affect values of portfolio holdings and increase a Portfolio’s costs. If dealer capacity in fixed income markets is insufficient for market conditions, this has the potential to further inhibit liquidity and increase volatility in the fixed income markets.
Quantitative Investing Risk –Investments selected using quantitative analysis or “models” may perform differently than expected as a result of the factors used in the models, the weight placed on each factor, changes from the factors’ historical trends, and technical issues in the construction and implementation of the models (including, for example, data problems and/or software issues). In addition, investments selected using models may react differently to issuer, political, market, and economic developments from the market as a whole or securities selected using only fundamental analysis. There is no guarantee that the use of quantitative analysis will result in effective investment decisions for a Portfolio. Additionally, commonality of holdings across quantitative money managers may amplify losses.
Expenses –Expenses of the Trust that are directly identifiable to a specific Portfolio are charged to that Portfolio. Expenses, which are not readily identifiable to a specific Portfolio, are allocated in such a manner as deemed equitable, taking into consideration the nature and type of expense and the relative sizes of the Portfolios in the Trust.
Indemnification –The Trust indemnifies its officers and Trustees for certain liabilities that may arise from the performance of their duties to the Trust. Additionally, in the normal course of business, the Portfolios enter into contracts that contain a variety of representations and warranties and which provide general indemnities. Each Portfolio’s maximum exposure under these arrangements is unknown, as this would involve future claims that may be made against the Portfolios that have not yet occurred. However, the Portfolios expect the risk of loss due to these warranties and indemnities to be remote.
| 3. | INVESTMENT TRANSACTIONS |
For the six months ended June 30, 2019, cost of purchases and proceeds from sales of portfolio securities, other than short-term investments, were as follows:
| Portfolio | | Purchases | | | Sales | |
| Global Atlantic BlackRock Allocation Portfolio | | $ | 29,875,035 | | | $ | 33,588,817 | |
| Global Atlantic BlackRock Disciplined Core Portfolio | | $ | 394,955,042 | | | $ | 429,155,476 | |
| Global Atlantic BlackRock Disciplined Growth Portfolio | | $ | 13,586,755 | | | $ | 15,183,766 | |
| Global Atlantic BlackRock Disciplined International Core Portfolio | | $ | 41,922,670 | | | $ | 50,004,277 | |
Global Atlantic Portfolios
NOTES TO FINANCIAL STATEMENTS (Continued)
June 30, 2019 (Unaudited)
| Portfolio | | Purchases | | | Sales | |
| Global Atlantic BlackRock Disciplined Mid Cap Growth Portfolio | | $ | 162,810,221 | | | $ | 179,274,352 | |
| Global Atlantic BlackRock Disciplined Small Cap Portfolio | | $ | 3,621,831 | | | $ | 4,974,804 | |
| Global Atlantic BlackRock Disciplined U.S. Core Portfolio | | $ | 18,203,636 | | | $ | 19,249,845 | |
| Global Atlantic BlackRock Disciplined Value Portfolio | | $ | 202,147,350 | | | $ | 218,582,465 | |
| Global Atlantic BlackRock High Yield Portfolio | | $ | 17,922,965 | | | $ | 21,422,540 | |
| Global Atlantic Goldman Sachs Core Fixed Income Portfolio | | $ | 213,297,657 | | | $ | 215,063,802 | |
| Global Atlantic Goldman Sachs Global Equity Insights Portfolio | | $ | 20,096,335 | | | $ | 220,28,962 | |
| Global Atlantic Goldman Sachs Large Cap Growth Insights Portfolio | | $ | 90,720,874 | | | $ | 98,731,150 | |
| Global Atlantic Goldman Sachs Mid Cap Value Insights Portfolio | | $ | 138,899,945 | | | $ | 148,671,011 | |
The aggregate amount of purchases and sales listed above are inclusive of the cost of purchases and proceeds from sales of mortgage dollar roll transactions. The amount of these transactions is listed below.
| Portfolio | | Purchases | | | Sales | |
| Global Atlantic Goldman Sachs Core Fixed Income Portfolio | | $ | 158,495,684 | | | $ | 157,587,127 | |
| 4. | INVESTMENT ADVISORY AGREEMENT AND TRANSACTIONS WITH RELATED PARTIES |
The Adviser serves as the Portfolios’ investment adviser. The Adviser has engaged the following sub-advisers for the Portfolios:
| Portfolio | | Sub-Adviser |
| Global Atlantic BlackRock Allocation Portfolio | | BlackRock Investment Management, LLC |
| Global Atlantic BlackRock Disciplined Core Portfolio | | BlackRock Investment Management, LLC |
| Global Atlantic BlackRock Disciplined Growth Portfolio | | BlackRock Investment Management, LLC |
| Global Atlantic BlackRock Disciplined International Core Portfolio | | BlackRock Investment Management, LLC |
| Global Atlantic BlackRock Disciplined Mid Cap Growth Portfolio | | BlackRock Investment Management, LLC |
| Global Atlantic BlackRock Disciplined Small Cap Portfolio | | BlackRock Investment Management, LLC |
| Global Atlantic BlackRock Disciplined U.S. Core Portfolio | | BlackRock Investment Management, LLC |
| Global Atlantic BlackRock Disciplined Value Portfolio | | BlackRock Investment Management, LLC |
| Global Atlantic BlackRock High Yield Portfolio | | BlackRock Investment Management, LLC |
| Global Atlantic Goldman Sachs Core Fixed Income Portfolio | | Goldman Sachs Asset Management, L.P. |
| Global Atlantic Goldman Sachs Global Equity Insights Portfolio | | Goldman Sachs Asset Management, L.P. |
| Global Atlantic Goldman Sachs Large Cap Growth Insights Portfolio | | Goldman Sachs Asset Management, L.P. |
| Global Atlantic Goldman Sachs Mid Cap Value Insights Portfolio | | Goldman Sachs Asset Management, L.P. |
Global Atlantic Portfolios
NOTES TO FINANCIAL STATEMENTS (Continued)
June 30, 2019 (Unaudited)
The Portfolios have employed Gemini Fund Services, LLC (“GFS”) to provide administration, fund accounting and transfer agent services. GFS provides a Principal Financial Officer to the Trust. Effective February 1, 2019, NorthStar Financial Services Group, LLC, the parent company of GFS sold its interest in the Gemini Companies to a third party private equity firm that contemporaneously acquired Ultimus Fund Solutions, LLC (an independent mutual fund administration firm) and its affiliates (collectively, the “Ultimus Companies”). As a result of these separate transactions, the Gemini Companies and the Ultimus Companies are now indirectly owned through a common parent entity, The Ultimus Group, LLC.
Pursuant to an Investment Advisory Agreement with the Trust, on behalf of the Portfolios, the Adviser, under the oversight of the Board, directs the daily investment operations of the Portfolios and supervises the performance of administrative and professional services provided by others. As compensation for its services and the related expenses borne by the Adviser, the Portfolios pay the Adviser an advisory fee, computed on average daily net assets and accrued daily and paid monthly.
The following chart details the annual advisory fee for each Portfolio.
| Portfolio | | Advisory Fee* |
| Global Atlantic BlackRock Allocation Portfolio | | 0.22% of the first $1 billion |
| | | 0.21% of the next $1 billion |
| | | 0.20% over $2 billion |
| | | |
| Global Atlantic BlackRock Disciplined Core Portfolio | | 0.39% of the first $1 billion |
| | | 0.37% of the next $1 billion |
| | | 0.35% over $2 billion |
| | | |
| Global Atlantic BlackRock Disciplined Growth Portfolio | | 0.45% of the first $1 billion |
| | | 0.43% of the next $1 billion |
| | | 0.41% over $2 billion |
| | | |
| Global Atlantic BlackRock Disciplined International Core Portfolio | | 0.60% of the first $1 billion |
| | | 0.58% of the next $1 billion |
| | | 0.56% over $2 billion |
| | | |
| Global Atlantic BlackRock Disciplined Mid Cap Growth Portfolio | | 0.55% of the first $1 billion |
| | | 0.53% of the next $1 billion |
| | | 0.51% over $2 billion |
| | | |
| Global Atlantic BlackRock Disciplined Small Cap Portfolio | | 0.54% of the first $1 billion |
| | | 0.52% of the next $1 billion |
| | | 0.50% over $2 billion |
| | | |
| Global Atlantic BlackRock Disciplined U.S. Core Portfolio | | 0.39% of the first $1 billion |
| | | 0.37% of the next $1 billion |
| | | 0.35% over $2 billion |
| | | |
| Global Atlantic BlackRock Disciplined Value Portfolio | | 0.45% of the first $1 billion |
| | | 0.43% of the next $1 billion |
| | | 0.41% over $2 billion |
| | | |
| Global Atlantic BlackRock High Yield Portfolio | | 0.50% of the first $1 billion |
| | | 0.48% of the next $1 billion |
| | | 0.46% over $2 billion |
| | | |
Global Atlantic Portfolios
NOTES TO FINANCIAL STATEMENTS (Continued)
June 30, 2019 (Unaudited)
| Portfolio | | Advisory Fee* |
| Global Atlantic Goldman Sachs Core Fixed Income Portfolio | | 0.34% of the first $250 million |
| | | 0.32% of the next $250 million |
| | | 0.26% over $500 million |
| | | |
| Global Atlantic Goldman Sachs Global Equity Insights Portfolio | | 0.63% of the first $250 million |
| | | 0.61% of the next $250 million |
| | | 0.58% of the next $500 million |
| | | 0.55% over $1 billion |
| | | |
| Global Atlantic Goldman Sachs Large Cap Growth Insights Portfolio | | 0.37% of the first $250 million |
| | | 0.35% of the next $250 million |
| | | 0.34% of the next $500 million |
| | | 0.32% over $1 billion |
| | | |
| Global Atlantic Goldman Sachs Mid Cap Value Insights Portfolio | | 0.55% of the first $250 million |
| | | 0.53% of the next $250 million |
| | | 0.51% of the next $500 million |
| | | 0.48% over $1 billion |
| * | Calculated daily based on the average daily net assets. |
With respect to each Portfolio, the Adviser has contractually agreed to waive its fees and to reimburse expenses, at least until the expiration dates listed below, to ensure that total annual portfolio operating expenses after fee waiver and/or reimbursement (exclusive of any front-end or contingent deferred loads, brokerage fees and commissions, acquired fund fees and expenses, borrowing costs (such as interest and dividend expense on securities sold short), taxes and extraordinary expenses, such as litigation) will not exceed the average daily net asset percentages attributable to the Portfolio’s shares listed below (“Waiver Agreements”). The expense reimbursement is subject to possible recoupment from the Portfolio in future years on a rolling three year basis (within the three years after the fees have been waived or reimbursed) if such recoupment can be achieved within the lesser of the expense limits listed below and any expense limits applicable at the time of recoupment. The agreements may be terminated only by the Portfolio’s Board of Trustees, on 60 days’ written notice to the Adviser.
| Portfolio Expense Limitation |
| Portfolio | | Class I | | Class II | | Expiration Date |
| Global Atlantic BlackRock Allocation Portfolio | | 0.31% | | 0.56% | | April 30, 2020 |
| Global Atlantic BlackRock Disciplined Core Portfolio | | 0.48% | | 0.73% | | April 30, 2020 |
| Global Atlantic BlackRock Disciplined Growth Portfolio | | 0.54% | | 0.79% | | April 30, 2020 |
| Global Atlantic BlackRock Disciplined International Core Portfolio | | 0.69% | | 0.94% | | April 30, 2020 |
| Global Atlantic BlackRock Disciplined Mid Cap Growth Portfolio | | 0.63% | | 0.88% | | April 30, 2020 |
| Global Atlantic BlackRock Disciplined Small Cap Portfolio | | 0.63% | | 0.88% | | April 30, 2020 |
| Global Atlantic BlackRock Disciplined U.S. Core Portfolio | | 0.48% | | 0.73% | | April 30, 2020 |
| Global Atlantic BlackRock Disciplined Value Portfolio | | 0.54% | | 0.79% | | April 30, 2020 |
| Global Atlantic BlackRock High Yield Portfolio | | 0.59% | | 0.84% | | April 30, 2020 |
| Global Atlantic Goldman Sachs Core Fixed Income Portfolio | | 0.43% | | 0.68% | | April 30, 2020 |
| Global Atlantic Goldman Sachs Global Equity Insights Portfolio | | 0.72% | | 0.97% | | April 30, 2020 |
| Global Atlantic Goldman Sachs Large Cap Growth Insights Portfolio | | 0.46% | | 0.71% | | April 30, 2020 |
| Global Atlantic Goldman Sachs Mid Cap Value Insights Portfolio | | 0.64% | | 0.89% | | April 30, 2020 |
Global Atlantic Portfolios
NOTES TO FINANCIAL STATEMENTS (Continued)
June 30, 2019 (Unaudited)
For the six months ended June 30, 2019, the Adviser waived fees as follows:
| Portfolio | | Waiver | |
| Global Atlantic BlackRock Allocation Portfolio | | $ | 8,375 | |
| Global Atlantic BlackRock Disciplined Core Portfolio | | $ | 37,097 | |
| Global Atlantic BlackRock Disciplined Growth Portfolio | | $ | 4,546 | |
| Global Atlantic BlackRock Disciplined International Core Portfolio | | $ | 12,773 | |
| Global Atlantic BlackRock Disciplined Mid Cap Growth Portfolio | | $ | 24,162 | |
| Global Atlantic BlackRock Disciplined Small Cap Portfolio | | $ | 4,766 | |
| Global Atlantic BlackRock Disciplined U.S. Core Portfolio | | $ | 5,125 | |
| Global Atlantic BlackRock Disciplined Value Portfolio | | $ | 19,984 | |
| Global Atlantic BlackRock High Yield Portfolio | | $ | 9,474 | |
| Global Atlantic Goldman Sachs Core Fixed Income Portfolio | | $ | 10,968 | |
| Global Atlantic Goldman Sachs Global Equity Insights Portfolio | | $ | 5,434 | |
| Global Atlantic Goldman Sachs Large Cap Growth Insights Portfolio | | $ | 8,752 | |
| Global Atlantic Goldman Sachs Mid Cap Value Insights Portfolio | | $ | 11,391 | |
If the Adviser waives any fee or reimburses any expense pursuant to the Waiver Agreements, and the Portfolio’s operating expenses are subsequently less than the expense limitation, the Adviser shall be entitled to reimbursement by the Portfolio for such waived fees or reimbursed expenses provided that such reimbursement does not cause the Portfolio’s expenses to exceed the amount of the expense limitation. If Portfolio operating expenses subsequently exceed the expense limitation, the reimbursements shall be suspended.
The Adviser may recapture the following amounts by the following dates:
| Portfolio | | December 31, 2020 | | | December 31, 2021 | |
| Global Atlantic BlackRock Allocation Portfolio | | $ | 853 | | | $ | 8,542 | |
| Global Atlantic BlackRock Disciplined Core Portfolio | | $ | — | | | $ | 50,540 | |
| Global Atlantic BlackRock Disciplined Growth Portfolio | | $ | 310 | | | $ | 3,754 | |
| Global Atlantic BlackRock Disciplined International Core Portfolio | | $ | 190 | | | $ | 9,810 | |
| Global Atlantic BlackRock Disciplined Mid Cap Growth Portfolio | | $ | 1,748 | | | $ | 35,854 | |
| Global Atlantic BlackRock Disciplined Small Cap Portfolio | | $ | 119 | | | $ | 3,138 | |
| Global Atlantic BlackRock Disciplined U.S. Core Portfolio | | $ | 307 | | | $ | 3,915 | |
| Global Atlantic BlackRock Disciplined Value Portfolio | | $ | — | | | $ | 25,935 | |
| Global Atlantic BlackRock High Yield Portfolio | | $ | 191 | | | $ | 8,365 | |
| Global Atlantic Goldman Sachs Core Fixed Income Portfolio | | $ | 378 | | | $ | 9,926 | |
| Global Atlantic Goldman Sachs Global Equity Insights Portfolio | | $ | 225 | | | $ | 4,573 | |
| Global Atlantic Goldman Sachs Large Cap Growth Insights Portfolio | | $ | 1,279 | | | $ | 9,822 | |
| Global Atlantic Goldman Sachs Mid Cap Value Insights Portfolio | | $ | — | | | $ | 12,865 | |
On May 23, 2017, the U.S. Securities and Exchange Commission (“SEC”) granted an order allowing Commonwealth Annuity and Life Insurance Company (“Commonwealth”) to substitute certain variable investment options in which subaccounts of its Separate Accounts invest with the Portfolios included in this report.
Global Atlantic Portfolios
NOTES TO FINANCIAL STATEMENTS (Continued)
June 30, 2019 (Unaudited)
As a condition of this order, the SEC required that Commonwealth or an affiliate thereof (other than the Trust) pay all expenses and transaction costs of the substitutions, including legal and accounting expenses, any applicable brokerage expenses and other fees and expenses so that no fees or charges were assessed to the affected contract owners to effect the substitutions. There were no substitution-related expenses for the six months ended June 30, 2019.
The Trust, on behalf of the Portfolios, has adopted a distribution and shareholder servicing plan (the “Plan”) pursuant to Rule 12b-1 under the 1940 Act for Class II shares. The fee charged under the Plan is calculated at an annual rate of 0.25% of the average daily net assets attributable to each Portfolio’s Class II shares and, for the six months ended June 30, 2019, was paid to Global Atlantic Distributors, LLC (“GAD”) to provide compensation for ongoing distribution-related activities or services and/or maintenance of the Portfolios’ shareholder accounts, not otherwise required to be provided by the Adviser. GAD is an affiliate of the Adviser.
Pursuant to the terms of an administrative servicing agreement with GFS, each Portfolio pays GFS, an annual asset based fee, which is calculated and applied monthly, adjusted upward for any Portfolios with less than $5 million in assets, and subject to an annual minimum fee based on the number of Portfolios in the Trust. In consideration of its receipt of the annual fee, GFS pays all operational expenses of the Portfolios with the exception of legal counsel fees, Trustee fees, certain expenses related to Board meetings and costs associated with the preparation and filing of Forms N-PORT and N-CEN. Certain extraordinary expenses such as expenses incurred in connection with any merger, reorganization or litigation would be borne by the Portfolios.
For the six months ended June 30, 2019, the Trustees received fees in the amounts as follows:
| Portfolio | | Fees Received | |
| Global Atlantic BlackRock Allocation Portfolio | | $ | 3,020 | |
| Global Atlantic BlackRock Disciplined Core Portfolio | | $ | 22,785 | |
| Global Atlantic BlackRock Disciplined Growth Portfolio | | $ | 705 | |
| Global Atlantic BlackRock Disciplined International Core Portfolio | | $ | 5,992 | |
| Global Atlantic BlackRock Disciplined Mid Cap Growth Portfolio | | $ | 7,567 | |
| Global Atlantic BlackRock Disciplined Small Cap Portfolio | | $ | 725 | |
| Global Atlantic BlackRock Disciplined U.S. Core Portfolio | | $ | 972 | |
| Global Atlantic BlackRock Disciplined Value Portfolio | | $ | 11,130 | |
| Global Atlantic BlackRock High Yield Portfolio | | $ | 3,072 | |
| Global Atlantic Goldman Sachs Core Fixed Income Portfolio | | $ | 3,823 | |
| Global Atlantic Goldman Sachs Global Equity Insights Portfolio | | $ | 1,194 | |
| Global Atlantic Goldman Sachs Large Cap Growth Insights Portfolio | | $ | 3,575 | |
| Global Atlantic Goldman Sachs Mid Cap Value Insights Portfolio | | $ | 5,391 | |
Certain affiliates of GFS provide ancillary services to the Portfolios as follows:
Blu Giant, LLC (“Blu Giant”) – Blu Giant, an affiliate of GFS, provides EDGAR conversion and filing services as well as print management services for the Portfolios on an ad-hoc basis. For the provision of these services, Blu Giant receives customary fees from GFS under the administrative servicing agreement.
Global Atlantic Portfolios
NOTES TO FINANCIAL STATEMENTS (Continued)
June 30, 2019 (Unaudited)
The beneficial ownership, either directly or indirectly, of more than 25% of the voting securities of a Portfolio creates a presumption of the control of the Portfolio, under section 2(a)(9) of the 1940 Act. As of June 30, 2019, Commonwealth Annuity and Life Insurance Company owned 100% of the voting securities of each Portfolio. The Trust has no knowledge as to whether all or any portion of the shares owned of record are also owned beneficially.
Shareholder Concentration Risk –Commonwealth Annuity and Life Insurance Company, certain accounts, or the Adviser’s affiliates may from time to time own (beneficially or of record) or control a significant percentage of a Portfolio’s shares. Redemptions by these entities of their holdings in a Portfolio may impact the Portfolio’s liquidity and NAV. These redemptions may also force a Portfolio to sell securities.
| 6. | AGGREGATE UNREALIZED APPRECIATION AND DEPRECIATION – TAX BASIS |
| | | | | | Gross | | | Gross | | | Net Unrealized | |
| | | Tax | | | Unrealized | | | Unrealized | | | Appreciation/ | |
| | | Cost | | | Appreciation | | | Depreciation | | | (Depreciation) | |
| Global Atlantic BlackRock Allocation Portfolio | | $ | 78,365,640 | | | $ | 5,297,027 | | | $ | (785,813 | ) | | $ | 4,511,214 | |
| Global Atlantic BlackRock Disciplined Core Portfolio | | | 521,503,742 | | | | 60,787,431 | | | | (11,781,250 | ) | | | 49,006,181 | |
| Global Atlantic BlackRock Disciplined Growth Portfolio | | | 15,120,719 | | | | 2,493,303 | | | | (258,765 | ) | | | 2,234,538 | |
| Global Atlantic BlackRock Disciplined International Core Portfolio | | | 145,418,098 | | | | 10,158,453 | | | | (10,979,666 | ) | | | (821,213 | ) |
| Global Atlantic BlackRock Disciplined Mid Cap Growth Portfolio | | | 167,580,815 | | | | 29,173,321 | | | | (2,568,651 | ) | | | 26,604,670 | |
| Global Atlantic BlackRock Disciplined Small Cap Portfolio | | | 17,580,694 | | | | 2,509,633 | | | | (2,319,407 | ) | | | 190,226 | |
| Global Atlantic BlackRock Disciplined U.S. Core Portfolio | | | 22,517,867 | | | | 2,618,098 | | | | (483,138 | ) | | | 2,134,960 | |
| Global Atlantic BlackRock Disciplined Value Portfolio | | | 260,313,936 | | | | 20,964,317 | | | | (6,490,861 | ) | | | 14,473,456 | |
| Global Atlantic BlackRock High Yield Portfolio | | | 70,880,055 | | | | 1,671,370 | | | | (1,071,815 | ) | | | 599,555 | |
| Global Atlantic Goldman Sachs Core Fixed Income Portfolio | | | 105,359,059 | | | | 5,050,028 | | | | (1,856,005 | ) | | | 3,194,023 | |
| Global Atlantic Goldman Sachs Global Equity Insights Portfolio | | | 27,715,574 | | | | 2,223,912 | | | | (926,658 | ) | | | 1,297,254 | |
| Global Atlantic Goldman Sachs Large Cap Growth Insights Portfolio | | | 78,989,961 | | | | 10,379,803 | | | | (945,425 | ) | | | 9,434,378 | |
| Global Atlantic Goldman Sachs Mid Cap Value Insights Portfolio | | | 127,412,087 | | | | 6,964,062 | | | | (4,357,991 | ) | | | 2,606,071 | |
| 7. | DISTRIBUTIONS TO SHAREHOLDERS AND TAX COMPONENTS OF CAPITAL |
The tax character of fund distributions paid for the period ended December 31, 2018 was as follows:
| For fiscal year ended | | Ordinary | | | Long-Term | | | Return of | | | | |
| 12/31/2018 | | Income | | | Capital Gains | | | Capital | | | Total | |
| Global Atlantic BlackRock Allocation Portfolio | | $ | 361,277 | | | $ | — | | | $ | — | | | $ | 361,277 | |
| Global Atlantic BlackRock Disciplined Core Portfolio | | | 7,952,766 | | | | 308,649 | | | | — | | | | 8,261,415 | |
| Global Atlantic BlackRock Disciplined Growth Portfolio | | | 263,078 | | | | 20,035 | | | | — | | | | 283,113 | |
| Global Atlantic BlackRock Disciplined International Core Portfolio | | | 3,135,099 | | | | — | | | | — | | | | 3,135,099 | |
| Global Atlantic BlackRock Disciplined Mid Cap Growth Portfolio | | | 2,025,737 | | | | 99,342 | | | | — | | | | 2,125,079 | |
| Global Atlantic BlackRock Disciplined Small Cap Portfolio | | | 93,096 | | | | 11,425 | | | | — | | | | 104,521 | |
| Global Atlantic BlackRock Disciplined U.S. Core Portfolio | | | 498,157 | | | | 22,695 | | | | — | | | | 520,852 | |
| Global Atlantic BlackRock Disciplined Value Portfolio | | | 5,978,801 | | | | 294,412 | | | | — | | | | 6,273,213 | |
| Global Atlantic BlackRock High Yield Portfolio | | | 476,776 | | | | 6,251 | | | | — | | | | 483,027 | |
| Global Atlantic Goldman Sachs Core Fixed Income Portfolio | | | 47,084 | | | | — | | | | — | | | | 47,084 | |
| Global Atlantic Goldman Sachs Global Equity Insights Portfolio | | | 362,130 | | | | 44,780 | | | | — | | | | 406,910 | |
| Global Atlantic Goldman Sachs Large Cap Growth Insights Portfolio | | | 1,222,604 | | | | 2,517 | | | | — | | | | 1,225,121 | |
| Global Atlantic Goldman Sachs Mid Cap Value Insights Portfolio | | | 1,136,829 | | | | 21,023 | | | | — | | | | 1,157,852 | |
There were no fund distributions for the period ended December 31, 2017.
Global Atlantic Portfolios
NOTES TO FINANCIAL STATEMENTS (Continued)
June 30, 2019 (Unaudited)
As of December 31, 2018, the components of accumulated earnings/(deficit) on a tax basis were as follows:
| | | Undistributed | | | Undistributed | | | Post October Loss | | | Capital Loss | | | Other | | | Unrealized | | | Total | |
| | | Ordinary | | | Long-Term | | | and | | | Carry | | | Book/Tax | | | Appreciation/ | | | Accumulated | |
| | | Income | | | Capital Gains | | | Late Year Loss | | | Forwards | | | Differences | | | (Depreciation) | | | Earnings/(Deficits) | |
| Global Atlantic BlackRock Allocation Portfolio | | $ | 1,578,456 | | | $ | — | | | $ | — | | | $ | (76,913 | ) | | $ | — | | | $ | (4,663,470 | ) | | $ | (3,161,927 | ) |
| Global Atlantic BlackRock Disciplined Core Portfolio | | | 2,642,419 | | | | — | | | | — | | | | (1,288,484 | ) | | | — | | | | (26,265,591 | ) | | | (24,911,656 | ) |
| Global Atlantic BlackRock Disciplined Growth Portfolio | | | 536,061 | | | | 29,267 | | | | — | | | | — | | | | — | | | | (420,917 | ) | | | 144,411 | |
| Global Atlantic BlackRock Disciplined International Core Portfolio | | | 511,658 | | | | — | | | | — | | | | (5,778,538 | ) | | | — | | | | (20,588,571 | ) | | | (25,855,451 | ) |
| Global Atlantic BlackRock Disciplined Mid Cap Growth Portfolio | | | 402,171 | | | | 385,576 | | | | — | | | | — | | | | — | | | | (6,803,583 | ) | | | (6,015,836 | ) |
| Global Atlantic BlackRock Disciplined Small Cap Portfolio | | | 529,490 | | | | — | | | | — | | | | — | | | | — | | | | (2,229,142 | ) | | | (1,699,652 | ) |
| Global Atlantic BlackRock Disciplined U.S. Core Portfolio | | | 313,052 | | | | — | | | | — | | | | — | | | | — | | | | (1,144,151 | ) | | | (831,099 | ) |
| Global Atlantic BlackRock Disciplined Value Portfolio | | | 1,876,308 | | | | — | | | | — | | | | (1,157,196 | ) | | | — | | | | (17,930,742 | ) | | | (17,211,630 | ) |
| Global Atlantic BlackRock High Yield Portfolio | | | 4,219,221 | | | | — | | | | — | | | | (1,759,683 | ) | | | — | | | | (6,365,829 | ) | | | (3,906,291 | ) |
| Global Atlantic Goldman Sachs Core Fixed Income Portfolio | | | 2,191,473 | | | | — | | | | — | | | | (953,311 | ) | | | — | | | | (578,594 | ) | | | 659,568 | |
| Global Atlantic Goldman Sachs Global Equity Insights Portfolio | | | 42,788 | | | | — | | | | — | | | | (475,952 | ) | | | — | | | | (2,797,265 | ) | | | (3,230,429 | ) |
| Global Atlantic Goldman Sachs Large Cap Growth Insights Portfolio | | | 1,615,049 | | | | 30,615 | | | | — | | | | — | | | | — | | | | (3,864,089 | ) | | | (2,218,425 | ) |
| Global Atlantic Goldman Sachs Mid Cap Value Insights Portfolio | | | 1,780,229 | | | | — | | | | — | | | | — | | | | — | | | | (15,865,326 | ) | | | (14,085,097 | ) |
The difference between book basis and tax basis unrealized appreciation (depreciation), undistributed ordinary income (loss) and accumulated net realized gain (loss) from investments is primarily attributable to the tax deferral of losses on wash sales, return of capital distributions from C-Corporations and the mark-to-market on passive foreign investment companies, open 1256 options and futures contracts, forward foreign currency contracts and swaps. The unrealized appreciation (depreciation) in the table above includes unrealized foreign currency gains (losses) of ($626), ($2,729), ($742), and ($348) for Global Atlantic BlackRock Disciplined Core Portfolio, Global Atlantic BlackRock Disciplined International Core Portfolio, Global Atlantic Goldman Sachs Core Fixed Income Portfolio, and Global Atlantic Goldman Sachs Global Equity Insights Portfolio, respectively.
At December 31, 2018, the Portfolios had capital loss carry forwards for federal income tax purposes available to offset future capital gains as follows:
| | | Non-Expiring | | | Non-Expiring | | | | |
| | | Short-Term | | | Long-Term | | | Total | |
| Global Atlantic BlackRock Allocation Portfolio | | $ | 57,097 | | | $ | 19,816 | | | $ | 76,913 | |
| Global Atlantic BlackRock Disciplined Core Portfolio | | | 1,288,484 | | | | — | | | | 1,288,484 | |
| Global Atlantic BlackRock Disciplined Growth Portfolio | | | — | | | | — | | | | — | |
| Global Atlantic BlackRock Disciplined International Core Portfolio | | | 5,124,632 | | | | 653,906 | | | | 5,778,538 | |
| Global Atlantic BlackRock Disciplined Mid Cap Growth Portfolio | | | — | | | | — | | | | — | |
| Global Atlantic BlackRock Disciplined Small Cap Portfolio | | | — | | | | — | | | | — | |
| Global Atlantic BlackRock Disciplined U.S. Core Portfolio | | | — | | | | — | | | | — | |
| Global Atlantic BlackRock Disciplined Value Portfolio | | | 1,087,455 | | | | 69,741 | | | | 1,157,196 | |
| Global Atlantic BlackRock High Yield Portfolio | | | 1,628,868 | | | | 130,815 | | | | 1,759,683 | |
| Global Atlantic Goldman Sachs Core Fixed Income Portfolio | | | 796,660 | | | | 156,651 | | | | 953,311 | |
| Global Atlantic Goldman Sachs Global Equity Insights Portfolio | | | 435,227 | | | | 40,725 | | | | 475,952 | |
| Global Atlantic Goldman Sachs Large Cap Growth Insights Portfolio | | | — | | | | — | | | | — | |
| Global Atlantic Goldman Sachs Mid Cap Value Insights Portfolio | | | — | | | | — | | | | — | |
Global Atlantic Portfolios
NOTES TO FINANCIAL STATEMENTS (Continued)
June 30, 2019 (Unaudited)
| 8. | NEW ACCOUNTING PRONOUNCEMENTS |
In August 2018, the FASB issued Accounting Standards Update (“ASU”) No. 2018-13, which changes certain fair value measurement disclosure requirements. The new ASU, in addition to other modifications and additions, removes the requirement to disclose the amount and reasons for transfers between Level 1 and Level 2 of the fair value hierarchy, and the policy for the timing of transfers between levels. For investment companies, the amendments are effective for financial statements issued for fiscal years beginning after December 15, 2019, and interim periods within those fiscal years. Early adoption is allowed. These amendments have been adopted effective with these financial statements.
In March 2017, the Financial Accounting Standards Board (FASB) issued Accounting Standards Update (ASU) No. 2017-08, Receivables—Nonrefundable Fees and Other Costs (Subtopic 310-20): Premium Amortization on Purchased Callable Debt Securities. The amendments in the ASU shorten the amortization period for certain callable debt securities, held at a premium, by requiring amortization to the earliest call date. The ASU does not require an accounting change for securities held at a discount, which continues to be amortized to maturity. The ASU is effective for fiscal years and interim periods within those fiscal years beginning after December 15, 2018. Management is currently evaluating the impact, if any, of applying this provision.
Subsequent events after the date of the Statements of Assets and Liabilities have been evaluated through the date the financial statements were issued. Management has determined that no events or transactions occurred requiring adjustment or disclosure in the financial statements.
Global Atlantic Portfolios
EXPENSE EXAMPLES
June 30, 2019 (Unaudited)
As a shareholder of the Portfolios, you incur ongoing costs, including management fees; distribution and/or service (12b-1) fees; and other Portfolio expenses. This example is intended to help you understand your ongoing costs (in dollars) of investing in each Portfolio and to compare these costs with the ongoing costs of investing in other mutual funds.
The example is based on an investment of $1,000 invested at the beginning of the period and held for the entire period from January 1, 2019 through June 30, 2019.
Actual Expenses
The “Actual” expenses set of columns in the table below provides information about actual account values and actual expenses. You may use the information below together with the amount you invested, to estimate the expenses that you paid over the period. Simply divide your account value by $1,000 (for example, an $8,600 account value divided by $1,000 = 8.6), then multiply the result by the number in the table under the heading entitled “Expenses Paid During Period” to estimate the expenses you paid on your account during this period.
Hypothetical Example for Comparison Purposes
The “Hypothetical” expenses set of columns in the table below provides information about hypothetical account values and hypothetical expenses based on each Portfolio’s actual expense ratio and an assumed rate of return of 5% per year before expenses, which is not the Portfolio’s actual return. The hypothetical account values and expenses may not be used to estimate the actual ending account balances or expenses you paid for the period. You may use this information to compare this 5% hypothetical example for a specific Portfolio with the 5% hypothetical examples that appear in the shareholder reports of other funds.
Please note that the expenses shown in the table are meant to highlight your ongoing costs only and do not reflect any transactional costs, such as sales charges (loads), or redemption fees or other expenses charged by your insurance contract or separate account. Therefore, the Hypothetical columns of the table are useful in comparing ongoing costs only, and will not help you determine the relative total costs of owning different funds. In addition, if these transactional costs were included, your costs would have been higher.
| | | | | | | | | | | Hypothetical |
| | | | | | | | | | | (5% return before |
| | | | | | | Actual | | expenses) |
| | | | | | | Ending | | Expenses | | Ending | | Expenses |
| | | Portfolio’s | | Beginning | | Account | | Paid | | Account | | Paid |
| | | Annualized | | Account Value | | Value | | During | | Value | | During |
| Class I Shares | | Expense Ratio | | 1-1-19 | | 6-30-19 | | Period* | | 6-30-19 | | Period* |
| Global Atlantic BlackRock Allocation Portfolio | | 0.31% | | $1,000.00 | | $1,132.00 | | $1.64 | | $1,023.26 | | $1.56 |
| Global Atlantic BlackRock Disciplined Core Portfolio | | 0.48% | | $1,000.00 | | $1,182.80 | | $2.60 | | $1,022.41 | | $2.41 |
| Global Atlantic BlackRock Disciplined International Core Portfolio | | 0.69% | | $1,000.00 | | $1,140.00 | | $3.66 | | $1,021.37 | | $3.46 |
| Global Atlantic BlackRock Disciplined Mid Cap Growth Portfolio | | 0.63% | | $1,000.00 | | $1,255.30 | | $3.52 | | $1,021.67 | | $3.16 |
| Global Atlantic BlackRock Disciplined Small Cap Portfolio | | 0.63% | | $1,000.00 | | $1,185.00 | | $3.41 | | $1,021.67 | | $3.16 |
| * | Expenses are equal to the Portfolio’s annualized expense ratio, multiplied by the number of days in the period (181) divided by the number of days in the fiscal year (365). |
Global Atlantic Portfolios
EXPENSE EXAMPLES (Continued)
June 30, 2019 (Unaudited)
| | | | | | | | | | | Hypothetical |
| | | | | | | | | | | (5% return before |
| | | | | | | Actual | | expenses) |
| | | | | Beginning | | Ending | | Expenses | | Ending | | Expenses |
| | | Portfolio’s | | Account | | Account | | Paid | | Account | | Paid |
| | | Annualized | | Value | | Value | | During | | Value | | During |
| Class I Shares | | Expense Ratio | | 1-1-19 | | 6-30-19 | | Period* | | 6-30-19 | | Period* |
| Global Atlantic BlackRock Disciplined U.S. Core Portfolio | | 0.48% | | $1,000.00 | | $1,183.20 | | $2.60 | | $1,022.41 | | $2.41 |
| Global Atlantic BlackRock Disciplined Value Portfolio | | 0.54% | | $1,000.00 | | $1,164.00 | | $2.90 | | $1,022.12 | | $2.71 |
| Global Atlantic BlackRock High Yield Portfolio | | 0.59% | | $1,000.00 | | $1,106.00 | | $3.08 | | $1,021.87 | | $2.96 |
| Global Atlantic Goldman Sachs Core Fixed Income Portfolio | | 0.43% | | $1,000.00 | | $1,068.50 | | $2.21 | | $1,022.66 | | $2.16 |
| Global Atlantic Goldman Sachs Global Equity Insights Portfolio | | 0.72% | | $1,000.00 | | $1,141.60 | | $3.82 | | $1,021.22 | | $3.61 |
| Global Atlantic Goldman Sachs Large Cap Growth Insights Portfolio | | 0.46% | | $1,000.00 | | $1,193.60 | | $2.50 | | $1,022.51 | | $2.31 |
| Global Atlantic Goldman Sachs Mid Cap Value Insights Portfolio | | 0.64% | | $1,000.00 | | $1,135.50 | | $3.39 | | $1,021.62 | | $3.21 |
| | | | | | | | | | | | | |
| | | | | Beginning | | Ending | | Expenses | | Ending | | Expenses |
| | | Portfolio’s | | Account | | Account | | Paid | | Account | | Paid |
| | | Annualized | | Value | | Value | | During | | Value | | During |
| Class II Shares | | Expense Ratio | | 1-1-19 | | 6-30-19 | | Period* | | 6-30-19 | | Period* |
| Global Atlantic BlackRock Allocation Portfolio | | 0.56% | | $1,000.00 | | $1,131.10 | | $2.96 | | $1,022.02 | | $2.81 |
| Global Atlantic BlackRock Disciplined Core Portfolio | | 0.73% | | $1,000.00 | | $1,182.10 | | $3.95 | | $1,021.17 | | $3.66 |
| Global Atlantic BlackRock Disciplined Growth Portfolio | | 0.79% | | $1,000.00 | | $1,210.20 | | $4.33 | | $1,020.88 | | $3.96 |
| Global Atlantic BlackRock Disciplined International Core Portfolio | | 0.94% | | $1,000.00 | | $1,139.00 | | $4.99 | | $1,020.13 | | $4.71 |
| Global Atlantic BlackRock Disciplined Mid Cap Growth Portfolio | | 0.88% | | $1,000.00 | | $1,254.50 | | $4.92 | | $1,020.43 | | $4.41 |
| Global Atlantic BlackRock Disciplined Small Cap Portfolio | | 0.88% | | $1,000.00 | | $1,184.10 | | $4.77 | | $1,020.43 | | $4.41 |
| Global Atlantic BlackRock Disciplined U.S. Core Portfolio | | 0.73% | | $1,000.00 | | $1,181.30 | | $3.95 | | $1,021.17 | | $3.66 |
| Global Atlantic BlackRock Disciplined Value Portfolio | | 0.79% | | $1,000.00 | | $1,161.70 | | $4.23 | | $1,020.88 | | $3.96 |
| Global Atlantic BlackRock High Yield Portfolio | | 0.84% | | $1,000.00 | | $1,104.10 | | $4.38 | | $1,020.63 | | $4.21 |
| Global Atlantic Goldman Sachs Core Fixed Income Portfolio | | 0.68% | | $1,000.00 | | $1,068.50 | | $3.49 | | $1,021.42 | | $3.41 |
| Global Atlantic Goldman Sachs Global Equity Insights Portfolio | | 0.97% | | $1,000.00 | | $1,140.80 | | $5.15 | | $1,019.98 | | $4.86 |
| Global Atlantic Goldman Sachs Large Cap Growth Insights Portfolio | | 0.71% | | $1,000.00 | | $1,192.00 | | $3.86 | | $1,021.27 | | $3.56 |
| Global Atlantic Goldman Sachs Mid Cap Value Insights Portfolio | | 0.89% | | $1,000.00 | | $1,132.30 | | $4.71 | | $1,020.38 | | $4.46 |
| * | Expenses are equal to the Portfolio’s annualized expense ratio, multiplied by the number of days in the period (181) divided by the number of days in the fiscal year (365). |
PRIVACY NOTICE
| FACTS | WHAT DOES FORETHOUGHT VARIABLE INSURANCE TRUST DO WITH YOUR PERSONAL INFORMATION? |
| Why? | Financial companies choose how they share your personal information. Federal law gives consumers the right to limit some, but not all sharing. Federal law also requires us to tell you how we collect, share, and protect your personal information. Please read this notice carefully to understand what we do. |
| What? | The types of personal information we collect and share depends on the product or service that you have with us. This information can include: ● Social Security number and wire transfer instructions ● account transactions and transaction history ● investment experience and purchase history When you areno longerour customer, we continue to share your information as described in this notice. |
| How? | All financial companies need to share customers’ personal information to run their everyday business. In the section below, we list the reasons financial companies can share their customers’ personal information; the reasons Forethought Variable Insurance Trust chooses to share; and whether you can limit this sharing. |
Reasons we can share
your personal
information: | Does Forethought
Variable Insurance Trust
share information? | Can you limit this
sharing? |
| For our everyday business purposes -such as to process your transactions, maintain your account(s), respond to court orders and legal investigations, or report to credit bureaus. | YES | NO |
| For our marketing purposes -to offer our products and services to you. | NO | We don’t share |
| For joint marketing with other financial companies. | NO | We don’t share |
| For our affiliates’ everyday business purposes -information about your transactions and records. | NO | We don’t share |
| For our affiliates’ everyday business purposes -information about your credit worthiness. | NO | We don’t share |
| For nonaffiliates to market to you | NO | We don’t share |
| QUESTIONS? | Call 1-402-493-4603 |
| What we do: |
How does Forethought Variable Insurance Trust protect my personal information? | To protect your personal information from unauthorized access and use, we use security measures that comply with federal law. These measures include computer safeguards and secured files and buildings. Our service providers are held accountable for adhering to strict policies and procedures to prevent any misuse of your nonpublic personal information. |
How does Forethought Variable Insurance Trust collect my personal information? | We collect your personal information, for example, when you ● open an account or deposit money ● direct us to buy securities or direct us to sell your securities ● seek advice about your investments We also collect your personal information from others, such as credit bureaus, affiliates, or other companies. |
Why can’t I limit all sharing? | Federal law gives you the right to limit only: ● sharing for affiliates’ everyday business purposes – information about your creditworthiness. ● affiliates from using your information to market to you. ● sharing for nonaffiliates to market to you. State laws and individual companies may give you additional rights to limit sharing. |
| Definitions |
| Affiliates | Companies related by common ownership or control. They can be financial and nonfinancial companies. ● Forethought Variable Insurance Trust has no affiliates. |
| Nonaffiliates | Companies not related by common ownership or control. They can be financial and nonfinancial companies. ● Forethought Variable Insurance Trust does not share with nonaffiliates so they can market to you. |
| Joint marketing | A formal agreement between nonaffiliated financial companies that together market financial products or services to you. ● Forethought Variable Insurance Trust does not jointly market. |
PROXY VOTING POLICY
Information regarding how the Portfolios voted proxies relating to portfolio securities for the most recent twelve month period ended June 30 (disclosed on Form N-PX) as well as information regarding the policies and procedures that the Portfolios use to determine how to vote proxies (disclosed in the Portfolios’ Statement of Additional Information) is available without charge, upon request, by calling 1-877-881-7735 or by referring to the Securities and Exchange Commission’s (“SEC”) website at http://www.sec.gov.
PORTFOLIO HOLDINGS
Each Portfolio files its complete schedule of portfolio holdings with the SEC for the first and third quarters of each fiscal year on Form N-PORT. The Portfolios’ Form N-PORT is available: (i) on the SEC’s website at http://www.sec.gov; and (ii) may be reviewed and copied at the SEC’s Public Reference Room in Washington, DC. Information on the operation of the Public Reference Room may be obtained by calling 1-800-SEC-0330. Each Portfolio will be post to http://regdocs.blugiant.com/globalatlanticportfolios, a complete list of its portfolio holdings as of the last calendar day of each month approximately 30 days following the end of the month. Each Portfolio’s portfolio holdings will remain available on the website noted above at least until the next monthly update.
| | |
| INVESTMENT ADVISER | ADMINISTRATOR |
| Global Atlantic Investment Advisors, LLC | Gemini Fund Services, LLC |
| 10 West Market Street, Suite 2300 | 80 Arkay Drive, Suite 110 |
| Indianapolis, IN 46204 | Hauppauge, NY 11788 |
| | |
| INVESTMENT SUB-ADVISERS |
| BlackRock Investment Management, LLC | Goldman Sachs Asset Management, L.P. |
| 1 University Square | 200 West Street |
| Princeton, NJ 08536 | New York, NY 10282 |
Item 2. Code of Ethics.Not Applicable
Item 3. Audit Committee Financial Expert.Not Applicable
Item 4. Principal Accountant Fees and Services.Not Applicable
Item 5. Audit Committee of Listed Companies.Not applicable to open-end investment companies.
Item 6. Schedule of Investments.(a) Schedule of investments in securities of unaffiliated issuers is included under Item 1; (b) Not applicable.
Item 7. Disclosure of Proxy Voting Policies and Procedures for Closed-End Funds. Not applicable to open-end investment companies.
Item 8. Portfolio Managers of Closed-End Management Investment Companies. Not applicable to open-end investment companies.
Item 9. Purchases of Equity Securities by Closed-End Funds. Not applicable to open-end investment companies.
Item 10. Submission of Matters to a Vote of Security Holders. There were no material changes to the procedure by which shareholders recommend nominees to the registrant’s board of trustees since the date of the registrant’s prior report on Form N-CSR or, as applicable, in response to the requirements of Item 407(c)(2)(iv) of Regulation S-X (per item 22(b)(15) of Schedule 14A).
Item 11. Controls and Procedures.
(a) Based on an evaluation of the registrant’s disclosure controls and procedures as of a date within 90 days of filing date of this Form N-CSR, the principal executive officer and principal financial officer of the registrant have concluded that the disclosure controls and procedures of the registrant are reasonably designed to ensure that the information required in filings on Form N-CSR is recorded, processed, summarized, and reported by the filing date, including that information required to be disclosed is accumulated and communicated to the registrant’s management, including the registrant’s principal executive officer and principal financial officer, as appropriate to allow timely decisions regarding required disclosure.
(b) There were no changes in the registrant’s internal control over financial reporting that occurred during the last fiscal quarter that have materially affected, or are reasonably likely to materially affect, the registrant’s internal control over financial reporting.
Item 12. Disclosure of securities lending activities for closed-end management investment companies.Not applicable to open-end investment companies.
Item 13. Exhibits.
(a)(1) Not Applicable
(a)(2) Certifications required by Section 302 of the Sarbanes-Oxley Act of 2002 (and Item 12(a)(2) of Form N-CSR) are filed herewith.
(a)(3) Not applicable for open-end investment companies.
(a)(4) There was no change in the registrant’s independent public accountant for the period covered by this report.
SIGNATURES
Pursuant to the requirements of the Securities Exchange Act of 1934 and the Investment Company Act of 1940, the registrant has duly caused this report to be signed on its behalf by the undersigned, thereunto duly authorized.
(Registrant)Forethought Variable Insurance Trust
By (Signature and Title)
/s/ Robert M. Arena, Jr.
Robert M. Arena, Jr., President
Date8/19/19
Pursuant to the requirements of the Securities Exchange Act of 1934 and the Investment Company Act of 1940, this report has been signed below by the following persons on behalf of the registrant and in the capacities and on the dates indicated.
By (Signature and Title)
/s/ Robert M. Arena, Jr.
Robert M. Arena, Jr., President
Date8/19/19
By (Signature and Title)
/s/ Laura Szalyga
Laura Szalyga, Treasurer
Date8/19/19