Exhibit 99.2
|

Santander Consumer USA Holdings Inc.
1Q14 Investor Presentation
|
IMPORTANT INFORMATION
2 |
|
Forward Looking Statements
This presentation may contain forward looking statements. Any statements about our expectations, beliefs, plans, predictions, forecasts, objectives, assumptions, or future events or performance are not historical facts and may be forward looking. These statements are often, but not always, made through the use of words or phrases such as “anticipates,” “believes,” “can,” “could,” “may,” “predicts,” “potential,” “should,” “will,” “estimate,” “plans,” “projects,” “continuing,” “ongoing,” “expects,” “intends,” and similar words or phrases. Accordingly, these statements are only predictions and involve estimates, known and unknown risks, assumptions, and uncertainties that could cause actual results to differ materially from those expressed in them. SCUSA’s actual results could differ materially from those anticipated in such forward looking statements as a result of several factors more fully described under the caption “Risk Factors” and elsewhere in the annual report on Form 10 K filed by SCUSA with the Securities and Exchange Commission. Any or all of our forward looking statements in this presentation may turn out to be inaccurate. The inclusion of this forward looking information should not be regarded as a representation that the future plans, estimates, or expectations contemplated by SCUSA will be achieved. SCUSA has based these forward looking statements largely on SCUSA’s current expectations and projections about future events and financial trends that SCUSA believes may affect SCUSA’s financial condition, results of operations, business strategy, and financial needs. There are important factors that could cause SCUSA’s actual results,level of activity, performance, orachievements to differ materially from the results, level of activity, performance, or achievements expressed or implied by the forward looking statements, including, but not limited to, the following: (1) adverse economic conditions in the United States and worldwide may negatively impact SCUSA’s results; (2) SCUSA’s business could suffer if its access to funding is reduced; (3) SCUSA faces significant risks implementing its growth strategy, some of which are outside SCUSA’s control; (4) SCUSA’s agreement with Chrysler Group LLC may not result in currently anticipated levels of growth and is subject to certain performance conditions that could result in termination of the agreement; (5) SCUSA’s business could suffer if it is unsuccessful in developing and maintaining relationships with automobile dealerships; (6) SCUSA’s financial condition, liquidity, and results of operations depend on the credit performance of SCUSA’s loans; (7) loss of SCUSA’s key management or other personnel, or an inability to attract such management and personnel, could negatively impact SCUSA’s business; (8) future changes in SCUSA’s relationship with Banco Santander, S.A. could adversely affect SCUSA’s operations; and (9) SCUSA operates in a highly regulated industry and continually changing federal, state, and local laws and regulations could materially adversely affect SCUSA’s business.
|
AGENDA 3
Highlights
Strategy and Business
Appendix and Financial Supplement
|
SCUSA COMPANY OVERVIEW
4 |
|
Santander Consumer USA Holdings Inc. (NYSE: SC) (“SCUSA”) is approximately 60.5 percent owned by Santander
Holdings USA, Inc., a wholly owned subsidiary of Banco Santander, S.A. (NYSE: SAN)1
SCUSA is a full service, technology-driven consumer finance company focused on vehicle and unsecured consumer lending and third party servicing
SCUSA’s primary business is indirect origination of retail installment contracts principally through manufacturer- franchised dealers in connection with their sale of new and used vehicles
Historically focused on nonprime markets; established and growing presence in prime and lease
Leading non captive auto finance platform
Ten-year private label financing agreement with Chrysler Group LLC to offer a full spectrum of auto financing products and services to Chrysler customers and dealers under the Chrysler Capital brand
SCUSA also originates vehicles through a web based direct lending program (RoadLoans.com), purchases vehicle retail installment contracts from other lenders, and services automobile and recreational and marine vehicle portfolios for other lenders
In early 2013, SCUSA expanded into unsecured consumer lending and dealer lending platforms
Approximately 4,000 employees across multiple locations in the U.S.
SCUSA’s primary goal is to create stockholder value by leveraging our systems, data, liquidity and management
1 As of March 31, 2014
|
1Q14 HIGHLIGHTS 5
Robust Financial Performance
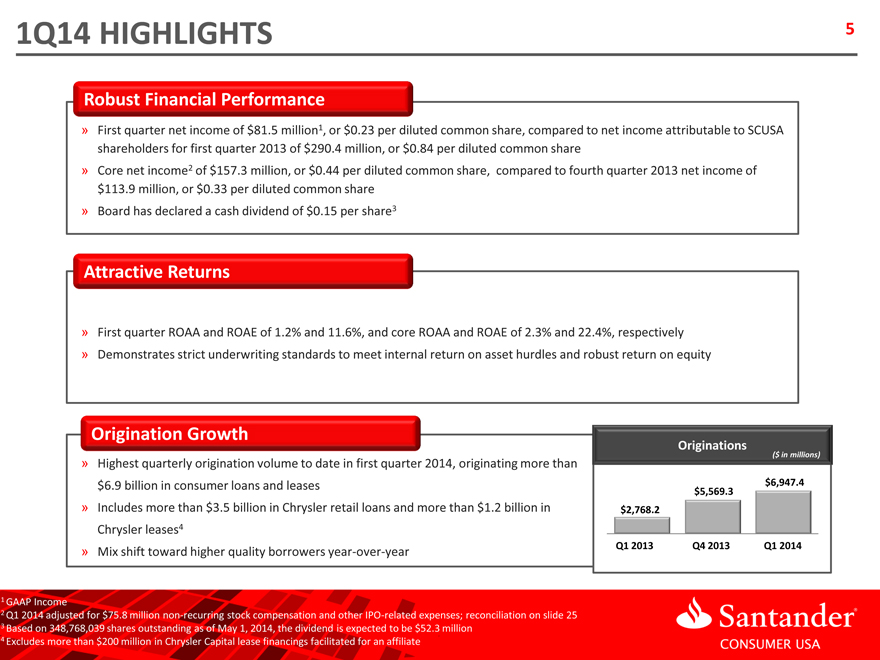
» First quarter net income of $81.5 million1, or $0.23 per diluted common share, compared to net income attributable to SCUSA
shareholders for first quarter 2013 of $290.4 million, or $0.84 per diluted common share
» Core net income2 of $157.3 million, or $0.44 per diluted common share, compared to fourth quarter 2013 net income of
$113.9 million, or $0.33 per diluted common share
» Board has declared a cash dividend of $0.15 per share3
Attractive Returns
» First quarter ROAA and ROAE of 1.2% and 11.6%, and core ROAA and ROAE of 2.3% and 22.4%, respectively
» Demonstrates strict underwriting standards to meet internal return on asset hurdles and robust return on equity
Origination Growth
» Highest quarterly origination volume to date in first quarter 2014, originating more than
$6.9 billion in consumer loans and leases
» Includes more than $3.5 billion in Chrysler retail loans and more than $1.2 billion in
Chrysler leases4
» Mix shift toward higher quality borrowers year-over-year
Originations
($ in millions)
$6,947.4 $5,569.3 $2,768.2
Q1 Q1 2013 2013 Q4 Q4 2013 2013 Q1 2014
1 GAAP Income
2 Q1 2014 adjusted for $75.8 million non-recurring stock compensation and other IPO-related expenses; reconciliation on slide 25 3 Based on 348,768,039 shares outstanding as of May 1, 2014, the dividend is expected to be $52.3 million 4 Excludes more than $200 million in Chrysler Capital lease financings facilitated for an affiliate
|
1Q14 PERFORMANCE
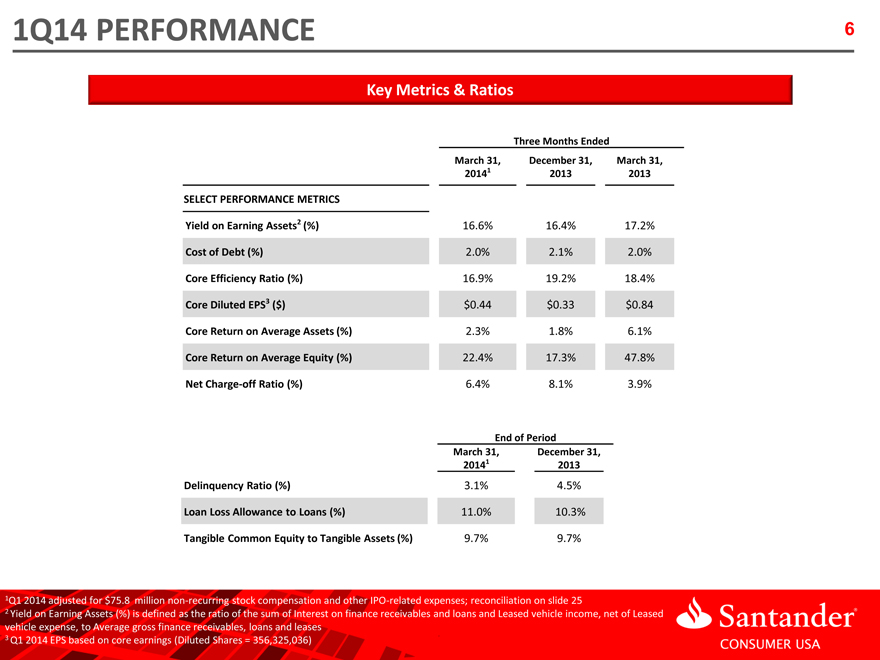
Key Metrics & Ratios
Three Months Ended
March 31, December 31, March 31,
20141 2013 2013
SELECT PERFORMANCE METRICS
Yield on Earning Assets2 (%) 16.6% 16.4% 17.2%
Cost of Debt (%) 2.0% 2.1% 2.0%
Core Efficiency Ratio (%) 16.9% 19.2% 18.4%
Core Diluted EPS3 ($) $0.44 $0.33 $0.84
Core Return on Average Assets (%) 2.3% 1.8% 6.1%
Core Return on Average Equity (%) 22.4% 17.3% 47.8%
Net Charge-off Ratio (%) 6.4% 8.1% 3.9%
End of Period
March 31, December 31,
20141 2013
Delinquency Ratio (%) 3.1% 4.5%
Loan Loss Allowance to Loans (%) 11.0% 10.3%
Tangible Common Equity to Tangible Assets (%) 9.7% 9.7%
1Q1 2014 adjusted for $75.8 million non-recurring stock compensation and other IPO-related expenses; reconciliation on slide 25
2 Yield on Earning Assets (%) is defined as the ratio of the sum of Interest on finance receivables and loans and Leased vehicle income, net of Leased vehicle expense, to Average gross finance receivables, loans and leases
3 Q1 2014 EPS based on core earnings (Diluted Shares = 356,325,036)
6
|
AGENDA 7
Highlights
Strategy and Business
Appendix and Financial Supplement
|
OUR BUSINESS 8
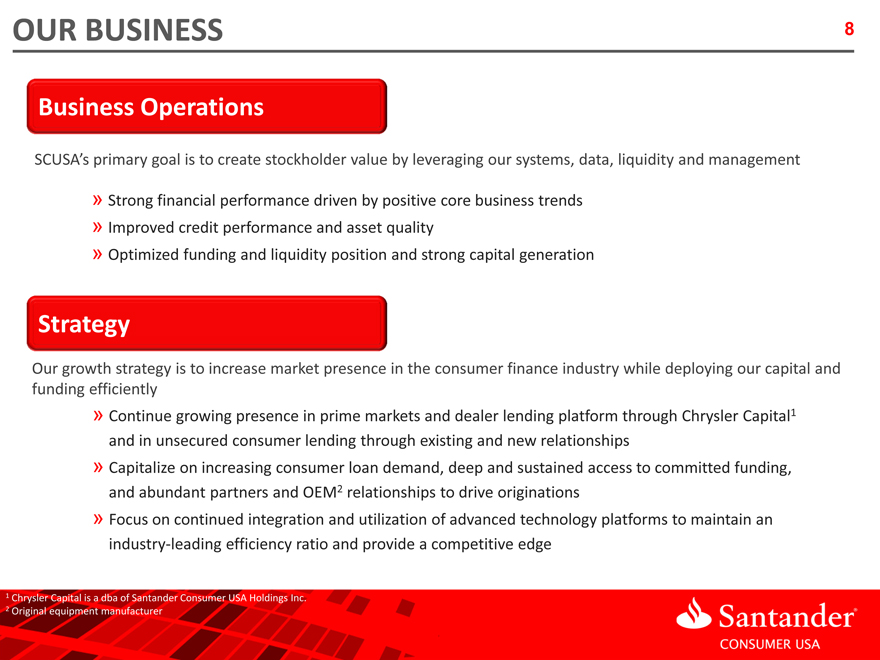
Business Operations
SCUSA’s primary goal is to create stockholder value by leveraging our systems, data, liquidity and management
» Strong financial performance driven by positive core business trends
» Improved credit performance and asset quality
» Optimized funding and liquidity position and strong capital generation
Strategy
Our growth strategy is to increase market presence in the consumer finance industry while deploying our capital and funding efficiently
» Continue growing presence in prime markets and dealer lending platform through Chrysler Capital1 and in unsecured consumer lending through existing and new relationships
» Capitalize on increasing consumer loan demand, deep and sustained access to committed funding, and abundant partners and OEM2 relationships to drive originations
» Focus on continued integration and utilization of advanced technology platforms to maintain an industry-leading efficiency ratio and provide a competitive edge
1 |
| Chrysler Capital is a dba of Santander Consumer USA Holdings Inc. |
2 |
| Original equipment manufacturer |
|
SCUSA TODAY
9
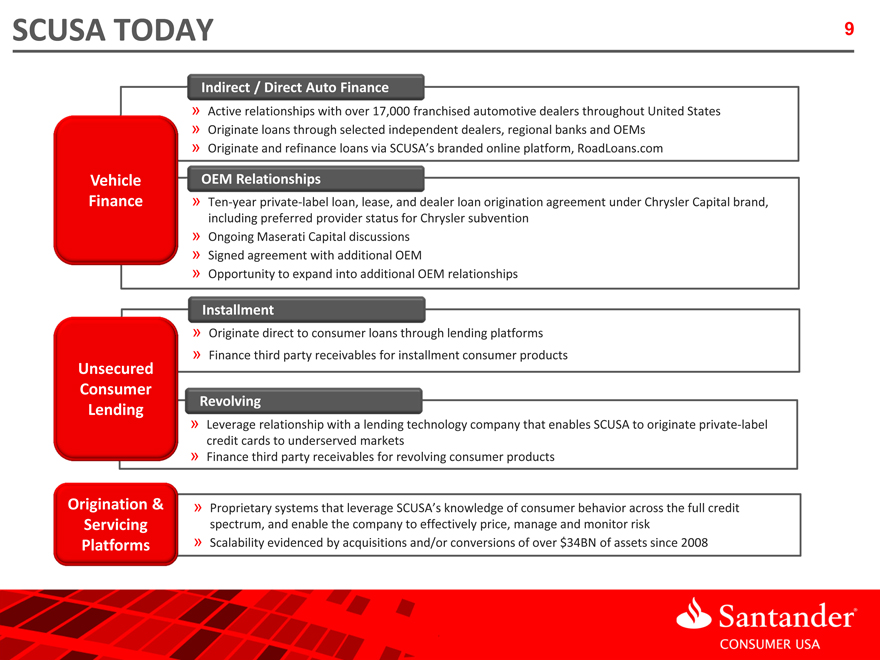
Indirect / Direct Auto Finance
Active relationships with over 17,000 franchised automotive dealers throughout United States
Originate loans through selected independent dealers, regional banks and OEMs
Originate and refinance loans via SCUSA’s branded online platform, RoadLoans.com
Vehicle OEM Relationships
Finance » Ten year private label loan, lease, and dealer loan origination agreement under Chrysler Capital brand,
including preferred provider status for Chrysler subvention
» Ongoing Maserati Capital discussions
» Signed agreement with additional OEM
» Opportunity to expand into additional OEM relationships
Installment
» Originate direct to consumer loans through lending platforms
» Finance third party receivables for installment consumer products
Unsecured
Consumer Revolving
Lending
» Leverage relationship with a lending technology company that enables SCUSA to originate private label credit cards to underserved markets
» Finance third party receivables for revolving consumer products
Origination & » Proprietary systems that leverage SCUSA’s knowledge of consumer behavior across the full credit Servicing spectrum, and enable the company to effectively price, manage and monitor risk Platforms » Scalability evidenced by acquisitions and/or conversions of over $34BN of assets since 2008
|
CHRYSLER CAPITAL 10
Chrysler Capital Overview
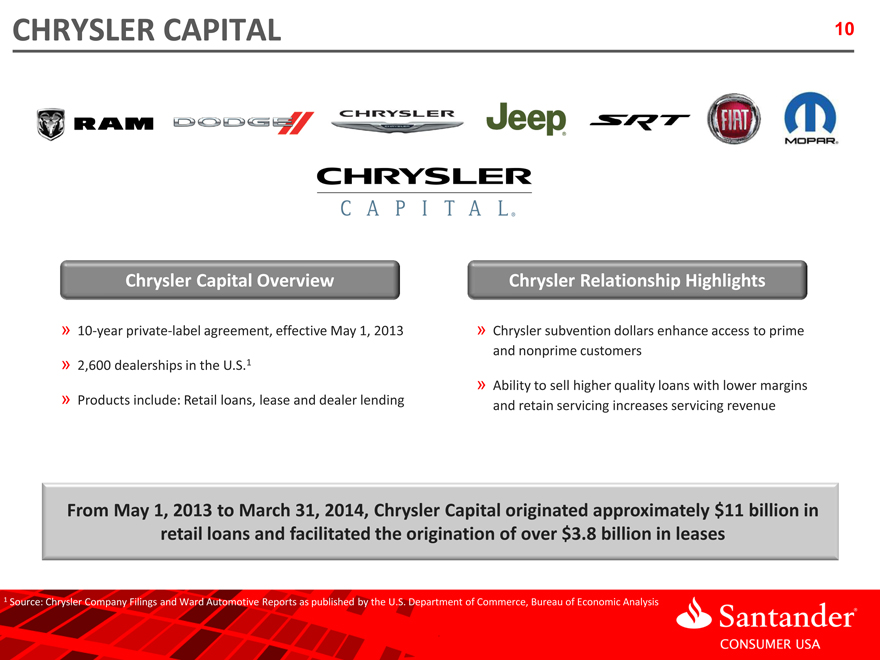
10-year private-label agreement, effective May 1, 2013
2,600 dealerships in the U.S.1
Products include: Retail loans, lease and dealer lending
Chrysler Relationship Highlights
Chrysler subvention dollars enhance access to prime and nonprime customers
Ability to sell higher quality loans with lower margins and retain servicing increases servicing revenue
From May 1, 2013 to March 31, 2014, Chrysler Capital originated approximately $11 billion in retail loans and facilitated the origination of over $3.8 billion in leases
1 Source: Chrysler Company Filings and Ward Automotive Reports as published by the U.S. Department of Commerce, Bureau of Economic Analysis
|
ORIGINATION TRENDS 11
Originations
(in thousands)
Total Serviced Portfolio 1
(in thousands)
Owned and Serviced
Serviced for Others
Three Months Ended
March 31, December 31, March 31, 2014 2013 2013
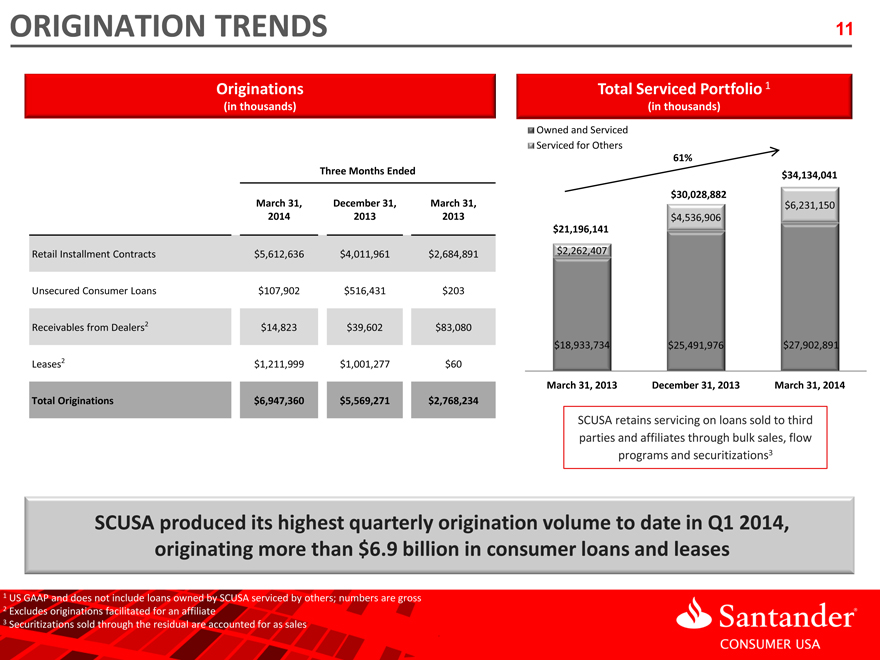
Retail Installment Contracts $5,612,636 $4,011,961 $2,684,891 Unsecured Consumer Loans $107,902 $516,431 $203 Receivables from Dealers2 $14,823 $39,602 $83,080 Leases2 $1,211,999 $1,001,277 $60
Total Originations $6,947,360 $5,569,271 $2,768,234
61% $34,134,041
$30,028,882 $6,231,150 $4,536,906 $21,196,141
$2,262,407
$18,933,734 $25,491,976 $27,902,891
March 31, 2013 December 31, 2013 March 31, 2014
SCUSA retains servicing on loans sold to third parties and affiliates through bulk sales, flow programs and securitizations3
SCUSA produced its highest quarterly origination volume to date in Q1 2014, originating more than $6.9 billion in consumer loans and leases
1 US GAAP and does not include loans owned by SCUSA serviced by others; numbers are gross
2 Excludes originations facilitated for an affiliate
3 Securitizations sold through the residual are accounted for as sales
|
NET INTEREST INCOME & OPERATING EXPENSES
Net Interest Income
($ in millions)
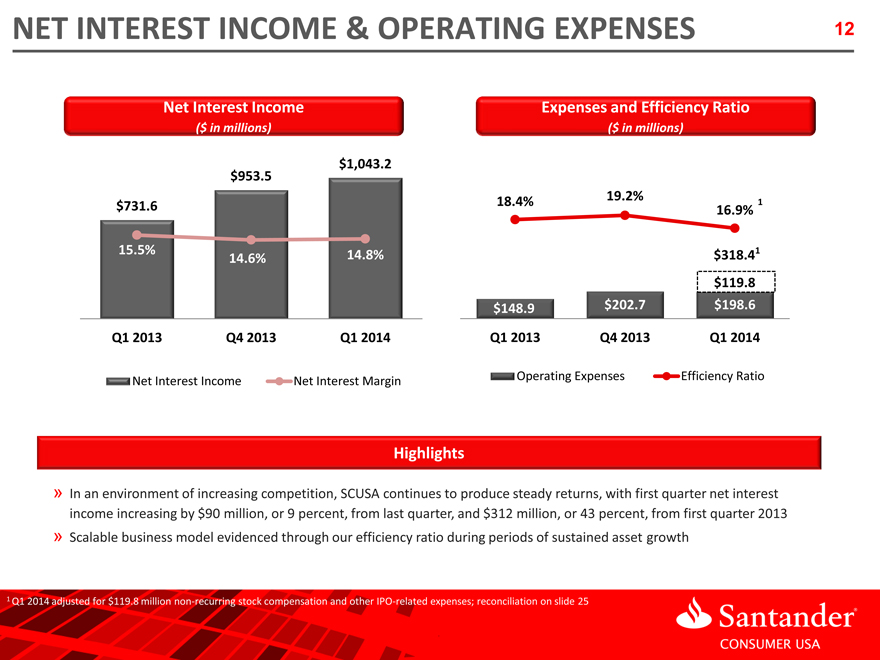
$1,043.2 $953.5
$731.6
15.5% 14.8% 14.6%
Q1 2013 Q4 2013 Q1 2014
Net Interest Income Net Interest Margin
Expenses and Efficiency Ratio
($ in millions)
19.2%
18.4% 1 16.9%
$318.4 1 $119.8 $148.9 $202.7 $198.6 Q1 2013 Q4 2013 Q1 2014
Operating Expenses Efficiency Ratio
Highlights
In an environment of increasing competition, SCUSA continues to produce steady returns, with first quarter net interest income increasing by $90 million, or 9 percent, from last quarter, and $312 million, or 43 percent, from first quarter 2013
Scalable business model evidenced through our efficiency ratio during periods of sustained asset growth
1 Q1 2014 adjusted for $119.8 million non-recurring stock compensation and other IPO-related expenses; reconciliation on slide 25
12
|
CREDIT 13
Delinquency Trends
Provision Expense and Net Charge-offs
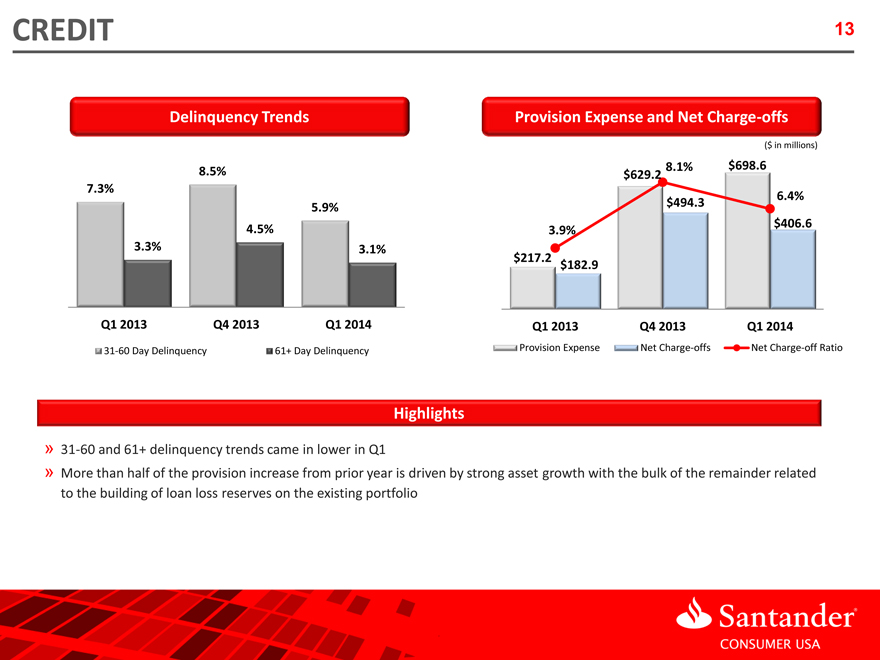
8.5% 73% .
5.9%
4.5%
3.3% 3.1%
Q1 2013 Q4 2013 Q1 2014
31-60 Day Delinquency 61+ Day Delinquency
($ in millions)
8.1% $698.6 $629.2
6.4% $494.3 $406.6
3.9%
$217.2 $182.9
Q1 2013 Q4 2013 Q1 2014
Provision Expense Net Charge-offs Net Charge-off Ratio
Highlights
31-60 and 61+ delinquency trends came in lower in Q1
More than half of the provision increase from prior year is driven by strong asset growth with the bulk of the remainder related to the building of loan loss reserves on the existing portfolio
|
CAPITAL
14
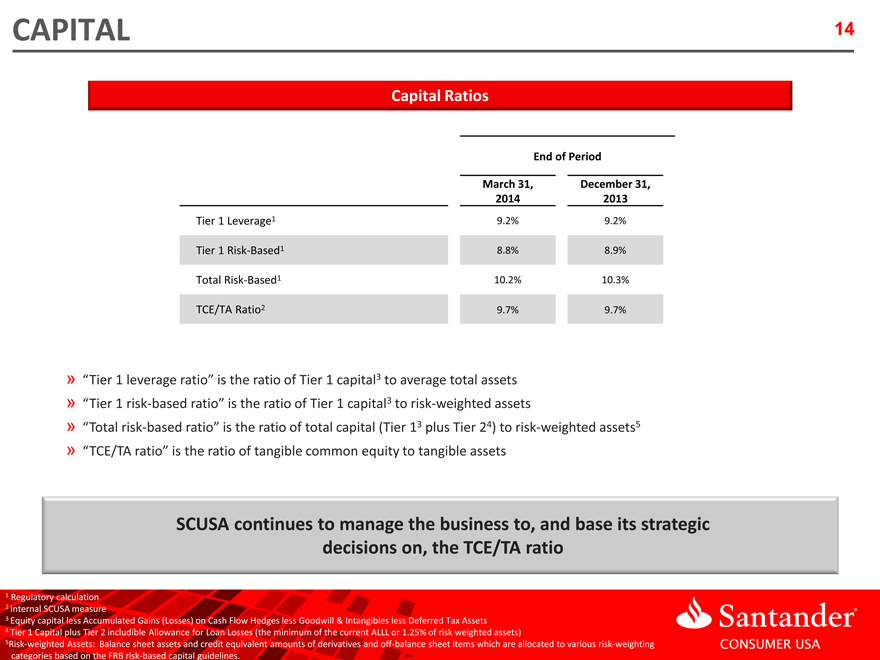
Capital Ratios
End of Period
March 31, December 31,
2014 2013
Tier 1 Leverage1 9.2% 9.2%
Tier 1 Risk-Based1 8.8% 8.9%
Total Risk-Based1 10.2% 10.3%
TCE/TA Ratio2 9.7% 9.7%
“Tier 1leverage ratio”is the ratio of Tier 1 capital3 to average total assets
“Tier1 risk-based ratio”is the ratio of Tier 1 capital3 to risk-weighted assets
“Totalrisk-based ratio”is the ratio of total capital (Tier 13 plus Tier 24) to risk-weighted assets5
“TCE/TA is the ratio” ratio of tangible common equity to tangible assets
SCUSA continues to manage the business to, and base its strategic decisions on, the TCE/TA ratio
1 Regulatory calculation 2 Internal SCUSA measure
3 Equity capital less Accumulated Gains (Losses) on Cash Flow Hedges less Goodwill & Intangibles less Deferred Tax Assets 4 Tier 1 Capital plus Tier 2 includible Allowance for Loan Losses (the minimum of the current ALLL or 1.25% of risk weighted assets)
5Risk-weighted Assets: Balance sheet assets and credit equivalent amounts of derivatives and off-balance sheet items which are allocated to various risk-weighting categories based on the FRB risk-based capital guidelines.
|
FUNDING AND LIQUIDITY 15
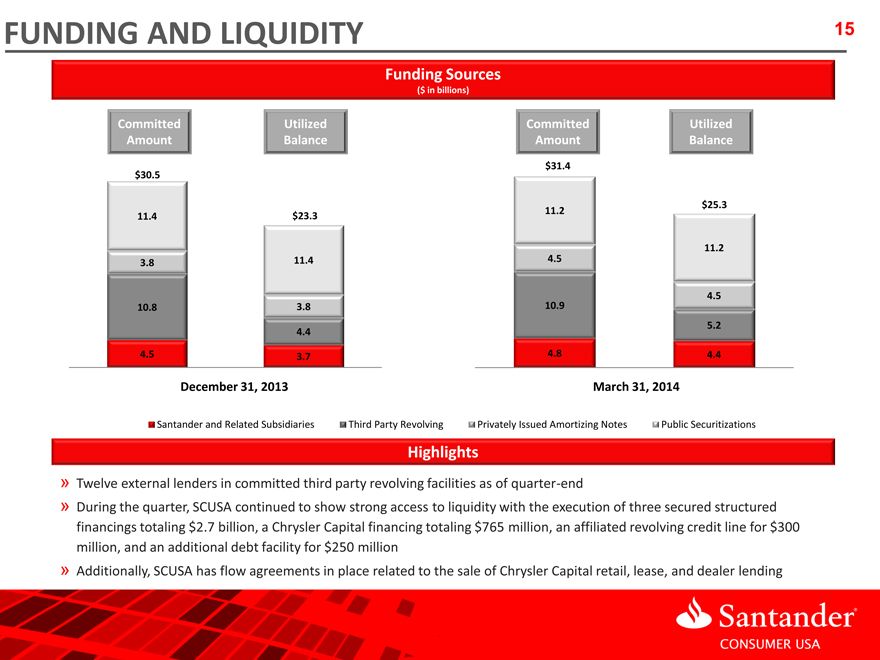
Funding Sources
($ in billions)
Committed Utilized Committed Utilized Amount Balance Amount Balance
$31.4 $30.5
$25.3 11.2 11.4 $23.3
11.2 11.4 4.5
3.8
4.5 10.8 3.8 10.9
5.2
4.4
4.5 3.7 4.8 4.4
December 31, 2013 March 31, 2014
Santander and Related Subsidiaries Third Party Revolving Privately Issued Amortizing Notes Public Securitizations
Highlights
Twelve external lenders in committed third party revolving facilities as of quarter-end
During the quarter, SCUSA continued to show strong access to liquidity with the execution of three secured structured financings totaling $2.7 billion, a Chrysler Capital financing totaling $765 million, an affiliated revolving credit line for $300 million, and an additional debt facility for $250 million
Additionally, SCUSA has flow agreements in place related to the sale of Chrysler Capital retail, lease, and dealer lending
|
AGENDA 16
Highlights
Strategy and Business
Appendix and Financial Supplement
|
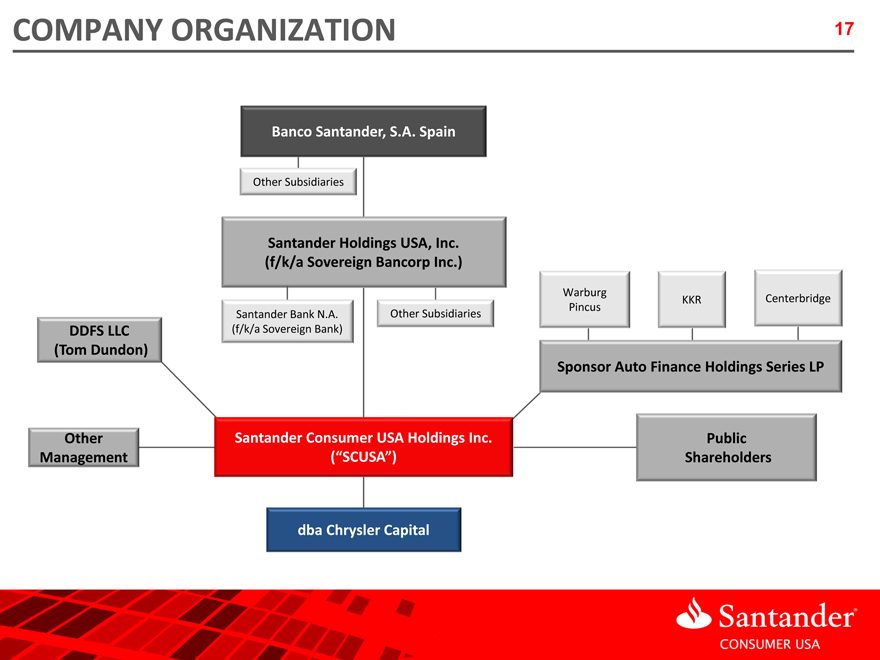
COMPANY ORGANIZATION
17
Banco Santander, S.A. Spain
Other Subsidiaries
Santander Holdings USA, Inc. (f/k/a Sovereign Bancorp Inc.)
Warburg
Pincus KKR Centerbridge Santander Bank N.A. Other Subsidiaries DDFS LLC (f/k/a Sovereign Bank)
(Tom Dundon)
Sponsor Auto Finance Holdings Series LP
Other Santander Consumer USA Holdings Inc. Public
Management (“SCUSA”) Shareholders
dba Chrysler Capital
|
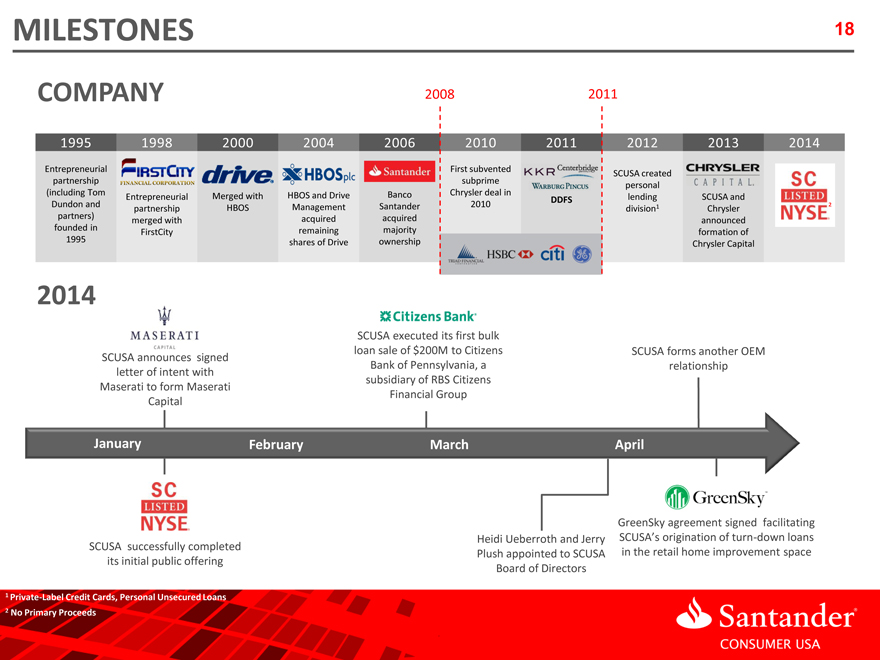
MILESTONES 18
COMPANY
2008 2011
1995 1998 2000 2004 2006 2010 2011 2012 2013 2014
Entrepreneurial First subvented partnership subprime SCUSA created (including Tom Chrysler deal in personal
Entrepreneurial Merged with HBOS and Drive Banco lending SCUSA and
DDFS
Dundon and HBOS Management Santander 2010 1 2 partners) partnership division Chrysler merged with acquired acquired announced founded in remaining majority 1995 FirstCity formation of shares of Drive ownership Chrysler Capital
2014
SCUSA announces signed letter of intent with Maserati to form Maserati Capital
SCUSA executed its first bulk loan sale of $200M to Citizens Bank of Pennsylvania, a subsidiary of RBS Citizens Financial Group
SCUSA forms another OEM relationship
January February March April
SCUSA successfully completed its initial public offering
GreenSky agreement signed facilitating Heidi Ueberroth and Jerry SCUSA’s origination of turn-down loans Plush appointed to SCUSA in the retail home improvement space Board of Directors
1 Private-Label Credit Cards, Personal Unsecured Loans
2 No Primary Proceeds
|
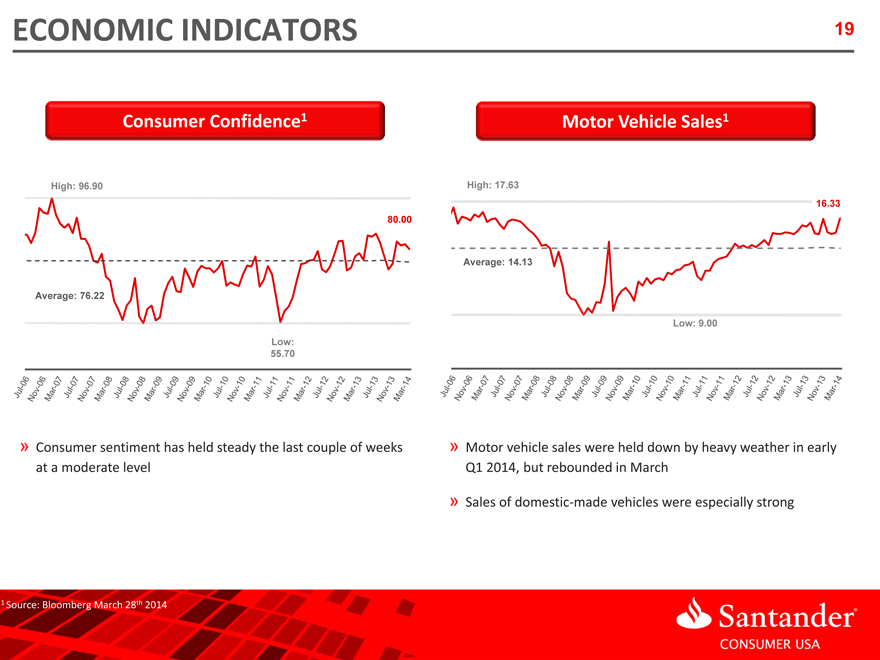
ECONOMIC INDICATORS 19
Consumer Confidence 1 Motor Vehicle Sales 1
High: 96.90 High: 17.63
16.33 80.00
Average: 14.13
Average: 76.22
Low: 9.00 Low: 55.70
» Consumer sentiment has held steady the last couple of weeks » Motor vehicle sales were held down by heavy weather in early
at a moderate level Q1 2014, but rebounded in March
» Sales of domestic made vehicles were especially strong
1 Source: Bloomberg March 28th 2014
|
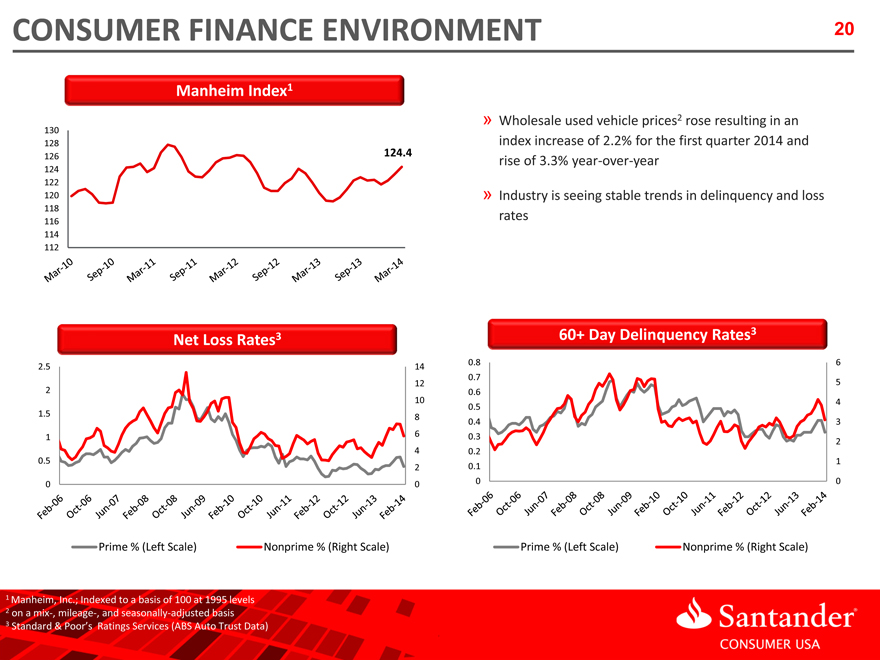
CONSUMER FINANCE ENVIRONMENT
20
Manheim Index 1
130 128
126 124.4
124 122 120 118 116 114 112
Wholesale used vehicle prices2 rose resulting in an index increase of 2.2% for the first quarter 2014 and rise of 3.3% year over year
Industry is seeing stable trends in delinquency and loss rates
60+ Day Delinquency Rates 3 Net Loss Rates 3
0.8 6 2.5 14 0.7
12 5
2 |
| 0.6 |
10 4 1.5 0.5 8 0.4 3
1 |
| 6 0.3 2 |
4 |
| 0.2 |
0.5 1
2 |
| 0.1 |
0 0 0 0
Prime % (Left Scale) Nonprime % (Right Scale) Prime % (Left Scale) Nonprime % (Right Scale)
1 Manheim, Inc.; Indexed to a basis of 100 at 1995 levels 2 on a mix , mileage , and seasonally adjusted basis
3 |
| Standard & Poor’s Ratings Services (ABS Auto Trust Data) |
|
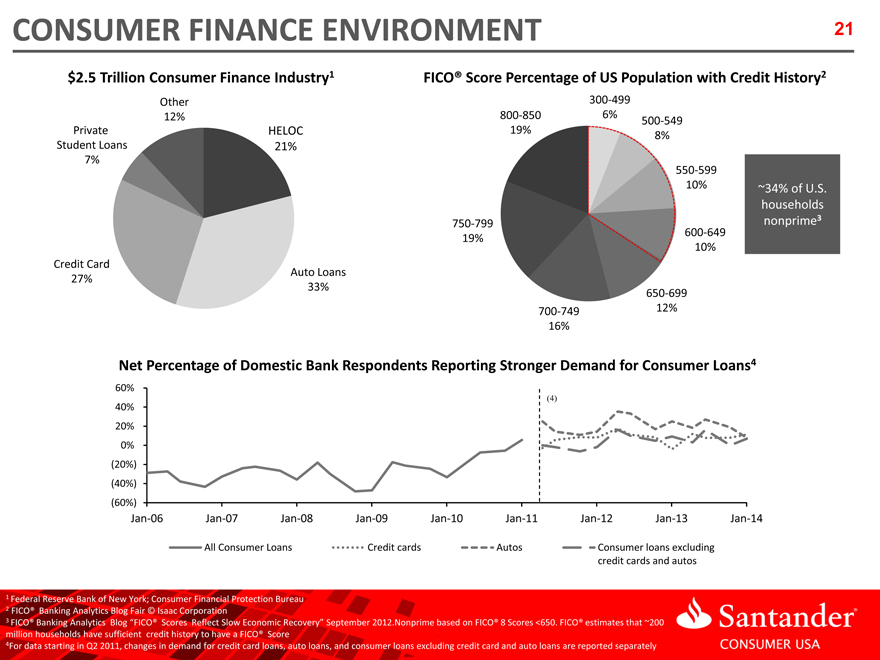
CONSUMER FINANCE ENVIRONMENT 21
$2.5 Trillion Consumer Finance Industry 1 FICO® Score Percentage of US Population with Credit History2
Other 300 499 12% 800 850 6%
Private HELOC 19% 500 549 Student Loans 8%
21%
7%
550 599
10% ~34% of U.S. households nonprime 3
750 799 600 649 19% 10% Credit Card Auto Loans 27% 33% 650 699 700 749 12% 16%
Net Percentage of Domestic Bank Respondents Reporting Stronger Demand for Consumer Loans4
60%
(4) |
|
40% 20% 0% (20%) (40%) (60%)
Jan 06 Jan 07 Jan 08 Jan 09 Jan 10 Jan 11 Jan 12 Jan 13 Jan 14
All Consumer Loans Credit cards Autos Consumer loans excluding
credit cards and autos
1 Federal Reserve Bank of New York; Consumer Financial Protection Bureau
2 |
| FICO® Banking Analytics Blog Fair © Isaac Corporation |
3 FICO® Banking Analytics Blog “FICO® Scores Reflect Slow Economic Recovery” September 2012.Nonprime based on FICO® 8 Scores <650. FICO® estimates that ~200 million households have sufficient credit history to have a FICO® Score 4For data starting in Q2 2011, changes in demand for credit card loans, auto loans, and consumer loans excluding credit card and auto loans are reported separately
|
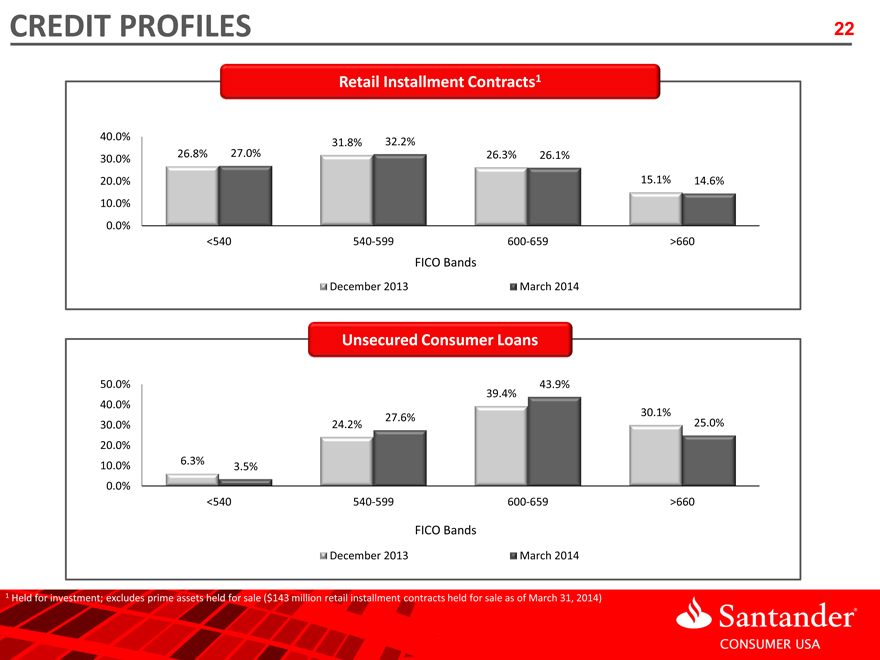
CREDIT PROFILES
Retail Installment Contracts1
40.0%
31.8% 32.2%
26.8% 27.0% 26.3% 26.1% 30.0%
20.0% 15.1% 14.6% 10.0%
0.0%
<540 540-599 600-659 >660
FICO Bands
December 2013 March 2014
Unsecured Consumer Loans
50.0% 39.4% 43.9% 40.0%
30.1% 27.6%
30.0% 24.2% 25.0% 20.0%
6.3%
10.0% 3.5%
0.0%
<540 540-599 600-659 >660
FICO Bands
December 2013 March 2014
1 Held for investment; excludes prime assets held for sale ($143 million retail installment contracts held for sale as of March 31, 2014)
22
|
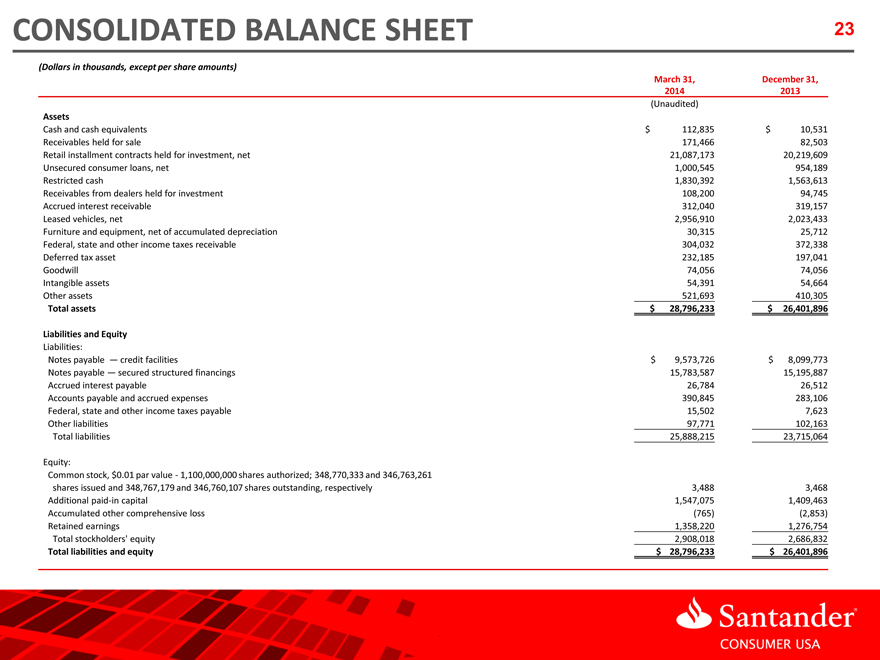
CONSOLIDATED BALANCE SHEET 23
(Dollars in thousands, except per share amounts)
March 31, December 31,
2014 2013
(Unaudited)
Assets
Cash and cash equivalents $ 112,835 $ 10,531
Receivables held for sale 171,466 82,503
Retail installment contracts held for investment, net 21,087,173 20,219,609
Unsecured consumer loans, net 1,000,545 954,189
Restricted cash 1,830,392 1,563,613
Receivables from dealers held for investment 108,200 94,745
Accrued interest receivable 312,040 319,157
Leased vehicles, net 2,956,910 2,023,433
Furniture and equipment, net of accumulated depreciation 30,315 25,712
Federal, state and other income taxes receivable 304,032 372,338
Deferred tax asset 232,185 197,041
Goodwill 74,056 74,056
Intangible assets 54,391 54,664
Other assets 521,693 410,305
Total assets $ 28,796,233 $ 26,401,896
Liabilities and Equity
Liabilities:
Notes payable — credit facilities $ 9,573,726 $ 8,099,773
Notes payable — secured structured financings 15,783,587 15,195,887
Accrued interest payable 26,784 26,512
Accounts payable and accrued expenses 390,845 283,106
Federal, state and other income taxes payable 15,502 7,623
Other liabilities 97,771 102,163
Total liabilities 25,888,215 23,715,064
Equity:
Common stock, $0.01 par value - 1,100,000,000 shares authorized; 348,770,333 and 346,763,261
shares issued and 348,767,179 and 346,760,107 shares outstanding, respectively 3,488 3,468
Additional paid-in capital 1,547,075 1,409,463
Accumulated other comprehensive loss (765) (2,853)
Retained earnings 1,358,220 1,276,754
Total stockholders’ equity 2,908,018 2,686,832
Total liabilities and equity $ 28,796,233 $ 26,401,896
|
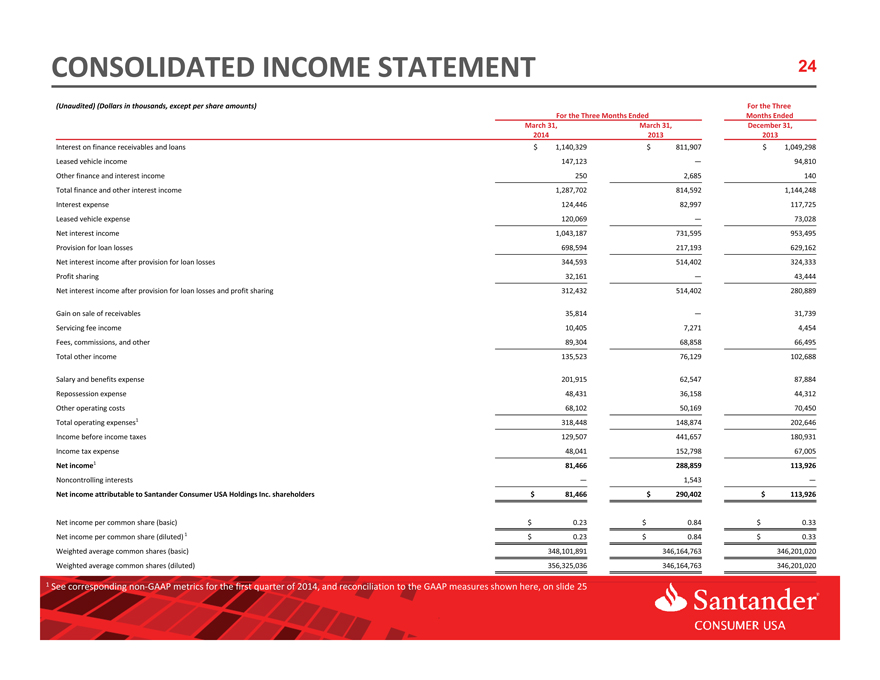
(Unaudited) (Dollars in thousands, except per share amounts) For the Three
For the Three Months Ended Months Ended
March 31, March 31, December 31,
2014 2013 2013
Interest on finance receivables and loans $ 1,140,329 $ 811,907 $ 1,049,298
Leased vehicle income 147,123 — 94,810
Other finance and interest income 250 2,685 140
Total finance and other interest income 1,287,702 814,592 1,144,248
Interest expense 124,446 82,997 117,725
Leased vehicle expense 120,069 — 73,028
Net interest income 1,043,187 731,595 953,495
Provision for loan losses 698,594 217,193 629,162
Net interest income after provision for loan losses 344,593 514,402 324,333
Profit sharing 32,161 — 43,444
Net interest income after provision for loan losses and profit sharing 312,432 514,402 280,889
Gain on sale of receivables 35,814 — 31,739
Servicing fee income 10,405 7,271 4,454
Fees, commissions, and other 89,304 68,858 66,495
Total other income 135,523 76,129 102,688
Salary and benefits expense 201,915 62,547 87,884
Repossession expense 48,431 36,158 44,312
Other operating costs 68,102 50,169 70,450
Total operating expenses1 318,448 148,874 202,646
Income before income taxes 129,507 441,657 180,931
Income tax expense 48,041 152,798 67,005
Net income1 81,466 288,859 113,926
Noncontrolling interests — 1,543 —
Net income attributable to Santander Consumer USA Holdings Inc. shareholders $ 81,466 $ 290,402 $ 113,926
Net income per common share (basic) $ 0.23 $ 0.84 $ 0.33
Net income per common share (diluted) 1 $ 0.23 $ 0.84 $ 0.33
Weighted average common shares (basic) 348,101,891 346,164,763 346,201,020
Weighted average common shares (diluted) 356,325,036 346,164,763 346,201,020
1 See corresponding non-GAAP metrics for the first quarter of 2014, and reconciliation to the GAAP measures shown here, on slide 25
|
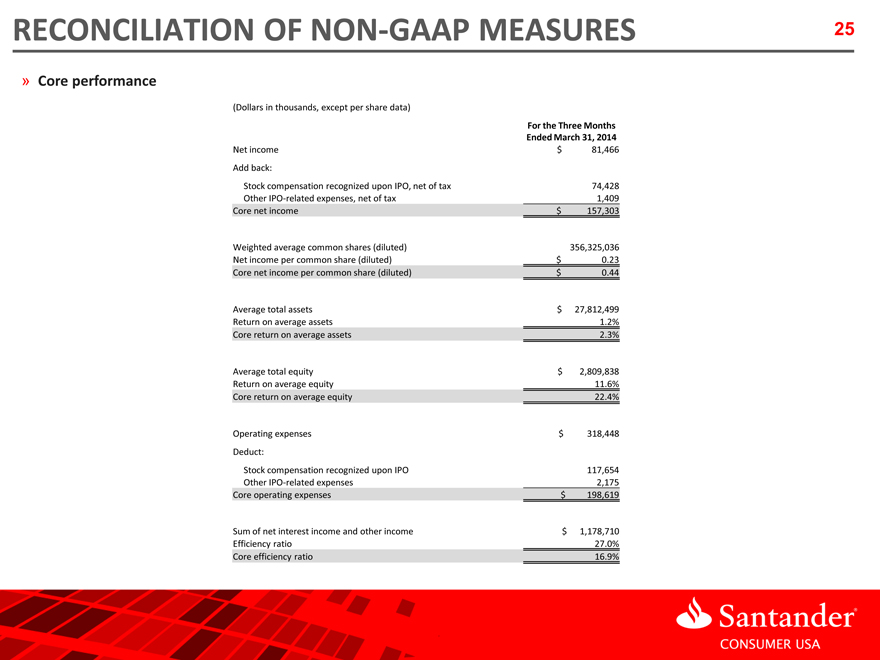
RECONCILIATION OF NON-GAAP MEASURES 25
» Core performance
(Dollars in thousands, except per share data)
(Dollars in thousands, except per share data)
For the Three Months
Ended March 31, 2014
Net income $ 81,466
Add back:
Stock compensation recognized upon IPO, net of tax 74,428
Other IPO-related expenses, net of tax 1,409
Core net income $ 157,303
Weighted average common shares (diluted) 356,325,036
Net income per common share (diluted) $ 0.23
Core net income per common share (diluted) $ 0.44
Average total assets $ 27,812,499
Return on average assets 1.2%
Core return on average assets 2.3%
Average total equity $ 2,809,838
Return on average equity 11.6%
Core return on average equity 22.4%
Operating expenses $ 318,448
Deduct:
Stock compensation recognized upon IPO 117,654
Other IPO-related expenses 2,175
Core operating expenses $ 198,619
Sum of net interest income and other income $ 1,178,710
Efficiency ratio 27.0%
Core efficiency ratio 16.9%
|

Santander CONSUMER USA
Dow Jones Sustainability Indexes Member 2008/09