
Exhibit (c)(2) Preliminary DraftExhibit (c)(2) Preliminary Draft


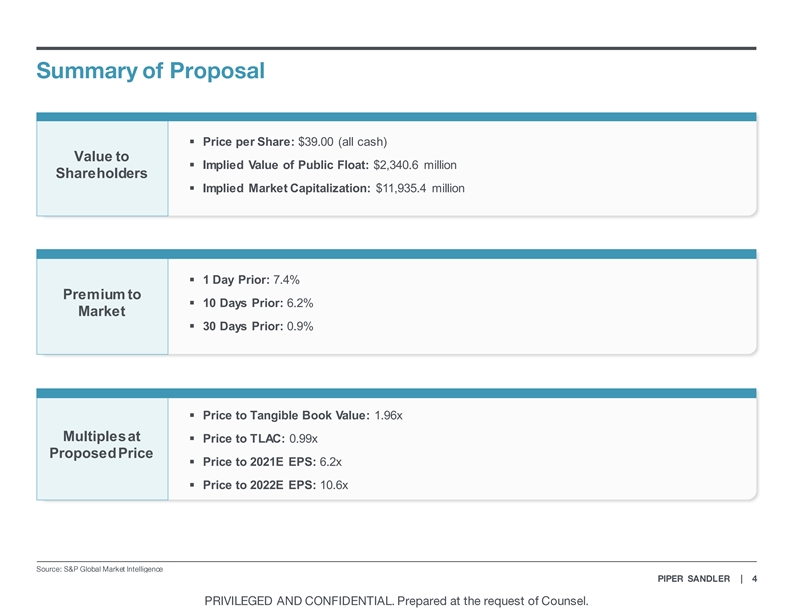
§ Price per Share: $39.00 (all cash) Value to § Implied Value of Public Float: $2,340.6 million Shareholders § Implied Market Capitalization: $11,935.4 million § 1 Day Prior: 7.4% Premium to § 10 Days Prior: 6.2% Market § 30 Days Prior: 0.9% § Price to Tangible Book Value: 1.96x Multiples at § Price to TLAC: 0.99x Proposed Price § Price to 2021E EPS: 6.2x § Price to 2022E EPS: 10.6x§ Price per Share: $39.00 (all cash) Value to § Implied Value of Public Float: $2,340.6 million Shareholders § Implied Market Capitalization: $11,935.4 million § 1 Day Prior: 7.4% Premium to § 10 Days Prior: 6.2% Market § 30 Days Prior: 0.9% § Price to Tangible Book Value: 1.96x Multiples at § Price to TLAC: 0.99x Proposed Price § Price to 2021E EPS: 6.2x § Price to 2022E EPS: 10.6x


Santander Consumer has Recovered and Rallied Further as the Pandemic has Started to Recede. There has also Been Public Discussion by Analysts of a Potential Buy-In of the Public Shares $45.00 3,500,000 $40.00 3,000,000 $35.00 2,500,000 $30.00 $36.43 2,000,000 $25.00 $20.00 1,500,000 $15.00 1,000,000 $10.00 500,000 $5.00 $- 0 7/1/2020 8/1/2020 9/1/2020 10/1/2020 11/1/2020 12/1/2020 1/1/2021 2/1/2021 3/1/2021 4/1/2021 5/1/2021 6/1/2021 7/1/2021 Daily Volume Stock Price 7/1/2021 3/31/2021 Market Performance / Balance Sheet Stock Price $36.43 Assets $47,234.0 Market Capitalization $11,148.9 Total Equity $6,231.9 Total Shares Outstanding (actual) 306,035,735 2019 Net Income $994.4 Number of Publicly Trades Shares (#) 60,015,942 2020 Net Income $910.9 Number of Publicly Trades Shares (%) 19.6% LTM Net Income $1,656.6 Value of Publicly Traded Shares $2,186.4 LTM ROE (%) 31.00% Price / Book (x) 1.79x Price / Tangible Book (x) 1.83x Price / 2021 EPS (x) 5.8x Price / 2022 EPS (x) 9.9x 9.1x Price / 2023 EPS (x)Santander Consumer has Recovered and Rallied Further as the Pandemic has Started to Recede. There has also Been Public Discussion by Analysts of a Potential Buy-In of the Public Shares $45.00 3,500,000 $40.00 3,000,000 $35.00 2,500,000 $30.00 $36.43 2,000,000 $25.00 $20.00 1,500,000 $15.00 1,000,000 $10.00 500,000 $5.00 $- 0 7/1/2020 8/1/2020 9/1/2020 10/1/2020 11/1/2020 12/1/2020 1/1/2021 2/1/2021 3/1/2021 4/1/2021 5/1/2021 6/1/2021 7/1/2021 Daily Volume Stock Price 7/1/2021 3/31/2021 Market Performance / Balance Sheet Stock Price $36.43 Assets $47,234.0 Market Capitalization $11,148.9 Total Equity $6,231.9 Total Shares Outstanding (actual) 306,035,735 2019 Net Income $994.4 Number of Publicly Trades Shares (#) 60,015,942 2020 Net Income $910.9 Number of Publicly Trades Shares (%) 19.6% LTM Net Income $1,656.6 Value of Publicly Traded Shares $2,186.4 LTM ROE (%) 31.00% Price / Book (x) 1.79x Price / Tangible Book (x) 1.83x Price / 2021 EPS (x) 5.8x Price / 2022 EPS (x) 9.9x 9.1x Price / 2023 EPS (x)

80.0% 70.0% 60.0% 50.0% 40.0% 30.0% 20.0% 10.0% 0.0% -10.0% -20.0% Capital One Ally OneMain Credit Acceptance Santander Consumer80.0% 70.0% 60.0% 50.0% 40.0% 30.0% 20.0% 10.0% 0.0% -10.0% -20.0% Capital One Ally OneMain Credit Acceptance Santander Consumer

6.00x 5.00x 4.00x 3.00x 2.00x 1.00x 0.00x Capital One Ally OneMain Credit Acceptance Santander Consumer6.00x 5.00x 4.00x 3.00x 2.00x 1.00x 0.00x Capital One Ally OneMain Credit Acceptance Santander Consumer

8.00x 7.00x 6.00x 5.00x 4.00x 3.00x 2.00x 1.00x 0.00x Capital One Ally OneMain Credit Acceptance Santander Consumer 25.0x 20.0x 15.0x 10.0x 5.0x 0.0x Capital One Ally OneMain Credit Acceptance Santander Consumer8.00x 7.00x 6.00x 5.00x 4.00x 3.00x 2.00x 1.00x 0.00x Capital One Ally OneMain Credit Acceptance Santander Consumer 25.0x 20.0x 15.0x 10.0x 5.0x 0.0x Capital One Ally OneMain Credit Acceptance Santander Consumer

Valuation Price/ Tang. 2021 2022 YTD Share % of 52 Week Market Total Book Book LTM Est. Est. Price Price High Low Cap Assets ROAA ROAE Value Value EPS EPS EPS Change (Dollars in Millions, except per share data) Ticker ($) (%) (%) ($mm) ($mm) (%) (%) (x) (x) (x) (x) (x) (%) Core Comparables Capital One Financial Corporation COF 157.15 93.5 274.3 70,952 425,175 1.76 12.57 1.73 1.27 10.1 8.8 9.9 59.0 Ally Financial Inc. ALLY 50.37 89.0 269.1 18,671 181,879 1.20 15.05 1.32 1.28 8.6 7.8 8.2 41.3 OneMain Holdings, Inc. OMF 60.45 97.7 271.7 8,129 21,285 4.95 34.41 5.11 2.46 7.2 6.4 7.4 25.5 Credit Acceptance Corporation CACC 452.71 84.0 169.7 7,554 7,707 9.51 31.96 3.25 3.25 10.9 11.3 12.5 30.8 Median - Core Comparables 3.35 23.50 2.49 1.87 9.4 8.3 9.0 36.0 Additional Comparables Discover Financial Services DFS 119.69 95.5 263.6 36,125 113,871 2.43 26.82 3.41 3.30 13.3 8.5 10.2 32.2 Synchrony Financial SYF 48.87 95.9 232.3 28,423 95,854 2.20 17.06 2.72 2.24 13.5 9.3 9.3 40.8 Alliance Data Systems Corporation ADS 107.14 83.6 275.5 5,327 21,163 2.11 34.65 15.74 3.02 10.7 7.1 7.4 44.6 Median - Additional Comparables 2.20 26.82 3.41 3.02 13.3 8.5 9.3 40.8 Median - Overall 2.20 26.82 3.25 2.46 10.7 8.5 9.3 40.8 Mean - Overall 3.45 24.64 4.75 2.40 10.6 8.4 9.3 39.2 Santander Consumer USA Holdings Inc. SC 36.43 88.6 227.3 11,149 47,234 3.45 31.00 1.83 1.79 7.6 5.8 9.9 65.4Valuation Price/ Tang. 2021 2022 YTD Share % of 52 Week Market Total Book Book LTM Est. Est. Price Price High Low Cap Assets ROAA ROAE Value Value EPS EPS EPS Change (Dollars in Millions, except per share data) Ticker ($) (%) (%) ($mm) ($mm) (%) (%) (x) (x) (x) (x) (x) (%) Core Comparables Capital One Financial Corporation COF 157.15 93.5 274.3 70,952 425,175 1.76 12.57 1.73 1.27 10.1 8.8 9.9 59.0 Ally Financial Inc. ALLY 50.37 89.0 269.1 18,671 181,879 1.20 15.05 1.32 1.28 8.6 7.8 8.2 41.3 OneMain Holdings, Inc. OMF 60.45 97.7 271.7 8,129 21,285 4.95 34.41 5.11 2.46 7.2 6.4 7.4 25.5 Credit Acceptance Corporation CACC 452.71 84.0 169.7 7,554 7,707 9.51 31.96 3.25 3.25 10.9 11.3 12.5 30.8 Median - Core Comparables 3.35 23.50 2.49 1.87 9.4 8.3 9.0 36.0 Additional Comparables Discover Financial Services DFS 119.69 95.5 263.6 36,125 113,871 2.43 26.82 3.41 3.30 13.3 8.5 10.2 32.2 Synchrony Financial SYF 48.87 95.9 232.3 28,423 95,854 2.20 17.06 2.72 2.24 13.5 9.3 9.3 40.8 Alliance Data Systems Corporation ADS 107.14 83.6 275.5 5,327 21,163 2.11 34.65 15.74 3.02 10.7 7.1 7.4 44.6 Median - Additional Comparables 2.20 26.82 3.41 3.02 13.3 8.5 9.3 40.8 Median - Overall 2.20 26.82 3.25 2.46 10.7 8.5 9.3 40.8 Mean - Overall 3.45 24.64 4.75 2.40 10.6 8.4 9.3 39.2 Santander Consumer USA Holdings Inc. SC 36.43 88.6 227.3 11,149 47,234 3.45 31.00 1.83 1.79 7.6 5.8 9.9 65.4

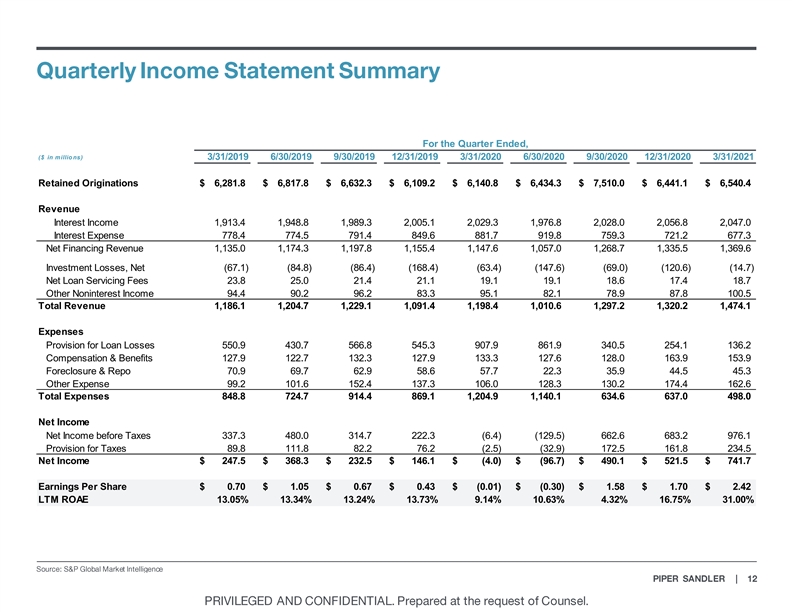
For the Quarter Ended, ($ in millio ns) 3/31/2019 6/30/2019 9/30/2019 12/31/2019 3/31/2020 6/30/2020 9/30/2020 12/31/2020 3/31/2021 Retained Originations $ 6,281.8 $ 6,817.8 $ 6,632.3 $ 6,109.2 $ 6,140.8 $ 6,434.3 $ 7,510.0 $ 6,441.1 $ 6,540.4 Revenue Interest Income 1,913.4 1,948.8 1,989.3 2,005.1 2,029.3 1,976.8 2,028.0 2,056.8 2,047.0 Interest Expense 778.4 774.5 791.4 849.6 881.7 919.8 759.3 721.2 677.3 Net Financing Revenue 1,135.0 1,174.3 1,197.8 1,155.4 1,147.6 1,057.0 1,268.7 1,335.5 1,369.6 Investment Losses, Net (67.1) (84.8) (86.4) (168.4) (63.4) (147.6) (69.0) (120.6) (14.7) Net Loan Servicing Fees 23.8 25.0 21.4 21.1 19.1 19.1 18.6 17.4 18.7 Other Noninterest Income 94.4 90.2 96.2 83.3 95.1 82.1 78.9 87.8 100.5 Total Revenue 1,186.1 1,204.7 1,229.1 1,091.4 1,198.4 1,010.6 1,297.2 1,320.2 1,474.1 Expenses Provision for Loan Losses 550.9 430.7 566.8 545.3 907.9 861.9 340.5 254.1 136.2 Compensation & Benefits 127.9 122.7 132.3 127.9 133.3 127.6 128.0 163.9 153.9 Foreclosure & Repo 70.9 69.7 62.9 58.6 57.7 22.3 35.9 44.5 45.3 Other Expense 99.2 101.6 152.4 137.3 106.0 128.3 130.2 174.4 162.6 Total Expenses 848.8 724.7 914.4 869.1 1,204.9 1,140.1 634.6 637.0 498.0 Net Income Net Income before Taxes 337.3 480.0 314.7 222.3 (6.4) (129.5) 662.6 683.2 976.1 Provision for Taxes 89.8 111.8 82.2 76.2 (2.5) (32.9) 172.5 161.8 234.5 Net Income $ 247.5 $ 368.3 $ 232.5 $ 146.1 $ (4.0) $ (96.7) $ 490.1 $ 521.5 $ 741.7 Earnings Per Share $ 0.70 $ 1.05 $ 0.67 $ 0.43 $ (0.01) $ (0.30) $ 1.58 $ 1.70 $ 2.42 LTM ROAE 13.05% 13.34% 13.24% 13.73% 9.14% 10.63% 4.32% 16.75% 31.00%For the Quarter Ended, ($ in millio ns) 3/31/2019 6/30/2019 9/30/2019 12/31/2019 3/31/2020 6/30/2020 9/30/2020 12/31/2020 3/31/2021 Retained Originations $ 6,281.8 $ 6,817.8 $ 6,632.3 $ 6,109.2 $ 6,140.8 $ 6,434.3 $ 7,510.0 $ 6,441.1 $ 6,540.4 Revenue Interest Income 1,913.4 1,948.8 1,989.3 2,005.1 2,029.3 1,976.8 2,028.0 2,056.8 2,047.0 Interest Expense 778.4 774.5 791.4 849.6 881.7 919.8 759.3 721.2 677.3 Net Financing Revenue 1,135.0 1,174.3 1,197.8 1,155.4 1,147.6 1,057.0 1,268.7 1,335.5 1,369.6 Investment Losses, Net (67.1) (84.8) (86.4) (168.4) (63.4) (147.6) (69.0) (120.6) (14.7) Net Loan Servicing Fees 23.8 25.0 21.4 21.1 19.1 19.1 18.6 17.4 18.7 Other Noninterest Income 94.4 90.2 96.2 83.3 95.1 82.1 78.9 87.8 100.5 Total Revenue 1,186.1 1,204.7 1,229.1 1,091.4 1,198.4 1,010.6 1,297.2 1,320.2 1,474.1 Expenses Provision for Loan Losses 550.9 430.7 566.8 545.3 907.9 861.9 340.5 254.1 136.2 Compensation & Benefits 127.9 122.7 132.3 127.9 133.3 127.6 128.0 163.9 153.9 Foreclosure & Repo 70.9 69.7 62.9 58.6 57.7 22.3 35.9 44.5 45.3 Other Expense 99.2 101.6 152.4 137.3 106.0 128.3 130.2 174.4 162.6 Total Expenses 848.8 724.7 914.4 869.1 1,204.9 1,140.1 634.6 637.0 498.0 Net Income Net Income before Taxes 337.3 480.0 314.7 222.3 (6.4) (129.5) 662.6 683.2 976.1 Provision for Taxes 89.8 111.8 82.2 76.2 (2.5) (32.9) 172.5 161.8 234.5 Net Income $ 247.5 $ 368.3 $ 232.5 $ 146.1 $ (4.0) $ (96.7) $ 490.1 $ 521.5 $ 741.7 Earnings Per Share $ 0.70 $ 1.05 $ 0.67 $ 0.43 $ (0.01) $ (0.30) $ 1.58 $ 1.70 $ 2.42 LTM ROAE 13.05% 13.34% 13.24% 13.73% 9.14% 10.63% 4.32% 16.75% 31.00%

For the Quarter Ended, ($ in millions) 3/31/2019 6/30/2019 9/30/2019 12/31/2019 3/31/2020 6/30/2020 9/30/2020 12/31/2020 3/31/2021 (1) Cash and Cash Equivalents $ 2,533.7 $ 2,467.0 $ 2,376.1 $ 2,253.3 $ 2,584.0 $ 2,352.4 $ 2,520.3 $ 2,472.1 $ 3,268.5 Gross Loans HFI 28,775.0 28,961.0 29,617.0 30,810.5 30,829.9 30,606.4 33,602.1 33,114.6 32,090.2 Loan-loss Reserve 3,176.3 3,122.3 3,116.7 3,043.5 5,460.1 5,860.0 6,152.4 6,110.6 6,005.1 Net Loans HFI 25,598.7 25,838.7 26,500.4 27,767.0 25,369.8 24,746.5 27,449.7 27,004.0 26,085.1 Loans Held for Sale 974.0 1,249.1 925.6 1,007.1 912.1 2,445.6 763.3 1,567.5 - Equipment Under Op Leases 14,388.7 15,313.4 16,037.8 16,462.0 16,746.9 16,239.6 16,195.4 16,391.1 16,478.2 Net Loans & Leases 40,961.4 42,401.2 43,463.8 45,236.1 43,028.8 43,431.7 44,408.4 44,962.6 42,563.3 Total Intangible Assets 115.3 108.2 110.7 116.8 121.9 127.2 136.4 144.2 147.9 Total Other Assets 1,435.6 1,439.7 1,328.5 1,327.3 1,372.2 1,357.4 1,383.8 1,308.6 1,254.3 Total Assets $ 45,045.9 $ 46,416.1 $ 47,279.0 $ 48,933.5 $ 47,106.9 $ 47,268.7 $ 48,448.9 $ 48,887.5 $ 47,234.0 Total Debt 35,732.3 36,848.6 37,712.4 39,270.8 40,290.5 40,702.7 41,429.1 41,202.3 38,608.8 Deferred Tax Liability 1,230.5 1,327.3 1,403.6 1,468.2 940.1 910.4 1,095.2 1,263.8 1,497.8 Total Other Liabilities 924.5 902.9 817.7 875.9 730.2 760.1 829.8 799.5 895.6 Total Liabilities 37,887.4 39,078.8 39,933.8 41,614.9 41,960.8 42,373.2 43,354.1 43,265.5 41,002.1 Total Equity 7,158.5 7,337.3 7,345.2 7,318.6 5,146.1 4,895.5 5,094.8 5,622.0 6,231.9 Total Liabilities & Equity $ 45,045.9 $ 46,416.1 $ 47,279.0 $ 48,933.5 $ 47,106.9 $ 47,268.7 $ 48,448.9 $ 48,887.5 $ 47,234.0 CET1 Capital Ratio 15.80% 15.70% 15.40% 14.80% 13.80% 13.40% 13.70% 14.60% 16.50% CET1 Capital $ 6,982.1 $ 7,206.6 $ 7,226.4 $ 7,192.6 $ 6,725.5 $ 6,573.7 $ 6,834.3 $ 7,341.0 $ 7,916.0For the Quarter Ended, ($ in millions) 3/31/2019 6/30/2019 9/30/2019 12/31/2019 3/31/2020 6/30/2020 9/30/2020 12/31/2020 3/31/2021 (1) Cash and Cash Equivalents $ 2,533.7 $ 2,467.0 $ 2,376.1 $ 2,253.3 $ 2,584.0 $ 2,352.4 $ 2,520.3 $ 2,472.1 $ 3,268.5 Gross Loans HFI 28,775.0 28,961.0 29,617.0 30,810.5 30,829.9 30,606.4 33,602.1 33,114.6 32,090.2 Loan-loss Reserve 3,176.3 3,122.3 3,116.7 3,043.5 5,460.1 5,860.0 6,152.4 6,110.6 6,005.1 Net Loans HFI 25,598.7 25,838.7 26,500.4 27,767.0 25,369.8 24,746.5 27,449.7 27,004.0 26,085.1 Loans Held for Sale 974.0 1,249.1 925.6 1,007.1 912.1 2,445.6 763.3 1,567.5 - Equipment Under Op Leases 14,388.7 15,313.4 16,037.8 16,462.0 16,746.9 16,239.6 16,195.4 16,391.1 16,478.2 Net Loans & Leases 40,961.4 42,401.2 43,463.8 45,236.1 43,028.8 43,431.7 44,408.4 44,962.6 42,563.3 Total Intangible Assets 115.3 108.2 110.7 116.8 121.9 127.2 136.4 144.2 147.9 Total Other Assets 1,435.6 1,439.7 1,328.5 1,327.3 1,372.2 1,357.4 1,383.8 1,308.6 1,254.3 Total Assets $ 45,045.9 $ 46,416.1 $ 47,279.0 $ 48,933.5 $ 47,106.9 $ 47,268.7 $ 48,448.9 $ 48,887.5 $ 47,234.0 Total Debt 35,732.3 36,848.6 37,712.4 39,270.8 40,290.5 40,702.7 41,429.1 41,202.3 38,608.8 Deferred Tax Liability 1,230.5 1,327.3 1,403.6 1,468.2 940.1 910.4 1,095.2 1,263.8 1,497.8 Total Other Liabilities 924.5 902.9 817.7 875.9 730.2 760.1 829.8 799.5 895.6 Total Liabilities 37,887.4 39,078.8 39,933.8 41,614.9 41,960.8 42,373.2 43,354.1 43,265.5 41,002.1 Total Equity 7,158.5 7,337.3 7,345.2 7,318.6 5,146.1 4,895.5 5,094.8 5,622.0 6,231.9 Total Liabilities & Equity $ 45,045.9 $ 46,416.1 $ 47,279.0 $ 48,933.5 $ 47,106.9 $ 47,268.7 $ 48,448.9 $ 48,887.5 $ 47,234.0 CET1 Capital Ratio 15.80% 15.70% 15.40% 14.80% 13.80% 13.40% 13.70% 14.60% 16.50% CET1 Capital $ 6,982.1 $ 7,206.6 $ 7,226.4 $ 7,192.6 $ 6,725.5 $ 6,573.7 $ 6,834.3 $ 7,341.0 $ 7,916.0

Actuals 2021 Estimates 2022 Estimates 1 1 ($ in millions, except per share values) Full Yr Full Yr 2019 2020 Q-1 (A) Q-2 Q-3 Q-4 Q-1 Q-2 Q-3 Q-4 Income Statement Highlights Financing Revenue $ 4,663 $ 4,809 $ 1,370 $ 1,301 $ 1,315 $ 1,320 $ 5,334 $ 1,290 $ 1,295 $ 1,311 $ 1,304 $ 5,343 Loan Loss Provisions 2,094 2,364 136 373 529 588 1,716 623 704 796 782 2,801 Earnings Before Taxes 1,354 1,210 976 665 459 406 2,495 446 365 331 328 1,400 Net Income 994 911 742 501 361 275 1,876 316 283 240 226 1,035 Earnings per Share 2.86 2.87 2.42 1.69 1.23 1.04 6.28 1.09 0.92 0.87 0.80 3.70 Balance Sheet Highlights Total Assets 48,934 48,887 47,234 47,131 47,750 47,931 48,475 48,783 49,714 50,317 50,659 51,034 Tangible Book Value 7,202 5,478 6,084 6,652 6,901 7,004 7,004 7,011 7,115 7,226 7,203 7,203 TBV per Share 21.23 17.90 19.88 21.43 22.28 23.10 23.10 24.48 25.25 25.79 26.04 24.89Actuals 2021 Estimates 2022 Estimates 1 1 ($ in millions, except per share values) Full Yr Full Yr 2019 2020 Q-1 (A) Q-2 Q-3 Q-4 Q-1 Q-2 Q-3 Q-4 Income Statement Highlights Financing Revenue $ 4,663 $ 4,809 $ 1,370 $ 1,301 $ 1,315 $ 1,320 $ 5,334 $ 1,290 $ 1,295 $ 1,311 $ 1,304 $ 5,343 Loan Loss Provisions 2,094 2,364 136 373 529 588 1,716 623 704 796 782 2,801 Earnings Before Taxes 1,354 1,210 976 665 459 406 2,495 446 365 331 328 1,400 Net Income 994 911 742 501 361 275 1,876 316 283 240 226 1,035 Earnings per Share 2.86 2.87 2.42 1.69 1.23 1.04 6.28 1.09 0.92 0.87 0.80 3.70 Balance Sheet Highlights Total Assets 48,934 48,887 47,234 47,131 47,750 47,931 48,475 48,783 49,714 50,317 50,659 51,034 Tangible Book Value 7,202 5,478 6,084 6,652 6,901 7,004 7,004 7,011 7,115 7,226 7,203 7,203 TBV per Share 21.23 17.90 19.88 21.43 22.28 23.10 23.10 24.48 25.25 25.79 26.04 24.89

Actuals 2021 Estimates 2022 Estimates ($ in millions, except per share values) 2019 2020 Q-1 (A) Q-2 Q-3 Q-4 Full Yr Q-1 Q-2 Q-3 Q-4 Full Yr Income Statement Highlights Financing Revenue $ 4,663 $ 4,809 $ 1,370 $ 1,317 $ 1,276 $ 1,278 $ 5,241 $ 1,246 $ 1,272 $ 1,287 $ 1,304 $ 5,110 Loan Loss Provisions 2,094 2,364 136 83 212 416 847 612 588 784 817 2,800 Earnings Before Taxes 1,354 1,210 976 981 819 582 3,359 363 424 251 199 1,237 Net Income 994 911 742 736 614 437 2,529 272 318 189 149 928 Earnings per Share 2.86 2.87 2.42 2.40 2.04 1.47 8.33 0.92 1.09 0.65 0.52 3.19 Balance Sheet Highlights Total Assets 48,934 48,887 47,234 47,131 47,396 47,931 47,931 48,417 49,292 5,061 50,659 50,659 Tangible Book Value 7,202 5,478 6,084 6,753 7,151 7,372 7,372 7,479 7,633 7,658 7,645 7,645 TBV per Share 21.23 17.90 19.88 22.06 23.73 24.83 24.83 25.43 26.20 26.54 26.73 26.73Actuals 2021 Estimates 2022 Estimates ($ in millions, except per share values) 2019 2020 Q-1 (A) Q-2 Q-3 Q-4 Full Yr Q-1 Q-2 Q-3 Q-4 Full Yr Income Statement Highlights Financing Revenue $ 4,663 $ 4,809 $ 1,370 $ 1,317 $ 1,276 $ 1,278 $ 5,241 $ 1,246 $ 1,272 $ 1,287 $ 1,304 $ 5,110 Loan Loss Provisions 2,094 2,364 136 83 212 416 847 612 588 784 817 2,800 Earnings Before Taxes 1,354 1,210 976 981 819 582 3,359 363 424 251 199 1,237 Net Income 994 911 742 736 614 437 2,529 272 318 189 149 928 Earnings per Share 2.86 2.87 2.42 2.40 2.04 1.47 8.33 0.92 1.09 0.65 0.52 3.19 Balance Sheet Highlights Total Assets 48,934 48,887 47,234 47,131 47,396 47,931 47,931 48,417 49,292 5,061 50,659 50,659 Tangible Book Value 7,202 5,478 6,084 6,753 7,151 7,372 7,372 7,479 7,633 7,658 7,645 7,645 TBV per Share 21.23 17.90 19.88 22.06 23.73 24.83 24.83 25.43 26.20 26.54 26.73 26.73

Analyst# 19 19 20 20 20 20 20 19 17 18 18 18 17 16 16 15 15 15 15 15 15 15 15 15 16 17 17 17 100% 90% 20% 22% 22% 22% 24% 24% 25% 25% 26% 27% 27% 27% 27% 27% 27% 27% 30% 30% 30% 30% 33% 33% 80% 40% 44% 47% 47% 47% 53% 70% 60% 50% 73% 60% 60% 60% 60% 60% 72% 71% 69% 69% 40% 67% 67% 68% 78% 78% 76% 65% 65% 60% 60% 70% 70% 50% 30% 60% 47% 47% 53% 47% 20% 10% 13% 13% 13% 13% 13% 7% 7% 7% 7% 7% 6% 6% 6% 6% 6% 6% 6% 5% 5% 5% 0% 4/19 5/19 6/19 7/19 8/19 9/19 10/19 11/19 12/19 1/20 2/20 3/20 4/20 5/20 6/20 7/20 8/20 9/20 10/20 11/20 12/20 1/21 2/21 3/21 4/21 5/21 6/21 7/21 Underweight + Sell Hold Buy + Overweight § JMP Securities: Downgrade to HOLD on July 1, 2021 § Compass Point Research: Downgrade to HOLD on July 1, 2021 § Jefferies: Downgrade to HOLD on July 2, 2021 § BMO Capital Markets: Downgrade to HOLD on July 2, 2021

2022 Analyst Estimates Piper Compasss Deutsche Janney JMP Sandler BMO Point Bank Montgomery Jefferies Securities KBW Stephens Consensus△ '21 - '22 2022 Earnings Detail ($mm) ($mm) ($mm) ($mm) ($mm) ($mm) ($mm) ($mm) ($mm) ($mm) ($mm) Net Interest Income 5,110 5,193 5,108 5,453 5,741 5,594 5,321 0.8% Provision Expense 2,800 1,710 2,626 2,343 2,904 3,014 2,801 2,736 3,311 2,694 75.6% Operating Expenses 1,285 1,307 1,209 1,244 1,163 1,530 1,267 1,221 1,570 1,311 6.4% Pre-tax Net Income 1,237 2,348 1,446 1,560 1,365 1,410 1,433 1,389 1,350 1,554 (43.7%) Net Income 928 1,808 1,084 1,170 1,024 1,058 1,075 1,035 918 1,161 (44.3%) Earnings per Share $3.19 $5.20 $3.60 $4.00 $3.86 $3.66 $3.51 $3.97 $3.45 $3.90 (41.9%) 2022 Balance Sheet Detail Total Assets 5 0,659 5 0,367 57,113 4 8,632 6 1,060 5 3,566 8.0% Total Equity 7,793 8,173 8,034 6,998 7,144 8,563 5,853 7,461 7.2% TBV per Share $26.73 $26.92 $26.45 $24.29 $27.71 $23.25 $21.94 $25.33 10.7% Estimate Date 7/1/2021 7/6/2021 7/1/2021 5/26/2021 7/1/2021 7/6/2021 7/1/2021 7/2/2021 6/14/20212022 Analyst Estimates Piper Compasss Deutsche Janney JMP Sandler BMO Point Bank Montgomery Jefferies Securities KBW Stephens Consensus△ '21 - '22 2022 Earnings Detail ($mm) ($mm) ($mm) ($mm) ($mm) ($mm) ($mm) ($mm) ($mm) ($mm) ($mm) Net Interest Income 5,110 5,193 5,108 5,453 5,741 5,594 5,321 0.8% Provision Expense 2,800 1,710 2,626 2,343 2,904 3,014 2,801 2,736 3,311 2,694 75.6% Operating Expenses 1,285 1,307 1,209 1,244 1,163 1,530 1,267 1,221 1,570 1,311 6.4% Pre-tax Net Income 1,237 2,348 1,446 1,560 1,365 1,410 1,433 1,389 1,350 1,554 (43.7%) Net Income 928 1,808 1,084 1,170 1,024 1,058 1,075 1,035 918 1,161 (44.3%) Earnings per Share $3.19 $5.20 $3.60 $4.00 $3.86 $3.66 $3.51 $3.97 $3.45 $3.90 (41.9%) 2022 Balance Sheet Detail Total Assets 5 0,659 5 0,367 57,113 4 8,632 6 1,060 5 3,566 8.0% Total Equity 7,793 8,173 8,034 6,998 7,144 8,563 5,853 7,461 7.2% TBV per Share $26.73 $26.92 $26.45 $24.29 $27.71 $23.25 $21.94 $25.33 10.7% Estimate Date 7/1/2021 7/6/2021 7/1/2021 5/26/2021 7/1/2021 7/6/2021 7/1/2021 7/2/2021 6/14/2021

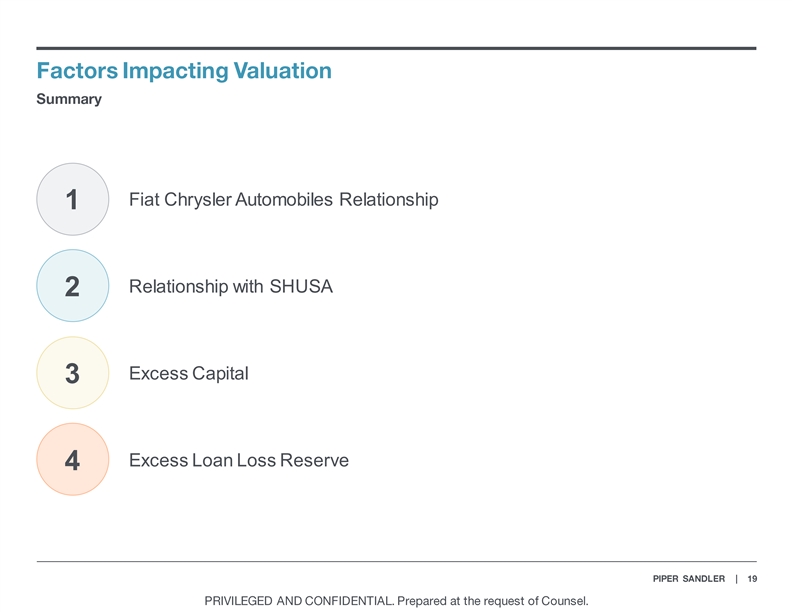
Fiat Chrysler Automobiles Relationship 1 Relationship with SHUSA 2 Excess Capital 3 Excess Loan Loss Reserve 4Fiat Chrysler Automobiles Relationship 1 Relationship with SHUSA 2 Excess Capital 3 Excess Loan Loss Reserve 4

1 § § § § § § § § § §

1 § § § § § § § § § § § § §1 § § § § § § § § § § § § §

1 §§ §§ §§ §§ § § § §1 §§ §§ §§ §§ § § § §

1

2 § § § § March 31, 2021 - (amounts in thousands) Counterparty Item Utilized Balance Committed Amount Weighted Avg Rates SHUSA Promissory Notes $ 6,500,000.0 $ 6,500,000.0 3.90% Santander Promissory Notes $ 4,000,000.0 $ 4 ,000,000.0 1.19% SHUSA Lines of Credit -- $ 3,000,000.0 3.12% $ 10,500,000.0 $ 13,500,000.0 2.92% § § § §2 § § § § March 31, 2021 - (amounts in thousands) Counterparty Item Utilized Balance Committed Amount Weighted Avg Rates SHUSA Promissory Notes $ 6,500,000.0 $ 6,500,000.0 3.90% Santander Promissory Notes $ 4,000,000.0 $ 4 ,000,000.0 1.19% SHUSA Lines of Credit -- $ 3,000,000.0 3.12% $ 10,500,000.0 $ 13,500,000.0 2.92% § § § §

2 2021E Funding Plan § Originations • § • Financing Activity & Capital Distributions • •2 2021E Funding Plan § Originations • § • Financing Activity & Capital Distributions • •

2 2021 Funding Plan Originations § • § • Financing Activity & Capital Distributions • • § § §2 2021 Funding Plan Originations § • § • Financing Activity & Capital Distributions • • § § §
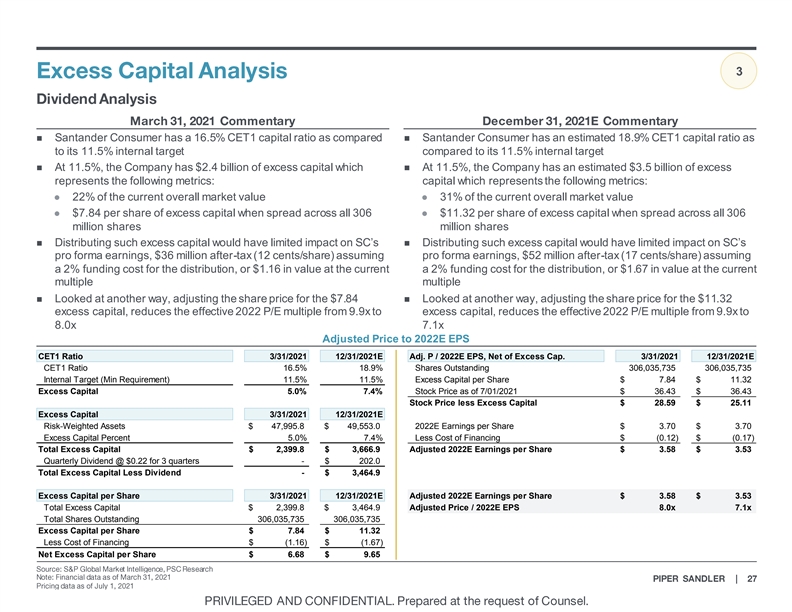
3 n Santander Consumer has a 16.5% CET1 capital ratio as compared n Santander Consumer has an estimated 18.9% CET1 capital ratio as to its 11.5% internal target compared to its 11.5% internal target n At 11.5%, the Company has $2.4 billion of excess capital which n At 11.5%, the Company has an estimated $3.5 billion of excess represents the following metrics: capital which represents the following metrics: l 22% of the current overall market valuel 31% of the current overall market value l $7.84 per share of excess capital when spread across all 306 l $11.32 per share of excess capital when spread across all 306 million shares million shares n Distributing such excess capital would have limited impact on SC’s n Distributing such excess capital would have limited impact on SC’s pro forma earnings, $36 million after-tax (12 cents/share) assuming pro forma earnings, $52 million after-tax (17 cents/share) assuming a 2% funding cost for the distribution, or $1.16 in value at the current a 2% funding cost for the distribution, or $1.67 in value at the current multiple multiple n Looked at another way, adjusting the share price for the $7.84 n Looked at another way, adjusting the share price for the $11.32 excess capital, reduces the effective 2022 P/E multiple from 9.9x to excess capital, reduces the effective 2022 P/E multiple from 9.9x to 8.0x 7.1x Adjusted Price to 2022E EPS CET1 Ratio 3/31/2021 12/31/2021E Adj. P / 2022E EPS, Net of Excess Cap. 3/31/2021 12/31/2021E CET1 Ratio 16.5% 18.9% Shares Outstanding 306,035,735 306,035,735 Internal Target (Min Requirement) 11.5% 11.5% Excess Capital per Share $ 7.84 $ 11.32 Excess Capital 5.0% 7.4% Stock Price as of 7/01/2021 $ 36.43 $ 36.43 Stock Price less Excess Capital $ 28.59 $ 25.11 Excess Capital 3/31/2021 12/31/2021E Risk-Weighted Assets $ 47,995.8 $ 49,553.0 2022E Earnings per Share $ 3.70 $ 3.70 Excess Capital Percent 5.0% 7.4% Less Cost of Financing $ (0.12) $ (0.17) Total Excess Capital $ 2,399.8 $ 3,666.9 Adjusted 2022E Earnings per Share $ 3.58 $ 3.53 Quarterly Dividend @ $0.22 for 3 quarters - $ 202.0 Total Excess Capital Less Dividend - $ 3,464.9 Excess Capital per Share 3/31/2021 12/31/2021E Adjusted 2022E Earnings per Share $ 3.58 $ 3.53 Total Excess Capital $ 2,399.8 $ 3,464.9 Adjusted Price / 2022E EPS 8.0x 7.1x Total Shares Outstanding 306,035,735 306,035,735 Excess Capital per Share $ 7.84 $ 11.32 Less Cost of Financing $ (1.16) $ (1.67) Net Excess Capital per Share $ 6.68 $ 9.65

3 Buyback at Current Price 3/31/2021 12/31/2021E Buyback at 20% Premium 3/31/2021 12/31/2021E Total Excess Capital $ 2,399.8 $ 3,464.9 Total Excess Capital $ 2,399.8 $ 3,464.9 Price per Share (7/1/2021) $ 36.43 $ 36.43 +20% Price per Share (7/1/2021) $ 43.72 $ 43.72 Number of Shares Purchased 65,874,067 95,112,227 Number of Shares Purchased 54,895,056 79,260,189 Shares Outstanding 306,035,735 306,035,735 Shares Outstanding 306,035,735 306,035,735 Less Number of Shares Purchased 65,874,067 95,112,227 Less Number of Shares Purchased 54,895,056 79,260,189 New Total Shares Outstanding 240,161,668 210,923,508 New Total Shares Outstanding 251,140,679 226,775,546 % of Shares Purchased 21.5% 31.1% % of Shares Purchased 17.9% 25.9% Current 2022E EPS $ 3.70 $ 3.70 Current 2022E EPS $ 3.70 $ 3.70 1 1 Adjusted 2022E EPS $ 4.59 $ 5.19 Adjusted 2022E EPS $ 4.39 $ 4.82 Earnings Accretion 24.2% 40.5% Earnings Accretion 18.7% 30.4% Current P / 2022E EPS Multiple 9.9x 9.9x Current P / 2022E EPS Multiple 9.9x 9.9x Pro Forma Price at Current Multiple $ 45.26 $ 51.18 Pro Forma Price at Current Multiple $ 43.23 $ 47.49 Implied Premium to Current Price - $ $ 8.83 $ 14.75 Implied Premium to Current Price - $ $ 6.80 $ 11.06 Implied Premium to Current Price - % 24.2% 40.5% Implied Premium to Current Price - % 18.7% 30.4%3 Buyback at Current Price 3/31/2021 12/31/2021E Buyback at 20% Premium 3/31/2021 12/31/2021E Total Excess Capital $ 2,399.8 $ 3,464.9 Total Excess Capital $ 2,399.8 $ 3,464.9 Price per Share (7/1/2021) $ 36.43 $ 36.43 +20% Price per Share (7/1/2021) $ 43.72 $ 43.72 Number of Shares Purchased 65,874,067 95,112,227 Number of Shares Purchased 54,895,056 79,260,189 Shares Outstanding 306,035,735 306,035,735 Shares Outstanding 306,035,735 306,035,735 Less Number of Shares Purchased 65,874,067 95,112,227 Less Number of Shares Purchased 54,895,056 79,260,189 New Total Shares Outstanding 240,161,668 210,923,508 New Total Shares Outstanding 251,140,679 226,775,546 % of Shares Purchased 21.5% 31.1% % of Shares Purchased 17.9% 25.9% Current 2022E EPS $ 3.70 $ 3.70 Current 2022E EPS $ 3.70 $ 3.70 1 1 Adjusted 2022E EPS $ 4.59 $ 5.19 Adjusted 2022E EPS $ 4.39 $ 4.82 Earnings Accretion 24.2% 40.5% Earnings Accretion 18.7% 30.4% Current P / 2022E EPS Multiple 9.9x 9.9x Current P / 2022E EPS Multiple 9.9x 9.9x Pro Forma Price at Current Multiple $ 45.26 $ 51.18 Pro Forma Price at Current Multiple $ 43.23 $ 47.49 Implied Premium to Current Price - $ $ 8.83 $ 14.75 Implied Premium to Current Price - $ $ 6.80 $ 11.06 Implied Premium to Current Price - % 24.2% 40.5% Implied Premium to Current Price - % 18.7% 30.4%

4 ($ in millions) 2017 2018 2019 2020 Q1 2020 Q2 2020 Q3 2020 Q4 2021 Q1 Reserves $ 3,353 $ 3,240 $ 3,043 $ 5,460 $ 5,860 $ 6,152 $ 6,111 $ 6,005 Reserves per Share 9.30 9.20 8.97 17.00 18.53 20.10 19.96 19.62 Tangible Equity $ 6,362 $ 6,909 $ 7,202 $ 5,024 $ 4,768 $ 4,958 $ 5,478 $ 6,084 Tangible Equity per Share 17.65 19.61 21.23 15.65 15.08 16.20 17.90 19.88 Total Assets $ 39,403 $ 43,960 $ 48,934 $ 47,107 $ 47,269 $ 48,449 $ 48,887 $ 47,234 Shares Outstanding (in millions) 360.5 352.3 339.2 321.1 316.2 306.1 306.1 306.0 Reserves + Tangible 24.7% 23.1% 21.0% 22.3% 22.5% 23.0% 23.7% 25.6% Equity / Total Assets Reserves + Tangible $ 26.95 $ 28.81 $ 30.20 $ 32.65 $ 33.61 $ 36.30 $ 37.86 $ 39.50 Equity per Share Memo: LTM Net Charge-offs $ 2,435 $ 2,317 $ 2,291 $ 2,269 $ 2,267 $ 1,722 $ 1,400 $ 1,050 Note: CECL Impact in Q1 2020 § January 1, 2020, the Company adopted CECL, which resulted in a reduction to the retained earnings balance, net of income tax, and an increase to the allowance for loan losses of approximately $2.1 billion § SC has elected to defer CECL’s effect on regulatory capital for two years followed by a three-year phase-in period per regulatory guidance4 ($ in millions) 2017 2018 2019 2020 Q1 2020 Q2 2020 Q3 2020 Q4 2021 Q1 Reserves $ 3,353 $ 3,240 $ 3,043 $ 5,460 $ 5,860 $ 6,152 $ 6,111 $ 6,005 Reserves per Share 9.30 9.20 8.97 17.00 18.53 20.10 19.96 19.62 Tangible Equity $ 6,362 $ 6,909 $ 7,202 $ 5,024 $ 4,768 $ 4,958 $ 5,478 $ 6,084 Tangible Equity per Share 17.65 19.61 21.23 15.65 15.08 16.20 17.90 19.88 Total Assets $ 39,403 $ 43,960 $ 48,934 $ 47,107 $ 47,269 $ 48,449 $ 48,887 $ 47,234 Shares Outstanding (in millions) 360.5 352.3 339.2 321.1 316.2 306.1 306.1 306.0 Reserves + Tangible 24.7% 23.1% 21.0% 22.3% 22.5% 23.0% 23.7% 25.6% Equity / Total Assets Reserves + Tangible $ 26.95 $ 28.81 $ 30.20 $ 32.65 $ 33.61 $ 36.30 $ 37.86 $ 39.50 Equity per Share Memo: LTM Net Charge-offs $ 2,435 $ 2,317 $ 2,291 $ 2,269 $ 2,267 $ 1,722 $ 1,400 $ 1,050 Note: CECL Impact in Q1 2020 § January 1, 2020, the Company adopted CECL, which resulted in a reduction to the retained earnings balance, net of income tax, and an increase to the allowance for loan losses of approximately $2.1 billion § SC has elected to defer CECL’s effect on regulatory capital for two years followed by a three-year phase-in period per regulatory guidance
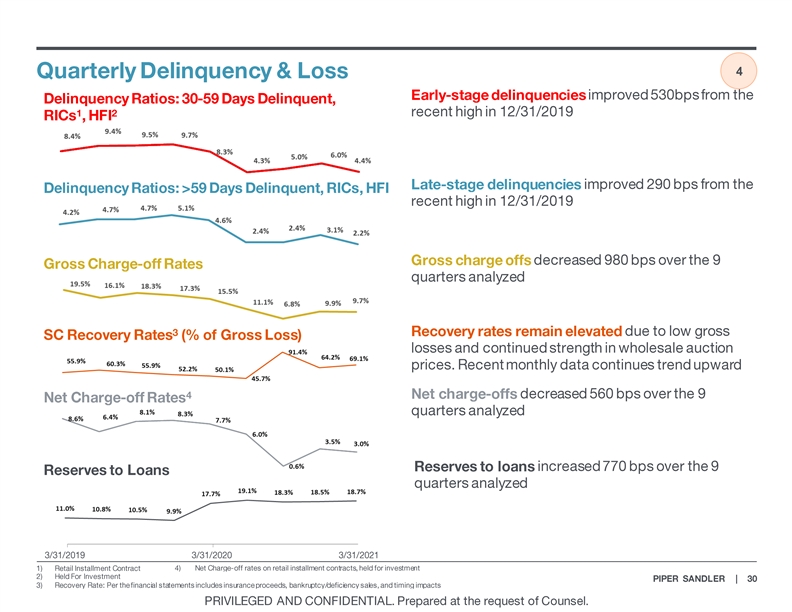
4 1 SC Recovery Rates (% of Gross Loss) 91.4% 64.2% 69.1% 55.9% 60.3% 55.9% 52.2% 50.1% 45.7% 3/1/2019 3/1/2020 3/1/20214 1 SC Recovery Rates (% of Gross Loss) 91.4% 64.2% 69.1% 55.9% 60.3% 55.9% 52.2% 50.1% 45.7% 3/1/2019 3/1/2020 3/1/2021

Calculation of Discount Rate Current 10 Year Treasury 1.41% Equity Risk Premium 7.15% Size Premium 0.80% Industry Premium 2.72% Discount Rate 12.08% ($ in millions, except per share data) 2022E 2023E 2024E 2025E 2026E Santander Consumer Net Income 1,035 1,100 1,187 1,282 1,385 YoY Growth 8.0% 8.0% 8.0% Earnings per Share 3.70 4.02 4.37 4.76 5.18 Historical RWA Ratio 101.2% 101.2% 101.2% 101.2% 101.2% Total Assets 51,034 53,585 56,264 59,078 62,032 YoY Growth 5.0% 5.0% 5.0% 5.0% Risk-Weighted Assets 51,649 54,231 56,943 59,790 62,780 Internal CET1 Target 11.5% 11.5% 11.5% 11.5% 11.5% Required CET1 5,940 6,237 6,548 6,876 7,220 Less: Intangibles 155 155 155 155 155 Less: Adj. Due to CECL Capital Relief 1,354 903 451 - - Required Equity 4,430 5,179 5,942 6,721 7,065 BoP Equity 7,004 4,430 5,179 5,942 6,721 Plus: Net Income 1,035 1,100 1,187 1,282 1,385 Less: Capital Distribution (3,608) (351) (424) (5 04) (1,041) EoP Equity 4,430 5,179 5,942 6,721 7,065 Capital Distribution 3,608 351 424 504 1,041 Terminal Value - - - - 13,463 Total 3,608 351 424 504 14,504 Valuation DDM Sensitivity Table (For Illustrative Purposes Only) Assumptions Discount Rate Discount Rate 12.0% $40.36 10.0% 11.0% 12.0% 13.0% 14.0% 1 7.0x $37.18 $35.97 $34.81 $33.71 $32.67 Terminal PE Multiple 9.0x 8.0x $40.22 $38.87 $37.59 $36.37 $35.20 DDM Value $12,354 9.0x $43.25 $41.77 $40.36 $39.02 $37.74 Shares Outstanding 306.1 10.0x $46.29 $44.67 $43.13 $41.67 $40.28 DDM Value per Share $40.36 11.0x $49.32 $47.57 $45.91 $44.32 $42.82 Terminal PE ValueCalculation of Discount Rate Current 10 Year Treasury 1.41% Equity Risk Premium 7.15% Size Premium 0.80% Industry Premium 2.72% Discount Rate 12.08% ($ in millions, except per share data) 2022E 2023E 2024E 2025E 2026E Santander Consumer Net Income 1,035 1,100 1,187 1,282 1,385 YoY Growth 8.0% 8.0% 8.0% Earnings per Share 3.70 4.02 4.37 4.76 5.18 Historical RWA Ratio 101.2% 101.2% 101.2% 101.2% 101.2% Total Assets 51,034 53,585 56,264 59,078 62,032 YoY Growth 5.0% 5.0% 5.0% 5.0% Risk-Weighted Assets 51,649 54,231 56,943 59,790 62,780 Internal CET1 Target 11.5% 11.5% 11.5% 11.5% 11.5% Required CET1 5,940 6,237 6,548 6,876 7,220 Less: Intangibles 155 155 155 155 155 Less: Adj. Due to CECL Capital Relief 1,354 903 451 - - Required Equity 4,430 5,179 5,942 6,721 7,065 BoP Equity 7,004 4,430 5,179 5,942 6,721 Plus: Net Income 1,035 1,100 1,187 1,282 1,385 Less: Capital Distribution (3,608) (351) (424) (5 04) (1,041) EoP Equity 4,430 5,179 5,942 6,721 7,065 Capital Distribution 3,608 351 424 504 1,041 Terminal Value - - - - 13,463 Total 3,608 351 424 504 14,504 Valuation DDM Sensitivity Table (For Illustrative Purposes Only) Assumptions Discount Rate Discount Rate 12.0% $40.36 10.0% 11.0% 12.0% 13.0% 14.0% 1 7.0x $37.18 $35.97 $34.81 $33.71 $32.67 Terminal PE Multiple 9.0x 8.0x $40.22 $38.87 $37.59 $36.37 $35.20 DDM Value $12,354 9.0x $43.25 $41.77 $40.36 $39.02 $37.74 Shares Outstanding 306.1 10.0x $46.29 $44.67 $43.13 $41.67 $40.28 DDM Value per Share $40.36 11.0x $49.32 $47.57 $45.91 $44.32 $42.82 Terminal PE Value

Proposal Dated Undisturbed 7/1/2021 Price (7/1/21) Implied Price per Share ($ in mm, except per share metrics) Input $36.43 $37.00 $38.00 $39.00 $40.00 $41.00 $42.00 $43.00 $44.00 $45.00 Price / 2020A Earnings per Share $2.87 12.7x 12.9x 13.2x 13.6x 13.9x 14.3x 14.6x 15.0x 15.3x 15.7x 2021E Earnings per Share (Analyst Consensus) $6.28 5.8x 5.9x 6.1x 6.2x 6.4x 6.5x 6.7x 6.8x 7.0x 7.2x 2022E Earnings per Share (Analyst Consensus) $3.70 9.9x 10.0x 10.3x 10.6x 10.8x 11.1x 11.4x 11.6x 11.9x 12.2x 2021E Earnings per Share (Company Estimates) $8.42 4.3x 4.4x 4.5x 4.6x 4.8x 4.9x 5.0x 5.1x 5.2x 5.3x 2022E Earnings per Share (Company Estimates) $4.18 8.7x 8.9x 9.1x 9.3x 9.6x 9.8x 10.0x 10.3x 10.5x 10.8x 2023E Earnings per Share (Company Estimates) $3.94 9.2x 9.4x 9.6x 9.9x 10.2x 10.4x 10.7x 10.9x 11.2x 11.4x 2024E Earnings per Share (Company Estimates) $4.11 8.9x 9.0x 9.2x 9.5x 9.7x 10.0x 10.2x 10.5x 10.7x 10.9x 3/31/2021 Tangible BV per Share $19.88 1.83x 1.86x 1.91x 1.96x 2.01x 2.06x 2.11x 2.16x 2.21x 2.26x 12/31/2021E Tangible BV per Share $21.45 1.70x 1.72x 1.77x 1.82x 1.86x 1.91x 1.96x 2.00x 2.05x 2.10x 0.92x 0.94x 0.96x 0.99x 1.01x 1.04x 1.06x 1.09x 1.11x 1.14x 3/31/2021 TLAC per Share $39.50 Premium / Closing Price as of 7/1/2021 $36.43 0.0% 1.6% 4.3% 7.1% 9.8% 12.5% 15.3% 18.0% 20.8% 23.5% Closing Price as of 7/12/2021 $40.99 (11.1%) (9.7%) (7.3%) (4.9%) (2.4%) 0.0% 2.5% 4.9% 7.3% 9.8% Implied Market Capitalization 306,035,735 $11,149 $11,323 $11,629 $11,935 $12,241 $12,547 $12,854 $13,160 $13,466 $13,772 Implied Value of Public Float (19.6%) 60,015,942 $2,186 $2,221 $2,281 $2,341 $2,401 $2,461 $2,521 $2,581 $2,641 $2,701


1 n 44 financial services transactions larger than $1.0 billion in the last 5 years indicated the following: 2 l Operating companies had a median premium to 2 days prior to announcement of 22.6% and a mean of 23.9% l 50%+ cash considerations have higher premiums with a median of 22.7% and mean of 25.8% l Banks & Thrifts have lower premiums with a median of 9.8% and mean of 10.1% l Overall the median was 12.1% and mean of 15.8% n This comparison is not apples-to-apples given these transactions are not affiliated party (all are change-in-control transactions) Deal Value ($ in millions) Premium to 2 Days Prior (%) Operating Companies Median $ 2,846.2 22.6 (n = 18) Mean $ 4,799.5 23.9 50+% Cash Consideration Median $ 2,151.0 22.7 (n = 13) Mean $ 2,905.3 25.8 Bank & Thrift Only Median $ 2,329.3 9.8 (n = 24) Mean $ 3,743.2 10.1 Full List of Transactions Median $ 2,389.2 12.1 (n = 44) Mean $ 4,084.1 15.81 n 44 financial services transactions larger than $1.0 billion in the last 5 years indicated the following: 2 l Operating companies had a median premium to 2 days prior to announcement of 22.6% and a mean of 23.9% l 50%+ cash considerations have higher premiums with a median of 22.7% and mean of 25.8% l Banks & Thrifts have lower premiums with a median of 9.8% and mean of 10.1% l Overall the median was 12.1% and mean of 15.8% n This comparison is not apples-to-apples given these transactions are not affiliated party (all are change-in-control transactions) Deal Value ($ in millions) Premium to 2 Days Prior (%) Operating Companies Median $ 2,846.2 22.6 (n = 18) Mean $ 4,799.5 23.9 50+% Cash Consideration Median $ 2,151.0 22.7 (n = 13) Mean $ 2,905.3 25.8 Bank & Thrift Only Median $ 2,329.3 9.8 (n = 24) Mean $ 3,743.2 10.1 Full List of Transactions Median $ 2,389.2 12.1 (n = 44) Mean $ 4,084.1 15.8

Deal Value Deal Value to Earnings Deal Value to Premium to Buyer Target Announcement Date ($ in mm) Trailing Forward Tang. Book Market Price Regions Bank EnerBank USA 6/8/2021 $960 12.5x NA 3.06x NA Investor Group (Apollo / Varde) OneMain Holdings 1/4/2018 NA NA NA NA NA (1) Discover Bank Student Loan Corporation 9/17/2010 $600 5.3x NA 0.46x 41.8% General Motors Holdings AmeriCredit Corp. 7/22/2010 $3,325 15.1x 16.0x 1.50x 24.4% (2) Investor Group (Ceberus Capital General Motors Acceptance 4/2/2006 $14,000 5.8x NA 0.73x NA Mgmt / Aozora Bank) Corporation HSBC Holdings Metris Companies 8/4/2005 $1,543 12.6x NA 1.86x 1.1% Washington Mutual Providian Financial Corporation 6/5/2005 $6,399 14.0x 11.8x 1.93x 4.2% HSBC Holdings Household International 11/14/2002 $14,861 8.5x 6.7x 1.54x 33.5% Citigroup Associate First Capital Corp. 9/6/2000 $31,132 20.7x 18.3x 3.01x 51.8% Household International Beneficial Corp. 4/7/1998 $8,543 33.7x 27.5x 4.82x 15.0% High $31,132 33.7x 27.5x 4.82x 51.8% Median $6,399 12.6x 16.0x 1.86x 24.4% Mean $9,040 14.2x 16.1x 2.10x 24.5% Low $600 5.3x 6.7x 0.46x 1.1% Note: This comparison is not apples-to-apples given these transactions are not affiliated party (all are change-in-control transactions)Deal Value Deal Value to Earnings Deal Value to Premium to Buyer Target Announcement Date ($ in mm) Trailing Forward Tang. Book Market Price Regions Bank EnerBank USA 6/8/2021 $960 12.5x NA 3.06x NA Investor Group (Apollo / Varde) OneMain Holdings 1/4/2018 NA NA NA NA NA (1) Discover Bank Student Loan Corporation 9/17/2010 $600 5.3x NA 0.46x 41.8% General Motors Holdings AmeriCredit Corp. 7/22/2010 $3,325 15.1x 16.0x 1.50x 24.4% (2) Investor Group (Ceberus Capital General Motors Acceptance 4/2/2006 $14,000 5.8x NA 0.73x NA Mgmt / Aozora Bank) Corporation HSBC Holdings Metris Companies 8/4/2005 $1,543 12.6x NA 1.86x 1.1% Washington Mutual Providian Financial Corporation 6/5/2005 $6,399 14.0x 11.8x 1.93x 4.2% HSBC Holdings Household International 11/14/2002 $14,861 8.5x 6.7x 1.54x 33.5% Citigroup Associate First Capital Corp. 9/6/2000 $31,132 20.7x 18.3x 3.01x 51.8% Household International Beneficial Corp. 4/7/1998 $8,543 33.7x 27.5x 4.82x 15.0% High $31,132 33.7x 27.5x 4.82x 51.8% Median $6,399 12.6x 16.0x 1.86x 24.4% Mean $9,040 14.2x 16.1x 2.10x 24.5% Low $600 5.3x 6.7x 0.46x 1.1% Note: This comparison is not apples-to-apples given these transactions are not affiliated party (all are change-in-control transactions)

n l l l l Deal Stock Price Total Initial Final Initial Value Before Initial Final Rounds Premium to Premium to Increase to 2 Annc. Date Buyer Target ($ mm) Offer or Rumor Offer Offer of Offers Initial Stock Price Initial Stock Price Initial Offer 11/15/2018 Employers Mutual Casualty Co EMC Insurance Group Inc. $371 $23.83 $30.00 $36.00 4 25.9% 51.1% 20.0% 01/09/2018 Investor Group AmTrust Financial Services $1,390 $10.15 $12.25 $14.75 4 20.7% 45.3% 20.4% 03/07/2016 Great American Insurance Co National Interstate Corp. $315 $22.61 $30.00 $32.50 4 32.7% 43.7% 8.3% 04/01/2014 Hilltop Holdings Inc. SWS Group, Inc. $260 $6.06 $7.00 $7.75 3 15.5% 27.9% 10.7% 12/16/2013 KKR & Co. L.P. KKR Financial Holdings Inc. $2,609 $9.90 $10.56 $12.79 4 6.7% 29.2% 21.1% 11/12/2012 Annaly Capital Management Inc CreXus Investment Corp $876 $11.10 $12.50 $13.05 4 12.6% 17.6% 4.4% 11/12/2012 Leucadia National Corp Jefferies Group Inc $2,924 $14.27 $16.46 $17.66 2 15.4% 23.7% 7.3% 10/13/2008 Banco Santander SA Sovereign Bancorp Inc $1,910 $3.81 $3.81 $3.81 1 0.0% 0.0% 0.0% 08/12/2008 Bank of Tokyo-Mitsubishi UFJ Ltd UnionBanCal Corp,CA $3,808 $53.02 $58.00 $73.50 3 9.4% 38.6% 26.7% 03/10/2008 Nationwide Mutual Insurance Co Nationwide Finl Svcs Inc $2,471 $40.00 $47.20 $52.25 3 18.0% 30.6% 10.7% 07/17/2007 Alfa Mutual Alfa Corp $833 $15.20 $17.60 $22.00 5 15.8% 44.7% 25.0% 11/20/2006 Toronto-Dominion Bank TD Banknorth Inc $3,201 $28.81 $32-34 $32.33 6 14.5% 12.2% (2.0%) Mean 3.6 15.6% 30.4% 12.7% Median 4.0 15.4% 29.9% 10.7%n l l l l Deal Stock Price Total Initial Final Initial Value Before Initial Final Rounds Premium to Premium to Increase to 2 Annc. Date Buyer Target ($ mm) Offer or Rumor Offer Offer of Offers Initial Stock Price Initial Stock Price Initial Offer 11/15/2018 Employers Mutual Casualty Co EMC Insurance Group Inc. $371 $23.83 $30.00 $36.00 4 25.9% 51.1% 20.0% 01/09/2018 Investor Group AmTrust Financial Services $1,390 $10.15 $12.25 $14.75 4 20.7% 45.3% 20.4% 03/07/2016 Great American Insurance Co National Interstate Corp. $315 $22.61 $30.00 $32.50 4 32.7% 43.7% 8.3% 04/01/2014 Hilltop Holdings Inc. SWS Group, Inc. $260 $6.06 $7.00 $7.75 3 15.5% 27.9% 10.7% 12/16/2013 KKR & Co. L.P. KKR Financial Holdings Inc. $2,609 $9.90 $10.56 $12.79 4 6.7% 29.2% 21.1% 11/12/2012 Annaly Capital Management Inc CreXus Investment Corp $876 $11.10 $12.50 $13.05 4 12.6% 17.6% 4.4% 11/12/2012 Leucadia National Corp Jefferies Group Inc $2,924 $14.27 $16.46 $17.66 2 15.4% 23.7% 7.3% 10/13/2008 Banco Santander SA Sovereign Bancorp Inc $1,910 $3.81 $3.81 $3.81 1 0.0% 0.0% 0.0% 08/12/2008 Bank of Tokyo-Mitsubishi UFJ Ltd UnionBanCal Corp,CA $3,808 $53.02 $58.00 $73.50 3 9.4% 38.6% 26.7% 03/10/2008 Nationwide Mutual Insurance Co Nationwide Finl Svcs Inc $2,471 $40.00 $47.20 $52.25 3 18.0% 30.6% 10.7% 07/17/2007 Alfa Mutual Alfa Corp $833 $15.20 $17.60 $22.00 5 15.8% 44.7% 25.0% 11/20/2006 Toronto-Dominion Bank TD Banknorth Inc $3,201 $28.81 $32-34 $32.33 6 14.5% 12.2% (2.0%) Mean 3.6 15.6% 30.4% 12.7% Median 4.0 15.4% 29.9% 10.7%

n n l l l ln n l l l l


Holder Common Stock Held Ownership (%) Market Value ($M) Position Date 1 Banco Santander SA 245,593,555 80.3% 8,920 3/19/2021 2 FMR LLC 13,764,436 4.5% 500 3/31/2021 3 Dimensional Fund Advisors LP 6,293,010 2.1% 229 3/31/2021 4 Vanguard Group Inc. 5,883,634 1.9% 214 3/31/2021 5 BlackRock Inc. 5,800,790 1.9% 211 3/31/2021 6 Canyon Capital Advisors LLC 2,986,928 1.0% 108 3/31/2021 7 Arrowstreet Capital Ltd. Partnership 1,699,801 0.6% 62 3/31/2021 8 Rubric Capital Management LP 1,561,595 0.5% 57 3/31/2021 9 Goldman Sachs Asset Management LP 1,161,547 0.4% 42 3/31/2021 10 Citadel Advisors LLC 1,054,586 0.3% 38 3/31/2021 11 Charles Schwab Investment Management Inc. 975,159 0.3% 35 3/31/2021 12 Norges Bank Investment Management 954,869 0.3% 35 12/31/2020 13 Geode Capital Management LLC 845,588 0.3% 31 3/31/2021 14 State Street Global Advisors Inc. 814,765 0.3% 30 3/31/2021 15 LSV Asset Management 790,700 0.3% 29 3/31/2021 16 Invesco Capital Management LLC 728,616 0.2% 26 3/31/2021 17 Water Street Capital Inc. 670,032 0.2% 24 3/31/2021 18 Marshall Wace North America L.P. 653,491 0.2% 24 3/31/2021 19 Renaissance Technologies LLC 597,400 0.2% 22 3/31/2021 20 The Goldman Sachs Group Inc. 545,096 0.2% 20 3/31/2021Holder Common Stock Held Ownership (%) Market Value ($M) Position Date 1 Banco Santander SA 245,593,555 80.3% 8,920 3/19/2021 2 FMR LLC 13,764,436 4.5% 500 3/31/2021 3 Dimensional Fund Advisors LP 6,293,010 2.1% 229 3/31/2021 4 Vanguard Group Inc. 5,883,634 1.9% 214 3/31/2021 5 BlackRock Inc. 5,800,790 1.9% 211 3/31/2021 6 Canyon Capital Advisors LLC 2,986,928 1.0% 108 3/31/2021 7 Arrowstreet Capital Ltd. Partnership 1,699,801 0.6% 62 3/31/2021 8 Rubric Capital Management LP 1,561,595 0.5% 57 3/31/2021 9 Goldman Sachs Asset Management LP 1,161,547 0.4% 42 3/31/2021 10 Citadel Advisors LLC 1,054,586 0.3% 38 3/31/2021 11 Charles Schwab Investment Management Inc. 975,159 0.3% 35 3/31/2021 12 Norges Bank Investment Management 954,869 0.3% 35 12/31/2020 13 Geode Capital Management LLC 845,588 0.3% 31 3/31/2021 14 State Street Global Advisors Inc. 814,765 0.3% 30 3/31/2021 15 LSV Asset Management 790,700 0.3% 29 3/31/2021 16 Invesco Capital Management LLC 728,616 0.2% 26 3/31/2021 17 Water Street Capital Inc. 670,032 0.2% 24 3/31/2021 18 Marshall Wace North America L.P. 653,491 0.2% 24 3/31/2021 19 Renaissance Technologies LLC 597,400 0.2% 22 3/31/2021 20 The Goldman Sachs Group Inc. 545,096 0.2% 20 3/31/2021

Premium to Cash Deal Vale 2 Days Prior Consideration Buyer / Target Name Target Industry Announcement Date ($ in millions) (%) (%) 1) The Allstate Corp./National General Holdings Corporation Multi-line Insurance 7/7/2020 3,727 53.48 100 2) Macquarie Group Ltd./Waddell & Reed Financial, Inc. Asset Management and Custody Banks 12/2/2020 1,645 51.88 100 3) Virtu Financial, Inc./KCG Holdings, Inc. Investment Banking and Brokerage 3/15/2017 1,420 44.51 100 4) Morgan Stanley/Eaton Vance Corp. Asset Management and Custody Banks 10/8/2020 6,932 41.09 50 5) SoftBank Group Corp./Fortress Investment Group LLC Asset Management and Custody Banks 2/14/2017 3,266 36.49 100 6) Morgan Stanley/E*TRADE Financial Corporation Investment Banking and Brokerage 2/20/2020 13,127 34.15 NA 7) Hellman & Friedman LLC/Financial Engines, Inc. Asset Management and Custody Banks 4/30/2018 3,025 27.30 100 8) Kemper Corporation/Infinity Property and Casualty Corporation Property and Casualty Insurance 2/13/2018 1,324 26.58 43 9) Independent Bank Corp./Meridian Bancorp, Inc. Thrifts and Mortgage Finance 4/22/2021 1,151 23.21 NA 10) Franklin Resources, Inc./Legg Mason, Inc. Asset Management and Custody Banks 2/18/2020 4,481 22.67 100 11) CBOE Holdings, Inc./Bats Global Markets, Inc. Other Diversified Financial Services 9/26/2016 3,104 22.51 31 12) Fifth Third Bancorp/MB Financial, Inc. Regional Banks 5/21/2018 4,617 22.38 10 13) WSFS Financial Corporation/Beneficial Bancorp, Inc. Thrifts and Mortgage Finance 8/8/2018 1,507 19.55 15 14) Cadence Bancorporation/State Bank Financial Corporation Regional Banks 5/13/2018 1,502 16.01 NA 15) Independent Bank Group, Inc./Guaranty Bancorp Regional Banks 5/22/2018 1,037 15.97 NA 16) United Bankshares, Inc./Carolina Financial Corporation Regional Banks 11/18/2019 1,119 15.90 NA 17) First Financial Bancorp./MainSource Financial Group, Inc. Regional Banks 7/25/2017 1,001 15.69 NA 18) M&T Bank Corporation/People's United Financial, Inc. Regional Banks 2/22/2021 7,599 15.44 NA 19) Investor group/Dun & Bradstreet Corporation Financial Exchanges and Data 8/8/2018 5,458 15.34 100 20) First Citizens BancShares, Inc./CIT Group Inc. Regional Banks 10/16/2020 2,159 14.51 NA 21) Two Harbors Investment Corp./CYS Investments, Inc. Mortgage REITs 4/26/2018 1,164 13.08 1 22) Webster Financial Corporation/Sterling Bancorp Regional Banks 4/19/2021 5,136 13.03 NA 23) Red Ventures LLC/Bankrate, Inc. Financial Exchanges and Data 7/3/2017 1,326 11.11 100 24) FS Investment Corporation/Corporate Capital Trust, Inc. Asset Management and Custody Banks 7/23/2018 2,309 10.36 NA 25) Prosperity Bancshares, Inc./LegacyTexas Financial Group, Inc. Regional Banks 6/17/2019 2,057 10.13 15 26) F.N.B. Corporation/Yadkin Financial Corporation Regional Banks 7/21/2016 1,487 9.87 NA 27) New York Community Bancorp, Inc./Flagstar Bancorp, Inc. Thrifts and Mortgage Finance 4/26/2021 2,559 9.74 NA 28) Virtu Financial, Inc./Investment Technology Group, Inc. Investment Banking and Brokerage 11/7/2018 1,113 9.19 100 29) Huntington Bancshares Incorporated/TCF Financial Corporation Regional Banks 12/13/2020 5,949 9.19 NA 30) CF Corporation/Fidelity & Guaranty Life Life and Health Insurance 5/24/2017 1,835 8.36 100 31) BancorpSouth Bank/Cadence Bancorporation Regional Banks 4/12/2021 2,818 8.10 NA 32) South State Corporation/CenterState Bank Corporation Regional Banks 1/27/2020 3,212 7.97 NA 33) Charles Schwab Corporation/TD Ameritrade Holding Corporation Investment Banking and Brokerage 11/25/2019 28,399 7.97 NA 34) Hartford Financial Services Group, Inc./Navigators Group, Inc. Property and Casualty Insurance 8/22/2018 2,151 7.28 100 35) Investor group/AmTrust Financial Services, Inc. Property and Casualty Insurance 1/9/2018 1,390 6.88 100 36) BB&T Corporation/SunTrust Banks, Inc. Regional Banks 2/7/2019 28,283 6.27 NA 37) TIAA Board of Overseers/EverBank Financial Corp Regional Banks 8/8/2016 2,517 5.35 NA 38) Old National Bancorp/First Midwest Bancorp, Inc. Regional Banks 6/1/2021 2,469 3.67 NA 39) Henderson Group Plc/Janus Capital Group Inc. Asset Management and Custody Banks 10/3/2016 2,668 2.93 NA 40) First Horizon National Corporation/IBERIABANK Corporation Regional Banks 11/4/2019 3,971 1.87 NA 41) Pinnacle Financial Partners, Inc./BNC Bancorp Regional Banks 1/22/2017 1,732 1.34 NA 42) Synovus Financial Corp./FCB Financial Holdings, Inc. Regional Banks 7/24/2018 2,735 (0.60) NA 43) Pacific Premier Bancorp, Inc./Opus Bank Regional Banks 2/3/2020 1,031 (0.74) NA 44) First Horizon National Corporation/Capital Bank Financial Corp. Regional Banks 5/4/2017 2,190 (2.07) 19

On 7/2/2021 the stock price closed at $40.56; 4.00% or $1.56 above the $39.00 offer $45.00 40,000,000 $40.00 35,000,000 $35.00 30,000,000 $30.00 25,000,000 $25.00 20,000,000 $20.00 15,000,000 $15.00 10,000,000 $10.00 5,000,000 $5.00 $- 0 Jan-14 Jan-15 Jan-16 Jan-17 Jan-18 Jan-19 Jan-20 Jan-21 Daily Volume Stock PriceOn 7/2/2021 the stock price closed at $40.56; 4.00% or $1.56 above the $39.00 offer $45.00 40,000,000 $40.00 35,000,000 $35.00 30,000,000 $30.00 25,000,000 $25.00 20,000,000 $20.00 15,000,000 $15.00 10,000,000 $10.00 5,000,000 $5.00 $- 0 Jan-14 Jan-15 Jan-16 Jan-17 Jan-18 Jan-19 Jan-20 Jan-21 Daily Volume Stock Price

Actuals P24 Round 1 v2 Final P23 - 10/09/20 B / (W) ($ in millions, expect per share data) 2019 2020 2021 2022 2023 2024 2020 2021 2022 2023 2020 2021 2022 2023 Total Company P&L (GAAP): Interest on Finance Receivables / Loans 5,050 5,126 5,022 5,000 5,133 5,388 5,138 5,292 5,493 5,691 (12) (270) (493) (558) Leased Vehicle Income 2,764 2,951 2,819 2,550 2,578 2,514 2,966 2,881 2,787 2,979 (16) (62) (237) (401) Other Finance and Interest Income 42 14 13 19 23 22 16 11 7 9 (2) 2 12 14 Total Finance and Interest Income 7,856 8,091 7,854 7,569 7,734 7,925 8,120 8,184 8,288 8,678 (29) (331) (719) (945) Interest Expense (1,332) (1,204) (974) (806) (714) (699) (1,207) (1,071) (978) (895) 2 97 172 181 Leased Vehicle Expense (1,862) (2,078) (1,510) (1,650) (1,811) (1,744) (2,199) (2,124) (2,067) (2,210) 121 614 417 399 Net Finance and Interest Income 4,663 4,809 5,369 5,113 5,208 5,482 4,715 4,989 5,243 5,573 94 380 (130) (365) Gross Loss (5,202) (3,406) (3,400) (5,784) (6,004) (6,173) (3,592) (6,417) (5,910) (5,854) 186 3,017 126 (150) Recoveries 2,911 2,006 2,224 3,322 3,278 3,279 1,970 3,215 3,038 3,025 36 (992) 284 253 Net Credit Loss (2,291) (1,400) (1,176) (2,462) (2,726) (2,894) (1,622) (3,201) (2,872) (2,829) 222 2,025 410 103 Loan Loss Reserve Release / (Build) 197 (965) 248 51 84 24 (1,102) 471 54 (194) 137 (223) (3) 279 Provision for Loan Losses (2,094) (2,364) (929) (2,412) (2,642) (2,871) (2,723) (2,730) (2,819) (3,023) 359 1,802 407 382 Profit Sharing (53) (121) (155) (33) (29) (27) (73) (33) (29) (35) (48) (122) (3) 6 Investment Gains (Losses), Net (407) (401) (27) - - - (425) (401) (407) (414) 25 373 407 414 Servicing Fee Income 91 74 89 94 94 95 73 69 81 73 1 21 13 21 Fees, Commissions and Other 364 344 246 181 181 179 341 422 396 408 3 (176) (216) (227) Other Income 49 18 309 275 275 274 (11) 90 69 67 29 218 205 209 Salary and Benefit Expense (511) (553) (615) (608) (612) (616) (548) (558) (547) (547) (5) (56) (62) (65) Repossession Expense (262) (160) (187) (276) (267) (272) (182) (271) (238) (236) 21 85 (38) (31) Other Operating Expense (438) (418) (537) (486) (495) (516) (403) (391) (389) (383) (15) (146) (98) (112) Operating Expenses (1,211) (1,131) (1,338) (1,371) (1,374) (1,404) (1,132) (1,220) (1,174) (1,166) 1 (118) (197) (208) Net Income Before Tax 1,354 1,210 3,255 1,572 1,439 1,454 775 1,095 1,290 1,416 435 2,160 282 23 Income Tax Expenses (360) (299) (777) (377) (345) (349) (200) (263) (310) (340) (99) (514) (68) (5) Net Income 994 911 2,478 1,195 1,094 1,105 575 832 981 1,076 336 1,646 214 17 Shares Outstanding (Diluted) 339 306 294 286 277 269 306 284 246 246 - 10 40 32 EPS (Diluted) 2.93 2.98 8.42 4.18 3.94 4.11 1.88 2.93 3.99 4.38 1.10 5.49 0.19 (0.44)Actuals P24 Round 1 v2 Final P23 - 10/09/20 B / (W) ($ in millions, expect per share data) 2019 2020 2021 2022 2023 2024 2020 2021 2022 2023 2020 2021 2022 2023 Total Company P&L (GAAP): Interest on Finance Receivables / Loans 5,050 5,126 5,022 5,000 5,133 5,388 5,138 5,292 5,493 5,691 (12) (270) (493) (558) Leased Vehicle Income 2,764 2,951 2,819 2,550 2,578 2,514 2,966 2,881 2,787 2,979 (16) (62) (237) (401) Other Finance and Interest Income 42 14 13 19 23 22 16 11 7 9 (2) 2 12 14 Total Finance and Interest Income 7,856 8,091 7,854 7,569 7,734 7,925 8,120 8,184 8,288 8,678 (29) (331) (719) (945) Interest Expense (1,332) (1,204) (974) (806) (714) (699) (1,207) (1,071) (978) (895) 2 97 172 181 Leased Vehicle Expense (1,862) (2,078) (1,510) (1,650) (1,811) (1,744) (2,199) (2,124) (2,067) (2,210) 121 614 417 399 Net Finance and Interest Income 4,663 4,809 5,369 5,113 5,208 5,482 4,715 4,989 5,243 5,573 94 380 (130) (365) Gross Loss (5,202) (3,406) (3,400) (5,784) (6,004) (6,173) (3,592) (6,417) (5,910) (5,854) 186 3,017 126 (150) Recoveries 2,911 2,006 2,224 3,322 3,278 3,279 1,970 3,215 3,038 3,025 36 (992) 284 253 Net Credit Loss (2,291) (1,400) (1,176) (2,462) (2,726) (2,894) (1,622) (3,201) (2,872) (2,829) 222 2,025 410 103 Loan Loss Reserve Release / (Build) 197 (965) 248 51 84 24 (1,102) 471 54 (194) 137 (223) (3) 279 Provision for Loan Losses (2,094) (2,364) (929) (2,412) (2,642) (2,871) (2,723) (2,730) (2,819) (3,023) 359 1,802 407 382 Profit Sharing (53) (121) (155) (33) (29) (27) (73) (33) (29) (35) (48) (122) (3) 6 Investment Gains (Losses), Net (407) (401) (27) - - - (425) (401) (407) (414) 25 373 407 414 Servicing Fee Income 91 74 89 94 94 95 73 69 81 73 1 21 13 21 Fees, Commissions and Other 364 344 246 181 181 179 341 422 396 408 3 (176) (216) (227) Other Income 49 18 309 275 275 274 (11) 90 69 67 29 218 205 209 Salary and Benefit Expense (511) (553) (615) (608) (612) (616) (548) (558) (547) (547) (5) (56) (62) (65) Repossession Expense (262) (160) (187) (276) (267) (272) (182) (271) (238) (236) 21 85 (38) (31) Other Operating Expense (438) (418) (537) (486) (495) (516) (403) (391) (389) (383) (15) (146) (98) (112) Operating Expenses (1,211) (1,131) (1,338) (1,371) (1,374) (1,404) (1,132) (1,220) (1,174) (1,166) 1 (118) (197) (208) Net Income Before Tax 1,354 1,210 3,255 1,572 1,439 1,454 775 1,095 1,290 1,416 435 2,160 282 23 Income Tax Expenses (360) (299) (777) (377) (345) (349) (200) (263) (310) (340) (99) (514) (68) (5) Net Income 994 911 2,478 1,195 1,094 1,105 575 832 981 1,076 336 1,646 214 17 Shares Outstanding (Diluted) 339 306 294 286 277 269 306 284 246 246 - 10 40 32 EPS (Diluted) 2.93 2.98 8.42 4.18 3.94 4.11 1.88 2.93 3.99 4.38 1.10 5.49 0.19 (0.44)

n n n n n n n nn n n n n n n n