
Exhibit 99.2 DECEMBER 19, 2019 MATCHING CAPITAL WITH OPPORTUNITY PACIFIC OAK STRATEGIC OPPORTUNITY REIT II Valuation and Portfolio Update
FORWARD-LOOKING STATEMENTS IMPORTANT DISCLOSURES - The information contained herein should be read in conjunction with, and is qualified by, the information in the Pacific Oak Strategic Opportunity REIT II, Inc. (“Pacific Oak Strategic Opportunity REIT II” or the “Company”) Annual Report on Form 10-K for the year ended December 31, 2018 (the “Annual Report”), filed with the Securities and Exchange Commission (“SEC”) on March 8, 2019 (the “Annual Report”), and in the Company’s Quarterly Report on Form 10-Q for the period ended September 30, 2019 (the “Quarterly Report”), filed with the SEC on November 8, 2019, including the “Risk Factors” contained therein. For a full description of the limitations, methodologies and assumptions used to value the Company’s assets and liabilities in connection with the calculation of the Company’s estimated value per share, see the Company’s Current Report on Form 8-K, filed with the SEC on December 19, 2019. FORWARD LOOKING STATEMENTS - Certain statements contained herein may be deemed to be forward-looking statements within the meaning of the Federal Private Securities Litigation Reform Act of 1995. The Company intends that such forward-looking statements be subject to the safe harbors created by Section 27A of the Securities Act of 1933, as amended, and Section 21E of the Securities Exchange Act of 1934, as amended. These statements include statements regarding the intent, belief or current expectations of the Company and members of its management team, as well as the assumptions on which such statements are based, and generally are identified by the use of words such as “may,” “will,” “seeks,” “anticipates,” “believes,” “estimates,” “expects,” “plans,” “intends,” “should” or similar expressions. Further, forward-looking statements speak only as of the date they are made, and the Company undertakes no obligation to update or revise forward-looking statements to reflect changed assumptions, the occurrence of unanticipated events or changes to future operating results over time, unless required by law. Actual results may differ materially from those contemplated by such forward-looking statements. The valuation methodology for certain of the Company’s real estate investments assumes that its properties realize the projected cash flows and exit cap rates and that investors would be willing to invest in such properties at cap rates equal to the cap rates used in the valuation. Though the appraisals and valuation estimates used in calculating the estimated value per share are Duff & Phelps, LLC (“Duff & Phelps”) best estimates as of October 31, 2019, and/or the Company’s and Pacific Oak Capital Advisors LLC’s (“the Advisor”) best estimates as of December 17, 2019, the Company can give no assurance that these estimated values will be realized by the Company. These statements also depend on factors such as future economic, competitive and market conditions, the Company’s ability to maintain occupancy levels and rental rates at its properties, and other risks identified in Part I, Item IA of the Company’s Annual Report on form 10-K for the year ended December 31, 2018, and its subsequent quarterly reports. Actual events may cause the value and returns on the Company’s investments to be less than that used for purposes of the Company’s estimated value per share. 2

OUR SPONSOR: PACIFIC OAK CAPITAL 3
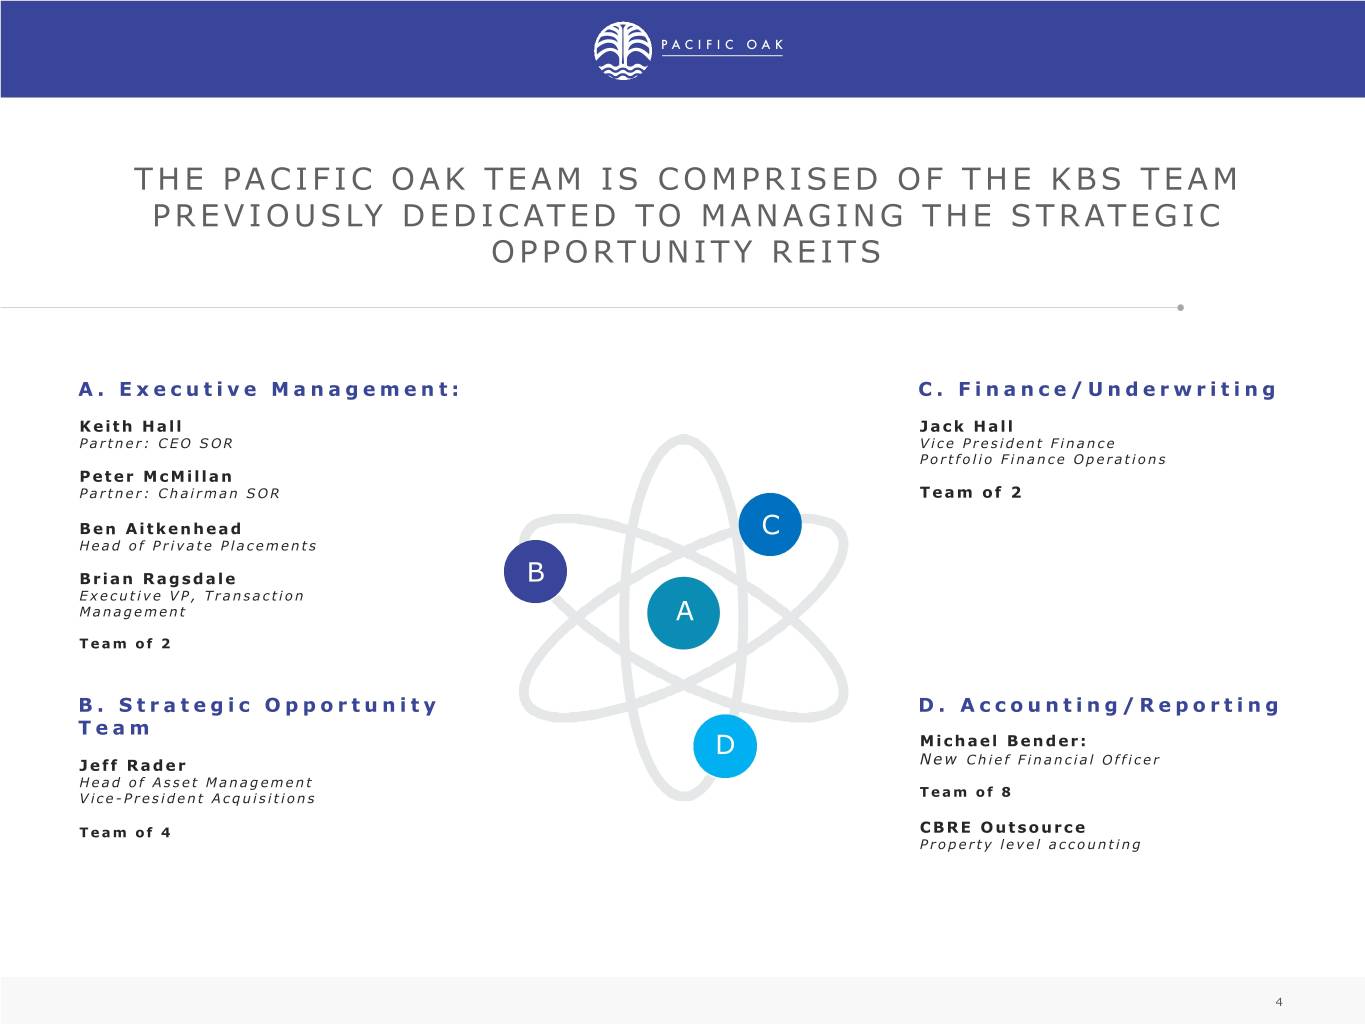
A. Executive Management: C. Finance/Underwriting Keith Hall Jack Hall Partner: CEO SOR Vice President Finance Portfolio Finance Operations Peter McMillan Partner: Chairman SOR Team of 2 Ben Aitkenhead C Head of Private Placements Brian Ragsdale B Executive VP, Transaction Management A Team of 2 B. Strategic Opportunity D. Accounting/Reporting Team D Michael Bender: Jeff Rader New Chief Financial Officer Head of Asset Management Vice- President Acquisitions Team of 8 Team of 4 CBRE Outsource Property level accounting 4
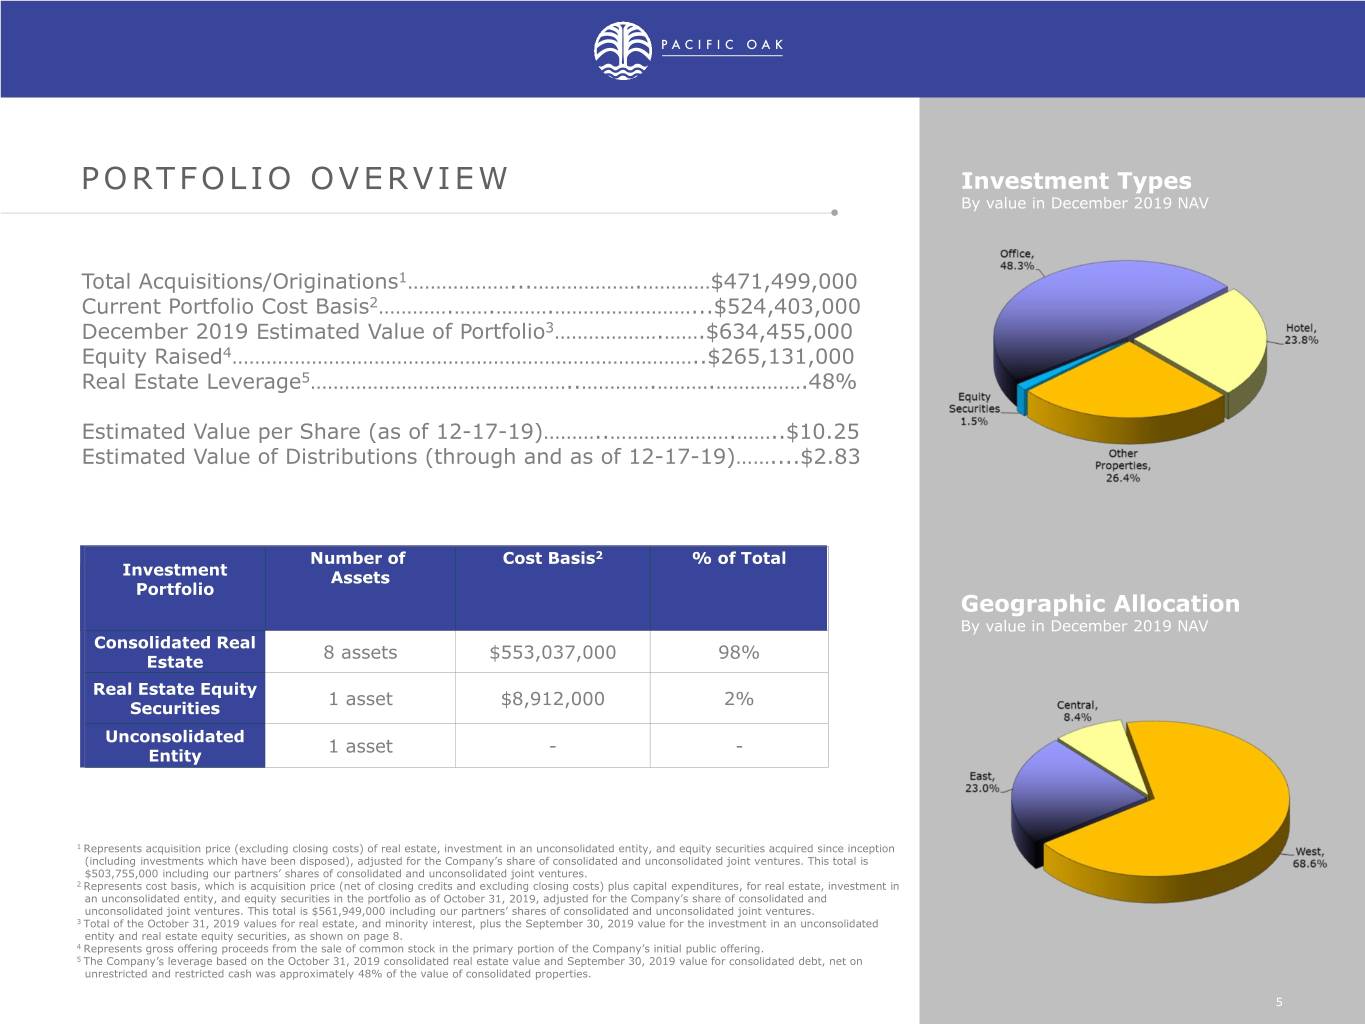
Investment Types By value in December 2019 NAV Total Acquisitions/Originations1………………...……………….…………$471,499,000 Current Portfolio Cost Basis2………….…….……….……………………...$524,403,000 December 2019 Estimated Value of Portfolio3……………….…….$634,455,000 Equity Raised4………………………………………………………………………..$265,131,000 Real Estate Leverage5………………………………………..………….……….…………….48% Estimated Value per Share (as of 12-17-19)………..………………….……..$10.25 Estimated Value of Distributions (through and as of 12-17-19)……....$2.83 Number of Cost Basis2 % of Total Investment Assets Portfolio Geographic Allocation By value in December 2019 NAV Consolidated Real 8 assets $553,037,000 98% Estate Real Estate Equity 1 asset $8,912,000 2% Securities Unconsolidated 1 asset - - Entity 1 Represents acquisition price (excluding closing costs) of real estate, investment in an unconsolidated entity, and equity securities acquired since inception (including investments which have been disposed), adjusted for the Company’s share of consolidated and unconsolidated joint ventures. This total is $503,755,000 including our partners’ shares of consolidated and unconsolidated joint ventures. 2 Represents cost basis, which is acquisition price (net of closing credits and excluding closing costs) plus capital expenditures, for real estate, investment in an unconsolidated entity, and equity securities in the portfolio as of October 31, 2019, adjusted for the Company’s share of consolidated and unconsolidated joint ventures. This total is $561,949,000 including our partners’ shares of consolidated and unconsolidated joint ventures. 3 Total of the October 31, 2019 values for real estate, and minority interest, plus the September 30, 2019 value for the investment in an unconsolidated entity and real estate equity securities, as shown on page 8. 4 Represents gross offering proceeds from the sale of common stock in the primary portion of the Company’s initial public offering. 5 The Company’s leverage based on the October 31, 2019 consolidated real estate value and September 30, 2019 value for consolidated debt, net on unrestricted and restricted cash was approximately 48% of the value of consolidated properties. 5

PACIFIC OAK SOR II DEC. 2019 VALUATION 6
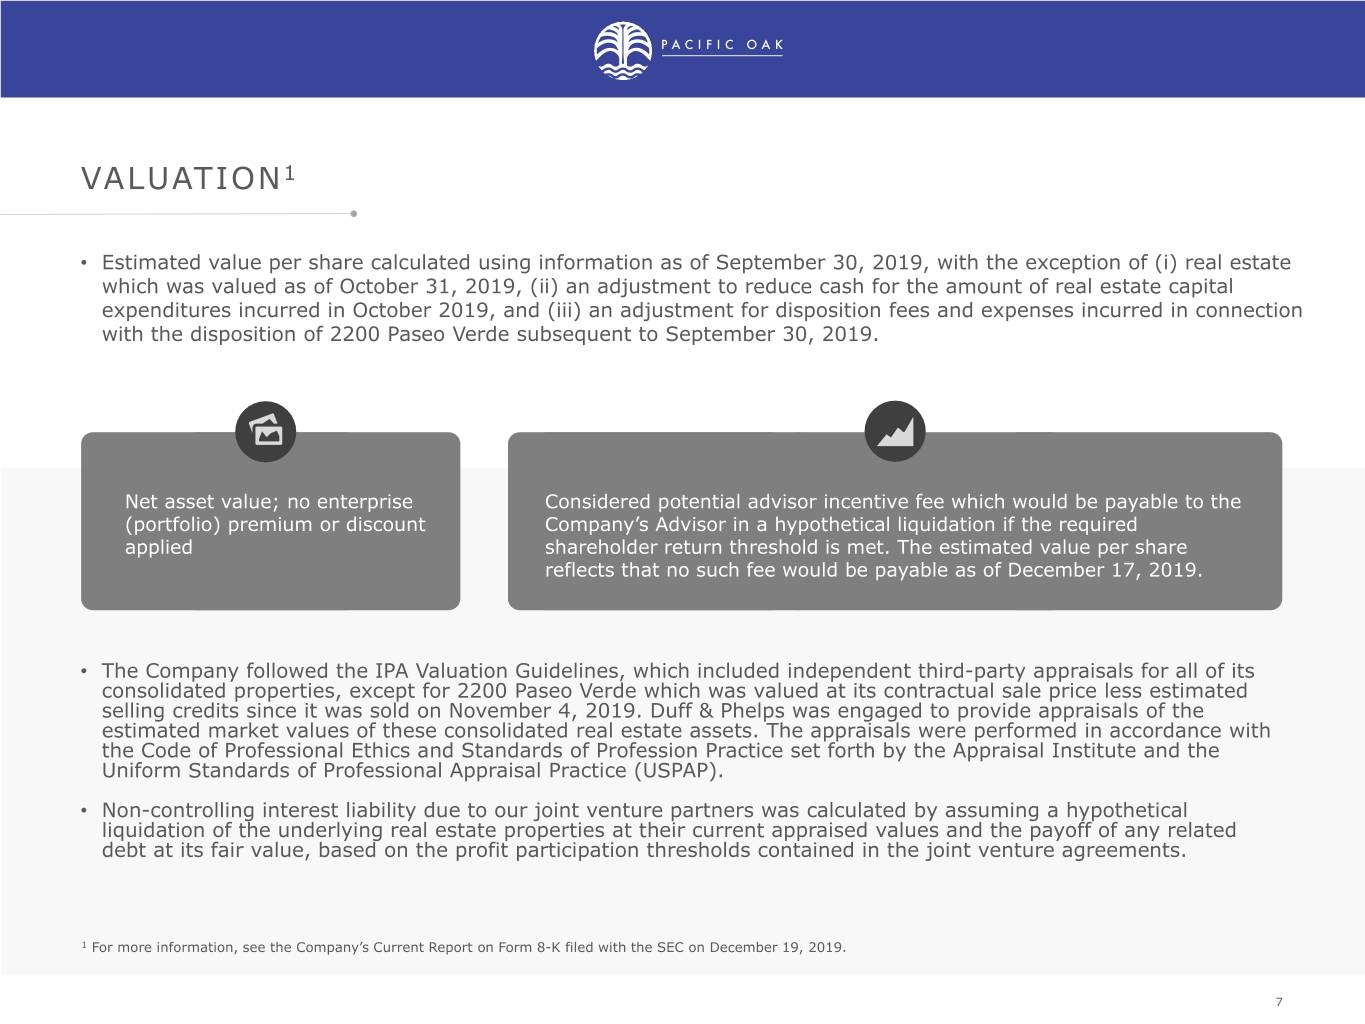
VALUATION1 • Estimated value per share calculated using information as of September 30, 2019, with the exception of (i) real estate which was valued as of October 31, 2019, (ii) an adjustment to reduce cash for the amount of real estate capital expenditures incurred in October 2019, and (iii) an adjustment for disposition fees and expenses incurred in connection with the disposition of 2200 Paseo Verde subsequent to September 30, 2019. Net asset value; no enterprise Considered potential advisor incentive fee which would be payable to the (portfolio) premium or discount Company’s Advisor in a hypothetical liquidation if the required applied shareholder return threshold is met. The estimated value per share reflects that no such fee would be payable as of December 17, 2019. • The Company followed the IPA Valuation Guidelines, which included independent third-party appraisals for all of its consolidated properties, except for 2200 Paseo Verde which was valued at its contractual sale price less estimated selling credits since it was sold on November 4, 2019. Duff & Phelps was engaged to provide appraisals of the estimated market values of these consolidated real estate assets. The appraisals were performed in accordance with the Code of Professional Ethics and Standards of Profession Practice set forth by the Appraisal Institute and the Uniform Standards of Professional Appraisal Practice (USPAP). • Non-controlling interest liability due to our joint venture partners was calculated by assuming a hypothetical liquidation of the underlying real estate properties at their current appraised values and the payoff of any related debt at its fair value, based on the profit participation thresholds contained in the joint venture agreements. 1 For more information, see the Company’s Current Report on Form 8-K filed with the SEC on December 19, 2019. 7
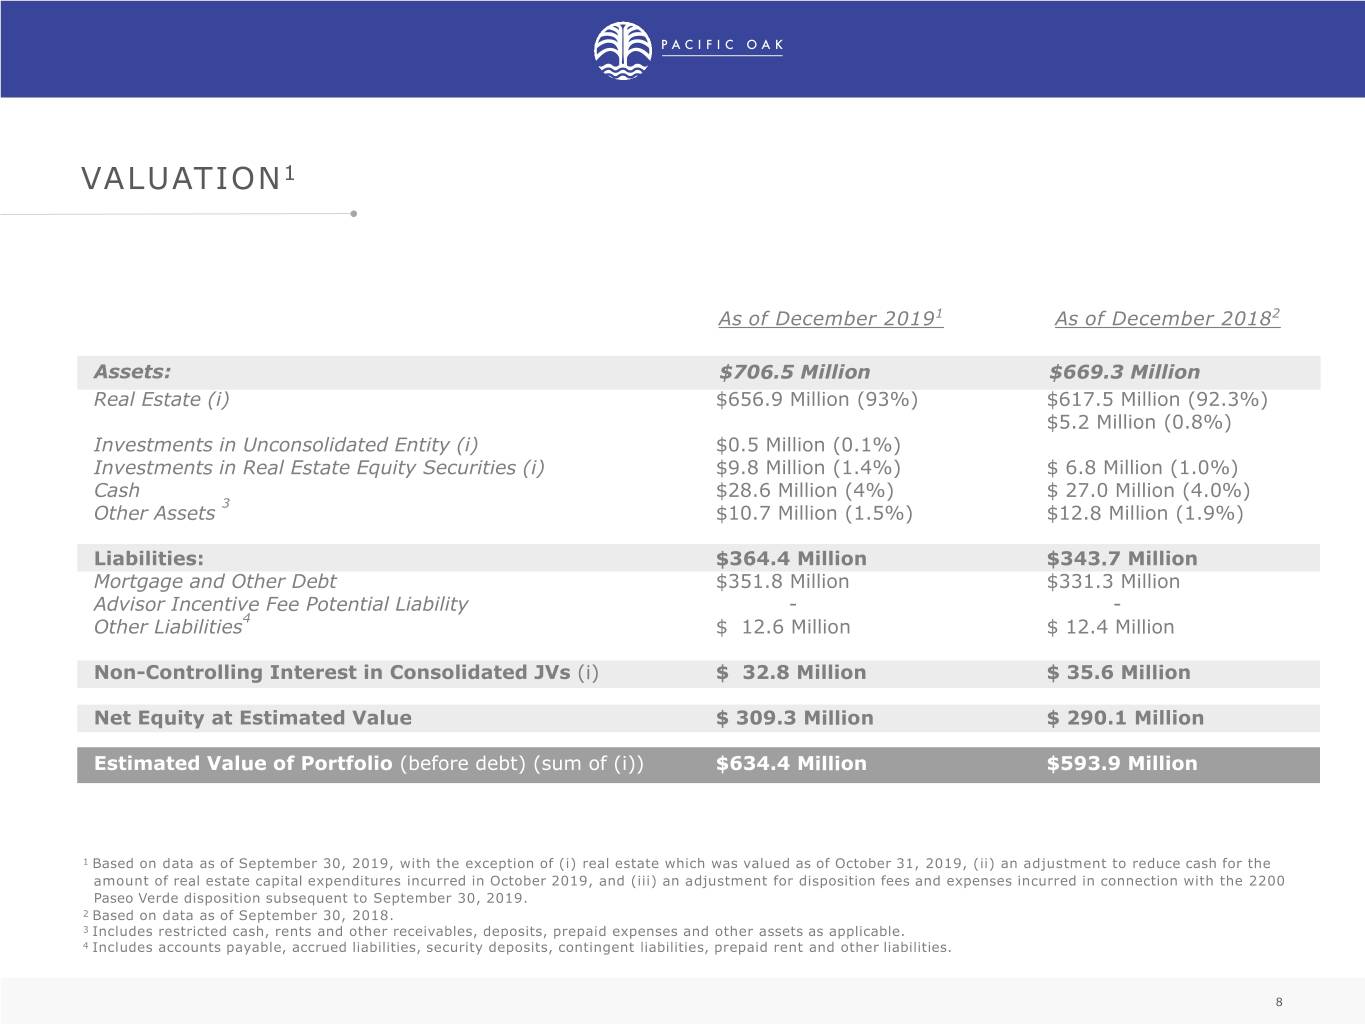
VALUATION1 As of December 20191 As of December 20182 Assets: $706.5 Million $669.3 Million Real Estate (i) $656.9 Million (93%) $617.5 Million (92.3%) $5.2 Million (0.8%) Investments in Unconsolidated Entity (i) $0.5 Million (0.1%) Investments in Real Estate Equity Securities (i) $9.8 Million (1.4%) $ 6.8 Million (1.0%) Cash $28.6 Million (4%) $ 27.0 Million (4.0%) 3 Other Assets $10.7 Million (1.5%) $12.8 Million (1.9%) Liabilities: $364.4 Million $343.7 Million Mortgage and Other Debt $351.8 Million $331.3 Million Advisor Incentive Fee Potential Liability - - 4 Other Liabilities $ 12.6 Million $ 12.4 Million Non-Controlling Interest in Consolidated JVs (i) $ 32.8 Million $ 35.6 Million Net Equity at Estimated Value $ 309.3 Million $ 290.1 Million Estimated Value of Portfolio (before debt) (sum of (i)) $634.4 Million $593.9 Million 1 Based on data as of September 30, 2019, with the exception of (i) real estate which was valued as of October 31, 2019, (ii) an adjustment to reduce cash for the amount of real estate capital expenditures incurred in October 2019, and (iii) an adjustment for disposition fees and expenses incurred in connection with the 2200 Paseo Verde disposition subsequent to September 30, 2019. 2 Based on data as of September 30, 2018. 3 Includes restricted cash, rents and other receivables, deposits, prepaid expenses and other assets as applicable. 4 Includes accounts payable, accrued liabilities, security deposits, contingent liabilities, prepaid rent and other liabilities. 8
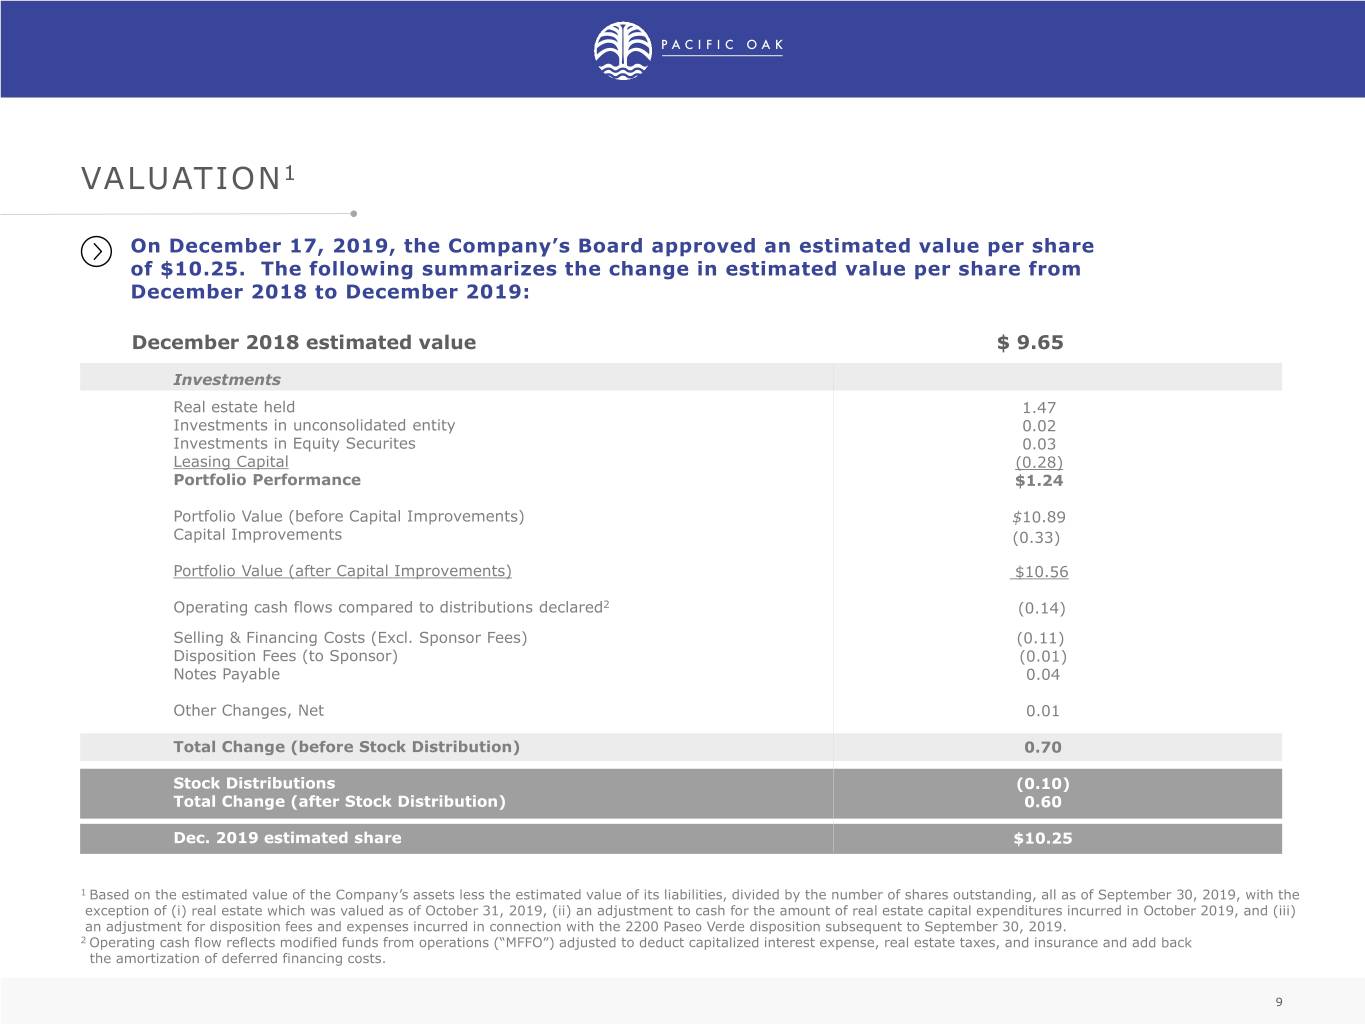
VALUATION1 On December 17, 2019, the Company’s Board approved an estimated value per share of $10.25. The following summarizes the change in estimated value per share from December 2018 to December 2019: December 2018 estimated value $ 9.65 Investments Real estate held 1.47 Investments in unconsolidated entity 0.02 Investments in Equity Securites 0.03 Leasing Capital (0.28) Portfolio Performance $1.24 $12.85 Portfolio Value (before Capital Improvements) $10.89 Capital Improvements (0.33) Portfolio Value (after Capital Improvements) $10.56 Operating cash flows compared to distributions declared2 (0.14) Selling & Financing Costs (Excl. Sponsor Fees) (0.11) Disposition Fees (to Sponsor) (0.01) Notes Payable 0.04 Other Changes, Net 0.01 Total Change (before Stock Distribution) 0.70 Stock Distributions (0.10) Total Change (after Stock Distribution) 0.60 Dec. 2019 estimated share $10.25 1 Based on the estimated value of the Company’s assets less the estimated value of its liabilities, divided by the number of shares outstanding, all as of September 30, 2019, with the exception of (i) real estate which was valued as of October 31, 2019, (ii) an adjustment to cash for the amount of real estate capital expenditures incurred in October 2019, and (iii) an adjustment for disposition fees and expenses incurred in connection with the 2200 Paseo Verde disposition subsequent to September 30, 2019. 2 Operating cash flow reflects modified funds from operations (“MFFO”) adjusted to deduct capitalized interest expense, real estate taxes, and insurance and add back the amortization of deferred financing costs. 9
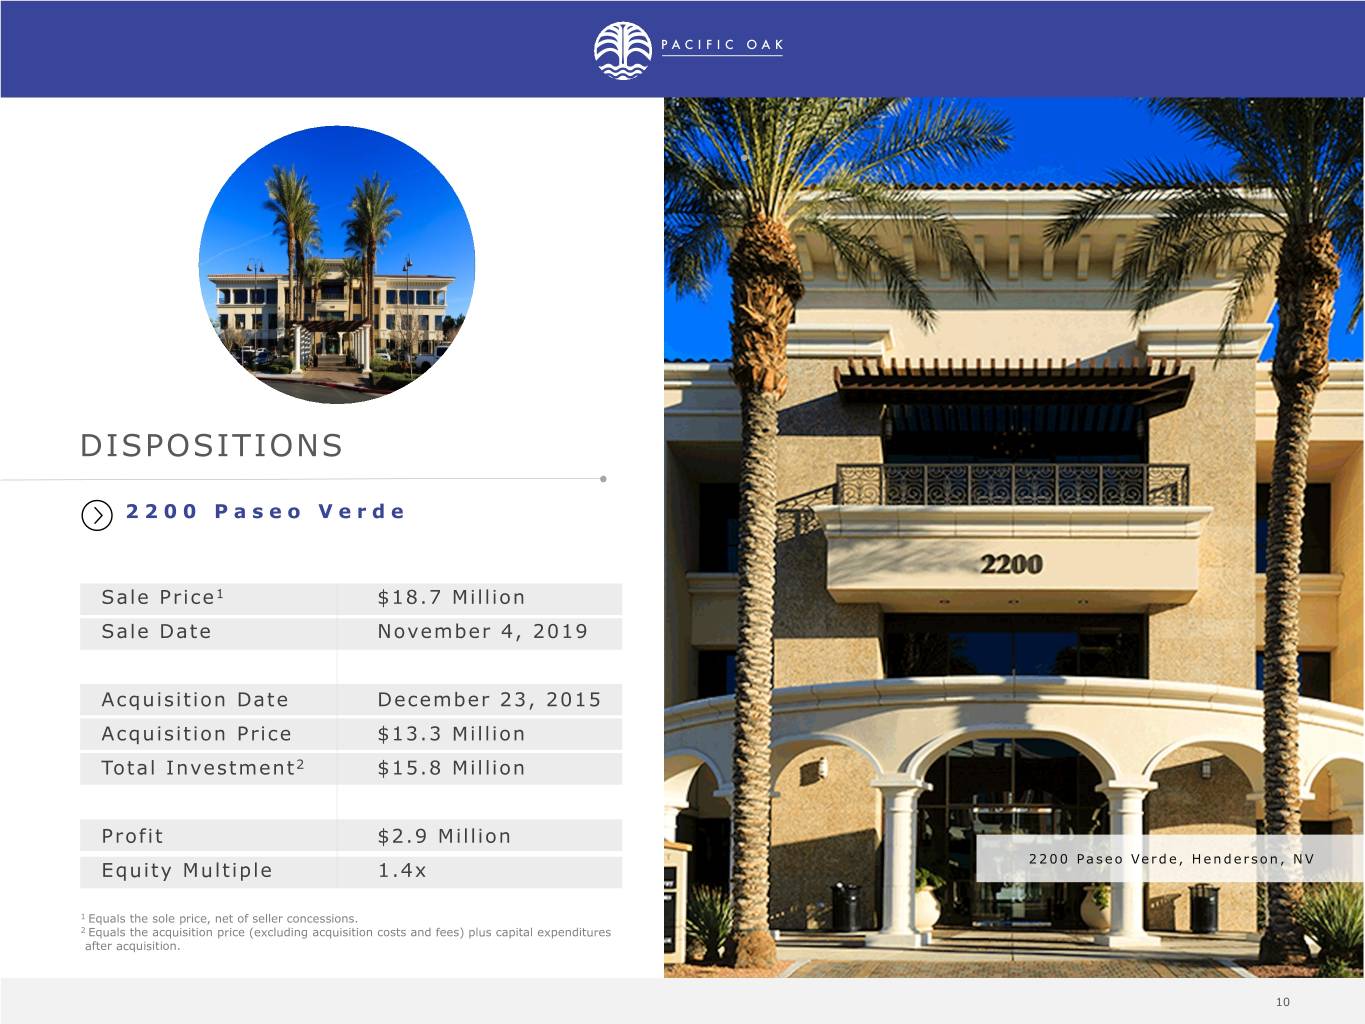
DISPOSITIONS 2200 Paseo Verde Sale Price1 $18.7 Million Sale Date November 4, 2019 Acquisition Date December 23, 2015 Acquisition Price $13.3 Million Total Investment2 $15.8 Million Profit $2.9 Million 2200 Paseo Verde, Henderson, NV Equity Multiple 1.4x 1 Equals the sole price, net of seller concessions. 2 Equals the acquisition price (excluding acquisition costs and fees) plus capital expenditures after acquisition. 10 10
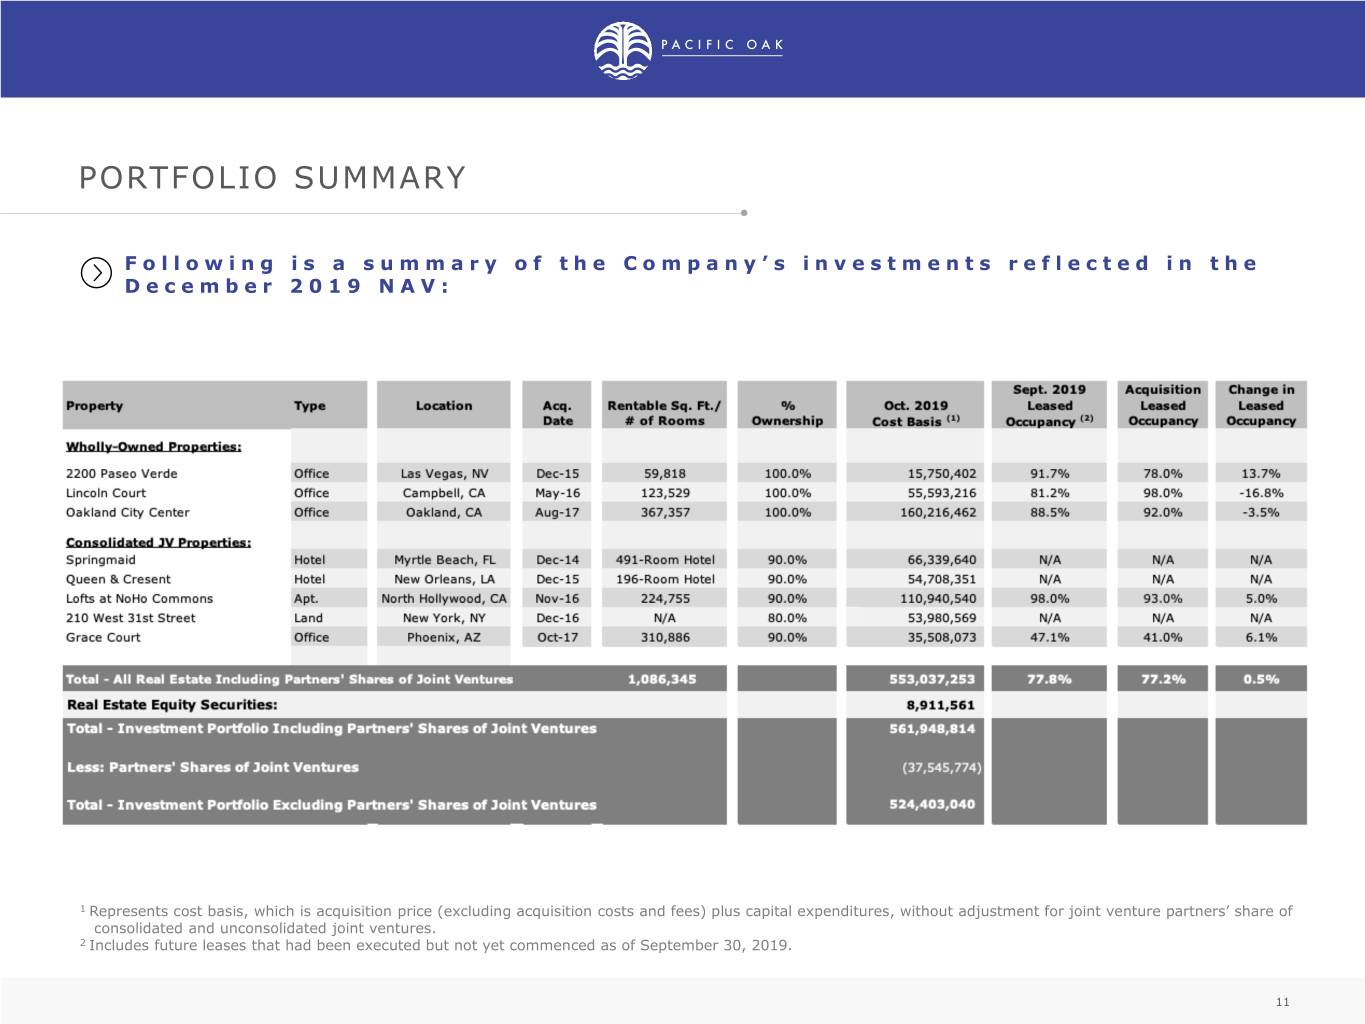
PORTFOLIO SUMMARY Following is a summary of the Company’s investments reflected in the December 2019 NAV: 1 Represents cost basis, which is acquisition price (excluding acquisition costs and fees) plus capital expenditures, without adjustment for joint venture partners’ share of consolidated and unconsolidated joint ventures. 2 Includes future leases that had been executed but not yet commenced as of September 30, 2019. 11
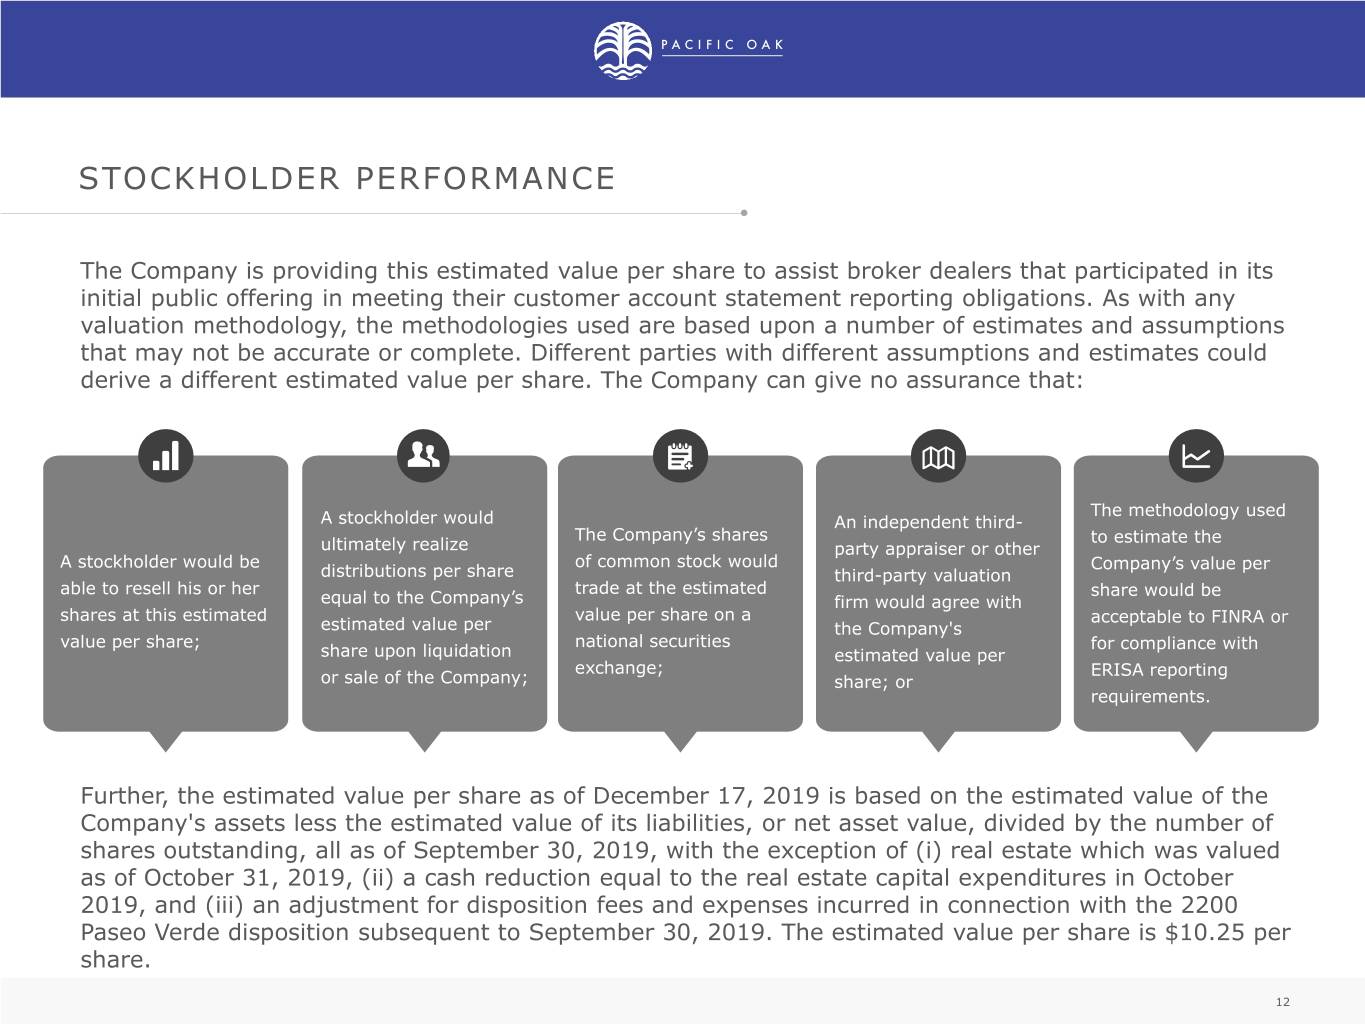
STOCKHOLDER PERFORMANCE The Company is providing this estimated value per share to assist broker dealers that participated in its initial public offering in meeting their customer account statement reporting obligations. As with any valuation methodology, the methodologies used are based upon a number of estimates and assumptions that may not be accurate or complete. Different parties with different assumptions and estimates could derive a different estimated value per share. The Company can give no assurance that: The methodology used A stockholder would An independent third- The Company’s shares to estimate the ultimately realize party appraiser or other A stockholder would be of common stock would Company’s value per distributions per share third-party valuation able to resell his or her trade at the estimated share would be equal to the Company’s firm would agree with shares at this estimated value per share on a acceptable to FINRA or estimated value per the Company's value per share; national securities for compliance with share upon liquidation estimated value per exchange; ERISA reporting or sale of the Company; share; or requirements. Further, the estimated value per share as of December 17, 2019 is based on the estimated value of the Company's assets less the estimated value of its liabilities, or net asset value, divided by the number of shares outstanding, all as of September 30, 2019, with the exception of (i) real estate which was valued as of October 31, 2019, (ii) a cash reduction equal to the real estate capital expenditures in October 2019, and (iii) an adjustment for disposition fees and expenses incurred in connection with the 2200 Paseo Verde disposition subsequent to September 30, 2019. The estimated value per share is $10.25 per share. 12
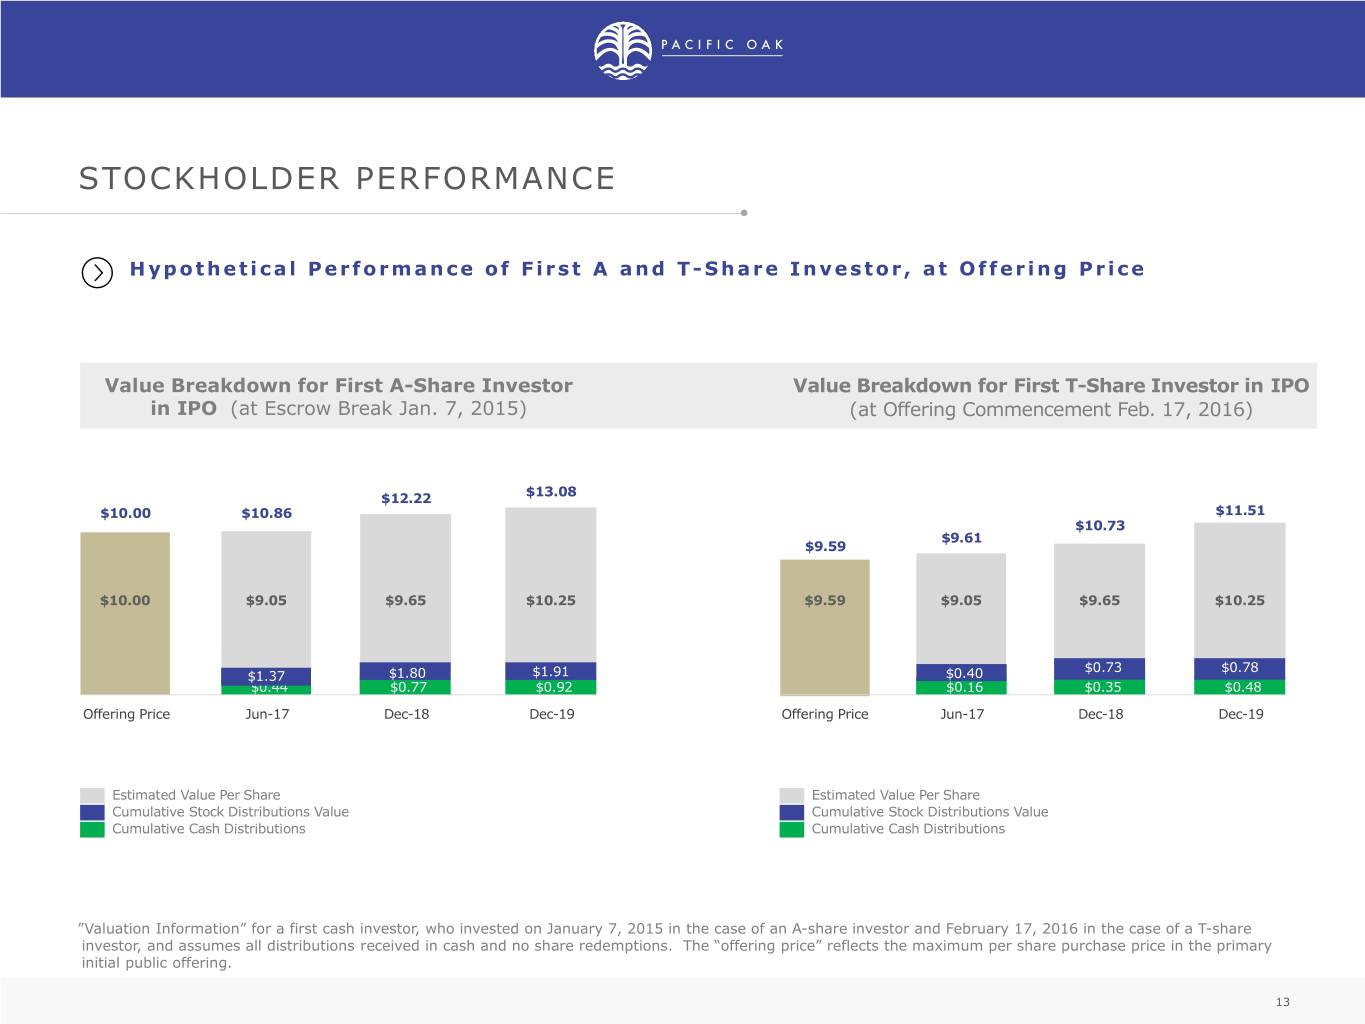
STOCKHOLDER PERFORMANCE Hypothetical Performance of First A and T- Share Investor, at Offering Price Value Breakdown for First A-Share Investor Value Breakdown for First T-Share Investor in IPO in IPO (at Escrow Break Jan. 7, 2015) (at Offering Commencement Feb. 17, 2016) $13.08 $12.22 $10.00 $10.86 $11.51 $10.73 $9.61 $9.59 $10.00 $9.05 $9.65 $10.25 $9.59 $9.05 $9.65 $10.25 $$10.730.25 $0.78 $1.37 $1.80 $1.91 $0.40 $0.44 $0.77 $0.92 $0.16 $0.35 $0.48 Offering Price Jun-17 Dec-18 Dec-19 Offering Price Jun-17 Dec-18 Dec-19 Estimated Value Per Share Estimated Value Per Share Cumulative Stock Distributions Value Cumulative Stock Distributions Value Cumulative Cash Distributions Cumulative Cash Distributions ”Valuation Information” for a first cash investor, who invested on January 7, 2015 in the case of an A-share investor and February 17, 2016 in the case of a T-share investor, and assumes all distributions received in cash and no share redemptions. The “offering price” reflects the maximum per share purchase price in the primary initial public offering. 13
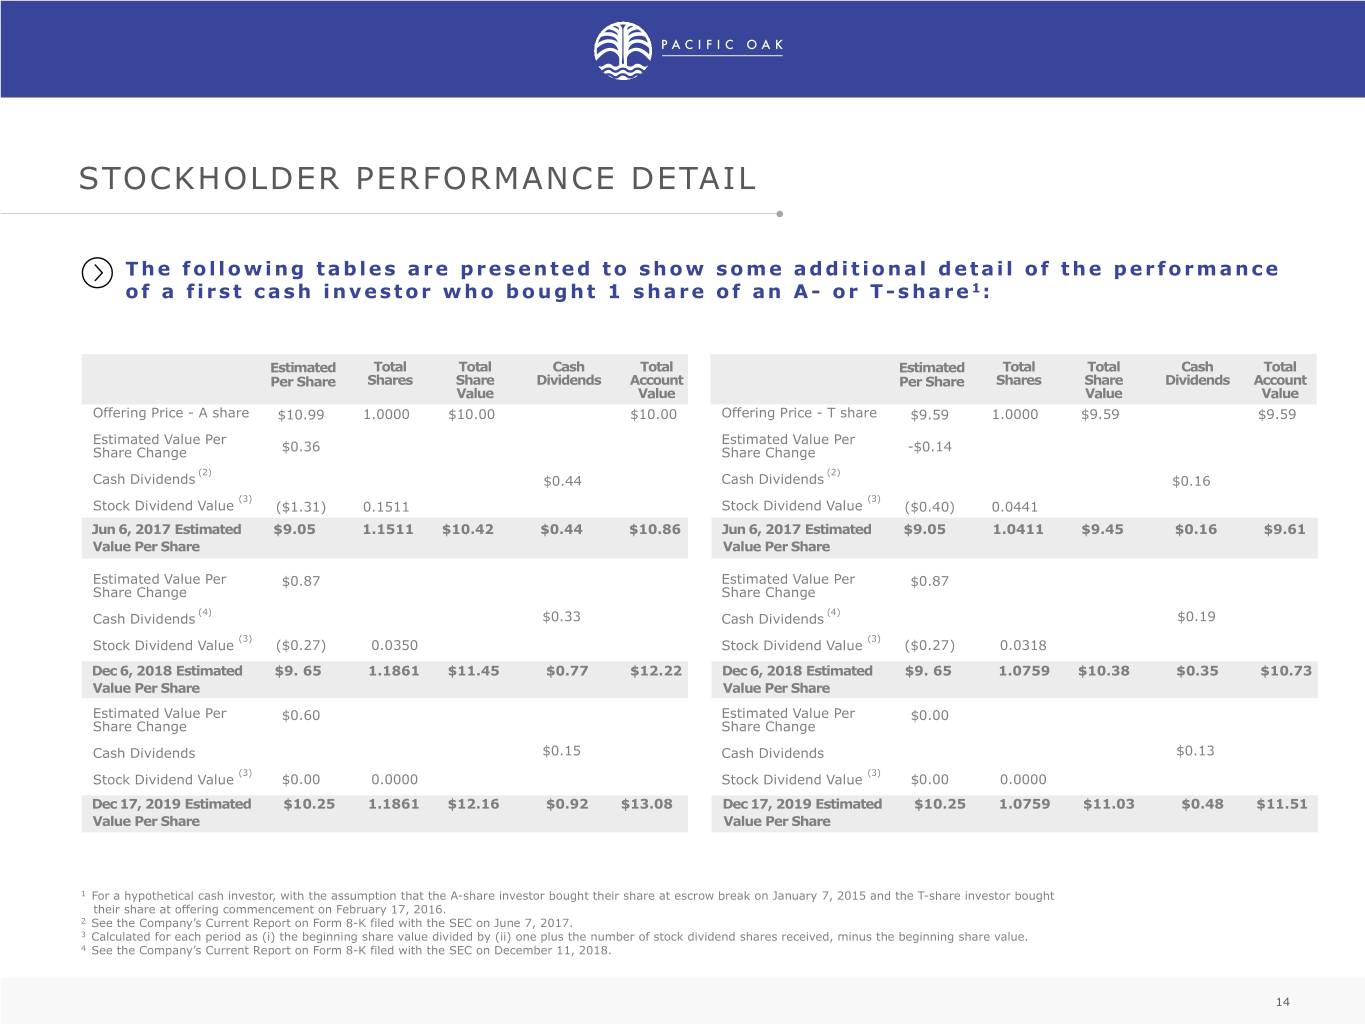
STOCKHOLDER PERFORMANCE DETAIL The following tables are presented to show some additional detail of the performance of a first cash investor who bought 1 share of an A- or T- share1 : Estimated Total Total Cash Total Estimated Total Total Cash Total Per Share Shares Share Dividends Account Per Share Shares Share Dividends Account Value Value Value Value Offering Price - A share $10.99 1.0000 $10.00 $10.00 Offering Price - T share $9.59 1.0000 $9.59 $9.59 Estimated Value Per Estimated Value Per Share Change $0.36 Share Change -$0.14 (2) (2) Cash Dividends $0.44 Cash Dividends $0.16 (3) (3) Stock Dividend Value ($1.31) 0.1511 Stock Dividend Value ($0.40) 0.0441 Jun 6, 2017 Estimated $9.05 1.1511 $10.42 $0.44 $10.86 Jun 6, 2017 Estimated $9.05 1.0411 $9.45 $0.16 $9.61 Value Per Share Value Per Share Estimated Value Per $0.87 Estimated Value Per $0.87 Share Change Share Change (4) (4) Cash Dividends $0.33 Cash Dividends $0.19 (3) (3) Stock Dividend Value ($0.27) 0.0350 Stock Dividend Value ($0.27) 0.0318 Dec 6, 2018 Estimated $9. 65 1.1861 $11.45 $0.77 $12.22 Dec 6, 2018 Estimated $9. 65 1.0759 $10.38 $0.35 $10.73 Value Per Share Value Per Share Estimated Value Per $0.60 Estimated Value Per $0.00 Share Change Share Change Cash Dividends $0.15 Cash Dividends $0.13 (3) (3) Stock Dividend Value $0.00 0.0000 Stock Dividend Value $0.00 0.0000 Dec 17, 2019 Estimated $10.25 1.1861 $12.16 $0.92 $13.08 Dec 17, 2019 Estimated $10.25 1.0759 $11.03 $0.48 $11.51 Value Per Share Value Per Share 1 For a hypothetical cash investor, with the assumption that the A-share investor bought their share at escrow break on January 7, 2015 and the T-share investor bought their share at offering commencement on February 17, 2016. 2 See the Company’s Current Report on Form 8-K filed with the SEC on June 7, 2017. 3 Calculated for each period as (i) the beginning share value divided by (ii) one plus the number of stock dividend shares received, minus the beginning share value. 4 See the Company’s Current Report on Form 8-K filed with the SEC on December 11, 2018. 14
VALUE ADD OPPORTUNITIES CONTINUE FOR SOR II 15

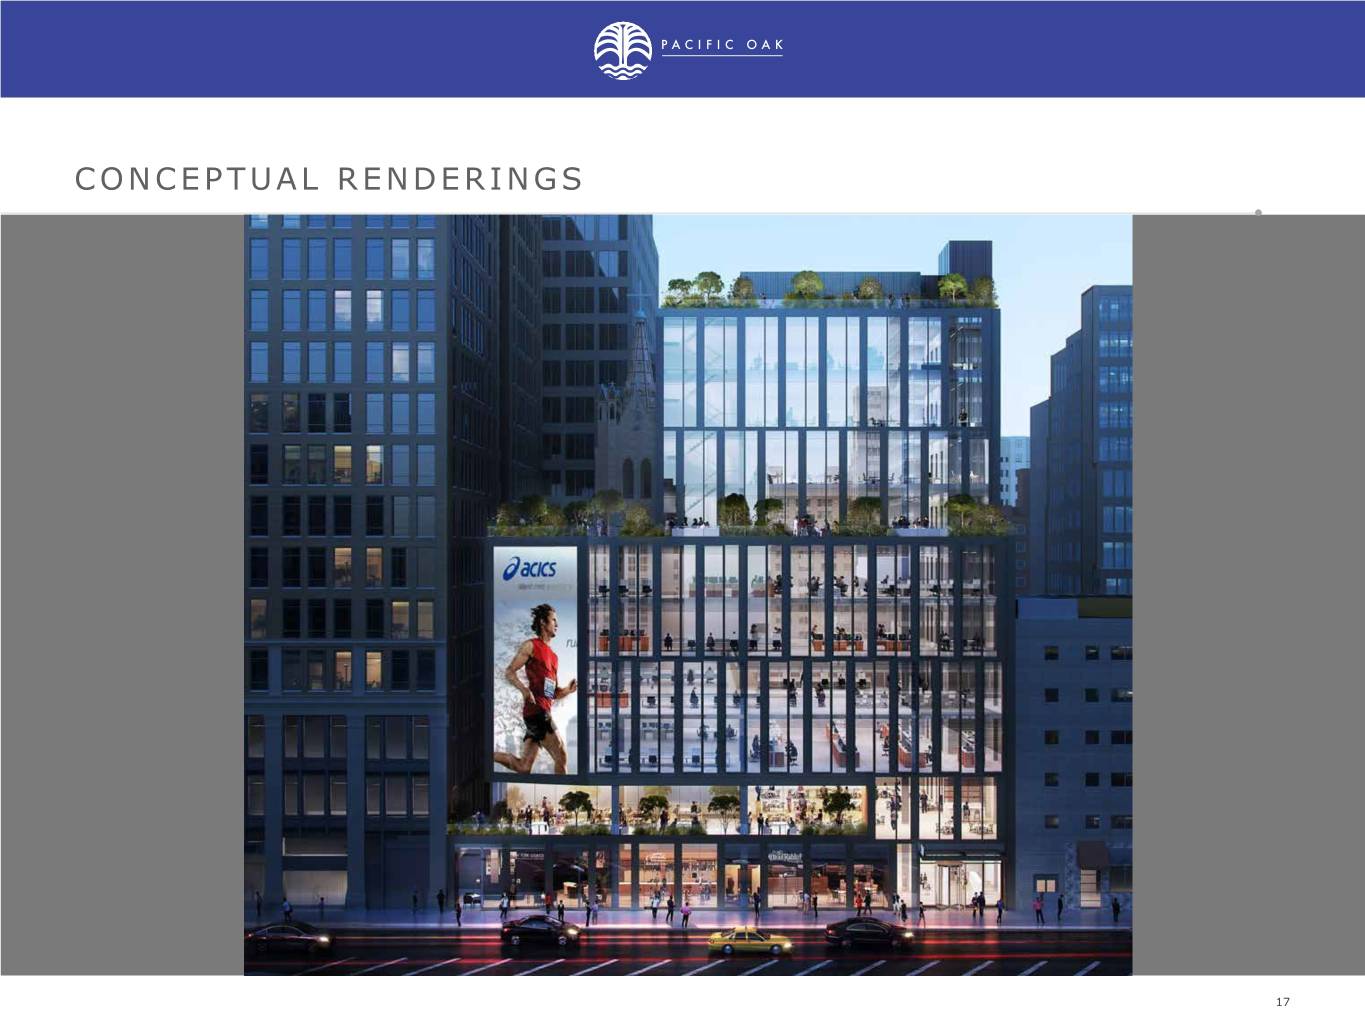
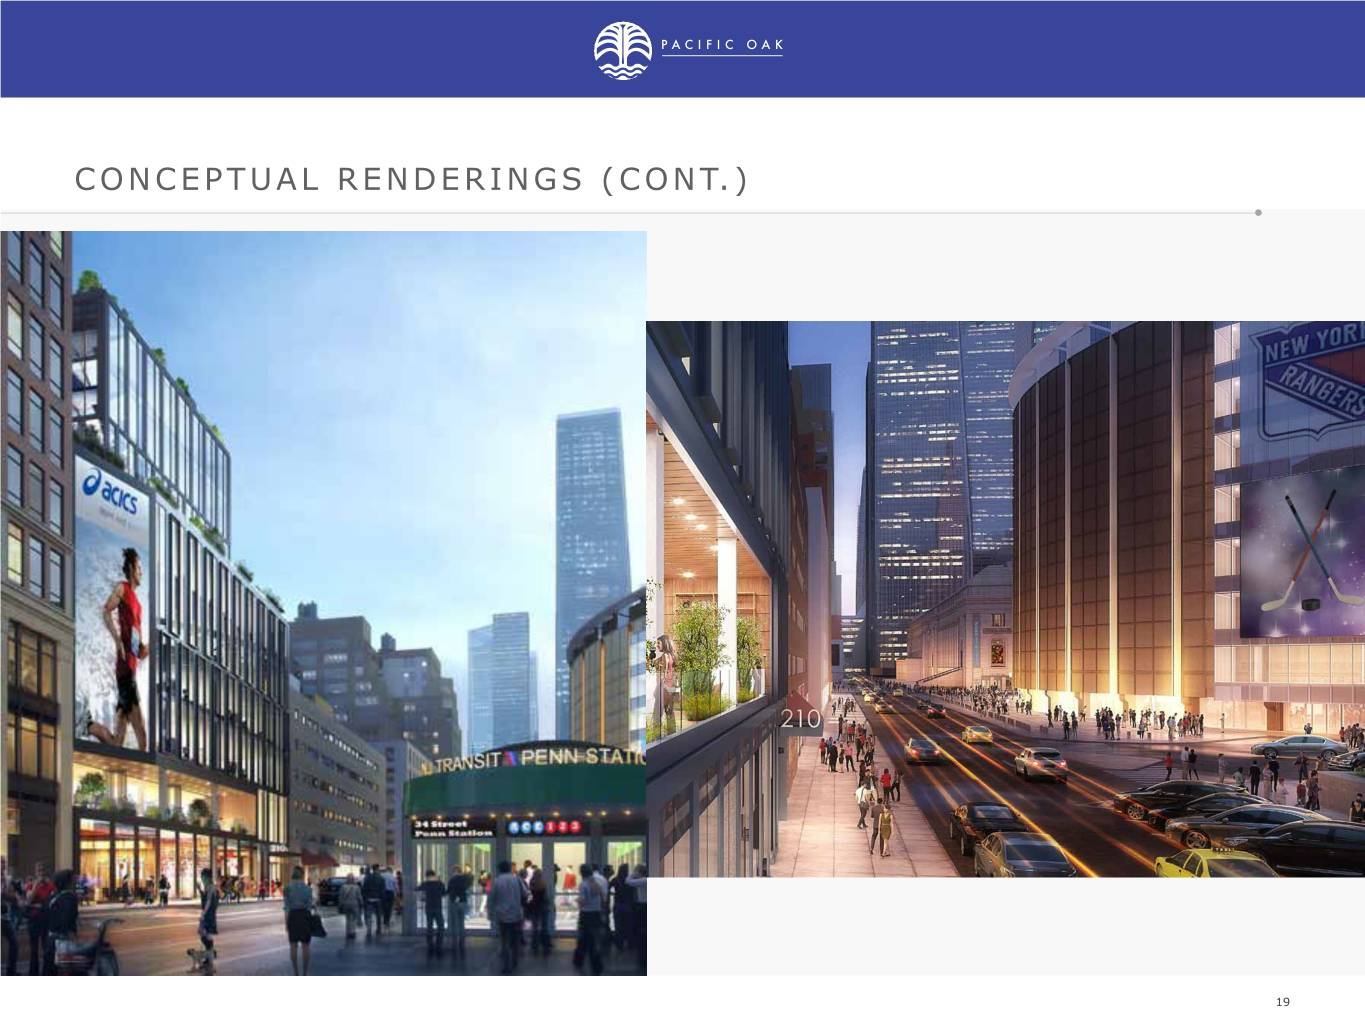
210 W 31ST STREET 16
17

18
19
2020 GOALS & OBJECTIVES CONTINUE CONTINUE with capital to evaluate portfolio projects in strategies, including accordance with a potential merger business plans, with Pacific Oak to stabilize Strategic Opportunity assets and REIT, Inc. create value 20

THANK YOU! For more information, please contact your financial advisor or Pacific Oak Capital Markets Group at (866) 722-6257. 1 - 866- PAC- OAK7 INFO@PACIFICOAKCAPITAL.COM PACIFICOAKCAPITAL.COM (1-866-722-6257) 11150 Santa Monica Blvd,Suite 400 Los Angeles, CA 90025 FOLLOW US ON LINKEDIN 21


