
YOUR SECURE APPLICATION SERVICES COMPANY Second Quarter 2017 Financial Results & Commentary July 27, 2017
Agenda Introduction • Maria Riley, Investor Relations Results Overview • Lee Chen, CEO, President and Founder Q2 2017 Financial Results & Q3 2017 Business Outlook • Tom Constantino, CFO Q & A • Lee Chen, CEO, President and Founder • Tom Constantino, CFO • Ray Smets, EVP – Worldwide Sales 2

3 Cautionary Statements and Disclosures This presentation and the accompanying oral presentation contain “forward-looking” statements that are based on our management’s beliefs and assumptions and on information currently available to management, including statements regarding our projections for our third quarter 2017 operating results, our expectations for future revenue growth and market opportunities, the performance of our products, profitability, operating margin and operating expenses, our ability to penetrate certain markets, expected product launches and the general growth of our business. We operate in very competitive and rapidly changing environments, and new risks may emerge from time to time. It is not possible for our management to predict all risks, nor can we assess the impact of all factors on our business or the extent to which any factor, or combination of factors, may cause actual results to differ materially from those contained in any forward-looking statements we may make. Forward-looking statements are subject to known and unknown risks, uncertainties, assumptions and other factors including, but not limited to, those related to execution risks related to closing key deals and improving our execution, the continued market adoption of our products, our ability to successfully anticipate market needs and opportunities, our timely development of new products and features, our ability to achieve or maintain profitability, any loss or delay of expected purchases by our largest end- customers, our ability to attract and retain new end-customers, our ability to maintain and enhance our brand and reputation, continued growth in markets relating to network security, management and analysis, the success of any future acquisitions or investments in complementary companies, products, services or technologies, the ability of our sales team to execute well, our ability to shorten our close cycles, the ability of our channel partners to sell our products, variations in product mix or geographic locations of our sales and risks associated with our presence in international markets. These factors, together with those described in our quarterly reports on Form 10-Q, annual reports on Form 10-K and other filings made with the Securities and Exchange Commission (“SEC”), may cause our actual results, performance or achievements to differ materially and adversely from those anticipated or implied by our forward-looking statements. You should not rely upon forward-looking statements as predictions of future events. Although our management believes that the expectations reflected in our forward-looking statements are reasonable, we cannot guarantee that the future results, levels of activity, performance or events and circumstances described in the forward-looking statements will be achieved or occur. Moreover, neither we, nor any other person, assume responsibility for the accuracy and completeness of the forward-looking statements. We disclaim any obligation to update information contained in these forward-looking statements whether as a result of new information, future events, or otherwise.
4 Cautionary Statements and Disclosures In addition to the U.S. GAAP financials, this presentation includes certain non-GAAP financial measures. The non-GAAP measures have limitations as analytical tools and you should not consider them in isolation or as a substitute for an analysis of our results under U.S. GAAP. There are a number of limitations related to the use of these non-GAAP financial measures versus their nearest GAAP equivalents. For example, other companies may calculate non-GAAP financial measures differently or may use other measures to evaluate their performance, all of which could reduce the usefulness of our non- GAAP financial measures as tools for comparison. A10 Networks considers these non-GAAP financial measures to be important because they provide useful measures of the operating performance of the company, exclusive of unusual events or factors that do not directly affect what we consider to be our core operating performance, and are used by the company's management for that purpose. With the exception of revenue, all financial measures discussed today are on a non-GAAP basis and have been adjusted to exclude certain charges. The use of non-GAAP measures is further discussed in the accompanying quarterly financial results press release, which has been furnished to the SEC on Form 8-K and posted on A10 Networks’ website. The press release also defines our non-GAAP financial measures. A reconciliation between GAAP and non-GAAP measures for historical periods can also be found in the appendix to this document, in the accompanying press release and on the trended quarterly financial statements posted on the company’s website. A reconciliation of non-GAAP guidance measures to corresponding GAAP measures on a forward-looking basis is not available, due to high variability and low visibility with respect to the charges which are excluded from these non-GAAP measures.

Lee Chen CEO, President and Founder

Second Quarter 2017 Summary Second Quarter Revenue of $53.7 M, a decline of 6% y/y • Revenue was below initial guidance range as a number of opportunities in our pipeline did not close in the timeframe we had expected – primarily in the U.S. and to a lesser degree in Japan • Product revenue was $32.1 M, or 60% of total revenue • Growth in APAC, excluding Japan was 12% y/y • Driven by enterprise and service provider sales • CGN solution is now deployed in 2 of the top 4 mobile providers in India Taking Action to Improve Execution and Support Growth • Increasing focus to improve the effectiveness of our go-to-market activities • Implementing cross-functional measures to increase accountability and visibility 6
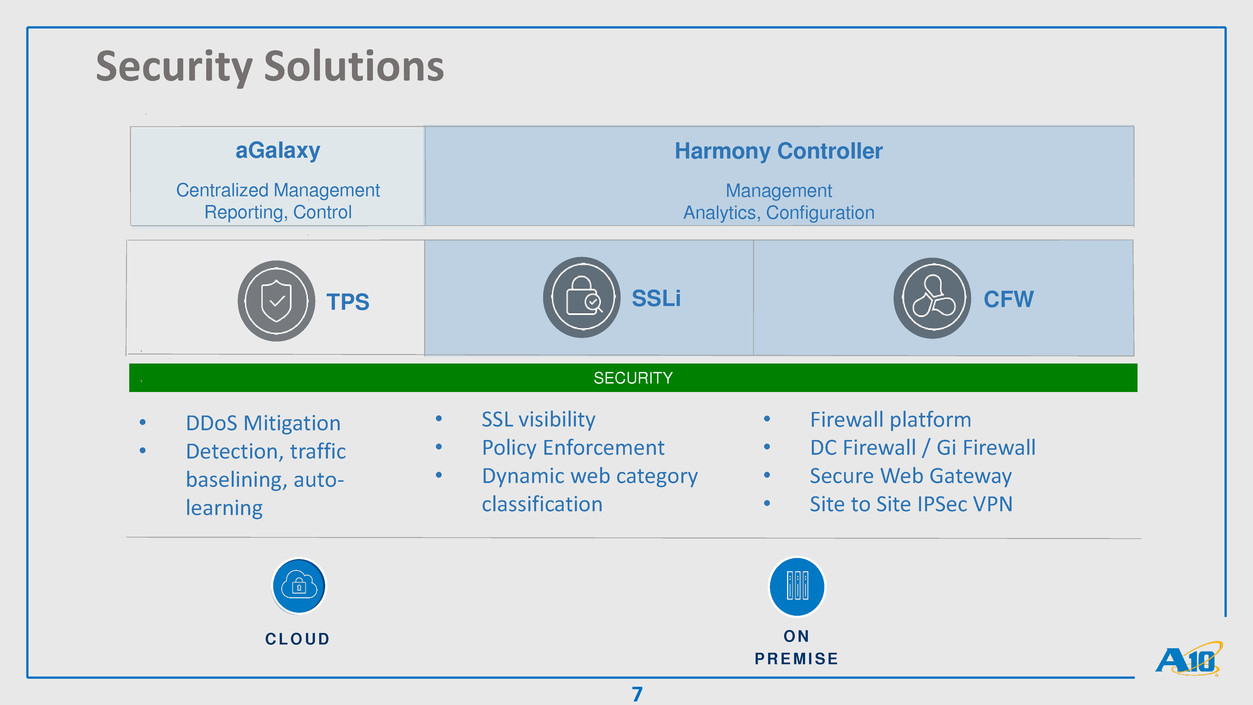
7 Security Solutions O N P RE MI S E CLO UD Harmony Controller Management Analytics, Configuration aGalaxy Centralized Management Reporting, Control SSLi CFW TPS SECURITY • DDoS Mitigation • Detection, traffic baselining, auto- learning • SSL visibility • Policy Enforcement • Dynamic web category classification • Firewall platform • DC Firewall / Gi Firewall • Secure Web Gateway • Site to Site IPSec VPN

8 ANY USER. ANY APP. ANY WHERE. PRIVATE CLOUD DATA CENTER HACKER DDOS ATTACK HOME OFFICE REMOTE USER PUBLIC CLOUD SAAS CLOUD AVAILABILITY SECURITY VISIBILITY Harmony Controller

Tom Constantino CFO 9

Revenue Trend QUARTERLY $M $179 $199 $230 2014 2015 2016 ANNUAL $M Annual $51 $57 $54 $57 $55 $64 $60 $54 Q3 Q4 Q1 Q2 Q3 Q4 Q1 Q2 2015 2016 10 2017
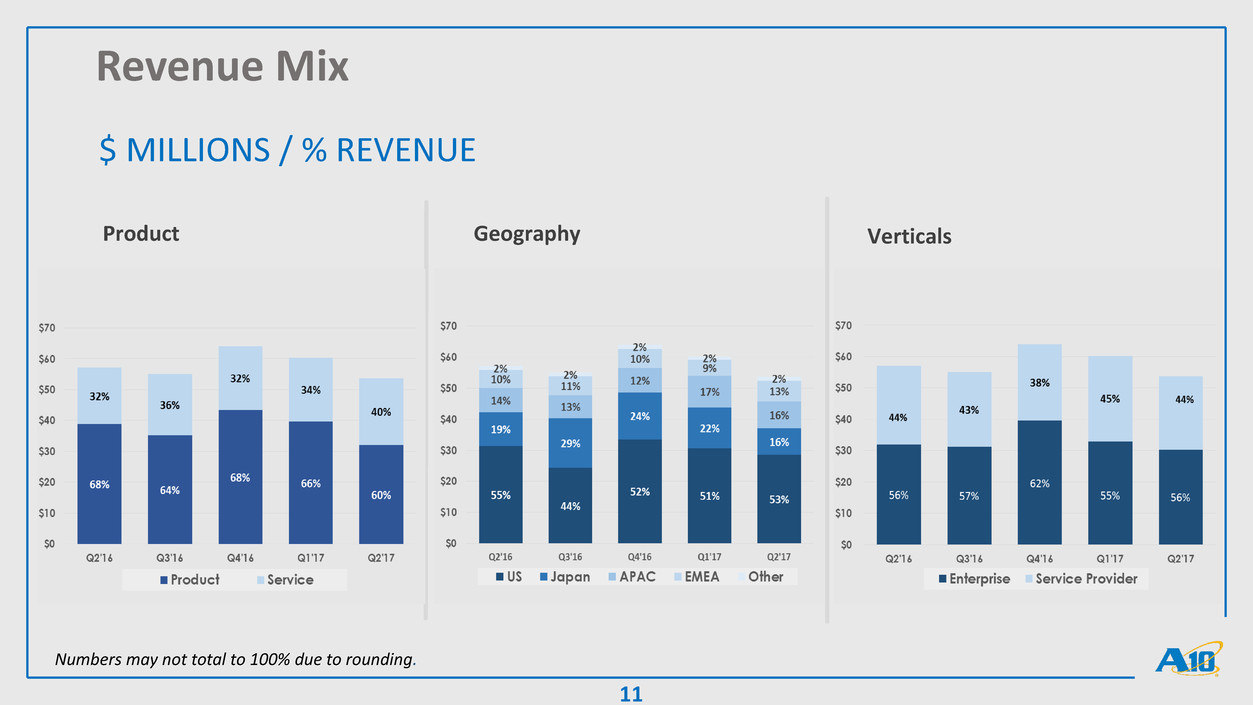
Revenue Mix $ MILLIONS / % REVENUE Product Geography Verticals Numbers may not total to 100% due to rounding. 11

Non-GAAP Gross Profit *Non-GAAP rounded financial measures. For reconciliation see Appendix. 12

Summary Financial Results NON-GAAP* FINANCIAL MEASURES ($M) Q1’2016 Q2’2016 Q3’2016 Q4’2016 Q1’2017 Q2’2017 Sales & Marketing $24.7 $25.0 $22.6 $25.1 $24.7 $23.7 Research & Development $13.3 $13.4 $14.0 $13.7 $15.1 $14.4 General, Administrative & Litigation $6.9 $6.6 $5.6 $6.1 $6.3 $6.1 Income (Loss) from Operations $(4.0) $(1.9) $0.3 $4.7 $0.2 $(2.8) Net income (loss) Per share $(0.06) $(0.02) $0.00 $0.03 $0.01 $(0.04) *Non-GAAP rounded financial measures. For reconciliation see Appendix. 13
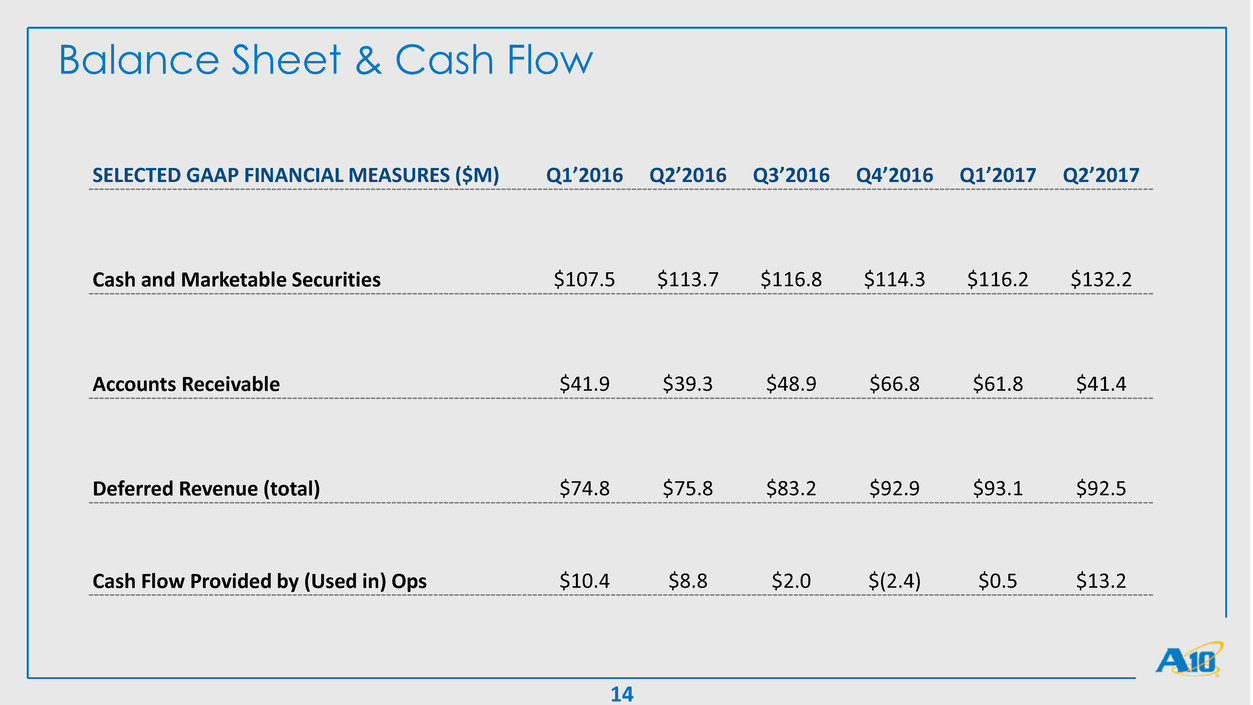
Balance Sheet & Cash Flow SELECTED GAAP FINANCIAL MEASURES ($M) Q1’2016 Q2’2016 Q3’2016 Q4’2016 Q1’2017 Q2’2017 Cash and Marketable Securities $107.5 $113.7 $116.8 $114.3 $116.2 $132.2 Accounts Receivable $41.9 $39.3 $48.9 $66.8 $61.8 $41.4 Deferred Revenue (total) $74.8 $75.8 $83.2 $92.9 $93.1 $92.5 Cash Flow Provided by (Used in) Ops $10.4 $8.8 $2.0 $(2.4) $0.5 $13.2 14
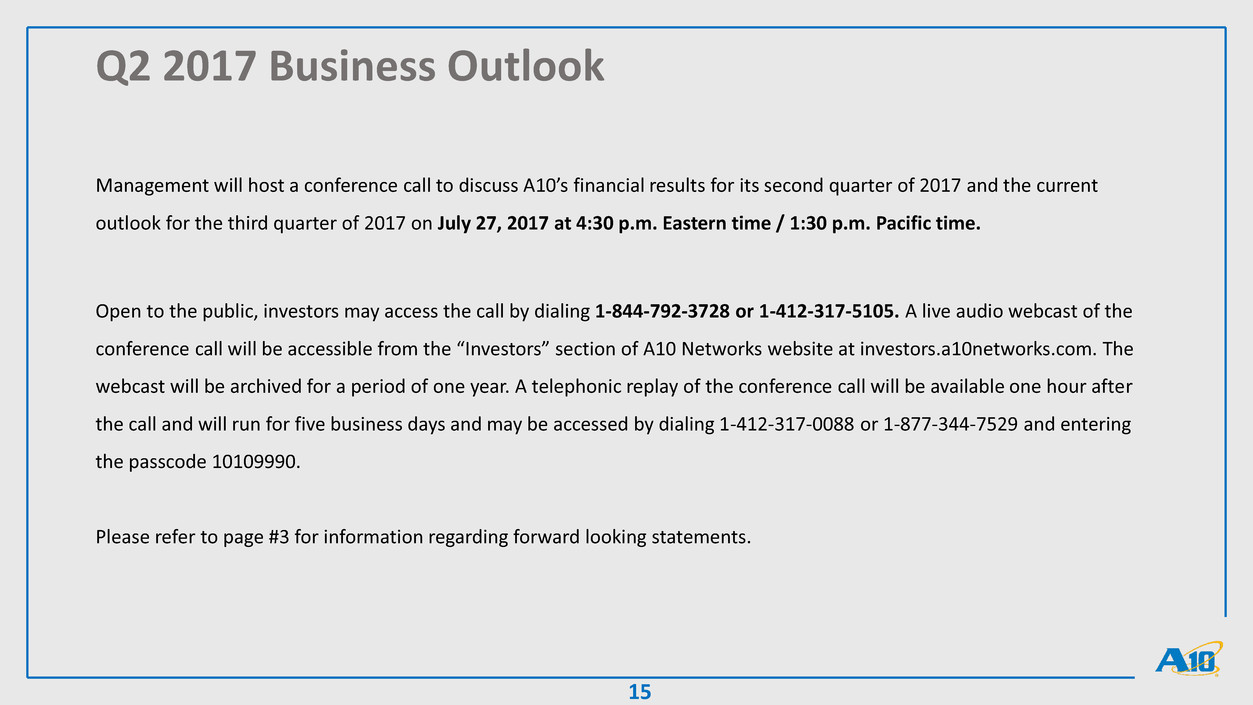
Q2 2017 Business Outlook Management will host a conference call to discuss A10’s financial results for its second quarter of 2017 and the current outlook for the third quarter of 2017 on July 27, 2017 at 4:30 p.m. Eastern time / 1:30 p.m. Pacific time. Open to the public, investors may access the call by dialing 1-844-792-3728 or 1-412-317-5105. A live audio webcast of the conference call will be accessible from the “Investors” section of A10 Networks website at investors.a10networks.com. The webcast will be archived for a period of one year. A telephonic replay of the conference call will be available one hour after the call and will run for five business days and may be accessed by dialing 1-412-317-0088 or 1-877-344-7529 and entering the passcode 10109990. Please refer to page #3 for information regarding forward looking statements. 15

Question & Answer Session LEE CHEN CEO, President and Founder TOM CONSTANTINO CFO RAY SMETS EVP Worldwide Sales 16
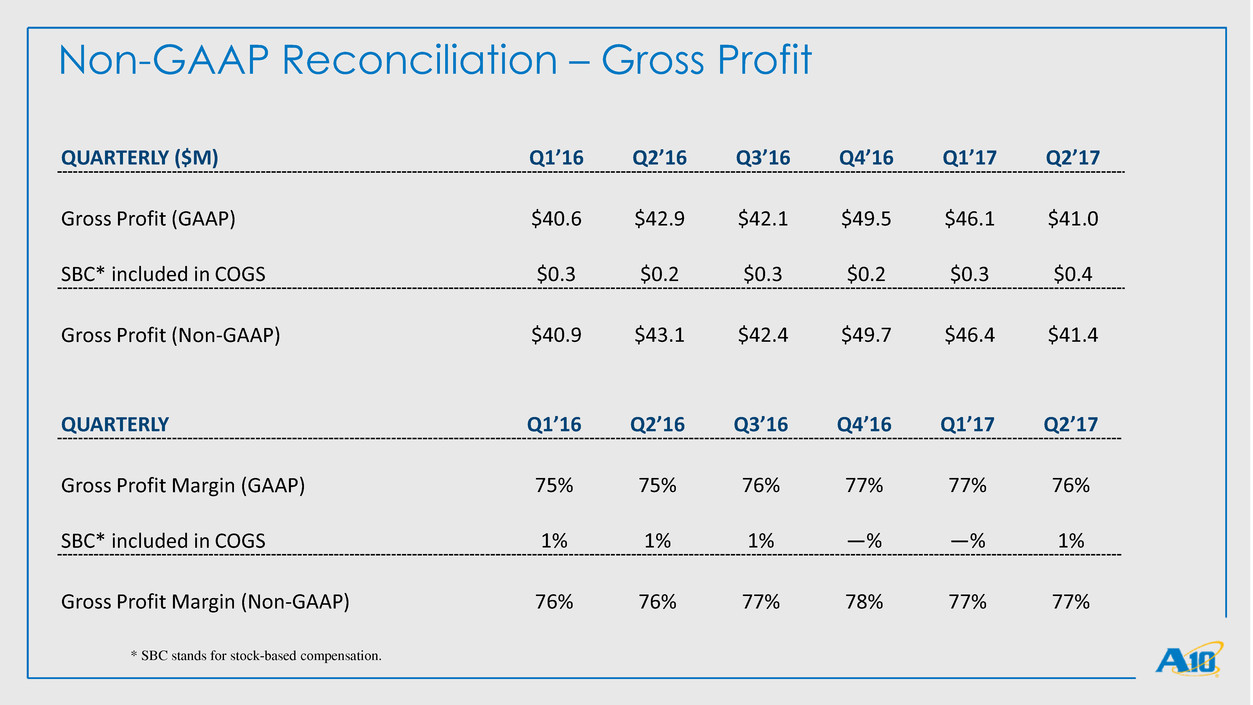
Non-GAAP Reconciliation – Gross Profit QUARTERLY Q1’16 Q2’16 Q3’16 Q4’16 Q1’17 Q2’17 Gross Profit Margin (GAAP) 75% 75% 76% 77% 77% 76% SBC* included in COGS 1% 1% 1% —% —% 1% Gross Profit Margin (Non-GAAP) 76% 76% 77% 78% 77% 77% * SBC stands for stock-based compensation. QUARTERLY ($M) Q1’16 Q2’16 Q3’16 Q4’16 Q1’17 Q2’17 Gross Profit (GAAP) $40.6 $42.9 $42.1 $49.5 $46.1 $41.0 SBC* included in COGS $0.3 $0.2 $0.3 $0.2 $0.3 $0.4 Gross Profit (Non-GAAP) $40.9 $43.1 $42.4 $49.7 $46.4 $41.4

Non-GAAP Reconciliation – Expense Items $ Millions Q1’16 Q2’16 Q3’16 Q4’16 Q1’17 Q2’17 Sales & Marketing (GAAP) $26.8 $26.8 $24.3 $26.5 $26.3 $25.6 SBC included in Sales & Marketing (2.1) (1.7) (1.7) (1.4) (1.5) (1.9) Sales & Marketing (Non-GAAP) $24.7 $25.0 $22.6 $25.1 $24.7 $23.7 R&D (GAAP) $14.8 $14.5 $16.0 $15.5 $17.0 $16.5 SBC included in R&D (1.4) (1.1) (1.7) (1.5) (1.7) (1.8) Amortization expense related to acquisition — — (0.3) (0.3) (0.3) (0.3) R&D (Non-GAAP) $13.3 $13.4 $14.0 $13.7 $15.1 $14.4 G&A (GAAP) $6.7 $7.2 $6.3 $6.9 $7.2 $7.0 SBC included in G&A (0.7) (0.8) (0.8) (0.8) (0.8) (0.9) G&A (Non-GAAP) $5.9 $6.4 $5.5 $6.1 $6.3 $6.1 Litigation (GAAP) $1.8 $0.2 $0.1 $— $— $— Litigation and Settlement (0.8) — — — — — Litigation (Non-GAAP) $1.0 $0.2 $0.1 $— $— $— Total Op Exp (GAAP) $50.0 $48.7 $46.7 $48.9 $50.5 $49.0 SBC included in Total Op Exp (4.3) (3.6) (4.3) (3.7) (4.0) (4.6) Amortization expense related to acquisition — — (0.3) (0.3) (0.3) (0.3) Litigation Settlement (0.8) — — — — — Total Op Exp (Non-GAAP) $44.9 $45.0 $42.2 $44.9 $46.2 $44.2
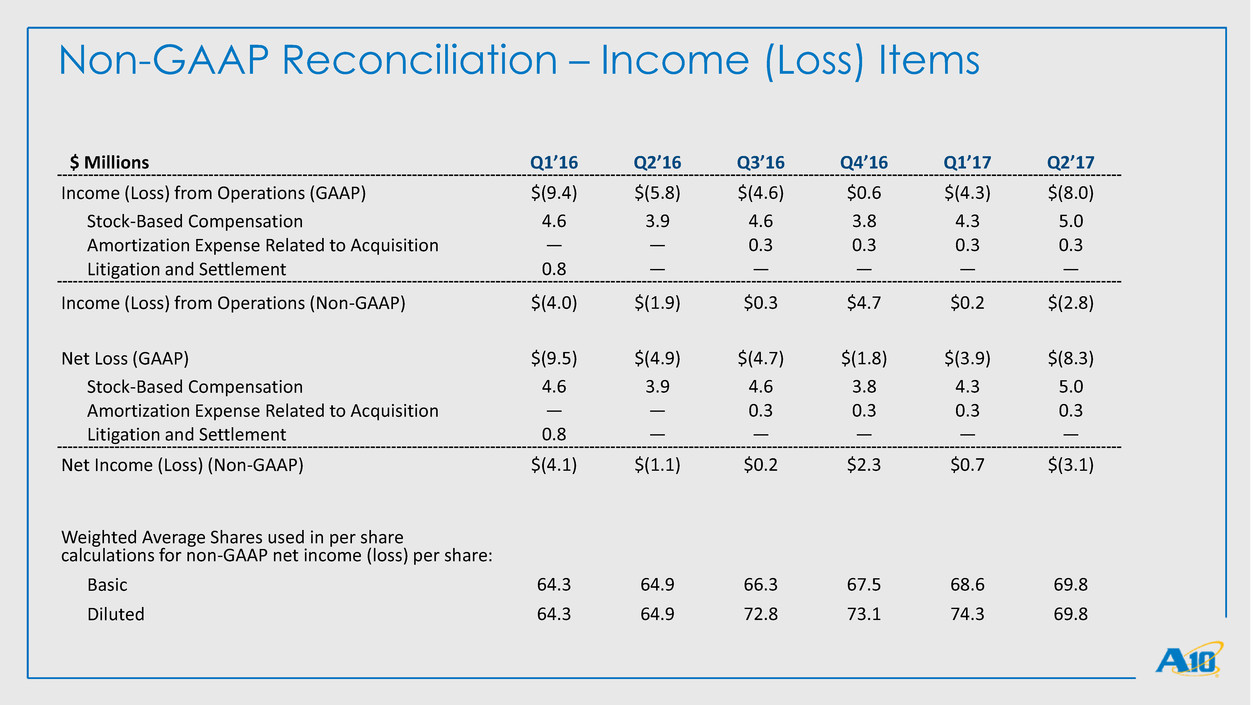
Non-GAAP Reconciliation – Income (Loss) Items $ Millions Q1’16 Q2’16 Q3’16 Q4’16 Q1’17 Q2’17 Income (Loss) from Operations (GAAP) $(9.4) $(5.8) $(4.6) $0.6 $(4.3) $(8.0) Stock-Based Compensation 4.6 3.9 4.6 3.8 4.3 5.0 Amortization Expense Related to Acquisition — — 0.3 0.3 0.3 0.3 Litigation and Settlement 0.8 — — — — — Income (Loss) from Operations (Non-GAAP) $(4.0) $(1.9) $0.3 $4.7 $0.2 $(2.8) Net Loss (GAAP) $(9.5) $(4.9) $(4.7) $(1.8) $(3.9) $(8.3) Stock-Based Compensation 4.6 3.9 4.6 3.8 4.3 5.0 Amortization Expense Related to Acquisition — — 0.3 0.3 0.3 0.3 Litigation and Settlement 0.8 — — — — — Net Income (Loss) (Non-GAAP) $(4.1) $(1.1) $0.2 $2.3 $0.7 $(3.1) Weighted Average Shares used in per share calculations for non-GAAP net income (loss) per share: Basic 64.3 64.9 66.3 67.5 68.6 69.8 Diluted 64.3 64.9 72.8 73.1 74.3 69.8

Thank You www.a10networks.com


