Q3 2023 Financial Results & Commentary November 7, 2023
Cautionary Statements & Disclosures This presentation and the accompanying oral presentation contain “forward-looking” statements that are based on our management’s beliefs and assumptions, including statements regarding our future financial performance, strategy, routes to market, technical differentiation, positioning, capital allocation strategy, expansion opportunities, growth, profitability, market growth, as well as market and technology trends. Forward-looking statements are subject to known and unknown risks and uncertainties and are based on assumptions that may prove to be incorrect, which could cause actual results to differ materially from those expected or implied by the forward-looking statements. Factors that may cause actual results to differ include any unforeseen need for capital which may require us to divert funds we may have otherwise used for the dividend program or stock repurchase program, which may in turn negatively impact our ability to administer the quarterly dividends or the repurchase of our common stock; a significant decline in global macroeconomic or political conditions that have an adverse impact on our business and financial results; business interruptions related to our supply chain; our ability to manage our business and expenses if customers cancel or delay orders; execution risks related to closing key deals and improving our execution; the continued market adoption of our products; our ability to successfully anticipate market needs and opportunities; our timely development of new products and features; our ability to achieve or maintain profitability; any loss or delay of expected purchases by our largest end-customers; our ability to maintain or improve our competitive position; competitive and execution risks related to cloud-based computing trends; our ability to attract and retain new end- customers and our largest end-consumers; our ability to maintain and enhance our brand and reputation; changes demanded by our customers in the deployment and payment model for our products; continued growth in markets relating to network security; the success of any future acquisitions or investments in complementary companies, products, services or technologies; the ability of our sales team to execute well; our ability to shorten our close cycles; the ability of our channel partners to sell our products; variations in product mix or geographic locations of our sales; risks associated with our presence in international markets; weaknesses or deficiencies in our internal control over financial reporting; our ability to timely file periodic reports required to be filed under the Securities Exchange Act of 1934; and other risks that are described in “Risk Factors” in our periodic filings with the Securities and Exchange Commission, including our Form 10-K filed with the Securities and Exchange Commission on February 27, 2023. We do not intend to update or alter our forward-looking statements, whether as a result of new information, future events or otherwise, except as required by applicable law. This presentation and the accompanying oral presentation also include certain non-GAAP financial measures including Non-GAAP gross margin, non-GAAP operating income, non-GAAP net income, non-GAAP operating margin, Adjusted EBITDA and Non-GAAP EPS. Non-GAAP financial measures do not have any standardized meaning and are therefore unlikely to be comparable to similarly titles measures presented by other companies. A10 Networks considers these non-GAAP financial measures to be important because they provide useful measures of the operating performance of the company, exclusive of unusual events or factors that do not directly affect what we consider to be our core operating performance, and are used by the company’s management for that purpose. Non-GAAP financial measures should not be considered in isolation from, or as a substitute for, financial information prepared in accordance with GAAP. We define non-GAAP net income as our GAAP net income excluding: (i) stock-based compensation and related payroll tax, (ii) impairment expense, (iii) cyber incident remediation expense, (iv) workforce reduction expense and (v) income tax effect of excluding non-GAAP items (i) to (iv) listed above. We define non-GAAP net income per basic and diluted share as our non-GAAP net income divided by our basic and diluted weighted-average shares outstanding. We define non-GAAP gross profit as our GAAP gross profit excluding (i) stock-based compensation and related payroll tax, (ii) cyber incident remediation expense and (iii) workforce reduction expense. We define non-GAAP gross margin as our non-GAAP gross profit divided by our GAAP revenue. We define non-GAAP operating income as our GAAP income from operations excluding (i) stock-based compensation and related payroll tax, (ii) impairment expense, (iii) cyber incident remediation expense and (iv) workforce reduction expense. We define non-GAAP operating margin as our non-GAAP operating income divided by our GAAP revenue. We define non-GAAP operating expenses as our GAAP operating expenses excluding (i) stock-based compensation and related payroll tax, (ii) impairment expense, (iii) cyber incident remediation expense and (iv) workforce reduction expense. We define Adjusted EBITDA as our GAAP net income excluding (i) interest and other (income) expense, net, (ii) depreciation and amortization expense, (iii) provision for income taxes, (iv) stock-based compensation and related payroll tax, (v) impairment expense, (vi) workforce reduction expense and (vii) cyber incident remediation expense. We define Adjusted EBITDA margin as our Adjusted EBITDA divided by our GAAP revenue. A reconciliation between GAAP and non-GAAP financial measures can be found in the appendix to this document and in the accompany financial results press release.

Agenda ▪ Q3 and YTD Overview ▪ Q3 Financial Performance ▪ FY 2023 Outlook
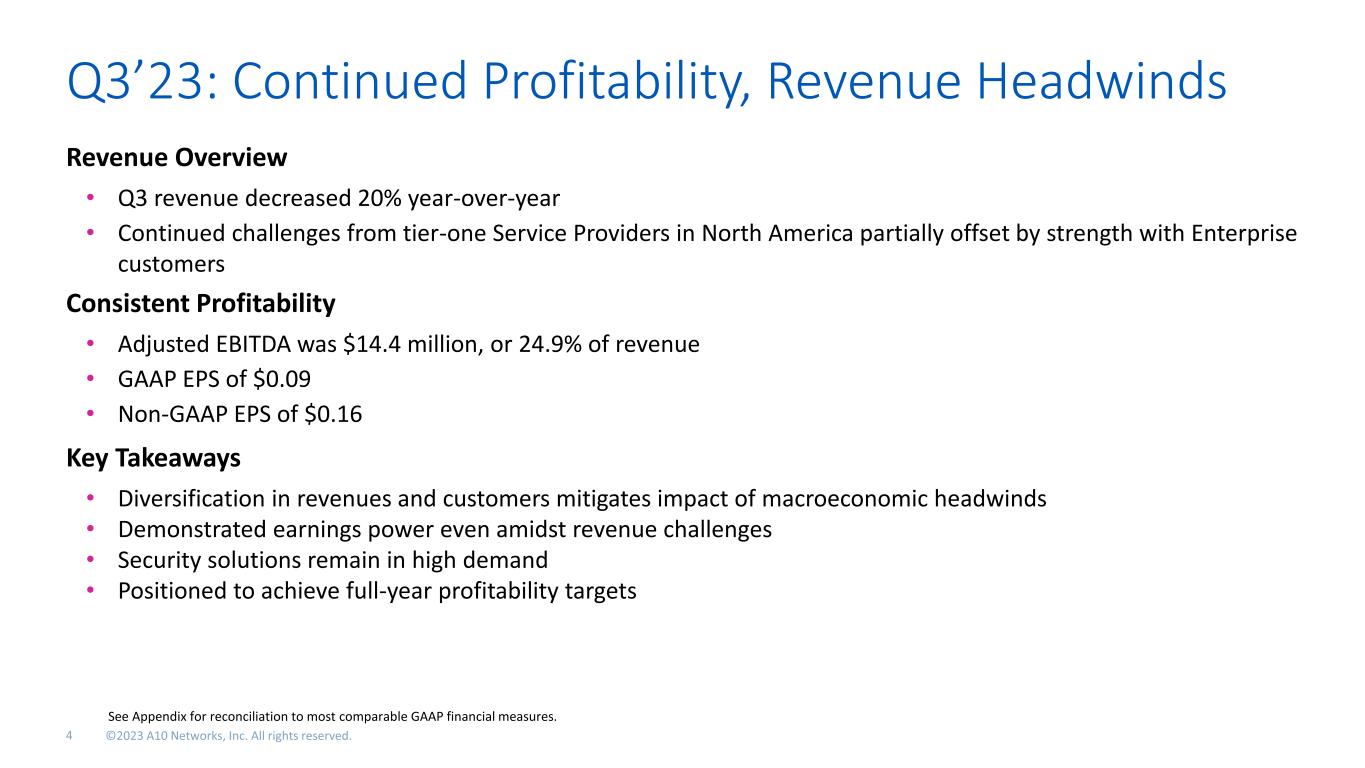
Q3’23: Continued Profitability, Revenue Headwinds Revenue Overview • Q3 revenue decreased 20% year-over-year • Continued challenges from tier-one Service Providers in North America partially offset by strength with Enterprise customers Consistent Profitability • Adjusted EBITDA was $14.4 million, or 24.9% of revenue • GAAP EPS of $0.09 • Non-GAAP EPS of $0.16 Key Takeaways • Diversification in revenues and customers mitigates impact of macroeconomic headwinds • Demonstrated earnings power even amidst revenue challenges • Security solutions remain in high demand • Positioned to achieve full-year profitability targets See Appendix for reconciliation to most comparable GAAP financial measures.
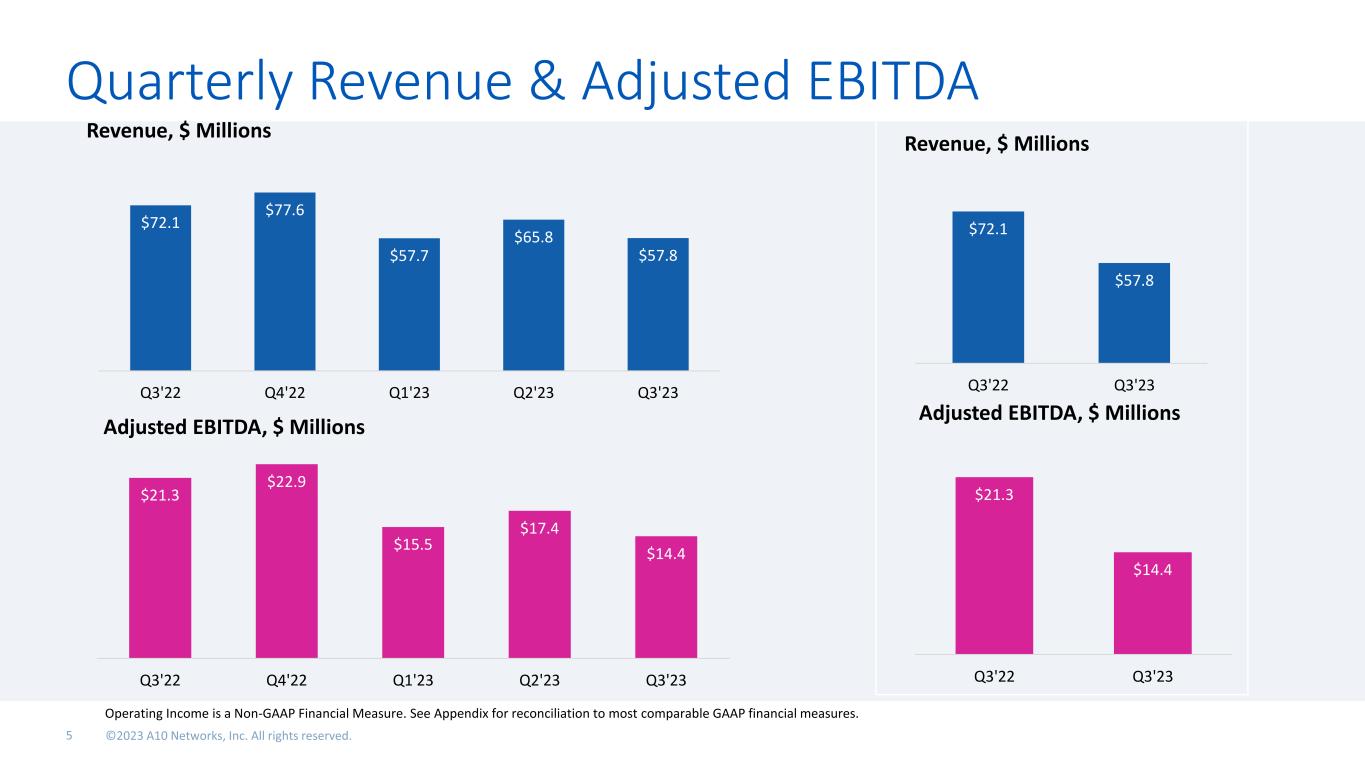
Quarterly Revenue & Adjusted EBITDA Operating Income is a Non-GAAP Financial Measure. See Appendix for reconciliation to most comparable GAAP financial measures. $72.1 $77.6 $57.7 $65.8 $57.8 Q3'22 Q4'22 Q1'23 Q2'23 Q3'23 Revenue, $ Millions $21.3 $22.9 $15.5 $17.4 $14.4 Q3'22 Q4'22 Q1'23 Q2'23 Q3'23 Adjusted EBITDA, $ Millions $72.1 $57.8 Q3'22 Q3'23 Revenue, $ Millions $21.3 $14.4 Q3'22 Q3'23 Adjusted EBITDA, $ Millions
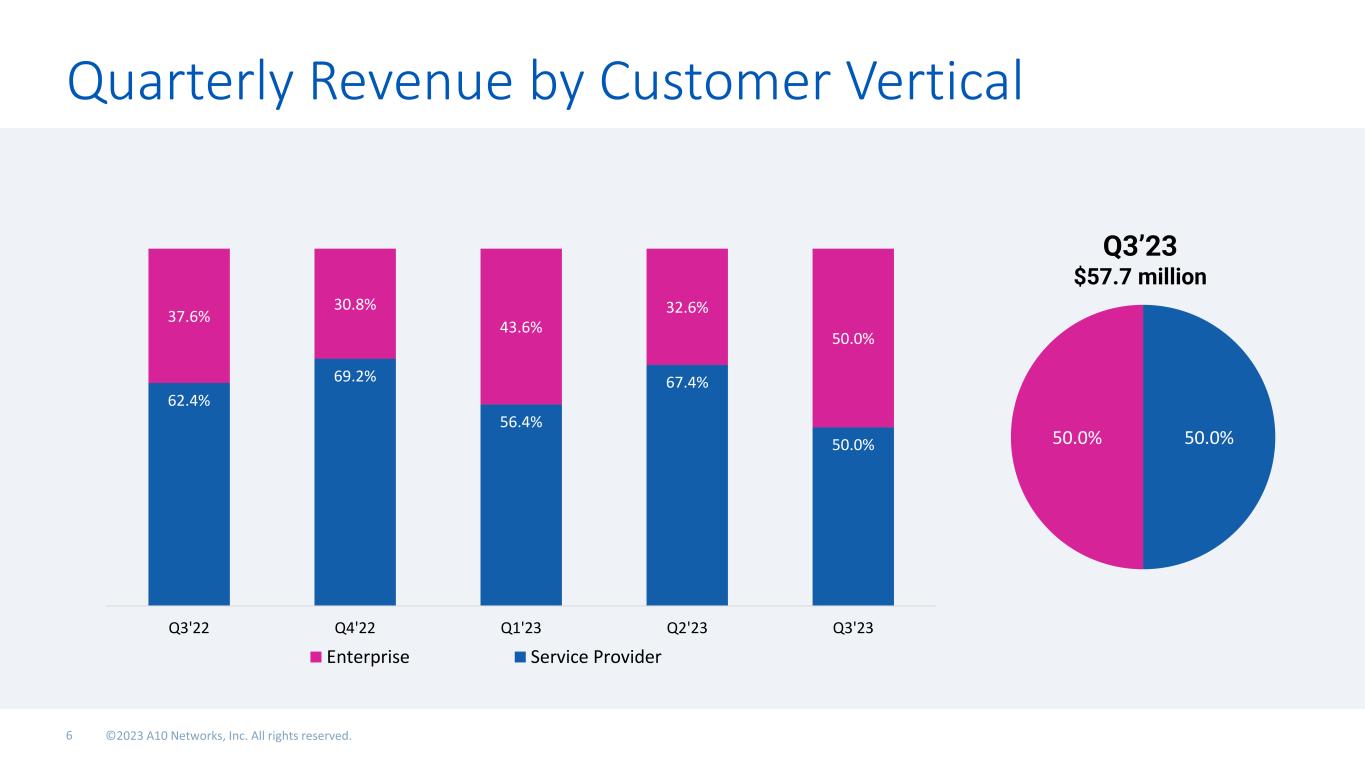
50.0%50.0% Q3’23 $57.7 million Quarterly Revenue by Customer Vertical 62.4% 69.2% 56.4% 67.4% 50.0% 37.6% 30.8% 43.6% 32.6% 50.0% Q3'22 Q4'22 Q1'23 Q2'23 Q3'23 Enterprise Service Provider
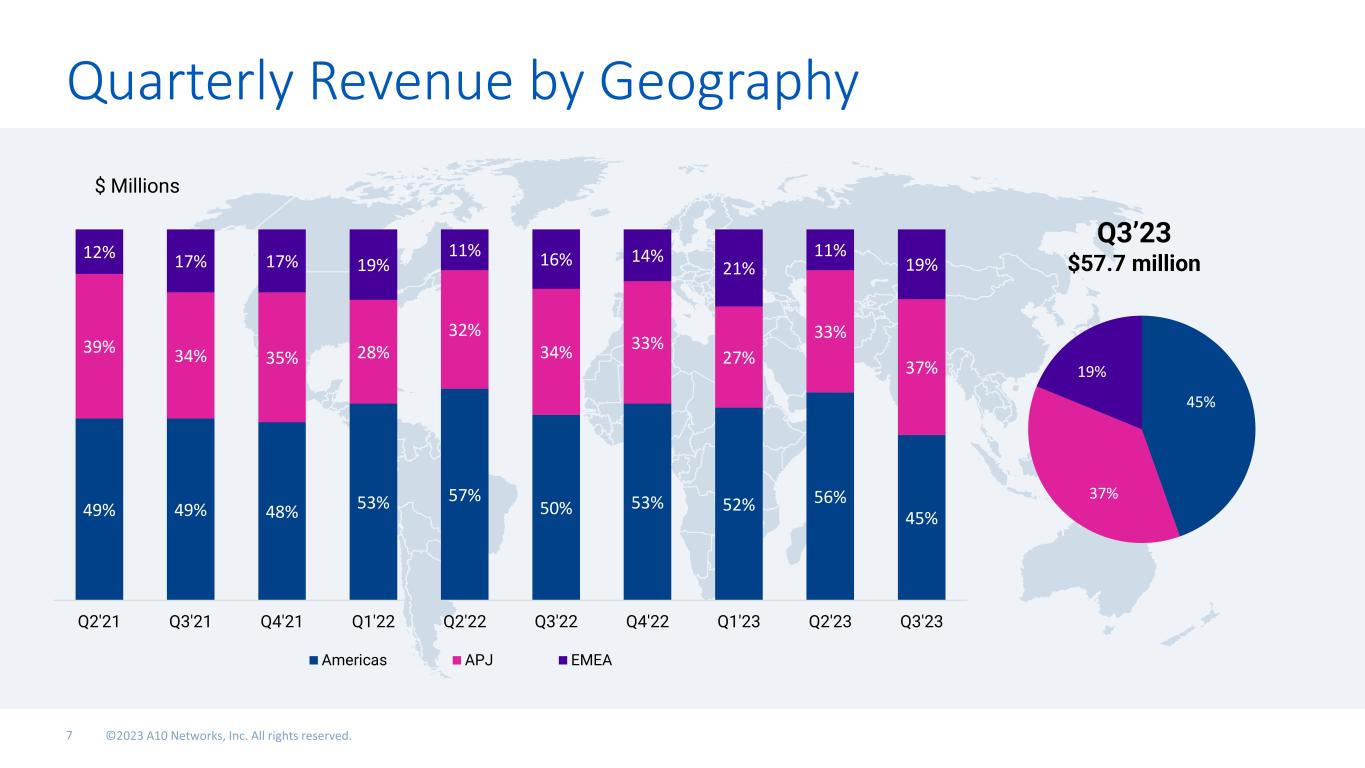
Quarterly Revenue by Geography 49% 49% 48% 53% 57% 50% 53% 52% 56% 45% 39% 34% 35% 28% 32% 34% 33% 27% 33% 37% 12% 17% 17% 19% 11% 16% 14% 21% 11% 19% Q2'21 Q3'21 Q4'21 Q1'22 Q2'22 Q3'22 Q4'22 Q1'23 Q2'23 Q3'23 $ Millions Americas APJ EMEA 45% 37% 19% Q3’23 $57.7 million
Consistent Value Creation Business Model Revenue Growth Capital Allocation

Appendix
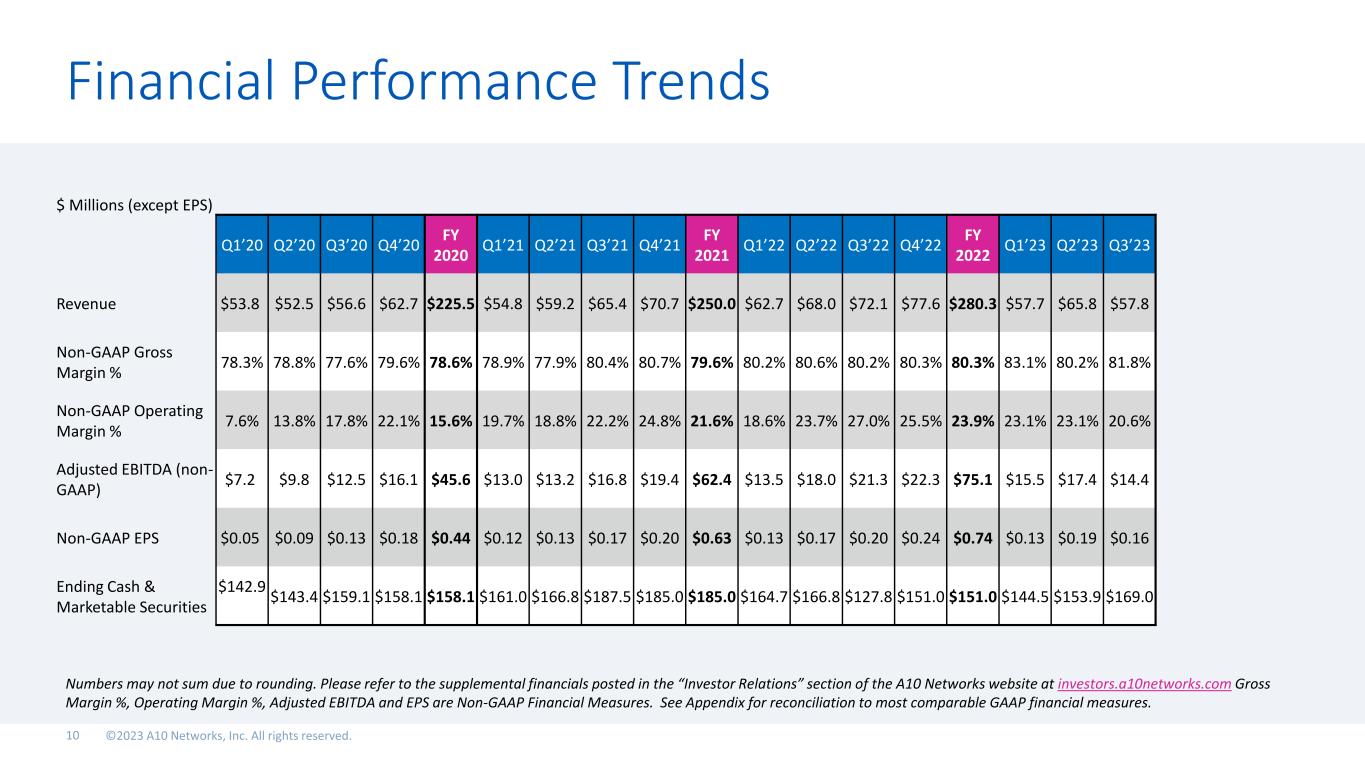
Financial Performance Trends Numbers may not sum due to rounding. Please refer to the supplemental financials posted in the “Investor Relations” section of the A10 Networks website at investors.a10networks.com Gross Margin %, Operating Margin %, Adjusted EBITDA and EPS are Non-GAAP Financial Measures. See Appendix for reconciliation to most comparable GAAP financial measures. $ Millions (except EPS) Q1’20 Q2’20 Q3’20 Q4’20 FY 2020 Q1’21 Q2’21 Q3’21 Q4’21 FY 2021 Q1’22 Q2’22 Q3’22 Q4’22 FY 2022 Q1’23 Q2’23 Q3’23 Revenue $53.8 $52.5 $56.6 $62.7 $225.5 $54.8 $59.2 $65.4 $70.7 $250.0 $62.7 $68.0 $72.1 $77.6 $280.3 $57.7 $65.8 $57.8 Non-GAAP Gross Margin % 78.3% 78.8% 77.6% 79.6% 78.6% 78.9% 77.9% 80.4% 80.7% 79.6% 80.2% 80.6% 80.2% 80.3% 80.3% 83.1% 80.2% 81.8% Non-GAAP Operating Margin % 7.6% 13.8% 17.8% 22.1% 15.6% 19.7% 18.8% 22.2% 24.8% 21.6% 18.6% 23.7% 27.0% 25.5% 23.9% 23.1% 23.1% 20.6% Adjusted EBITDA (non- GAAP) $7.2 $9.8 $12.5 $16.1 $45.6 $13.0 $13.2 $16.8 $19.4 $62.4 $13.5 $18.0 $21.3 $22.3 $75.1 $15.5 $17.4 $14.4 Non-GAAP EPS $0.05 $0.09 $0.13 $0.18 $0.44 $0.12 $0.13 $0.17 $0.20 $0.63 $0.13 $0.17 $0.20 $0.24 $0.74 $0.13 $0.19 $0.16 Ending Cash & Marketable Securities $142.9 $143.4 $159.1 $158.1 $158.1 $161.0 $166.8 $187.5 $185.0 $185.0 $164.7 $166.8 $127.8 $151.0 $151.0 $144.5 $153.9 $169.0

GAAP to Non-GAAP – Gross Margin and EPS Numbers may not sum due to rounding. EPS data is presented on a basic and diluted basis. Please refer to the supplemental financials posted the “Investor Relations” section of the A10 Networks website at investors.a10networks.com. % of Revenue except EPS Q1'22 Q2'22 Q3'22 Q4'22 Q1'23 Q2'23 Q3'23 Gross Margin % - GAAP 79.5% 80.2% 79.5% 79.7% 82.3% 79.5% 80.9% Stock-based compensation 0.7% 0.5% 0.7% 0.5% 0.8% 0.6% 0.9% Gross Margin % - Non-GAAP 80.2% 80.6% 80.2% 80.3% 83.1% 80.2% 81.8% EPS $ - GAAP 0.08$ 0.13$ 0.16$ 0.24$ 0.05$ 0.15$ 0.09$ Stock-based compensation 0.05 0.04 0.05 0.05 0.05 0.05 0.06 Impairment of investment - - - 0.01 - - - Capitalized project impairment - - - - - - 0.04 Workforce reduction severance - - - - 0.03 - 0.03 Cyber incident remediation expense - - - - 0.02 (0.01) - Tax benefit from amended returns - - - (0.06) - - - Income tax effect of non-GAAP items (starting Mar-23) - - - - (0.02) (0.00) (0.06) EPS $ - Non-GAAP 0.13$ 0.17$ 0.20$ 0.24$ 0.13$ 0.19$ 0.16$
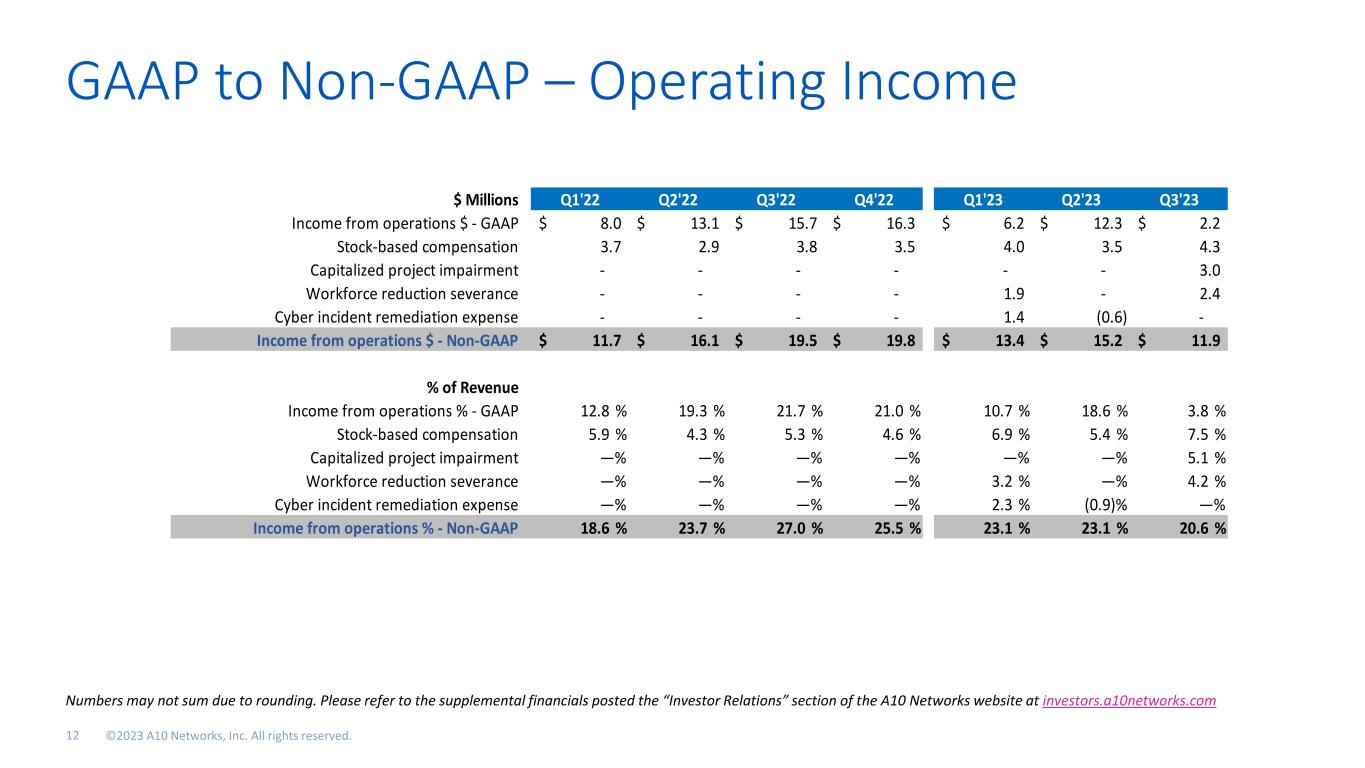
GAAP to Non-GAAP – Operating Income Numbers may not sum due to rounding. Please refer to the supplemental financials posted the “Investor Relations” section of the A10 Networks website at investors.a10networks.com. $ Millions Q1'22 Q2'22 Q3'22 Q4'22 Q1'23 Q2'23 Q3'23 Income from operations $ - GAAP 8.0$ 13.1$ 15.7$ 16.3$ 6.2$ 12.3$ 2.2$ Stock-based compensation 3.7 2.9 3.8 3.5 4.0 3.5 4.3 Capitalized project impairment - - - - - - 3.0 Workforce reduction severance - - - - 1.9 - 2.4 Cyber incident remediation expense - - - - 1.4 (0.6) - Income from operations $ - Non-GAAP 11.7$ 16.1$ 19.5$ 19.8$ 13.4$ 15.2$ 11.9$ % of Revenue Income from operations % - GAAP 12.8 % 19.3 % 21.7 % 21.0 % 10.7 % 18.6 % 3.8 % Stock-based compensation 5.9 % 4.3 % 5.3 % 4.6 % 6.9 % 5.4 % 7.5 % Capitalized project impairment —% —% —% —% —% —% 5.1 % Workforce reduction severance —% —% —% —% 3.2 % —% 4.2 % Cyber incident remediation expense —% —% —% —% 2.3 % (0.9)% —% Income from operations % - Non-GAAP 18.6 % 23.7 % 27.0 % 25.5 % 23.1 % 23.1 % 20.6 %
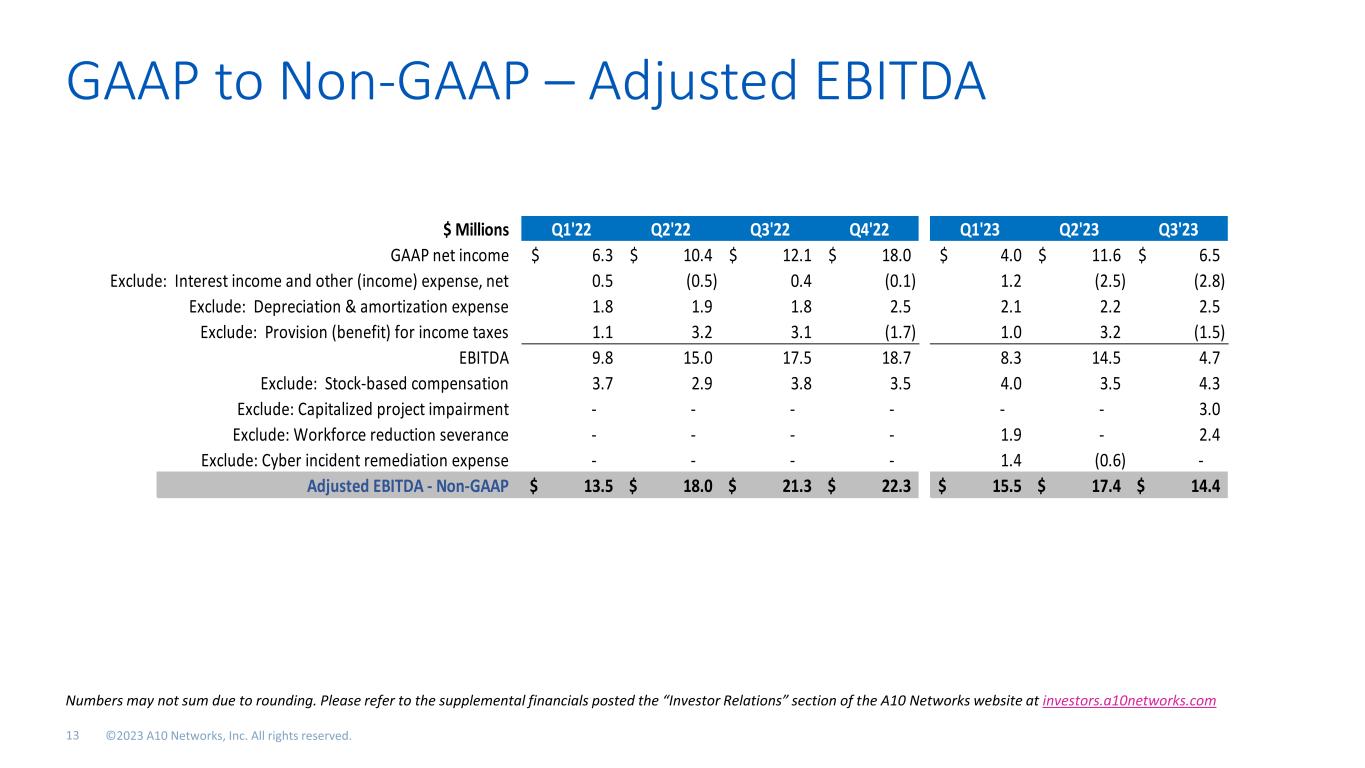
GAAP to Non-GAAP – Adjusted EBITDA Numbers may not sum due to rounding. Please refer to the supplemental financials posted the “Investor Relations” section of the A10 Networks website at investors.a10networks.com. $ Millions Q1'22 Q2'22 Q3'22 Q4'22 Q1'23 Q2'23 Q3'23 GAAP net income 6.3$ 10.4$ 12.1$ 18.0$ 4.0$ 11.6$ 6.5$ Exclude: Interest income and other (income) expense, net 0.5 (0.5) 0.4 (0.1) 1.2 (2.5) (2.8) Exclude: Depreciation & amortization expense 1.8 1.9 1.8 2.5 2.1 2.2 2.5 Exclude: Provision (benefit) for income taxes 1.1 3.2 3.1 (1.7) 1.0 3.2 (1.5) EBITDA 9.8 15.0 17.5 18.7 8.3 14.5 4.7 Exclude: Stock-based compensation 3.7 2.9 3.8 3.5 4.0 3.5 4.3 Exclude: Capitalized project impairment - - - - - - 3.0 Exclude: Workforce reduction severance - - - - 1.9 - 2.4 Exclude: Cyber incident remediation expense - - - - 1.4 (0.6) - Adjusted EBITDA - Non-GAAP 13.5$ 18.0$ 21.3$ 22.3$ 15.5$ 17.4$ 14.4$